
Corrosion risk and building work shape Australian demand
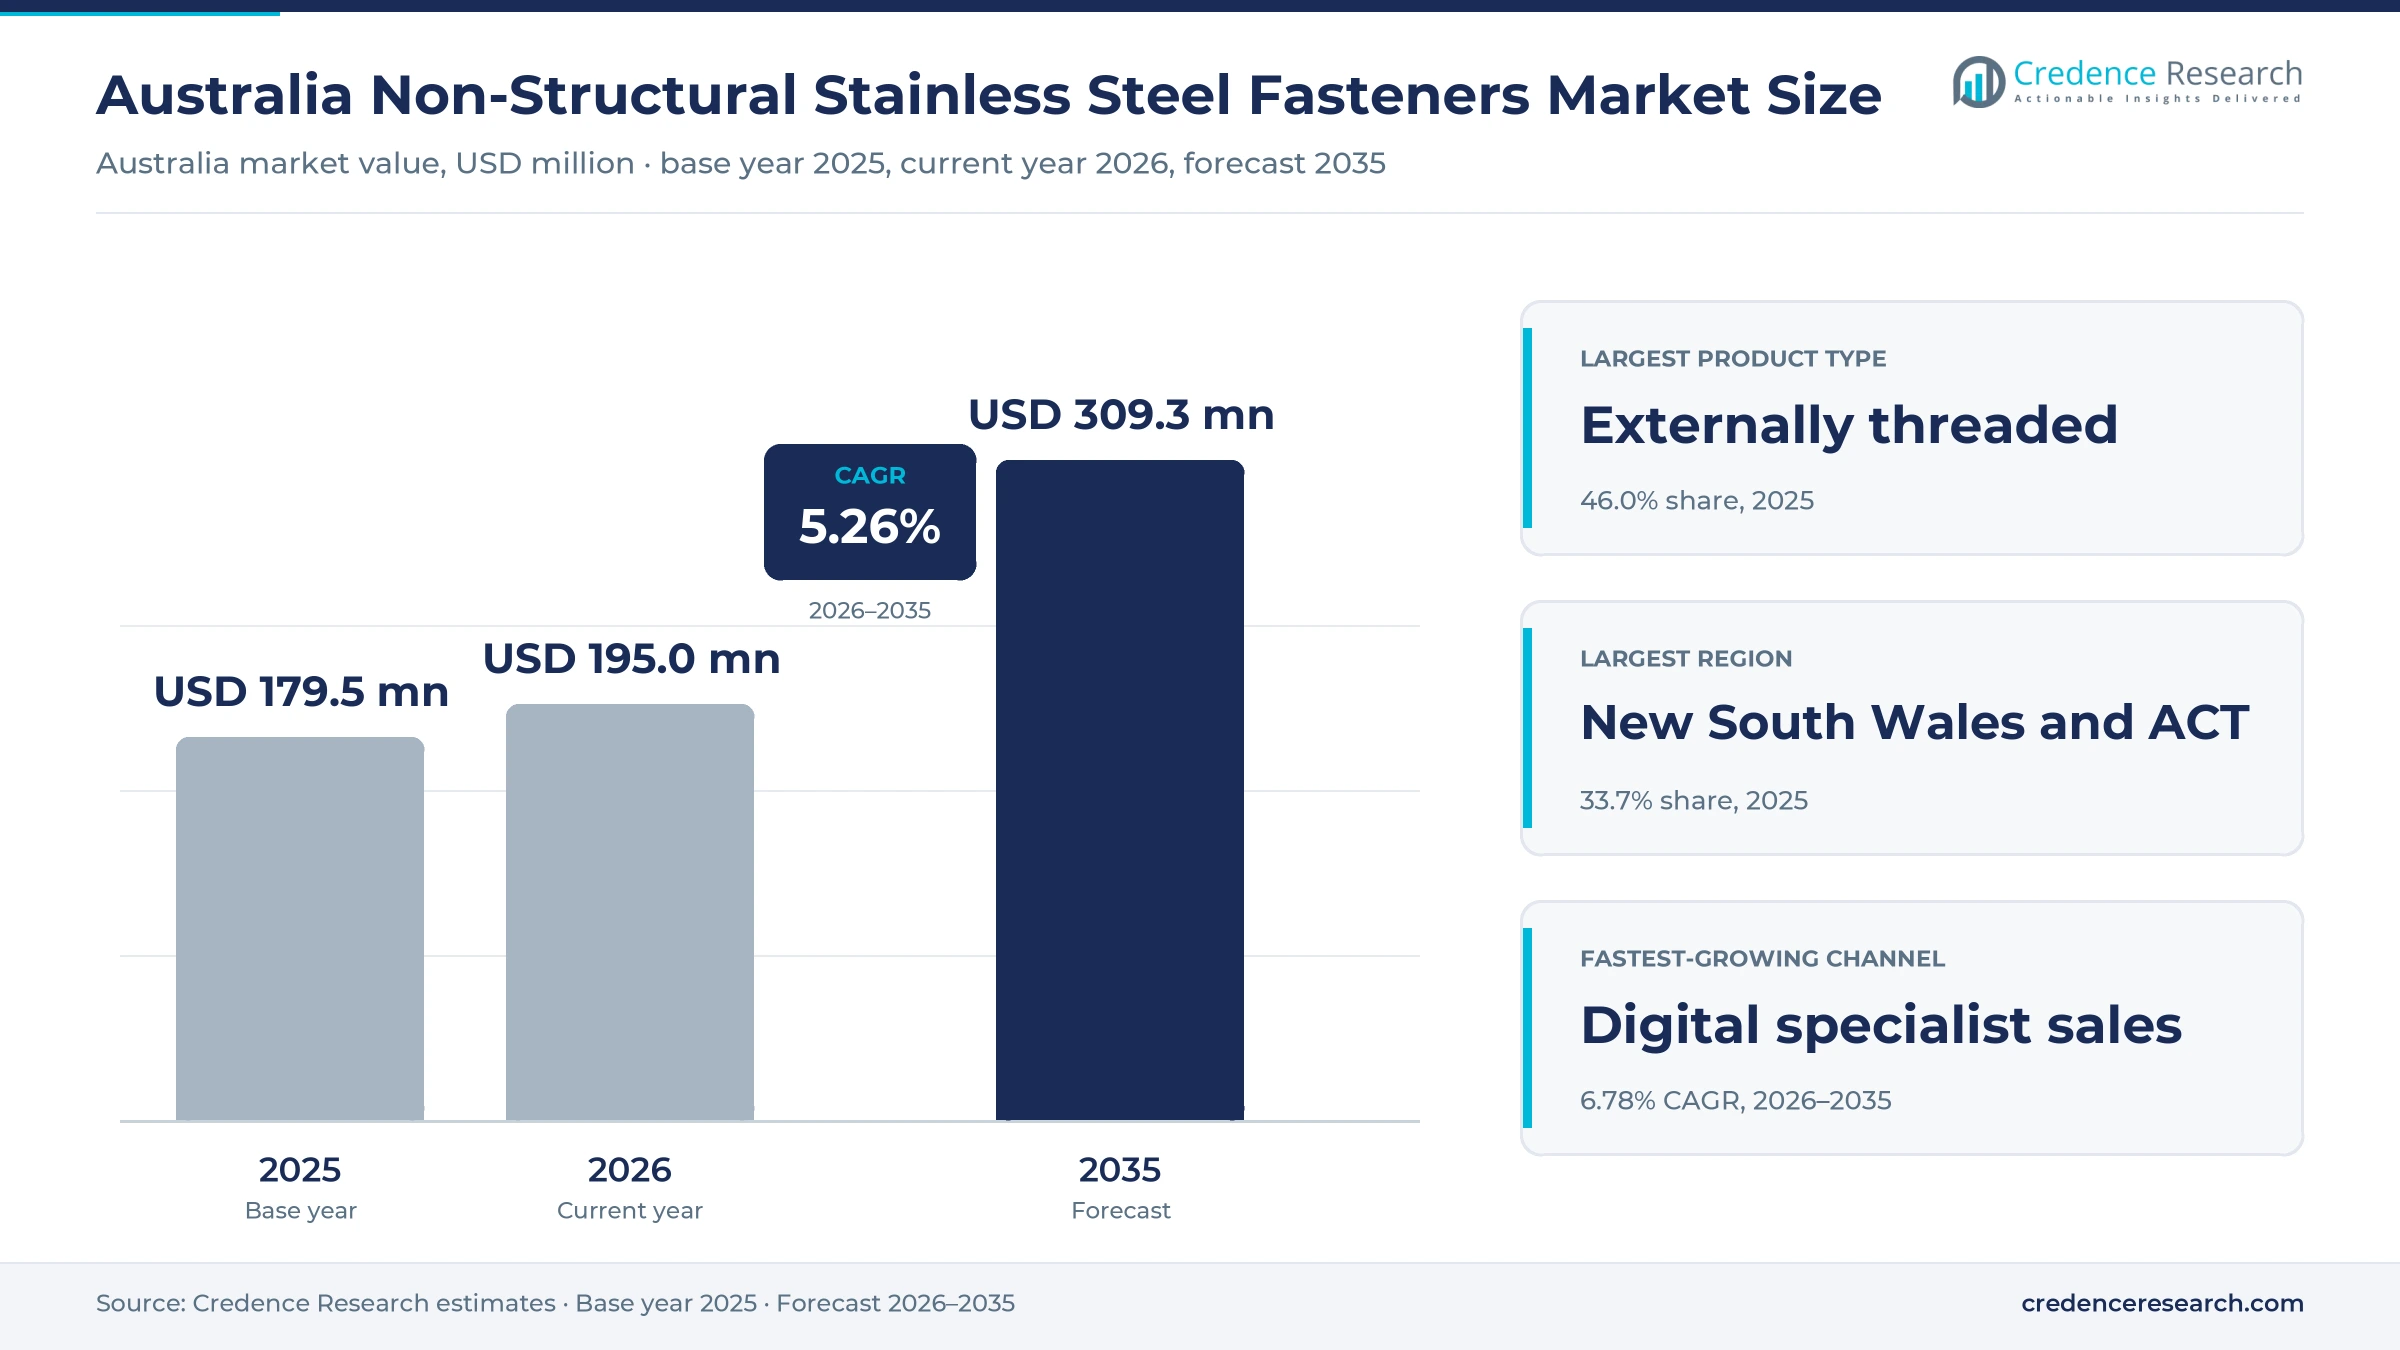
The Australia non-structural stainless steel fasteners market was valued at USD 179.5 million in 2025 and is projected to increase from USD 195.0 million in 2026 to USD 309.3 million by 2035, registering a CAGR of 5.26% during 2026–2035. Demand comes from builders, marine operators, food processors and maintenance teams that need bolts, screws, nuts, washers and anchors that resist corrosion in coastal air, salt water and washdown areas. New South Wales and the Australian Capital Territory held the largest regional share, 33.7% in 2025, because Sydney concentrates building work, marinas and fastener distributors. Queensland is the fastest-growing region at 5.65% a year, as coastal councils require marine-grade fixings on exposed sites. Most product is imported and sold through specialist stockists that hold wide ranges of grade 316 and grade 304 items. A national public infrastructure pipeline that grew to $242 billion over five years in 2025 also widens demand for fixings used in railings, signage, cable supports and services.
Which corrosion-resistant fixings does the estimate cover?
The estimate measures the value of stainless steel bolts, screws, nuts, washers, rivets, pins, threaded rod, anchors and fixing assemblies used in non-load-bearing roles in Australia. It covers products sold to fabricators, equipment makers, maintenance buyers, installation contractors and household buyers. Values are stated at distributor selling prices and include imported stock sold through local specialist stockists, trade suppliers and online stores.
The estimate excludes high-strength structural bolting sets designed to carry primary building loads, carbon steel and galvanized fasteners, and fasteners built into imported machinery. The value chain runs from overseas and local makers through importers, testing laboratories and stockholding distributors to fabricators, contractors and maintenance teams across construction, marine, food processing, resources and utilities.
Australia Non-Structural Stainless Steel Fasteners Market Insights
- The Australia non-structural stainless steel fasteners market was valued at USD 179.5 million in 2025 and is projected to reach USD 309.3 million by 2035, registering a CAGR of 5.26% during 2026–2035.
- New South Wales and the Australian Capital Territory held a 33.7% share of 2025 value, because Sydney concentrates building, marine and distributor activity.
- Externally threaded fasteners led with a 46.0% share of 2025 value, because bolts, screws and threaded rod are used in almost every fixing job.
- The national five-year public infrastructure pipeline reached $242 billion in November 2025, up $29 billion over the year, which widens demand for fixings.
- Australia had more than 950,000 registered boats in 2026, which sustains replacement demand for marine-grade bolts, screws and fittings.
Threaded fasteners lead while fixing assemblies grow fastest
Why do externally threaded fasteners lead product demand?
Based on product type, the market is categorized into externally threaded fasteners, internally threaded fasteners, non-threaded fasteners and specialty fixing assemblies. Externally Threaded Fasteners led with a 46.0% share of 2025 value, because bolts, screws and threaded rod appear in almost every fixing job. Specialty Fixing Assemblies grow fastest at 6.33% a year, as contractors buy anchor kits and cast-in channels that save installation time.
How does grade 316 dominate exposed applications?
Based on grade, the market is categorized into grade 316 and A4, grade 304 and A2, and specialty stainless grades. Grade 316 and A4 led with a 52.0% share of 2025 value, because coastal sites, boats and washdown areas need the extra corrosion resistance of molybdenum-bearing steel. Specialty Stainless Grades grow fastest at 6.38% a year, as operators of chemical, desalination and offshore assets specify duplex and higher-alloy fixings.
Why are marine and coastal users growing fastest?
Based on end-use industry, the market is categorized into building and architectural works, marine and coastal operations, processing and resource operations, and utilities and distributed end uses. Building and Architectural Works led with a 38.0% share of 2025 value, because balustrades, facades and roofing use large volumes of screws and anchors. Marine and Coastal Operations grow fastest at 5.71% a year, as boat owners and port operators replace corroded fittings more often.
How do specialist stockists and online sellers reach buyers?
Based on sales channel, the market is categorized into specialist distribution, broadline trade supply and digital specialist sales. Specialist Distribution led with a 55.0% share of 2025 value, because buyers rely on stockists that hold thousands of grades and sizes. Digital Specialist Sales grow fastest at 6.78% a year, as maintenance buyers and small fabricators order packs online with next-day delivery.
| Segment Group | Leading Sub-segment | Share, 2025 | Fastest-growing Sub-segment | CAGR, 2026–2035 |
|---|---|---|---|---|
| By Product Type | Externally Threaded Fasteners | 46.0% | Specialty Fixing Assemblies | 6.33% |
| By Grade | Grade 316 and A4 | 52.0% | Specialty Stainless Grades | 6.38% |
| By End-Use Industry | Building and Architectural Works | 38.0% | Marine and Coastal Operations | 5.71% |
| By Sales Channel | Specialist Distribution | 55.0% | Digital Specialist Sales | 6.78% |
Request a Free Sample
Fill in your details and we'll send you a free sample report.
- Sample data tables & charts
- Research methodology
Infrastructure, boating and food plants lift fixing demand
How does infrastructure delivery lift ancillary fixing demand?
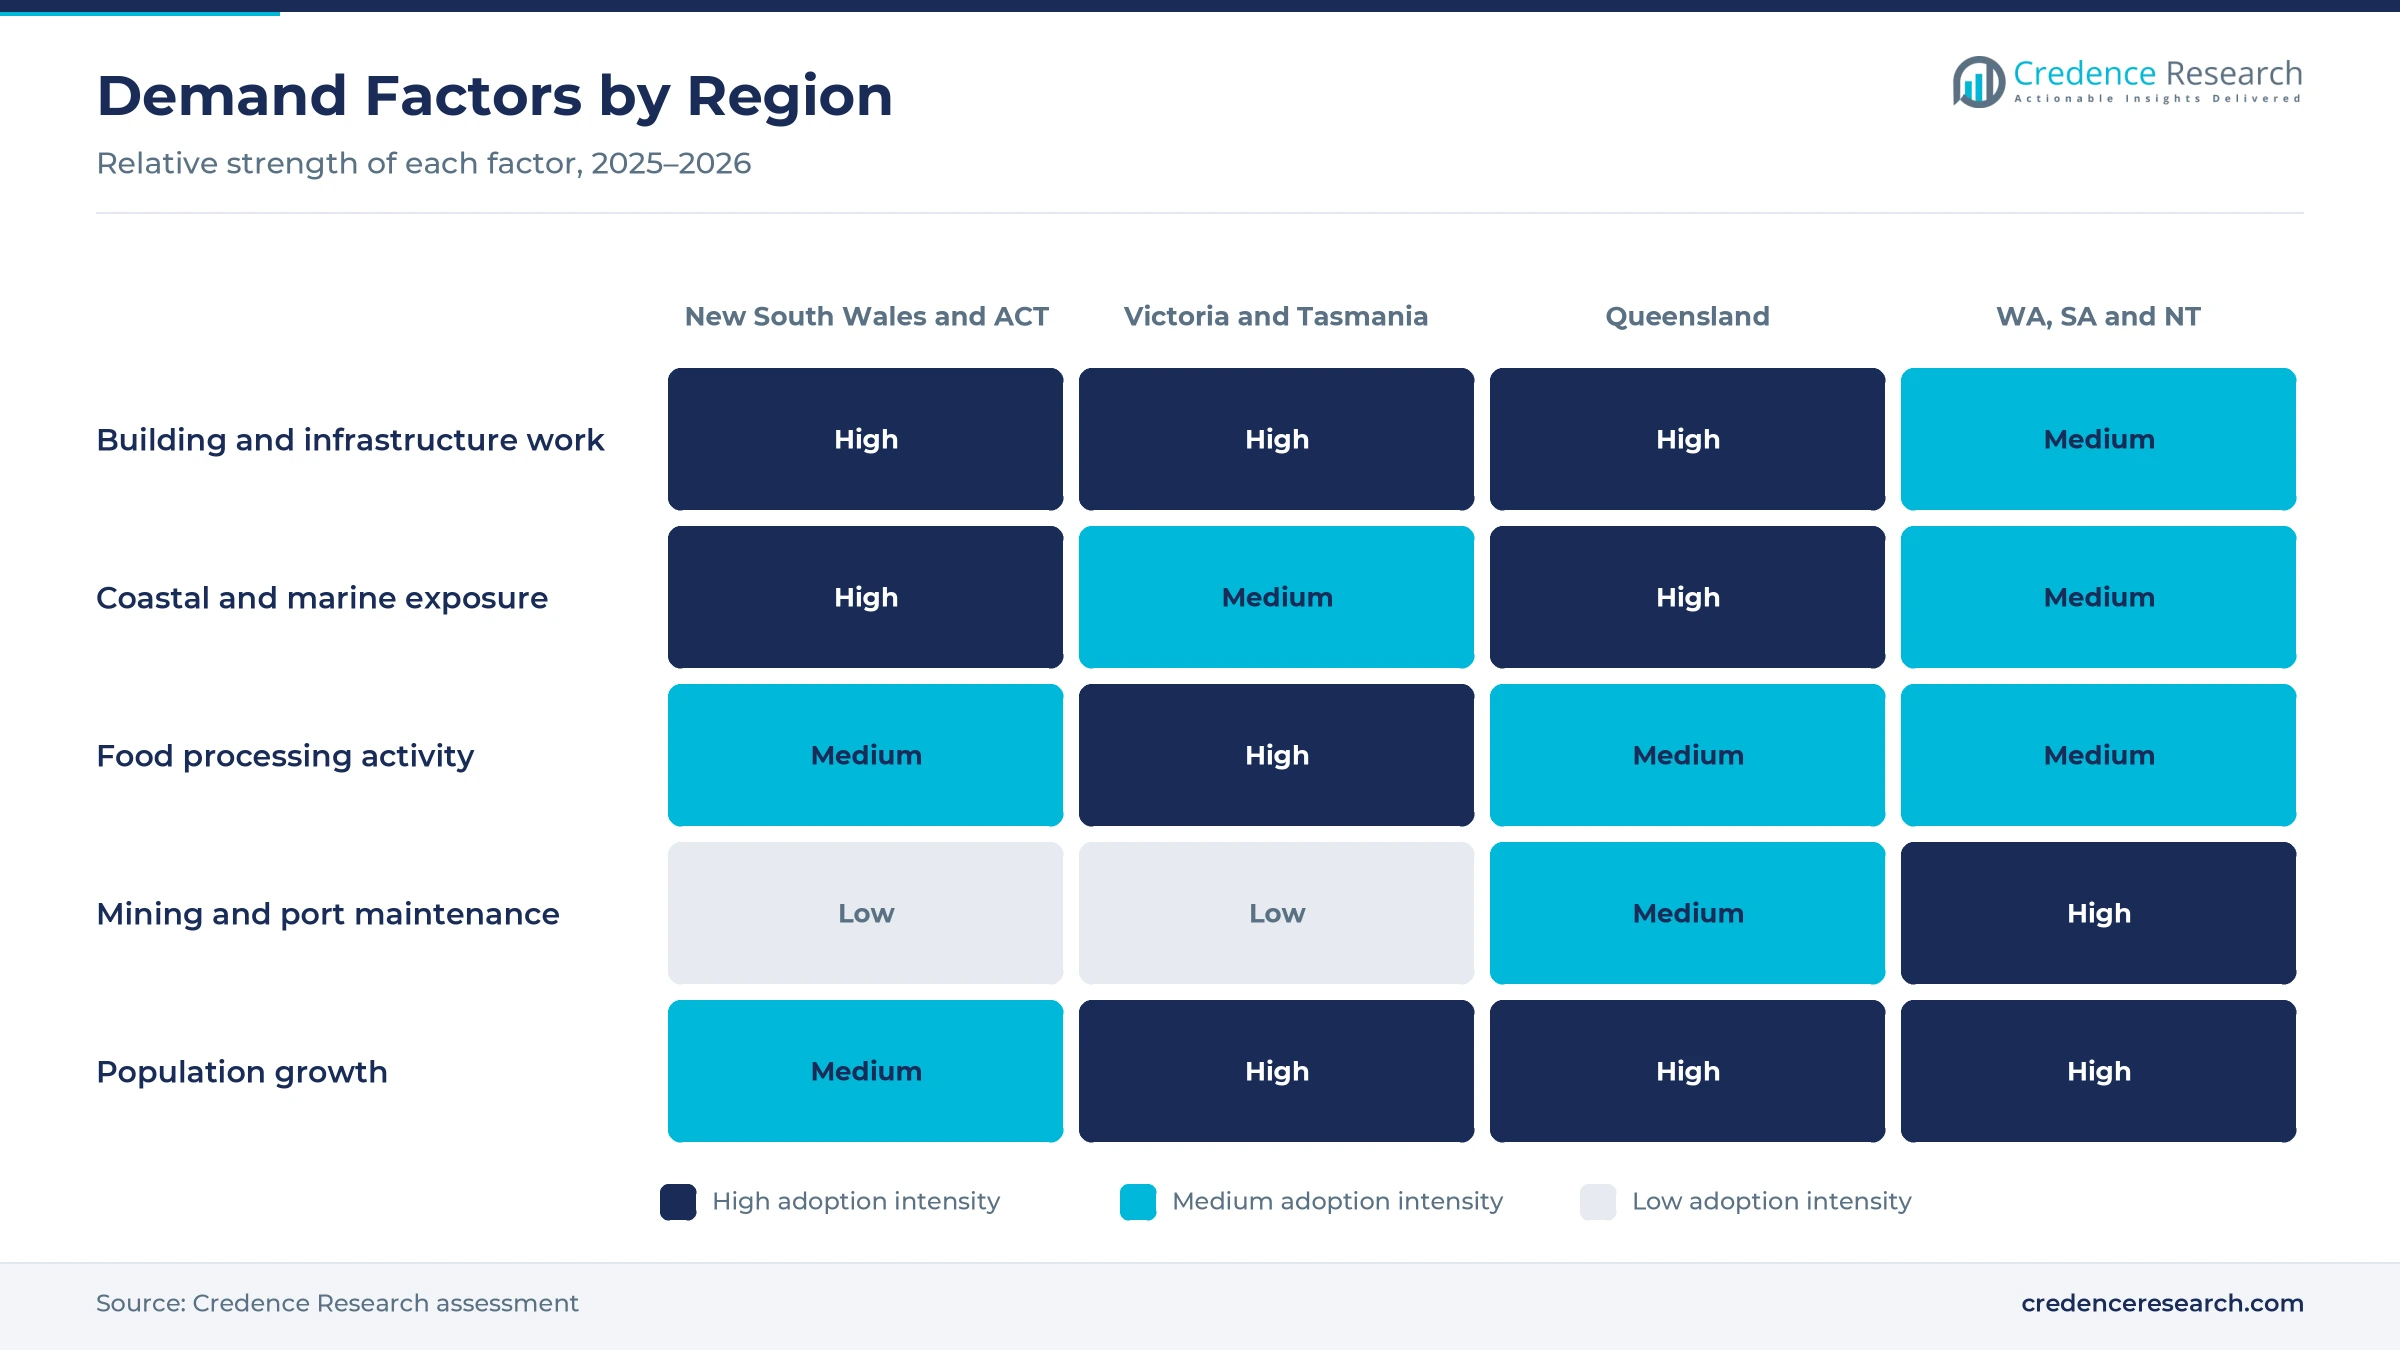
Infrastructure delivery and ancillary installations lift demand, because every road, rail, energy and housing project needs corrosion-resistant fixings for railings, signage, cable trays and services. Infrastructure Australia announced in November 2025 that the five-year major public infrastructure pipeline grew $29 billion to $242 billion. Transport accounts for $129 billion of that pipeline, while building projects including social housing rose $6 billion to $77 billion. Energy utilities such as transmission more than doubled to $36 billion over the next five years. Governments also introduced a National Housing Accord target of 1.2 million new homes over five years starting July 1, 2024. As a result, building and architectural works hold a 38.0% share of 2025 value.
Why do marine replacement and vessel fit-out raise demand?
Marine replacement and vessel fit-out raise demand, because salt water corrodes ordinary fixings quickly and boat owners must replace bolts, screws and fittings during regular maintenance. Australia has more than 950,000 registered boats and more than 2.5 million boat licence holders, according to Marine Industry News. The boating industry also recorded A$10.5 billion in turnover in 2025-26, matching its previous record year. Austain Fasteners lists marine fittings alongside bolts, screws and rivets, while Stainless Fastener Supplies serves shipbuilding and marine customers. In turn, marine and coastal operations grow at 5.71% a year, the fastest end-use rate, as demand from recreational boats and port operators keeps rising.
How do food processing and hygienic upkeep support sales?
Food processing and hygienic maintenance support sales, because washdown areas, chillers and conveyors need fixings that resist cleaning chemicals and do not contaminate food. Food and grocery manufacturing employment grew 4.4% to 294,212, according to the August 2025 industry report from the Australian Food and Grocery Council. Sector turnover rose 5.3% to $173 billion, while exports increased 5.2% over the same period. About 36% of those jobs are in regional communities, which spreads maintenance demand beyond capital cities. As a result, processing and resource operations hold a steady share of 2025 value, as plants refit food processing equipment with grade 316 bolts, nuts and washers.
Why does population growth expand building and repair work?
Population growth expands building and repair work, because more residents need homes, schools, transport and services that use corrosion-resistant fixings. Australia's population reached 27.92 million at March 31, 2026, growing 1.4% over the year, according to the Australian Bureau of Statistics. Western Australia grew fastest at 2.1%, while Victoria and Queensland each grew 1.6%, which widens demand in Perth, Melbourne and Brisbane. Manufacturing value added also held at about 5.3% of gross domestic product in 2025, according to World Bank data, which keeps local fabrication demand steady. In turn, Queensland records the fastest regional growth in the forecast, as coastal housing expands.
Marine grades and online ordering reshape how fixings sell
How is the shift to marine grades changing specifications?
The shift to marine grades is changing specifications, because councils and designers now separate coastal and inland sites when they choose fixings. A Sunshine Coast Council guide requires true 316 marine-grade stainless steel on coastal sites east of the Bruce Highway, according to its infrastructure manual. The same guide accepts 304 grade fixings for hinterland sites west of the highway. Anzor maintenance guidance also lists grade 304 as not recommended for seafront sites or coastal sites within 5 kilometers of the sea. As a result, grade 316 and A4 hold a 52.0% share of 2025 value, while grade 304 is increasingly limited to inland and indoor uses.
Why is the rise of online specialist ordering gaining ground?
The rise of online specialist ordering is gaining ground, because maintenance buyers and small fabricators want quick access to exact grades and sizes without visiting a branch. Anzor runs a dedicated stainless website with marine ranges, special stainless grades and branch pickup. Allfasteners, which has served trades across Australia since 1994, sells stainless screws, rivets and rod through its online store. United Fasteners Australia also serves trade buyers through 15 branches nationwide. Stainless Fastener Supplies lists more than 8,000 products and delivers from warehouses in Western Australia and Queensland to all areas of Australia. As a result, digital specialist sales grow at 6.78% a year, the fastest channel rate, as stockists add live inventory and online certificates.
Can energy transmission and renewables open new fixing demand?
Energy transmission and renewable projects open new demand, because solar farms, substations and transmission lines use many corrosion-resistant fixings for cable supports, enclosures and earthing. Renewable energy projects such as transmission, solar, wind and pumped hydro total $163 billion over five years in the national pipeline. Energy utility spending more than doubled to $36 billion in the 2025 report, which adds new installation work outside cities. However, the industry is 141,000 workers short of what the pipeline needs, which favors fixings that save installation time. In turn, utilities and distributed end uses grow faster than building works, as contractors order pre-assembled fixing kits and stainless anchors.
Is there room for suppliers of cast-in and anchor systems?
Cast-in and anchor systems create room for suppliers, because contractors want fixings that install quickly and resist corrosion for the life of a building. Allfasteners sells 316 grade cast-in anchor channels, including toothed versions, alongside its anchoring systems and construction fasteners. Macsim lists anchors and fixings in both 304 and 316 stainless steel for trade and retail buyers. Austain also produces non-standard fasteners in stainless steel and exotic alloys through quality-assured partners in Australia and overseas. As a result, specialty fixing assemblies grow at 6.33% a year, the fastest product rate, as builders replace site-drilled fixings with engineered fixing systems on facades and services.
Import reliance, price swings and fakes test suppliers
How does import reliance expose buyers to supply risk?
Import reliance exposes buyers to supply risk, because most stainless fasteners sold in Australia are made in Asia and Europe. Long shipping times force stockists to order months ahead and hold large inventories of many grades. As a result, a delayed container can leave contractors waiting for common sizes. Distributors respond by spreading orders across several makers, holding safety stock in each state and using local partners to machine urgent non-standard parts.
Why do nickel and molybdenum prices squeeze margins?
Nickel and molybdenum price swings squeeze margins, because grade 316 and grade 304 prices follow alloy surcharges set by steel mills. Stockists that bought at high prices must sell at lower prices when surcharges fall. In turn, fixed-price contracts with builders and councils can turn unprofitable. Suppliers respond with shorter quote validity, price review clauses and faster stock turnover, which reduces the value tied up in slow-moving sizes.
How do mislabeled grades and counterfeit parts hurt trust?
Mislabeled grades and counterfeit parts hurt trust, because a fastener sold as grade 316 that is actually grade 304 can rust within months near the coast. Buyers often cannot tell the two grades apart without laboratory testing. As a result, failures damage the reputation of stockists and installers alike. Suppliers respond with mill certificates, batch tracing and in-house testing, and Hobson Engineering opened an accredited testing facility in 2010 at Eastern Creek.
Why does galvanized and coated steel limit substitution?
Galvanized and coated carbon steel limits substitution, because it costs far less and suits many inland and indoor jobs. Builders under budget pressure often choose coated fixings unless rules require stainless. In turn, stainless suppliers lose volume in housing frames and general building construction. Stockists respond by explaining whole-of-life costs, targeting coastal and washdown sites and offering mixed ranges that pair coated and stainless products.
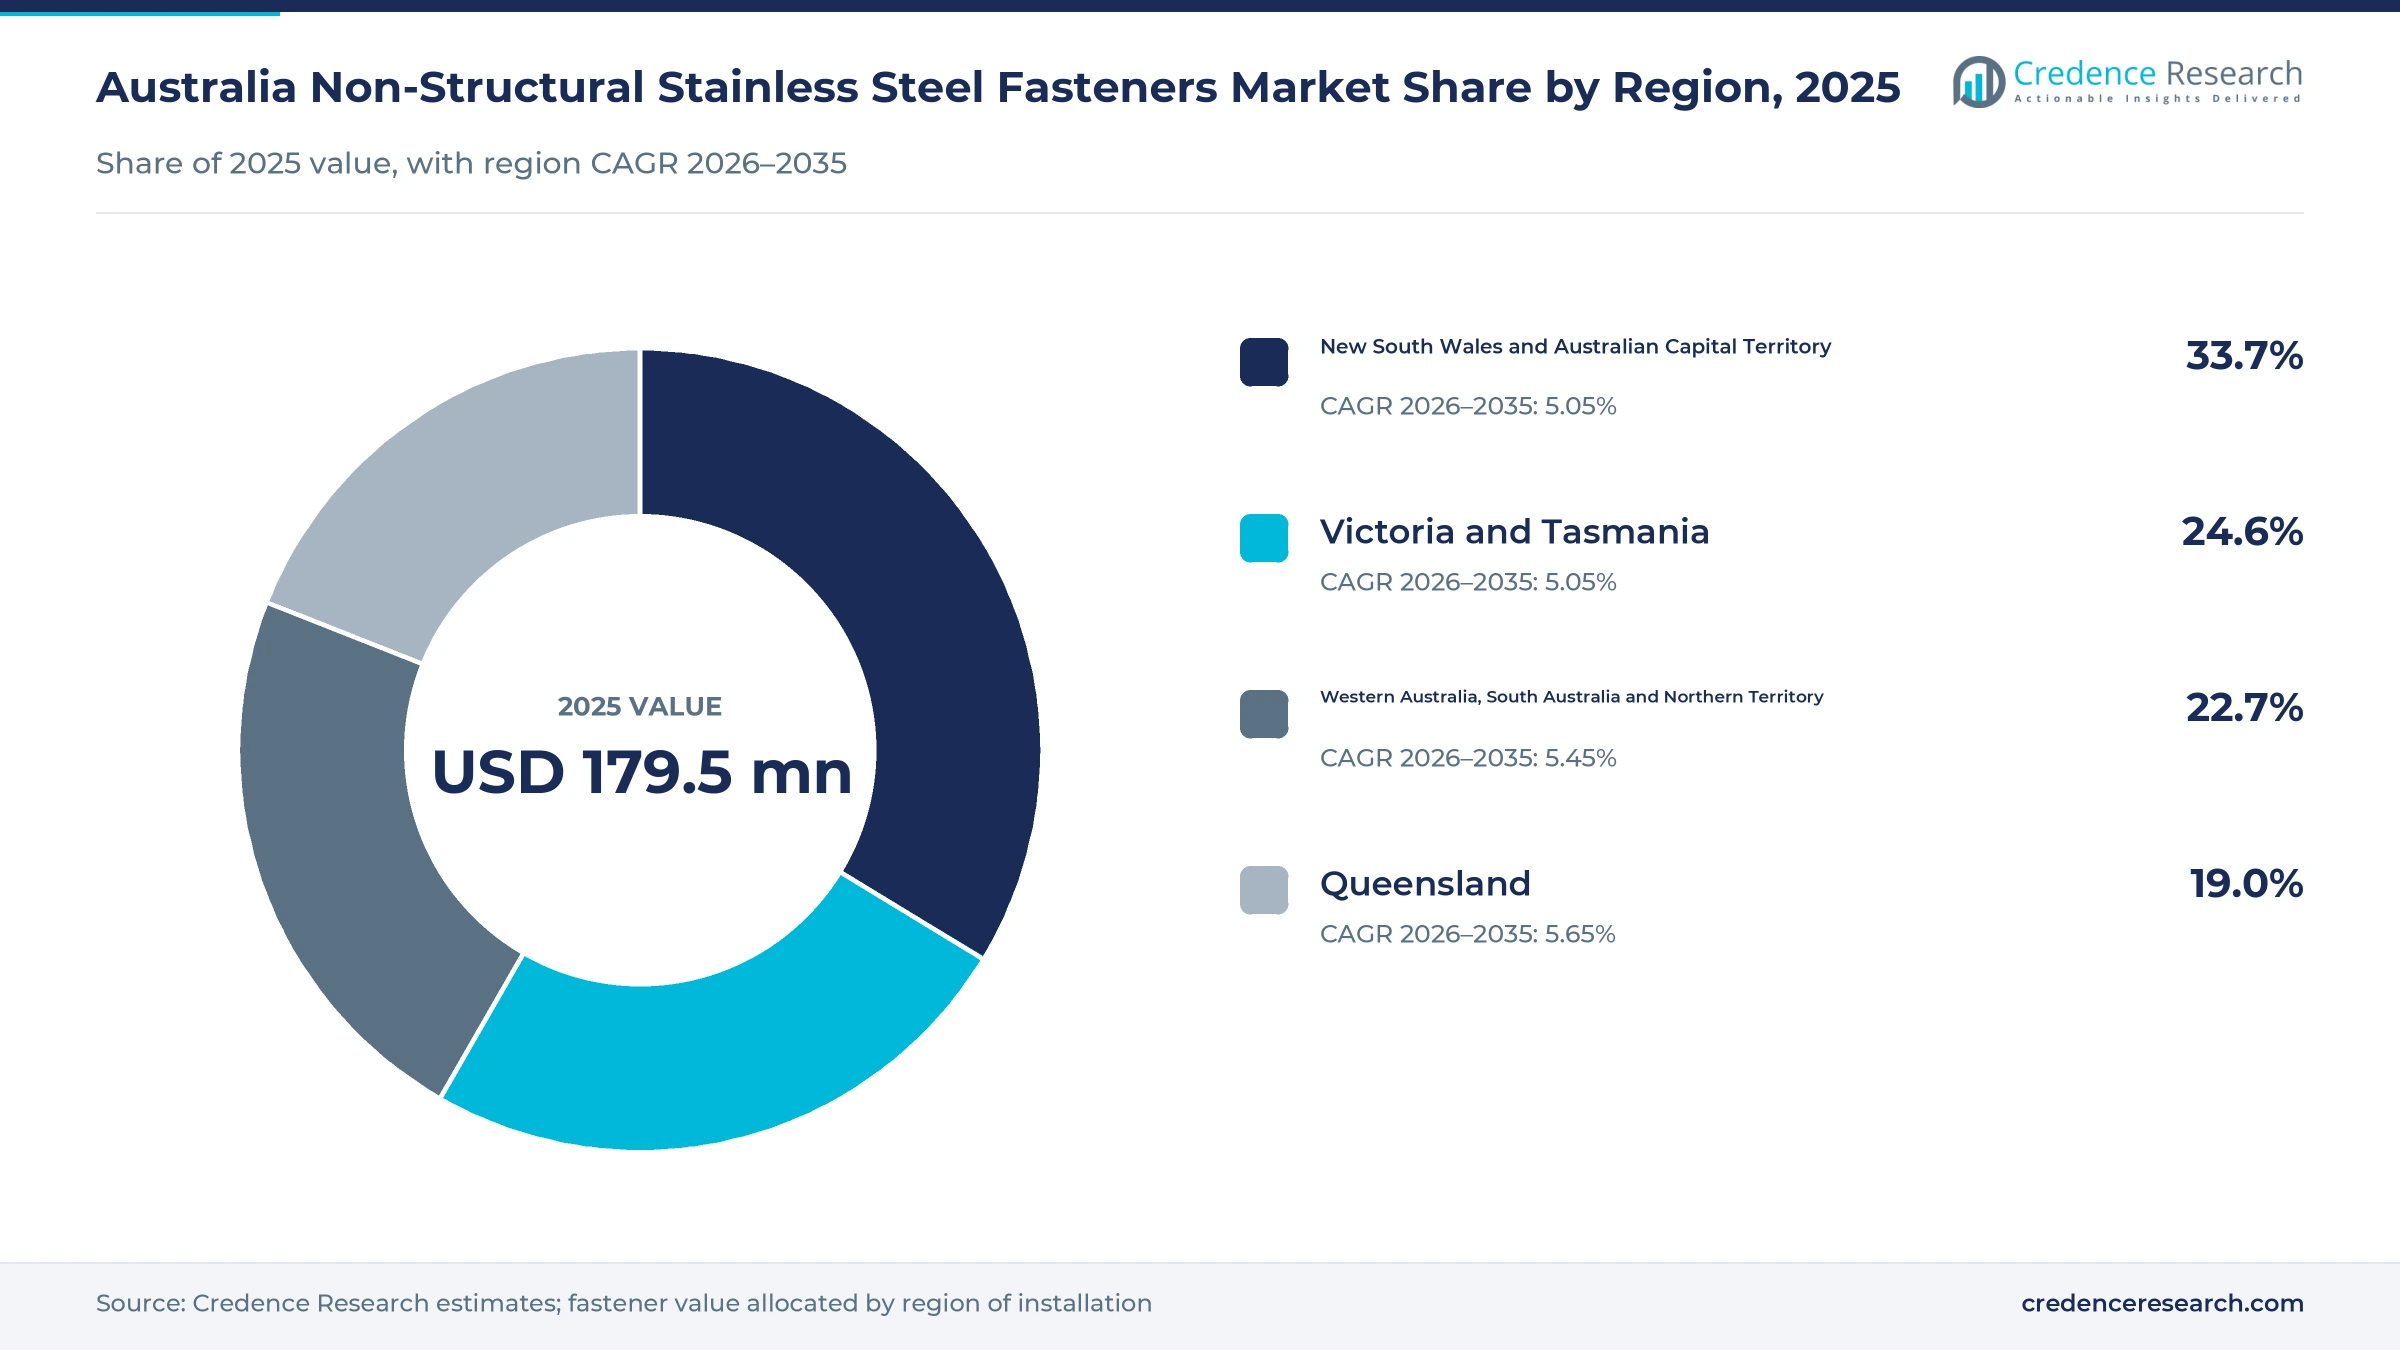
New South Wales leads while Queensland grows fastest
| Region | Value, 2025 (USD million) | Share, 2025 | CAGR, 2026–2035 |
|---|---|---|---|
| New South Wales and Australian Capital Territory | 60.5 | 33.7% | 5.05% |
| Victoria and Tasmania | 44.2 | 24.6% | 5.05% |
| Western Australia, South Australia and Northern Territory | 40.7 | 22.7% | 5.45% |
| Queensland | 34.1 | 19.0% | 5.65% |
Why does new South Wales hold the largest share?
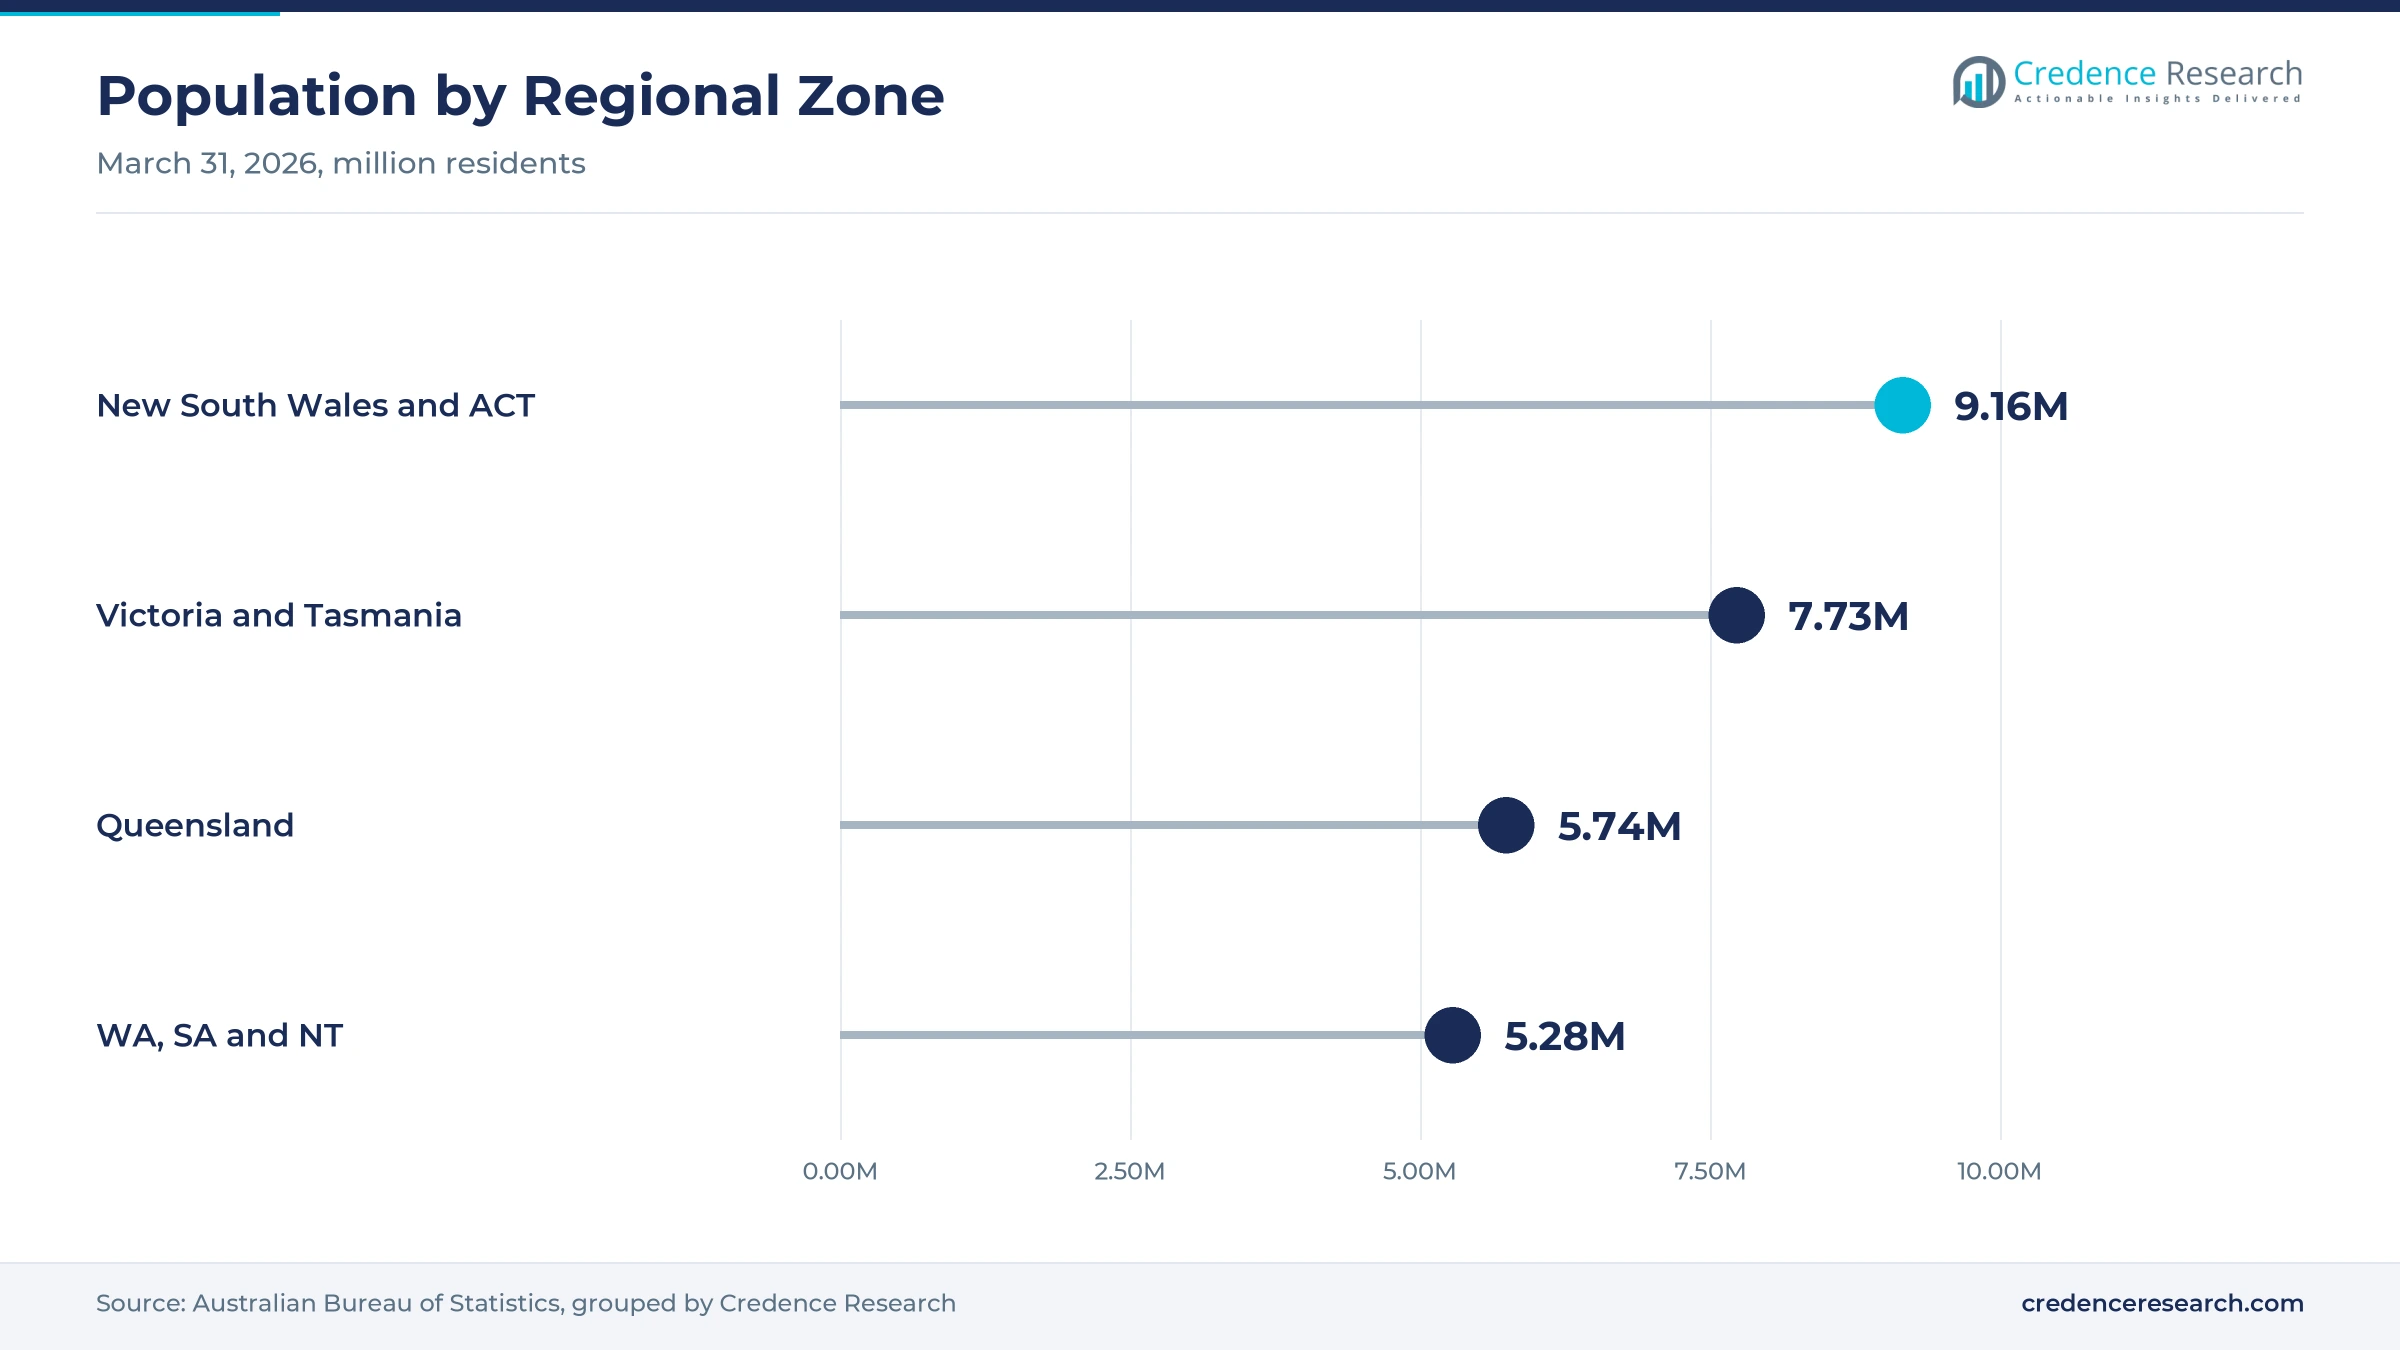
New South Wales and the Australian Capital Territory held a 33.7% share of 2025 value and grow at 5.05% a year, because Sydney concentrates building work, marinas and distributor warehouses. The two jurisdictions had about 9.16 million residents in March 2026. Hobson Engineering also operates from Eastern Creek in western Sydney. However, growth is slower than in Queensland because the building base is mature and population growth is lower at 1.1% a year.
How do Victoria and Tasmania support fixing demand?
Victoria and Tasmania held a 24.6% share of 2025 value and grow at 5.05% a year, because Melbourne hosts many fabricators, food processors and building contractors. Victoria added about 109,500 residents in the year to March 2026, which supports new housing and transport work. James Glen, established in Australia in 1964, supplies marine and architectural hardware from this market. Tasmania adds demand from aquaculture and boating along its long coastline.
Why is Queensland the fastest-growing region?
Queensland held a 19.0% share of 2025 value and grows fastest at 5.65% a year, because its long populated coastline exposes buildings, jetties and boats to salt air. Queensland had about 5.74 million residents in March 2026 after adding about 90,100 people over the year. Sunshine Coast rules require grade 316 fixings east of the Bruce Highway, which lifts the value of each job. In turn, stockists with Brisbane warehouses gain orders from builders and marine operators.
What drives demand in the western and central states?
Western Australia, South Australia and the Northern Territory held a 22.7% share of 2025 value and grow at 5.45% a year, because mining, ports and processing plants use many corrosion-resistant fixings. Western Australia also had the fastest state population growth at 2.1%. Stainless Fastener Supplies runs a Western Australian warehouse that serves mining, shipbuilding and transport customers across the region.
Pipeline, housing and industry data marked 2024 to 2026
| Development | Status and market relevance |
|---|---|
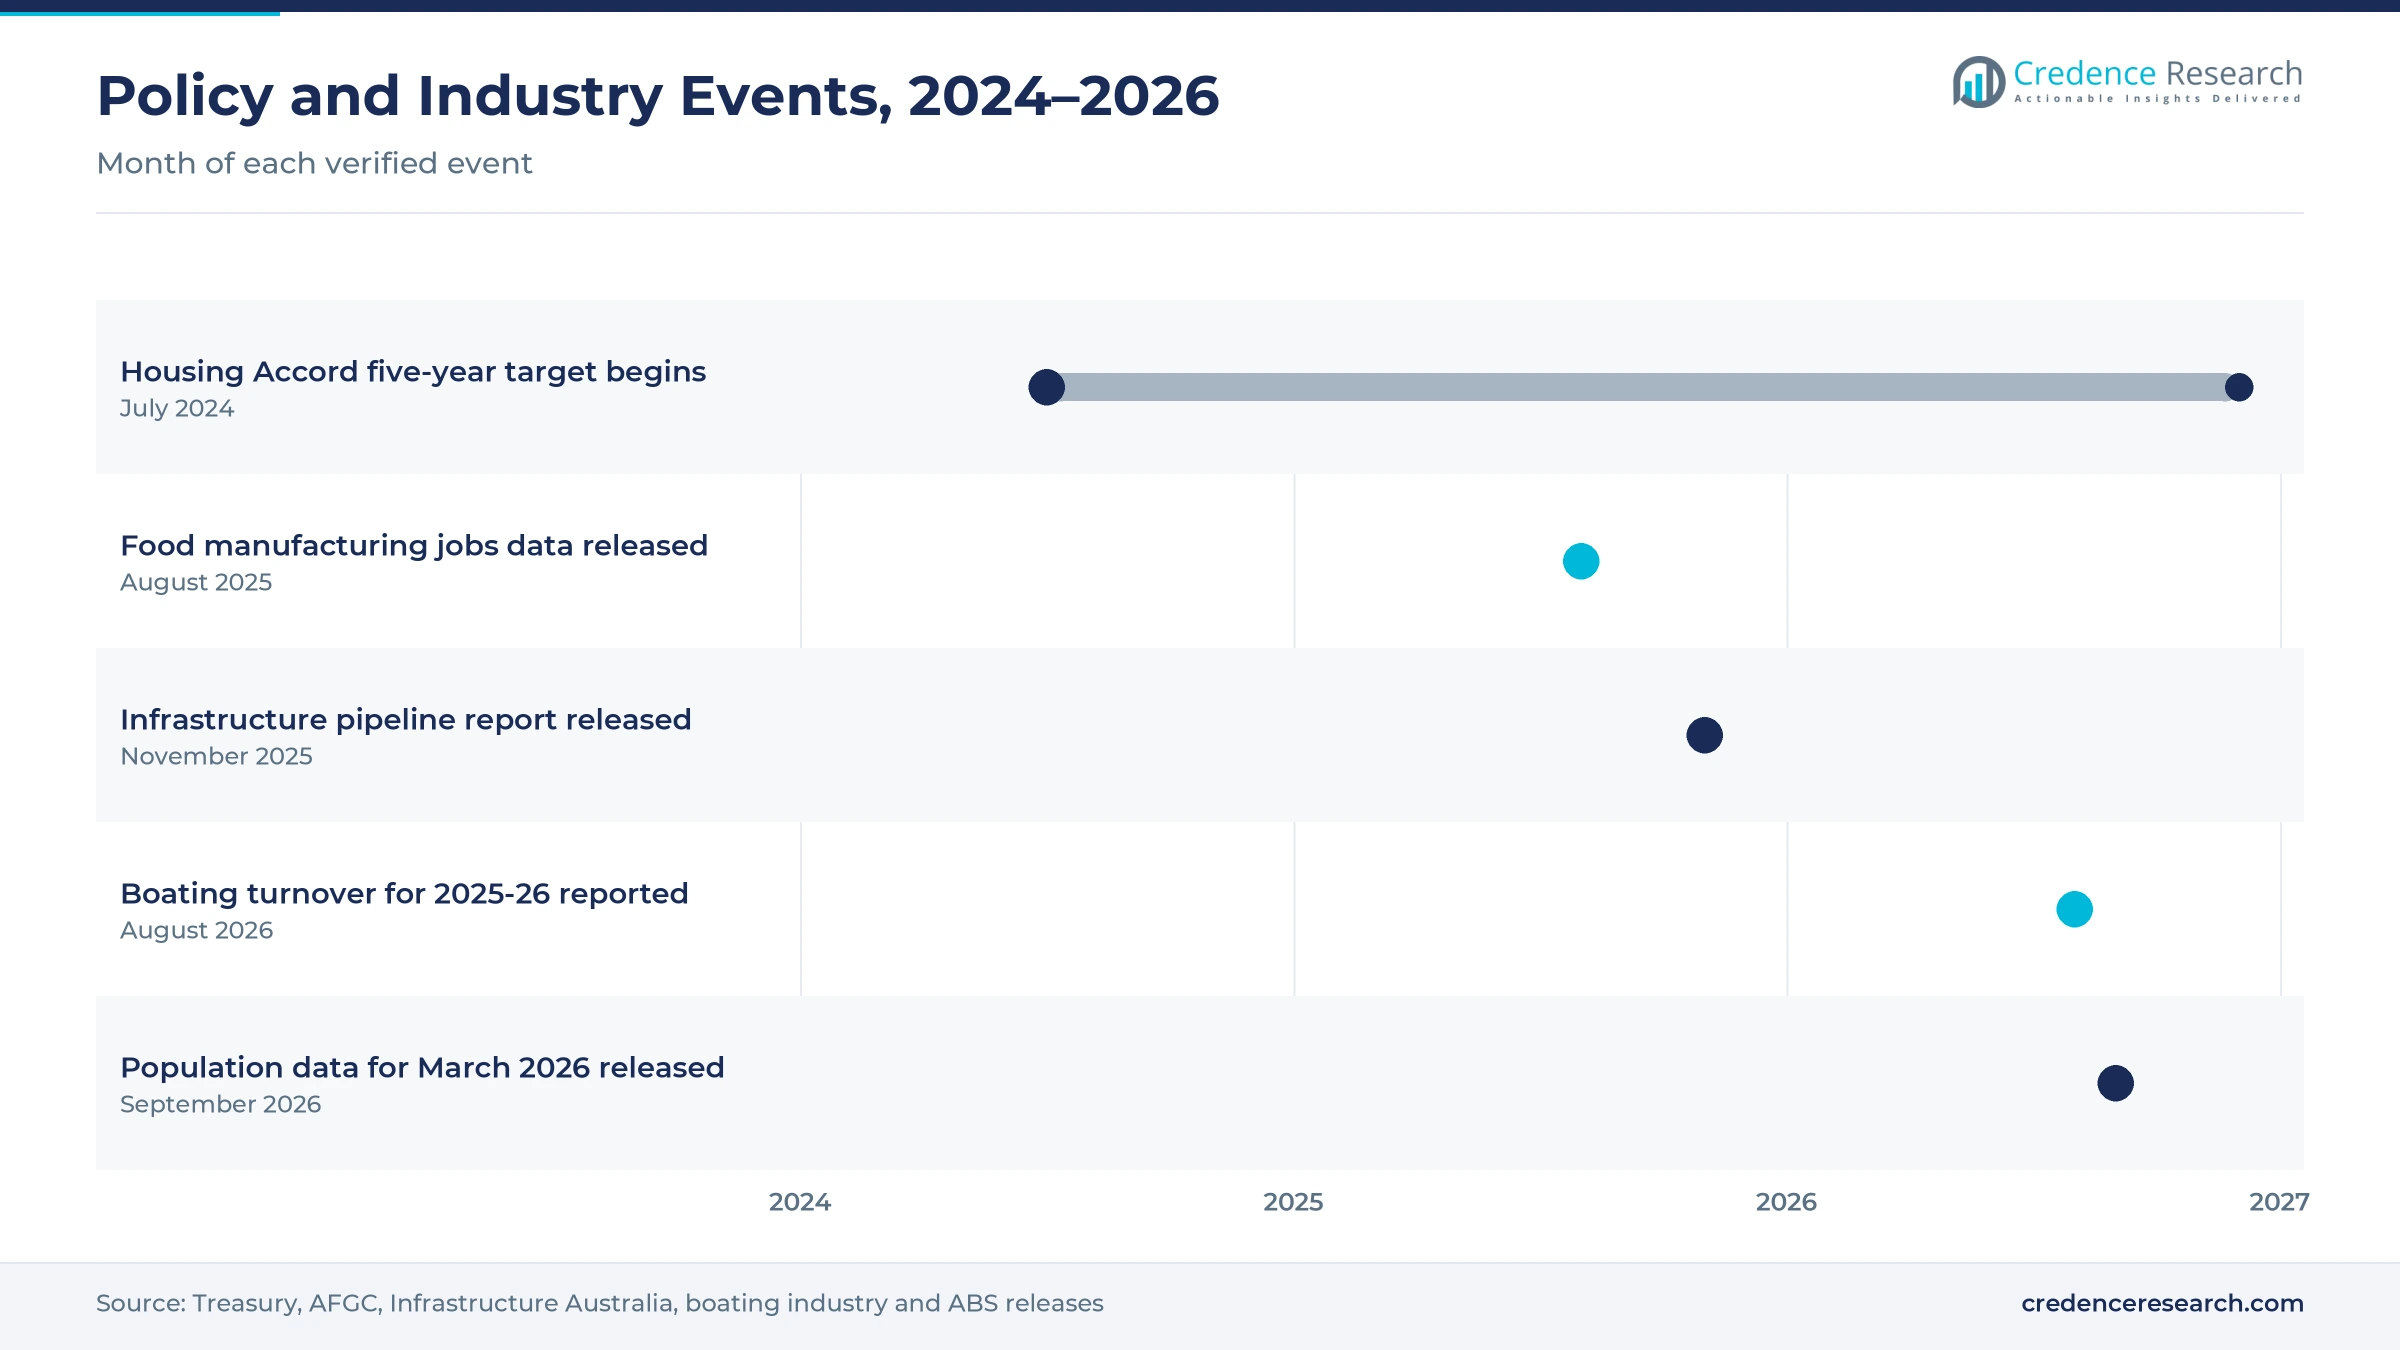
| In July 2024, the National Housing Accord target of 1.2 million new homes over five years began. | Raised expected demand for building and architectural fixings |
| In August 2025, food and grocery manufacturing employment was reported to have grown 4.4% to 294,212. | Supports maintenance demand for hygienic fixings in processing plants |
| In November 2025, Infrastructure Australia reported a five-year public infrastructure pipeline of $242 billion. | Pipeline rose $29 billion, with energy spending more than doubling |
| In August 2026, the boating industry reported A$10.5 billion in turnover for 2025-26. | Matched the previous record year and sustained marine replacement demand |
| In September 2026, the Australian Bureau of Statistics reported a population of 27.92 million at March 31, 2026. | Growth of 1.4% a year widens building and repair work |
Grade control, testing and anchor channels shape supply
- Positive material identification checks the alloy content of each batch, which helps stockists prove that grade 316 parts contain molybdenum.
- Accredited testing laboratories verify strength, coating and thread quality, which supports buyers that need certificates for public projects.
- Cast-in anchor channels set grade 316 rails into concrete during pouring, which removes drilling and speeds installation of facades and services.
- Online inventory platforms show live stock by grade and size, which lets maintenance buyers order exact parts for next-day delivery.
Need a Custom Version of This Report?
Tailor the scope, geography, or segments to your exact requirements.
- Custom geography or segment scope
- Direct access to our analyst team
Specialist stockists compete on range, grade and delivery
Competition is led by specialist stainless stockists that import from overseas makers and hold deep ranges of grades and sizes. Austain Fasteners runs four national warehouses and makes non-standard parts through quality-assured partners. James Glen, established in 1964, supplies stainless fasteners and marine and architectural hardware. Anzor Fasteners runs a dedicated stainless range with special grades, while United Fasteners Australia serves trade buyers through 15 branches. Hobson Engineering, founded in 1935, adds a NATA-accredited testing facility. Allfasteners and Macsim Fastenings serve builders with stainless anchors and fixings, and Stainless Fastener Supplies and Hitech Fasteners serve industrial and marine users. Rivals compete on range depth, grade certainty, delivery speed and technical advice.
Companies profiled and their roles in this market
| Company | Type | Role in the market |
|---|---|---|
| Austain Fasteners | Specialist stockist | Runs four national warehouses with a wide stainless range |
| James Glen | Manufacturer and wholesaler | Supplies stainless fasteners and marine hardware since 1964 |
| Anzor Fasteners | Specialist stockist | Offers marine ranges and special stainless grades |
| United Fasteners Australia | Trade distributor | Serves buyers through 15 branches nationwide |
| Hobson Engineering | Manufacturer and distributor | Runs a NATA-accredited testing facility at Eastern Creek |
| Allfasteners Australia | Construction supplier | Sells 316 grade cast-in anchor channels and fixings |
| Stainless Fastener Supplies | Wholesale distributor | Lists more than 8,000 products from WA and Queensland |
| Macsim Fastenings | Fixings brand | Offers anchors and fixings in 304 and 316 grades |
Credence Research view on Australian corrosion-proof fixings
Credence Research's view is that Australian demand for corrosion-resistant fixings will grow steadily because building, marine and processing users keep moving from coated steel to stainless on exposed sites. Grade 316 remains the core of the market, while specialty assemblies and online sales gain share. A $242 billion public infrastructure pipeline and more than 950,000 registered boats give demand a broad base. However, import reliance, alloy price swings and mislabeled grades will keep pressure on margins. Stockists that prove grade, hold deep stock and sell online should gain share fastest.
How the Australian stainless fixings estimate was built
The report uses 2025 as the base year on a calendar basis, and market values come from the Credence Research model. That model combines infrastructure pipeline data, housing targets, population statistics, World Bank manufacturing data, food industry employment data, boating industry figures and company information on product ranges and branch networks. Segment splits and regional growth rates are Credence Research estimates, while regional shares follow the client-defined split. Sources used are public reports, official statistics, trade press, council design guides and company websites, and no interviews or surveys were used.
Coastal building and marine refits carry demand to 2035
Sales of corrosion-resistant fixings are expected to reach USD 309.3 million by 2035, a 5.26% CAGR during 2026–2035, as infrastructure work, marine replacement and food plant upkeep keep demand rising. Growth should stay steady through 2029 while the public pipeline and housing program run at high levels. After that, specialty assemblies and online sales will carry more growth as standard threaded items mature. Higher alloy prices would lower this outlook, while faster coastal building would raise it. Stockists with deep grade 316 ranges and testing records are expected to gain the most.
Frequently Asked Questions
How big is the Australia non-structural stainless steel fasteners market?
Which product type leads corrosion-resistant fixings in Australia?
Which region leads the Australia non-structural stainless steel fasteners market?
Why does grade 316 lead the market?
What drives demand for corrosion-resistant fixings in Australia?
Which sales channel is growing fastest?
Who are the leading suppliers of stainless fixings in Australia?
What are the main challenges for fastener suppliers?
Table of Content
Chapter 1 Market Segmentation
- 1.1 Segmentation Framework
- 1.1.1 Product and Service Classification
- 1.1.2 Application and End-Use Classification
- 1.1.3 Technology and Solution Classification
- 1.1.4 Customer and Distribution Channel Classification
- 1.1.5 Geographic Segmentation
- 1.1.6 Market Segment Definitions and Boundaries
- 1.2 By Product Type
- 1.2.1 Externally Threaded Fasteners
- 1.2.2 Internally Threaded Fasteners
- 1.2.3 Non-Threaded Fasteners
- 1.2.4 Specialty Fixing Assemblies
- 1.3 By Grade
- 1.3.1 Grade 316 and A4
- 1.3.2 Grade 304 and A2
- 1.3.3 Specialty Stainless Grades
- 1.4 By End-Use Industry
- 1.4.1 Building and Architectural Works
- 1.4.2 Marine and Coastal Operations
- 1.4.3 Processing and Resource Operations
- 1.4.4 Utilities and Distributed End Uses
- 1.5 By Sales Channel
- 1.5.1 Specialist Distribution
- 1.5.2 Broadline Trade Supply
- 1.5.3 Digital Specialist Sales
Chapter 2 Introduction
- 2.1 Report Objectives and Scope
- 2.2 Product Definition and Industry Terminology
- 2.3 Market Inclusions and Exclusions
- 2.4 Research Process
- 2.4.1 Primary Research and Expert Interviews
- 2.4.2 Secondary Research and Source Review
- 2.4.3 Top-Down and Bottom-Up Estimation
- 2.4.4 Data Triangulation and Verification
- 2.5 Market Size Measurement Basis
- 2.5.1 2025: USD 179.5 million → 2035: USD 309.3 million
- 2.6 Historical and Forecast Reference Periods
- 2.6.1 Historical Period: 2018-2025
- 2.6.2 Base Year: 2025
- 2.6.3 Forecast Period: 2025-2035
- 2.7 Research Assumptions and Limitations
Chapter 3 Executive Summary
- 3.1 Market Snapshot and Key Findings
- 3.2 Base-Year Market Size, 2025
- 3.3 Forecast Market Size, 2035
- 3.4 Revenue and Volume Growth Outlook
- 3.5 Key Demand and Supply Indicators
- 3.6 Leading Market Segments
- 3.7 Fastest-Growing Market Opportunities
- 3.8 Regional Performance Highlights
- 3.9 Technology and Industry Transformation
- 3.10 Competitive Landscape Summary
- 3.11 Analyst View and Strategic Implications
Chapter 4 Australia Non-Structural Stainless Steel Fasteners Market Trends and Developments
- 4.1 Historical Industry Development, 2018-2025
- 4.2 Recent Market Trends and Developments
- 4.3 Demand and Customer Behavior Trends
- 4.4 Technology and Product Innovation
- 4.5 Artificial Intelligence, Automation and Digitalization
- 4.6 Local Manufacturing and Supply Chain Realignment
- 4.7 Industry Partnerships, Mergers and Acquisitions
- 4.8 Sustainability and Circular Economy Developments
- 4.9 Government and Private Sector Investment Trends
- 4.10 Emerging Business Models and Commercialization
- 4.11 Industry Developments and Announcements
Chapter 5 Australia Non-Structural Stainless Steel Fasteners Market Production, Supply and Demand Analysis
- 5.1 Demand Trend and Consumption Analysis, 2018-2025
- 5.2 Demand Forecast, 2025-2035
- 5.3 Production and Output Trend, 2018-2025
- 5.4 Production and Output Forecast, 2025-2035
- 5.5 Installed Capacity and Capacity Utilization
- 5.6 Company-Wise Production Plants and Statistics
- 5.6.1 Installed Production Capacity
- 5.6.2 Actual Production
- 5.6.3 Planned Capacity and Expansion Targets
- 5.7 Supply Chain Structure and Procurement Trends
- 5.8 Supply-Demand Gap and Bottlenecks
- 5.9 Import Dependence and Sourcing Structure
- 5.10 Contract Manufacturing and Outsourcing
- 5.11 Regional Supply and Demand Concentration
Chapter 6 Australia Non-Structural Stainless Steel Fasteners Market Pricing Analysis
- 6.1 Pricing Structure and Measurement
- 6.2 Historical Pricing Trends, 2018-2025
- 6.3 Pricing Outlook, 2025-2035
- 6.4 Average Selling Price and Unit Economics
- 6.5 Pricing by Product and Market Segment
- 6.6 Geographic Pricing Differences
- 6.7 Key Input, Energy, Labor and Logistics Costs
- 6.8 Contract Pricing and Purchasing Models
- 6.9 Pricing Sensitivity and Competitive Positioning
- 6.10 Price, Margin and Profitability Implications
Chapter 7 Australia Non-Structural Stainless Steel Fasteners Market Dynamics
- 7.1 Market Growth Drivers
- 7.1.1 Demand-Side Drivers
- 7.1.2 Technology and Innovation Drivers
- 7.1.3 Infrastructure and Investment Drivers
- 7.1.4 Regulatory and Policy Drivers
- 7.2 Market Restraints
- 7.2.1 Cost and Affordability Constraints
- 7.2.2 Technology and Adoption Barriers
- 7.2.3 Supply Chain and Operational Constraints
- 7.3 Market Challenges
- 7.3.1 Competitive Pressure and Margin Erosion
- 7.3.2 Skills, Infrastructure and Implementation Gaps
- 7.4 Emerging Market Opportunities
- 7.5 Market Dynamics Impact and Time-Horizon Assessment
Chapter 8 Australia Non-Structural Stainless Steel Fasteners Value Chain Analysis
- 8.1 Industry Value Chain Overview
- 8.2 Upstream Suppliers and Critical Inputs
- 8.3 Technology and Component Providers
- 8.4 Manufacturing or Service Delivery
- 8.5 Distribution, Channel Partners and Integrators
- 8.6 Downstream Applications and End Users
- 8.7 Value Addition and Profit Pools
- 8.8 Vertical Integration and Outsourcing
- 8.9 Supplier Concentration and Risk
- 8.10 Supply Chain Localization and Resilience
Chapter 9 Australia Non-Structural Stainless Steel Fasteners Market Regulations and Policies
- 9.1 Relevant Laws, Standards and Compliance Frameworks
- 9.2 Product, Service, Safety and Quality Requirements
- 9.3 Government Policies, Incentives and Subsidies
- 9.4 Imports, Exports and Trade Barriers
- 9.5 Public Procurement and Local Content Requirements
- 9.6 Environmental and Sustainability Compliance
- 9.7 Upcoming Policy Changes and Market Implications
Chapter 10 Australia Non-Structural Stainless Steel Fasteners Market Hotspots and Opportunities
- 10.1 Market Opportunity Mapping and Growth Hotspots
- 10.2 High-Growth Applications and Customer Groups
- 10.3 Underserved Markets and White-Space Opportunities
- 10.4 Emerging Technology and Product Opportunities
- 10.5 New Capacity and Investment Hotspots
- 10.6 Market Entry and Expansion Opportunities
- 10.7 Distribution and Partnership Opportunities
- 10.8 Near-Term and Long-Term Commercial Potential
- 10.9 Opportunity Attractiveness and Execution Risks
Chapter 11 Australia Non-Structural Stainless Steel Fasteners Market Outlook, 2025-2035
- 11.1 Market Size and Analysis
- 11.1.1 Revenue (Market Measurement: 2025: USD 179.5 million → 2035: USD 309.3 million)
- 11.1.2 Market Volume and Quantity Sold
- 11.1.3 Historical Market Size, 2018-2025
- 11.1.4 Base-Year Market Size, 2025
- 11.2 Market Forecast, 2025-2035
- 11.2.1 Revenue Forecast to 2035
- 11.2.2 Volume Forecast to 2035
- 11.2.3 CAGR and Year-on-Year Growth
- 11.2.4 Incremental Revenue Opportunity
- 11.3 Forecast Assumptions and Scenario Analysis
- 11.3.1 Base-Case Forecast
- 11.3.2 Optimistic and Conservative Scenarios
- 11.3.3 Technology, Pricing and Policy Sensitivities
- 11.4 Market Attractiveness and Growth Outlook
Chapter 12 Australia Non-Structural Stainless Steel Fasteners Market Segmentation and Outlook
- 12.1 Segmentation Summary and Market Shares, 2025
- 12.2 Largest and Fastest-Growing Segments
- 12.3 By Product Type - Market Size and Forecast, 2025-2035
- 12.3.1 Segment Definition and Scope
- 12.3.2 Historical Market Size, 2018-2025
- 12.3.3 Revenue Forecast, 2025-2035
- 12.3.4 Volume Forecast, 2025-2035
- 12.3.5 Base-Year Market Share, 2025
- 12.3.6 Segment CAGR and Growth Drivers
- 12.3.7 Subsegment Market Size and Forecast
- 12.3.7.1 Externally Threaded Fasteners
- 12.3.7.2 Internally Threaded Fasteners
- 12.3.7.3 Non-Threaded Fasteners
- 12.3.7.4 Specialty Fixing Assemblies
- 12.3.8 Subsegment Pricing and Adoption Trends
- 12.3.9 Leading Suppliers and Competition
- 12.3.10 Regional Demand and Opportunities
- 12.4 By Grade - Market Size and Forecast, 2025-2035
- 12.4.1 Segment Definition and Scope
- 12.4.2 Historical Market Size, 2018-2025
- 12.4.3 Revenue Forecast, 2025-2035
- 12.4.4 Volume Forecast, 2025-2035
- 12.4.5 Base-Year Market Share, 2025
- 12.4.6 Segment CAGR and Growth Drivers
- 12.4.7 Subsegment Market Size and Forecast
- 12.4.7.1 Grade 316 and A4
- 12.4.7.2 Grade 304 and A2
- 12.4.7.3 Specialty Stainless Grades
- 12.4.8 Subsegment Pricing and Adoption Trends
- 12.4.9 Leading Suppliers and Competition
- 12.4.10 Regional Demand and Opportunities
- 12.5 By End-Use Industry - Market Size and Forecast, 2025-2035
- 12.5.1 Segment Definition and Scope
- 12.5.2 Historical Market Size, 2018-2025
- 12.5.3 Revenue Forecast, 2025-2035
- 12.5.4 Volume Forecast, 2025-2035
- 12.5.5 Base-Year Market Share, 2025
- 12.5.6 Segment CAGR and Growth Drivers
- 12.5.7 Subsegment Market Size and Forecast
- 12.5.7.1 Building and Architectural Works
- 12.5.7.2 Marine and Coastal Operations
- 12.5.7.3 Processing and Resource Operations
- 12.5.7.4 Utilities and Distributed End Uses
- 12.5.8 Subsegment Pricing and Adoption Trends
- 12.5.9 Leading Suppliers and Competition
- 12.5.10 Regional Demand and Opportunities
- 12.6 By Sales Channel - Market Size and Forecast, 2025-2035
- 12.6.1 Segment Definition and Scope
- 12.6.2 Historical Market Size, 2018-2025
- 12.6.3 Revenue Forecast, 2025-2035
- 12.6.4 Volume Forecast, 2025-2035
- 12.6.5 Base-Year Market Share, 2025
- 12.6.6 Segment CAGR and Growth Drivers
- 12.6.7 Subsegment Market Size and Forecast
- 12.6.7.1 Specialist Distribution
- 12.6.7.2 Broadline Trade Supply
- 12.6.7.3 Digital Specialist Sales
- 12.6.8 Subsegment Pricing and Adoption Trends
- 12.6.9 Leading Suppliers and Competition
- 12.6.10 Regional Demand and Opportunities
- 12.7 Segment Growth Comparison
- 12.8 Segment Attractiveness and Priority Matrix
Chapter 13 Australia Non-Structural Stainless Steel Fasteners End-Use and Application Market Outlook
- 13.1 End-Use Industry and Customer Demand Structure
- 13.2 Leading Applications and Customer Groups
- 13.3 End-Use Market Size, Share and Forecast
- 13.4 Major End-Use Industry Deep Dives
- 13.4.1 Customer Requirements and Use Cases
- 13.4.2 Demand and Replacement Cycles
- 13.4.3 Technical and Regulatory Considerations
- 13.4.4 Purchasing and Procurement Models
- 13.4.5 Leading Vendors and Distribution Channels
- 13.4.6 Forecast and Commercial Opportunities
- 13.5 Emerging Applications and Cross-Segment Demand
- 13.6 End-Use Industry Investment Priorities
Chapter 14 Australia Non-Structural Stainless Steel Fasteners Geographic Market Outlook, 2025-2035
- 14.1 Domestic Market Distribution and Demand Clusters
- 14.2 State- or Province-Wise Market Size and Forecast, 2025-2035
- 14.3 City and Metropolitan Market Outlook
- 14.4 Industrial, Manufacturing and Commercial Clusters
- 14.5 Geographic Concentration of Key End Users
- 14.6 Local Pricing and Purchasing Differences
- 14.7 Domestic Production Facilities and Capacity Map
- 14.8 Local Infrastructure and Project Pipeline
- 14.9 State-Level Policy and Incentive Differences
- 14.10 Subnational Investment Hotspots and Opportunities
- 14.11 Distribution and Logistics Networks
- 14.12 Domestic Competitive Footprint
Chapter 15 Australia Non-Structural Stainless Steel Fasteners Technology, Innovation and Sustainability Outlook
- 15.1 Technology Landscape and Maturity
- 15.2 Product, Process and Service Innovation
- 15.3 AI, Automation and Digital Tools in the Industry
- 15.4 Technology Adoption and Performance Benchmarking
- 15.5 Innovation Pipeline and R&D Investment
- 15.6 Patent and Intellectual Property Trends
- 15.7 Energy Efficiency and Resource Management
- 15.8 Sustainability, Recycling and Circularity
- 15.9 Technology Roadmap, 2025-2035
- 15.10 Risks of Obsolescence and Technology Substitution
Chapter 16 Australia Non-Structural Stainless Steel Fasteners Market Key Strategic Imperatives
- 16.1 Growth and Market Entry Priorities
- 16.2 High-Return Products and Segments
- 16.3 Pricing, Profitability and Cost Optimization
- 16.4 Technology Investment and Product Differentiation
- 16.5 Supply Chain Localization and Resilience
- 16.6 Distribution and Customer Acquisition
- 16.7 Partnership, Acquisition and Capacity Strategy
- 16.8 Regional Expansion Priorities
- 16.9 Short-, Medium- and Long-Term Actions
Chapter 17 Competition Outlook
- 17.1 Industry Competition Characteristics
- 17.2 Market Structure and Concentration
- 17.3 Market Share and Competitive Positioning, 2025
- 17.4 Company-Wise Revenue and Product Benchmarking
- 17.5 Production and Service Capacity Benchmarking
- 17.6 Technology, Pricing and Differentiation
- 17.7 Regional Footprint and Distribution Strength
- 17.8 Mergers, Acquisitions and Strategic Alliances
- 17.9 New Entrants and Competitive Threats
- 17.10 Porter's Five Forces and Industry Attractiveness
- 17.11 Competitive Outlook, 2025-2035
Chapter 18 Company Profiles
- 18.1 Company Coverage and Selection Criteria
- 18.2 United Fasteners Australia
- 18.2.1 Business Description
- 18.2.2 Company Ownership and Geographic Presence
- 18.2.3 Product and Service Portfolio
- 18.2.4 Manufacturing and Operating Footprint
- 18.2.5 Production Capacity and Expansion Plans
- 18.2.6 Financial Performance and Investment
- 18.2.7 Market Share and Competitive Position
- 18.2.8 Technology and Innovation Capabilities
- 18.2.9 Strategic Alliances or Partnerships
- 18.2.10 Recent Developments
- 18.2.11 Growth Strategy and Outlook
- 18.3 Austain Fasteners
- 18.4 James Glen
- 18.5 Anzor Fasteners
- 18.6 Hobson Engineering
- 18.7 Allfasteners Australia
- 18.8 Stainless Fastener Supplies
- 18.9 Hitech Fasteners
- 18.10 Scrooz Fasteners
- 18.11 Macsim Fastenings
- 18.12 Other Relevant Market Participants
Note: Every listed company is profiled on the structure shown under the first company. The company list is preliminary and may change based on research findings, market developments, data availability and client requirements.
Chapter 19 Disclaimer
- 19.1 Research and Forecast Disclaimer
- 19.2 Data Source and Estimation Limitations
Note: The depth of individual sections depends on data availability for this market. Volume, capacity, trade and other unit-based metrics are included where applicable.

