
Silica rules and mining output shape Australian demand
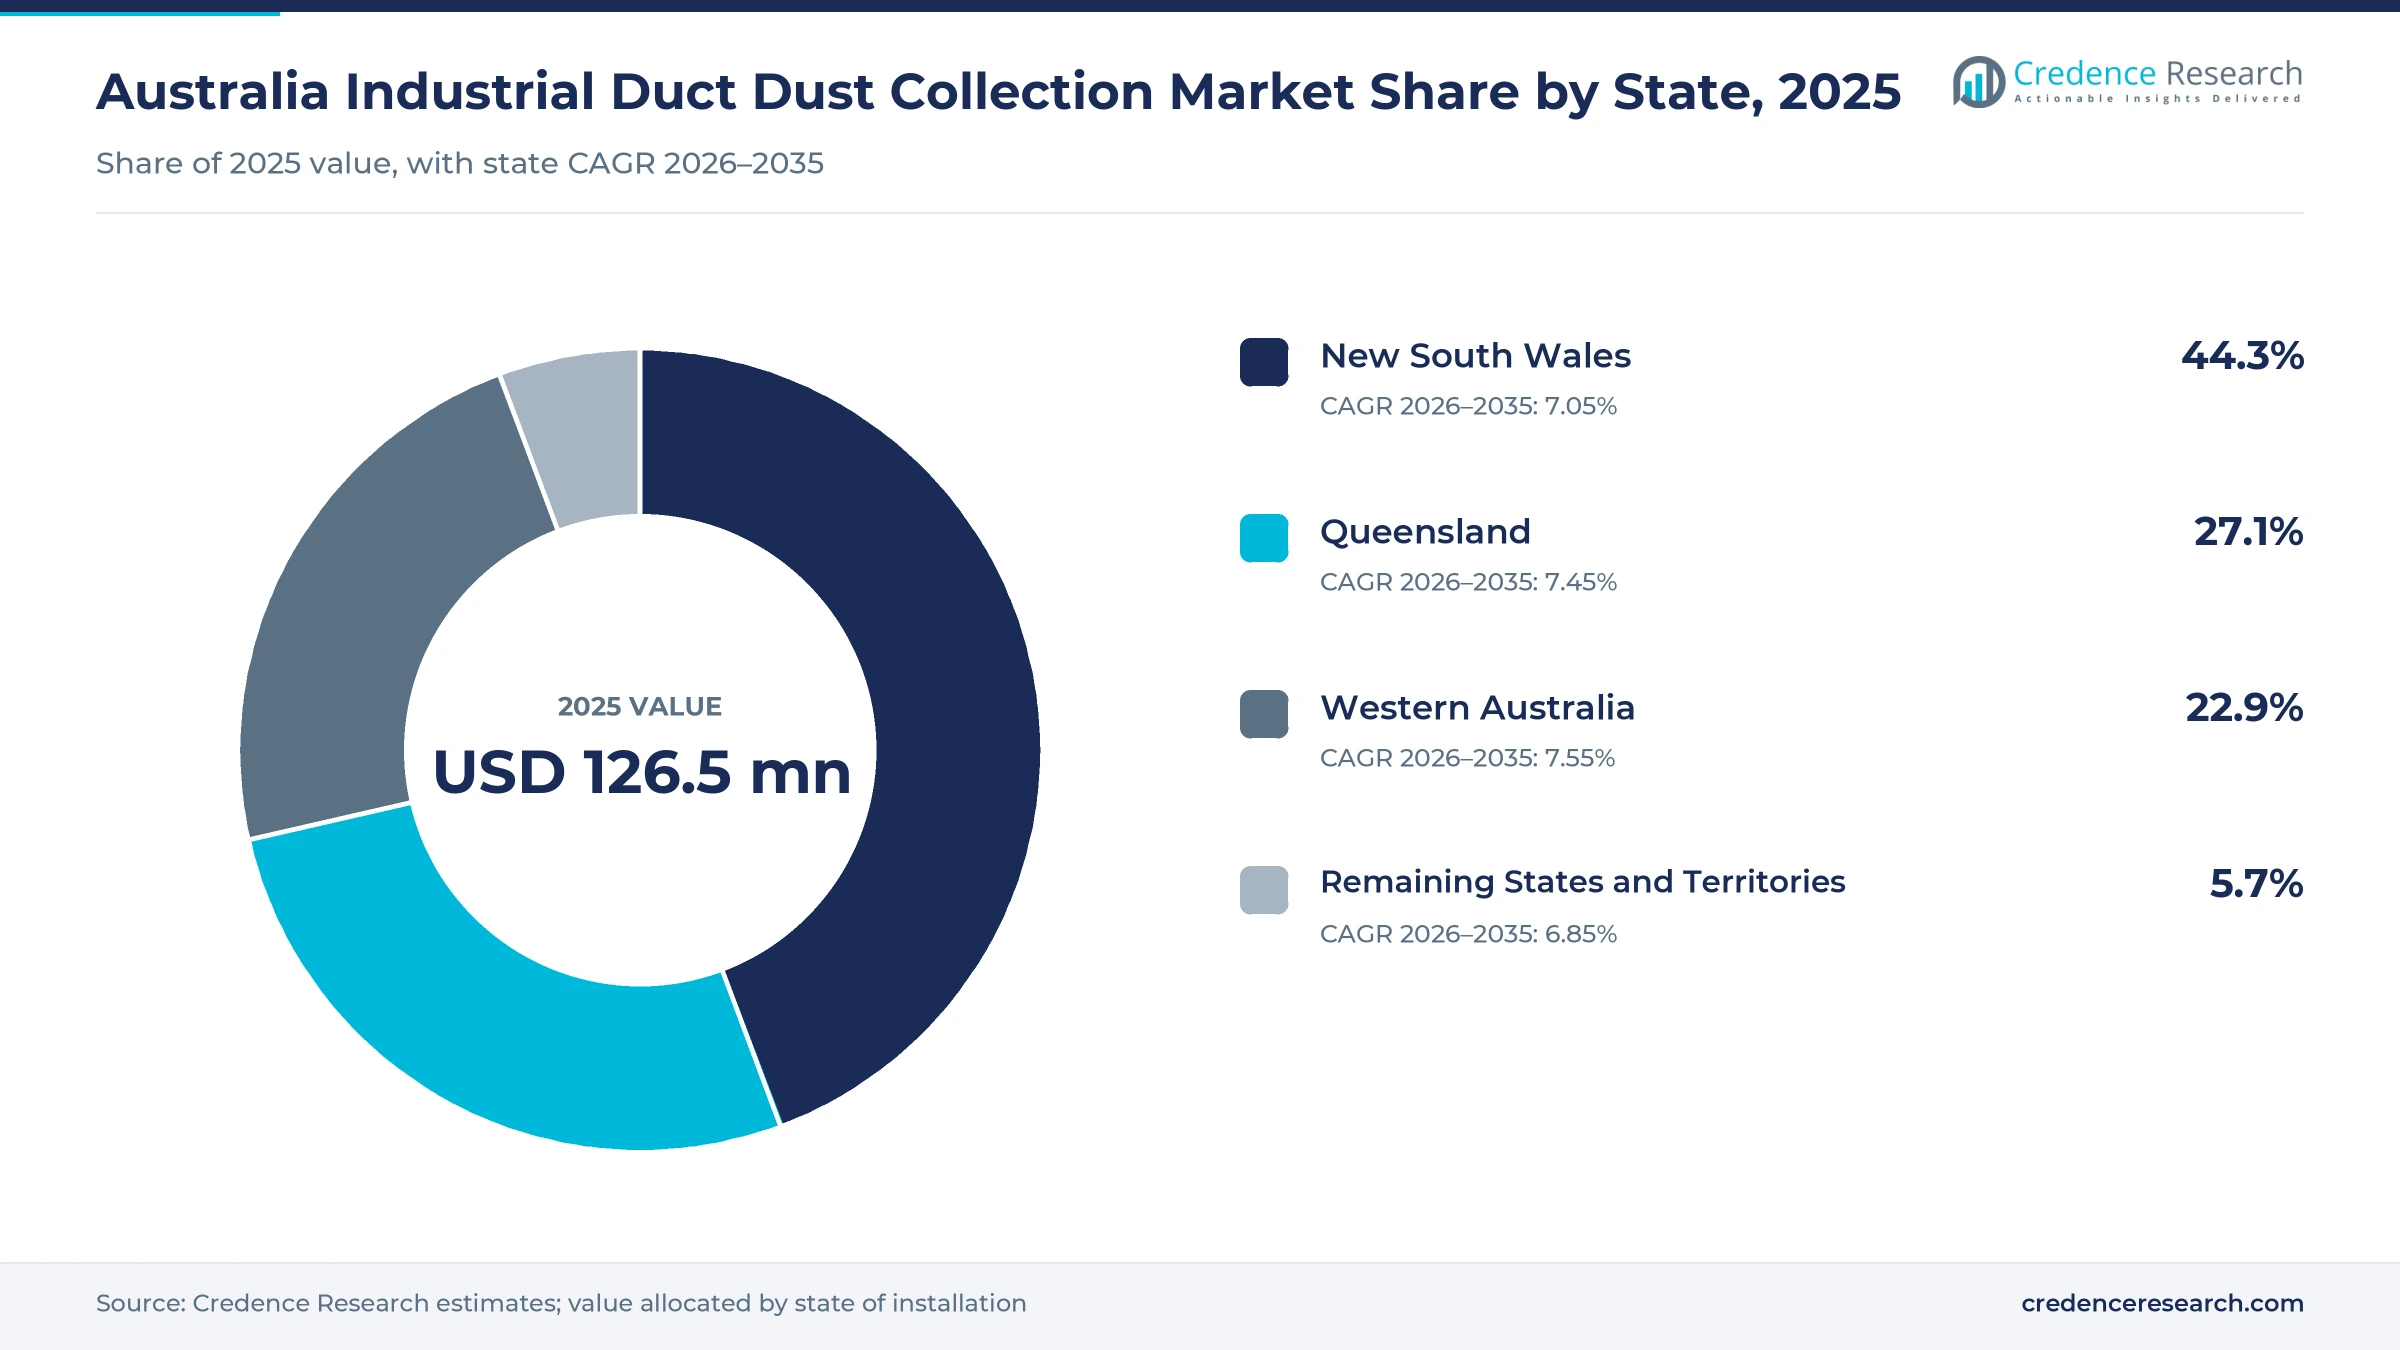
The Australia industrial duct dust collection market was valued at USD 126.5 million in 2025 and is projected to increase from USD 135.4 million in 2026 to USD 254.3 million by 2035, registering a CAGR of 7.26% during 2026–2035. Demand comes from mines, quarries, cement and metal plants, food and timber processors and tunnelling contractors that must capture airborne particles at crushers, conveyors, machines and silos. New South Wales held the largest state share, 44.3% in 2025, because Sydney and its surrounding regions concentrate manufacturing, quarrying and tunnel construction. Western Australia is the fastest-growing state at 7.55% a year, as iron ore projects add crushing, conveying and storage capacity. Engineered stone was banned nationwide from July 1, 2024, which keeps regulators focused on silica from other materials and processes. Nederman also acquired Brisbane distributor Fume & Dust Control in June 2026, which extends its direct presence into Queensland mining and industry.
Which extraction equipment and services does the estimate cover?
The estimate measures the value of ducted systems that capture airborne particles at the source in Australian industry. It covers baghouses, cartridge and pulse-jet collectors, reverse-air and wet collectors, electrostatic units, ducting, hoods, fans, controls, filter bags, cartridges and spare parts. Values are stated at supplier selling prices and include imported equipment sold through local engineering firms and distributors.
The estimate excludes portable vacuum units, water spray suppression, building ventilation without source capture and personal respiratory equipment. The value chain runs from local and overseas makers through engineering firms, technical distributors and contractors to mine operators, plant owners and maintenance providers, which buy new systems, upgrades and replacement filters across mining, manufacturing, construction and utilities.
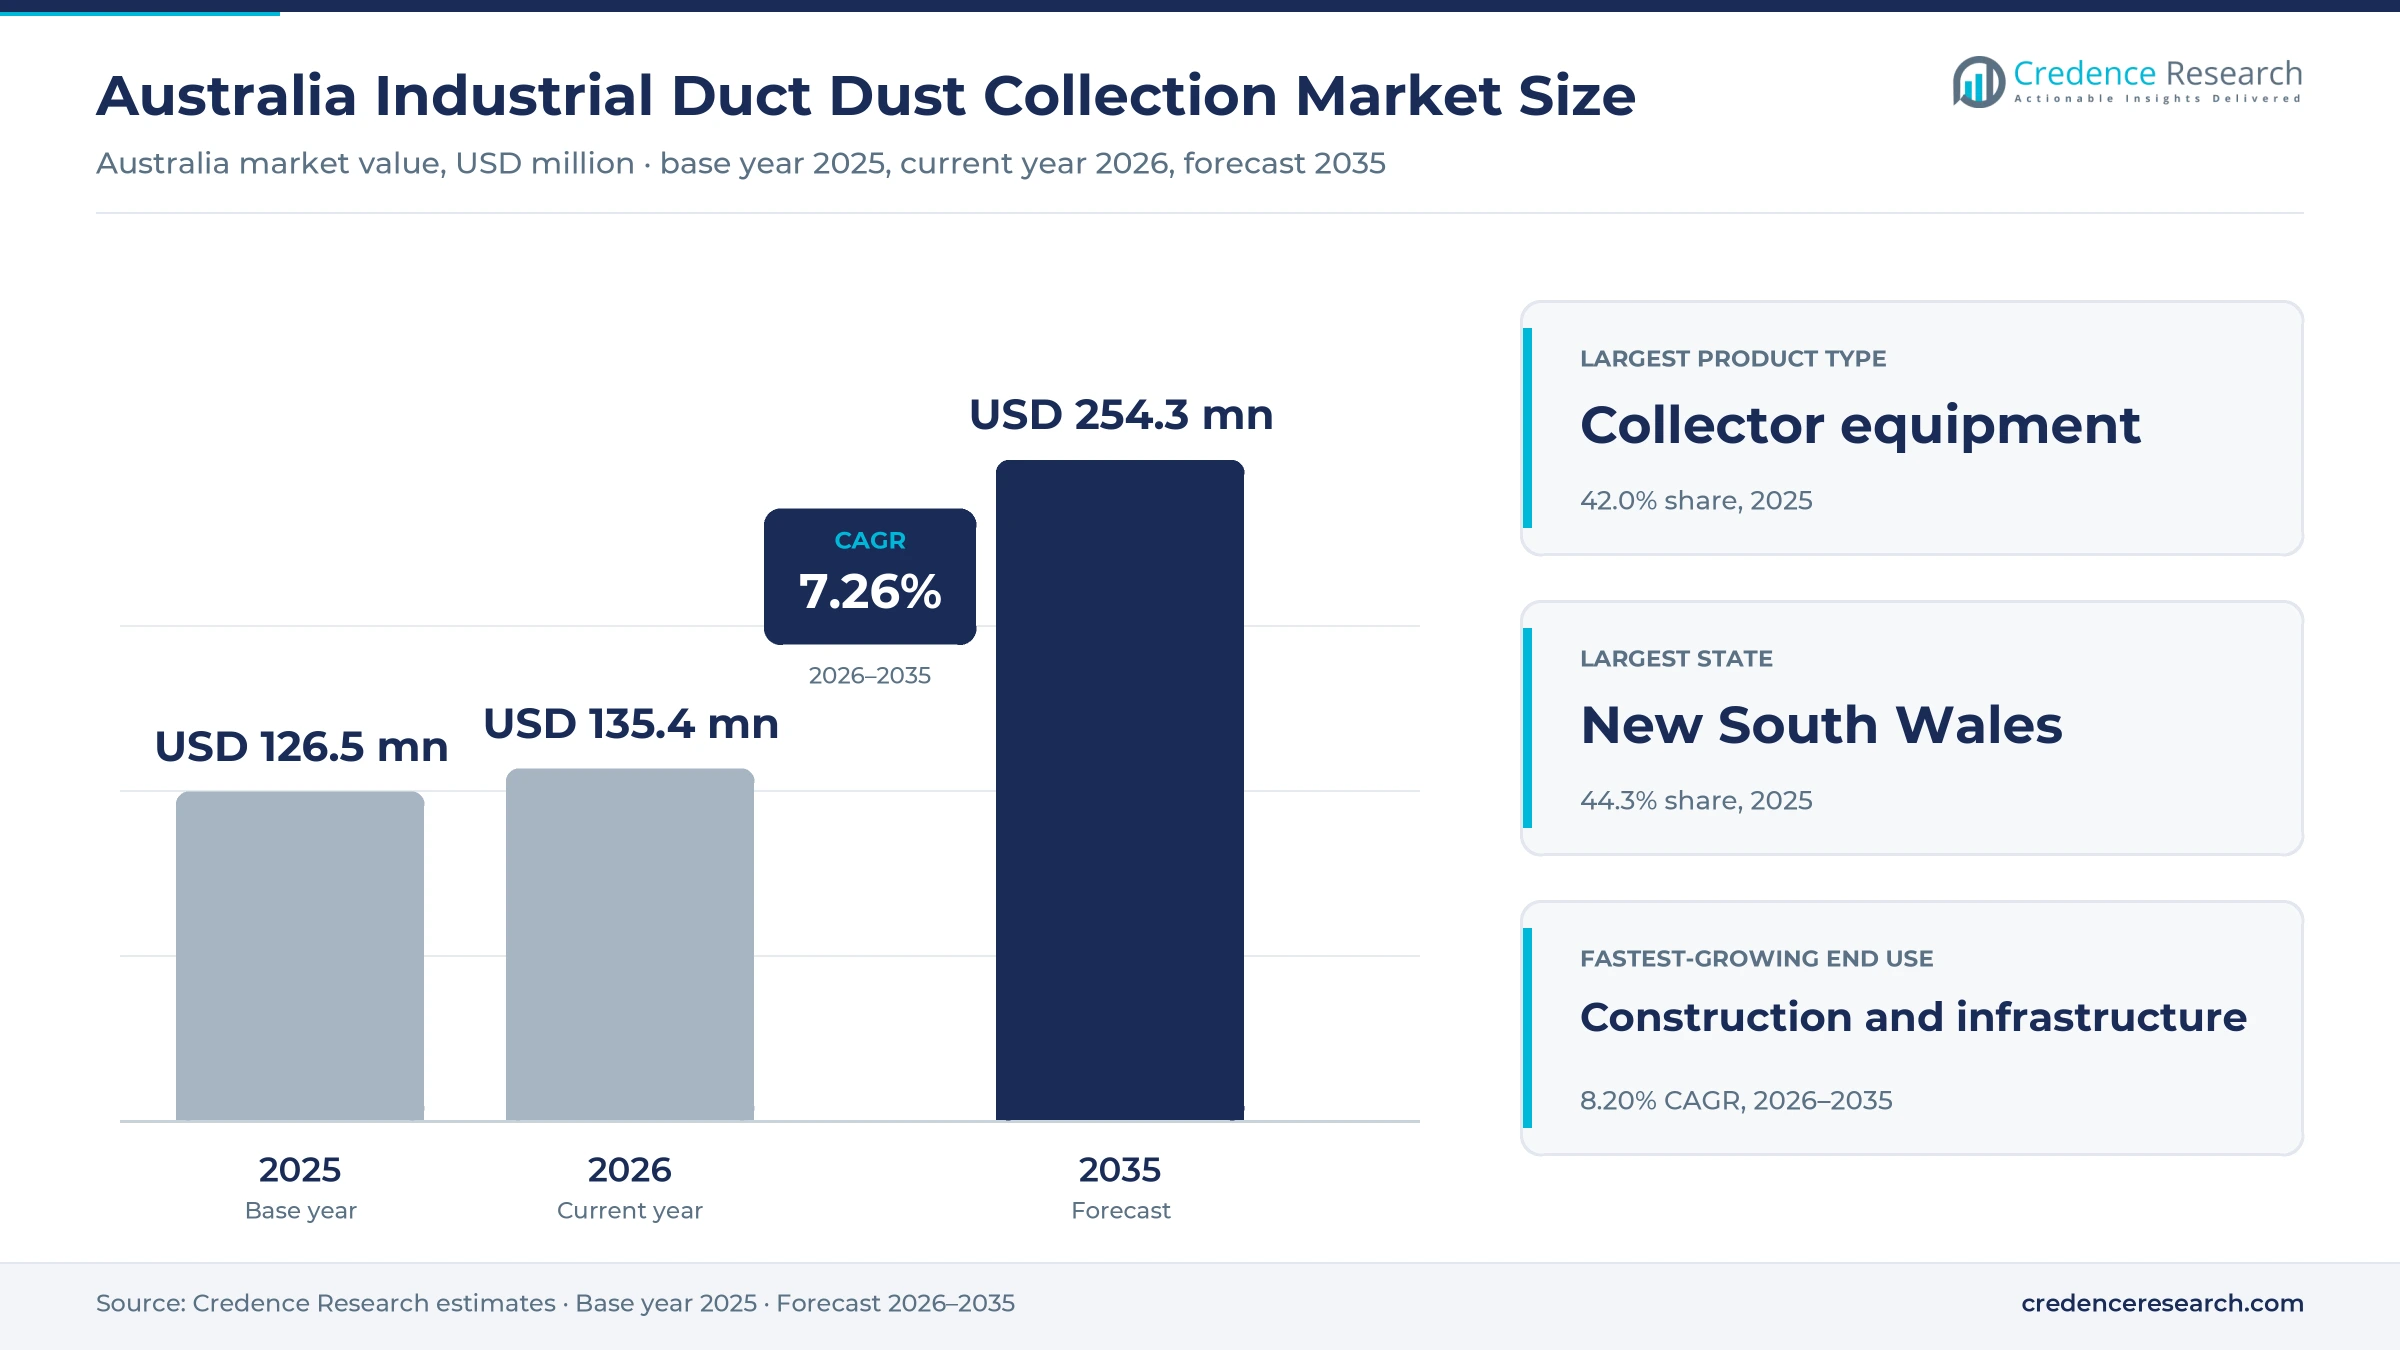
Australia Industrial Duct Dust Collection Market Insights
- The Australia industrial duct dust collection market was valued at USD 126.5 million in 2025 and is projected to reach USD 254.3 million by 2035, registering a CAGR of 7.26% during 2026–2035.
- New South Wales held a 44.3% share of 2025 value, because manufacturing, quarrying and tunnel construction concentrate around Sydney and its surrounding regions.
- Mining and mineral processing led with a 39.0% share of 2025 value, because crushers, conveyors and stockpiles generate large volumes of fine particles.
- Engineered stone was banned nationwide from July 1, 2024, while the national exposure standard for respirable crystalline silica has been held at 0.05 milligrams per cubic meter since 2020.
- Nederman acquired Brisbane distributor Fume & Dust Control in June 2026, adding a Queensland presence to its existing operations in Victoria and New South Wales.
Collectors lead while fans and controls grow fastest
Why does collector equipment lead product demand?
Based on product type, the market is categorized into collector equipment, ducting systems, filter media and parts, and air movement and controls. Collector Equipment led with a 42.0% share of 2025 value, because baghouses and cartridge units carry the highest price in each installation. Air Movement and Controls grow fastest at 7.71% a year, as operators add variable-speed fans, pressure sensors and remote alarms to cut energy use.
How does mining dominate end-use demand?
Based on end-use industry, the market is categorized into mining and mineral processing, manufacturing and process industries, construction and infrastructure, and utilities and energy. Mining and Mineral Processing led with a 39.0% share of 2025 value, because crushers, conveyors and loading points run continuously. Construction and Infrastructure grow fastest at 8.20% a year, as tunnelling and road projects face tighter silica controls.
Why does transfer-point capture lead applications?
Based on application, the market is categorized into transfer-point capture, process-machine extraction and bulk-storage venting. Transfer-Point Capture led with a 41.0% share of 2025 value, because conveyor transfers and crusher discharges release the most particles at mines and quarries. Process-Machine Extraction grows fastest at 7.45% a year, as stone, timber and metal workshops add on-tool and machine capture.
How do engineering sales and contractors reach buyers?
Based on sales channel, the market is categorized into direct engineering sales, technical distribution and contractor procurement. Direct Engineering Sales led with a 49.0% share of 2025 value, because mines and plants buy custom-designed systems from engineering suppliers. Contractor Procurement grows fastest at 7.75% a year, as tunnelling and infrastructure contractors buy extraction packages for each project.
| Segment Group | Leading Sub-segment | Share, 2025 | Fastest-growing Sub-segment | CAGR, 2026–2035 |
|---|---|---|---|---|
| By Product Type | Collector Equipment | 42.0% | Air Movement and Controls | 7.71% |
| By End-Use Industry | Mining and Mineral Processing | 39.0% | Construction and Infrastructure | 8.20% |
| By Application | Transfer-Point Capture | 41.0% | Process-Machine Extraction | 7.45% |
| By Sales Channel | Direct Engineering Sales | 49.0% | Contractor Procurement | 7.75% |
Request a Free Sample
Fill in your details and we'll send you a free sample report.
- Sample data tables & charts
- Research methodology
Silica limits, mines and projects lift extraction demand
How does silica exposure control lift extraction demand?
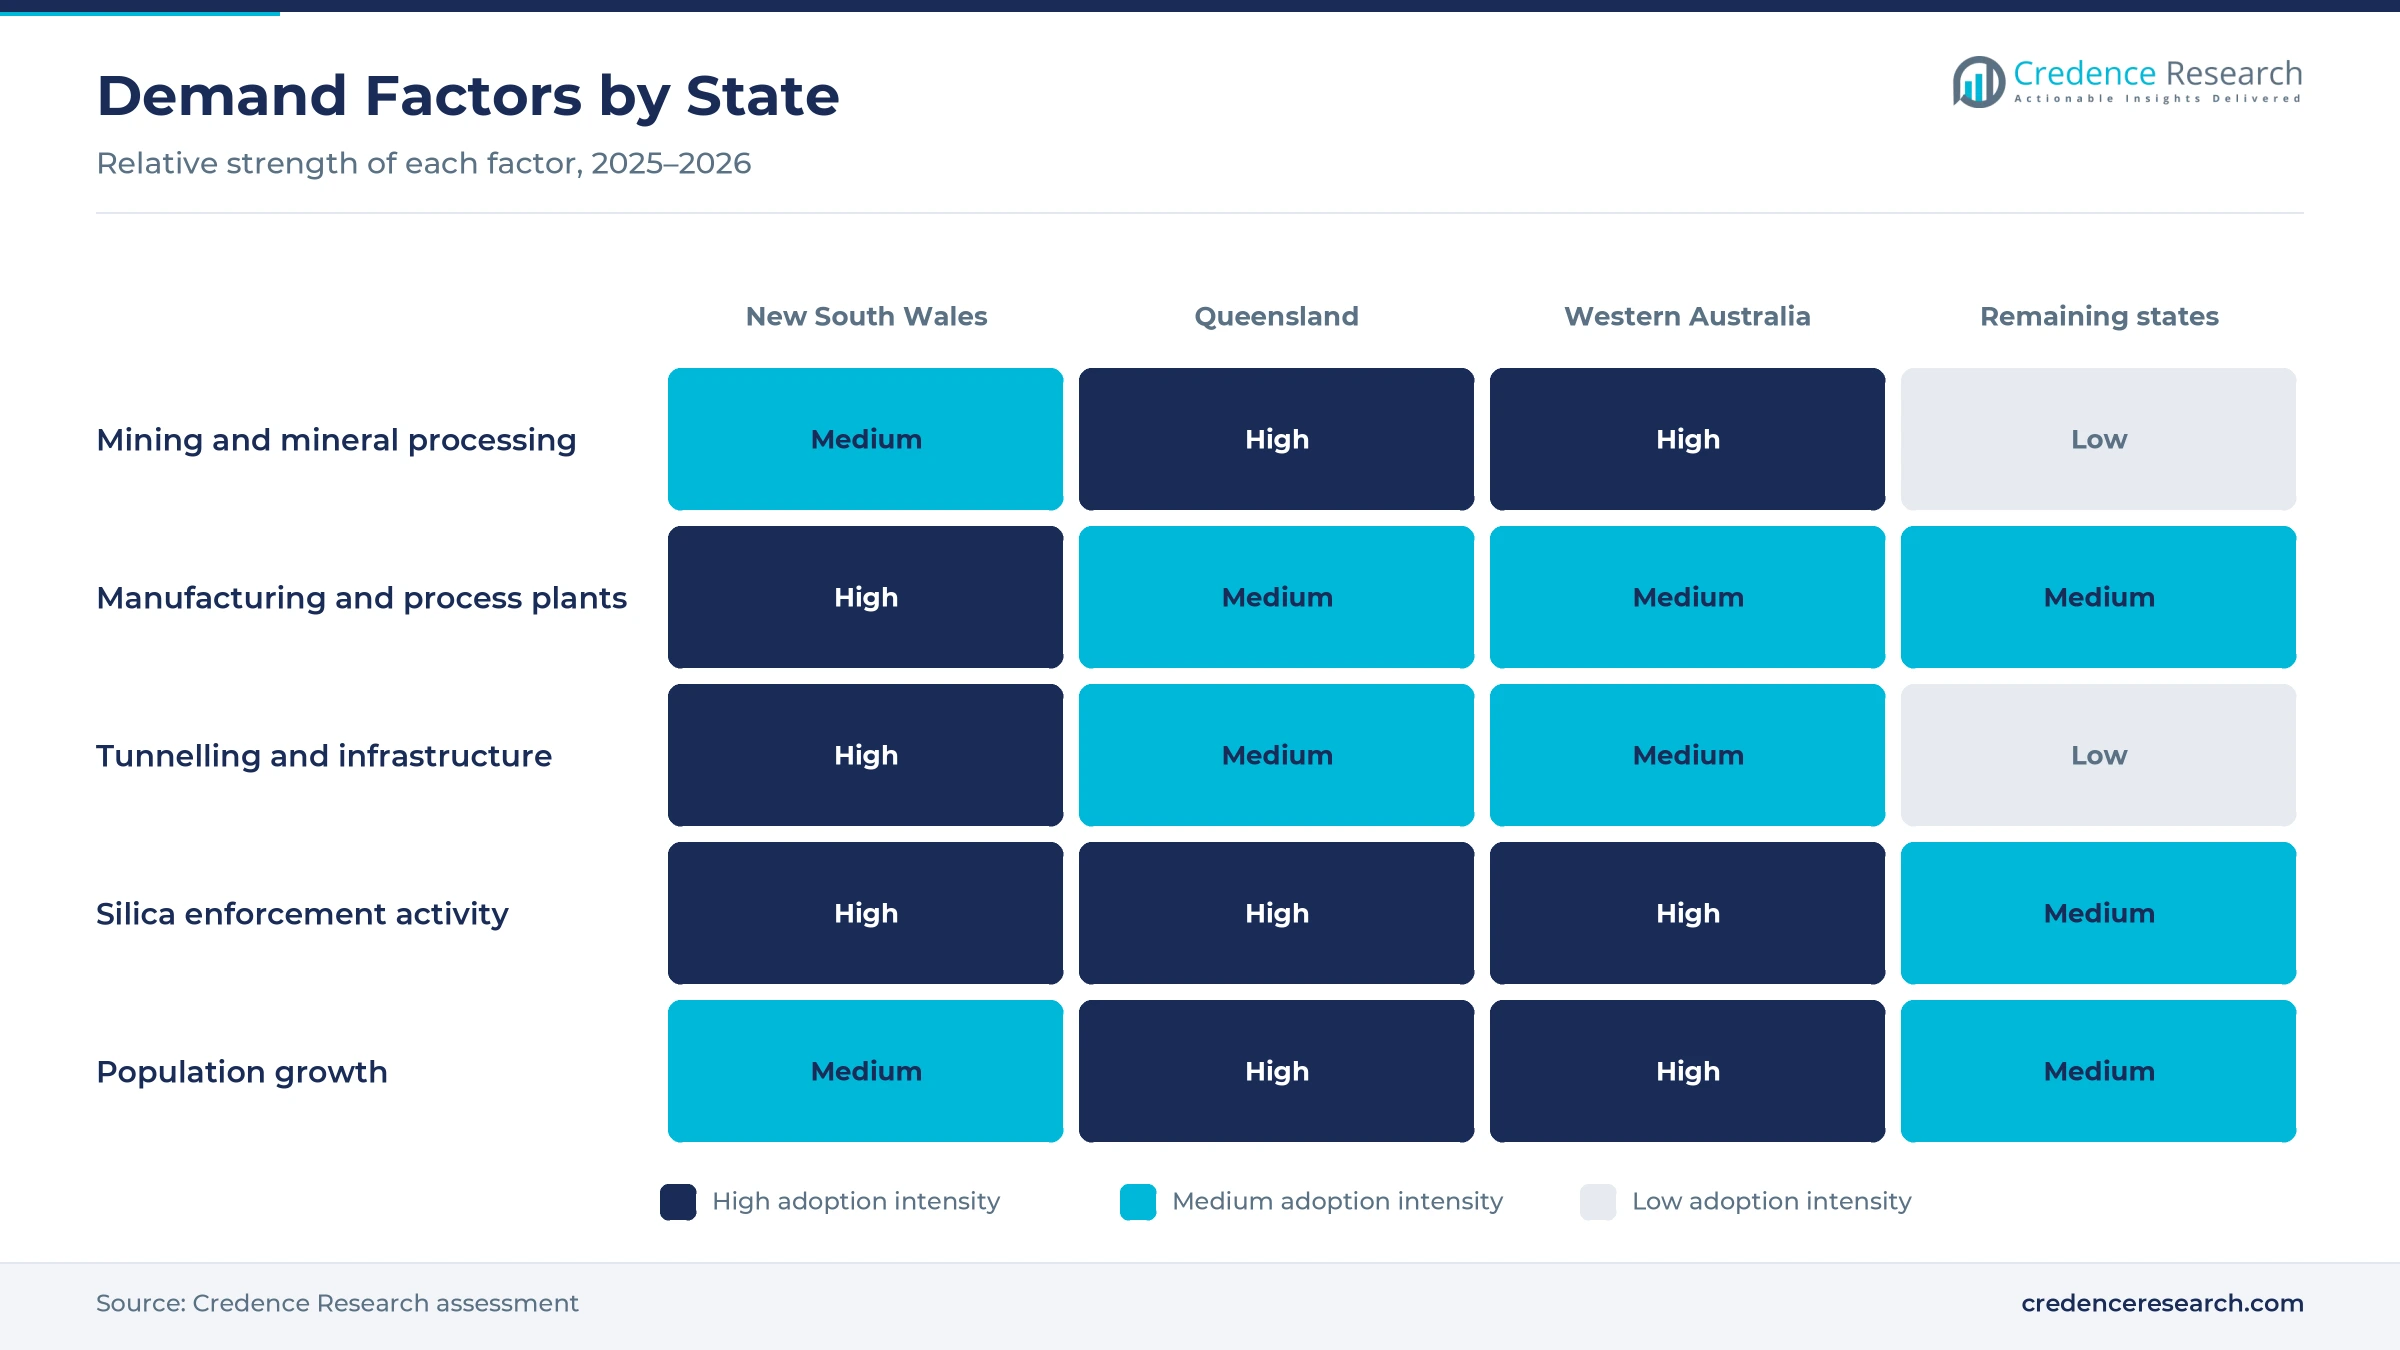
Silica exposure control lifts demand, because employers must keep respirable crystalline silica below legal limits, and source capture is the main engineering control. The exposure standard for respirable crystalline silica has been 0.05 milligrams per cubic meter in most jurisdictions since July 1, 2020. Safe Work Australia confirmed that the ban on making, supplying, processing and installing engineered stone took effect on July 1, 2024. Western Australia also required silica risk control plans for high-risk crystalline silica processing from Sept. 1, 2024. New workplace exposure limits apply nationally from Dec. 1, 2026, with silica among nine substances under further review. As a result, process-machine extraction is the fastest-growing application, as stone, timber and metal workshops add on-tool capture.
Why does infrastructure processing demand raise capture needs?
Infrastructure processing demand raises capture needs, because tunnelling, quarrying and concrete work release silica dust on large projects. Infrastructure Australia reported in November 2025 that the five-year major public infrastructure pipeline grew $29 billion to $242 billion. Transport accounts for $129 billion, more than half of that pipeline, which includes road and rail tunnels. SafeWork NSW has carried out more than 100 inspections at Sydney tunnelling sites since January 2024, according to the NSW Government. A draft tunnelling code released in November 2025 also proposes stronger engineering controls such as ventilation. In turn, construction and infrastructure grow at 8.20% a year, the fastest end-use rate.
How does industrial installed-base renewal support sales?
Industrial installed-base renewal supports sales, because ageing collectors, fans and ducting lose efficiency and need replacement filters, upgrades or full rebuilds. Industry including construction contributed about 23.9% of gross domestic product in 2025, according to World Bank data, which keeps a large plant base in operation. Donaldson has manufactured at Wyong on the New South Wales Central Coast since 1973 and continues to expand that facility. Camfil Australia released its Gold Series III collector in November 2025, citing longer filter life and lower pressure drop. Airtight Solutions also revised its pulse-jet design into the Australian-made APM collector. As a result, collector equipment holds a 42.0% share of 2025 value, as plants replace units with fans and blowers matched to new filters.
Why does mining throughput keep collectors in demand?
Mining throughput keeps collectors in demand, because every crusher, conveyor transfer and storage shed needs dust capture to protect workers and meet emission permits. Queensland mines must keep respirable coal dust below 1.5 milligrams per cubic meter and silica below 0.05 milligrams, according to the Queensland Government. Resources and energy exports are forecast at $405 billion in 2025-26 and $416 billion in 2026-27, according to the federal resources minister. Onslow Iron began loading its first ore in May 2024 and is designed to ship 35 million metric tons a year. Luehr Filter supplied reverse-air bag systems for its iron ore storage shed. As a result, mining holds a 39.0% share of 2025 value.
Local service reach and low-energy designs gain ground
How is the shift to direct local service changing supply?
The shift to direct local service is changing supply, because operators want engineering support, spare filters and repairs close to their sites. Nederman acquired its Brisbane distributor Fume & Dust Control in June 2026 after 25 years of cooperation, adding seven employees and a Queensland presence. Nederman already operated in Victoria and New South Wales before the deal, so the purchase widens its national reach. Fowlerex runs offices in Sydney, Queensland and Western Australia, and builds stainless steel scrubbers in its own factory. Donaldson also makes about 70% of the quantity of its heavy-duty air filters sold in Australasia in Australia, from a Wyong base it has used since 1973. As a result, direct engineering sales hold a 49.0% share of 2025 value, the largest channel share.
Why is the rise of low-energy reverse-air systems notable?
The rise of low-energy reverse-air systems is notable, because compressed air is costly at remote mines that generate their own power. Luehr Filter says mining companies have bought dozens of its horizontal reverse-air systems across Australia, and these systems need no compressed air. Its oval bag design avoids bag-to-bag contact, which reduces abrasion and supports longer filter bags life. The company has supplied the Australian market since 1982 and marked 20 years of service to mining in 2025. Buyers cited longer bag life, lower emissions and lower energy use as key reasons for choosing these systems. In turn, transfer-point capture holds a 41.0% share of 2025 value.
Can wet and electrostatic collection open new niches?
Wet and electrostatic collection opens new niches, because gold rooms, leaching tanks and acid processing release fumes and sticky particles that dry filters cannot handle well. Fowlerex supplies wet scrubbers, bag houses and wet electrostatic precipitators, and has redesigned its precipitators from a tubular to a hexagonal layout. The company has designed dust and fume systems for more than 50 years and exports to Africa, Mongolia and the Middle East. Gold export earnings are also forecast to peak at around $73 billion in 2026-27, which supports processing upgrades. As a result, Western Australia is the fastest-growing state in the forecast, as gold and iron ore plants expand capture systems.
Is there room for compliance-driven retrofits in workshops?
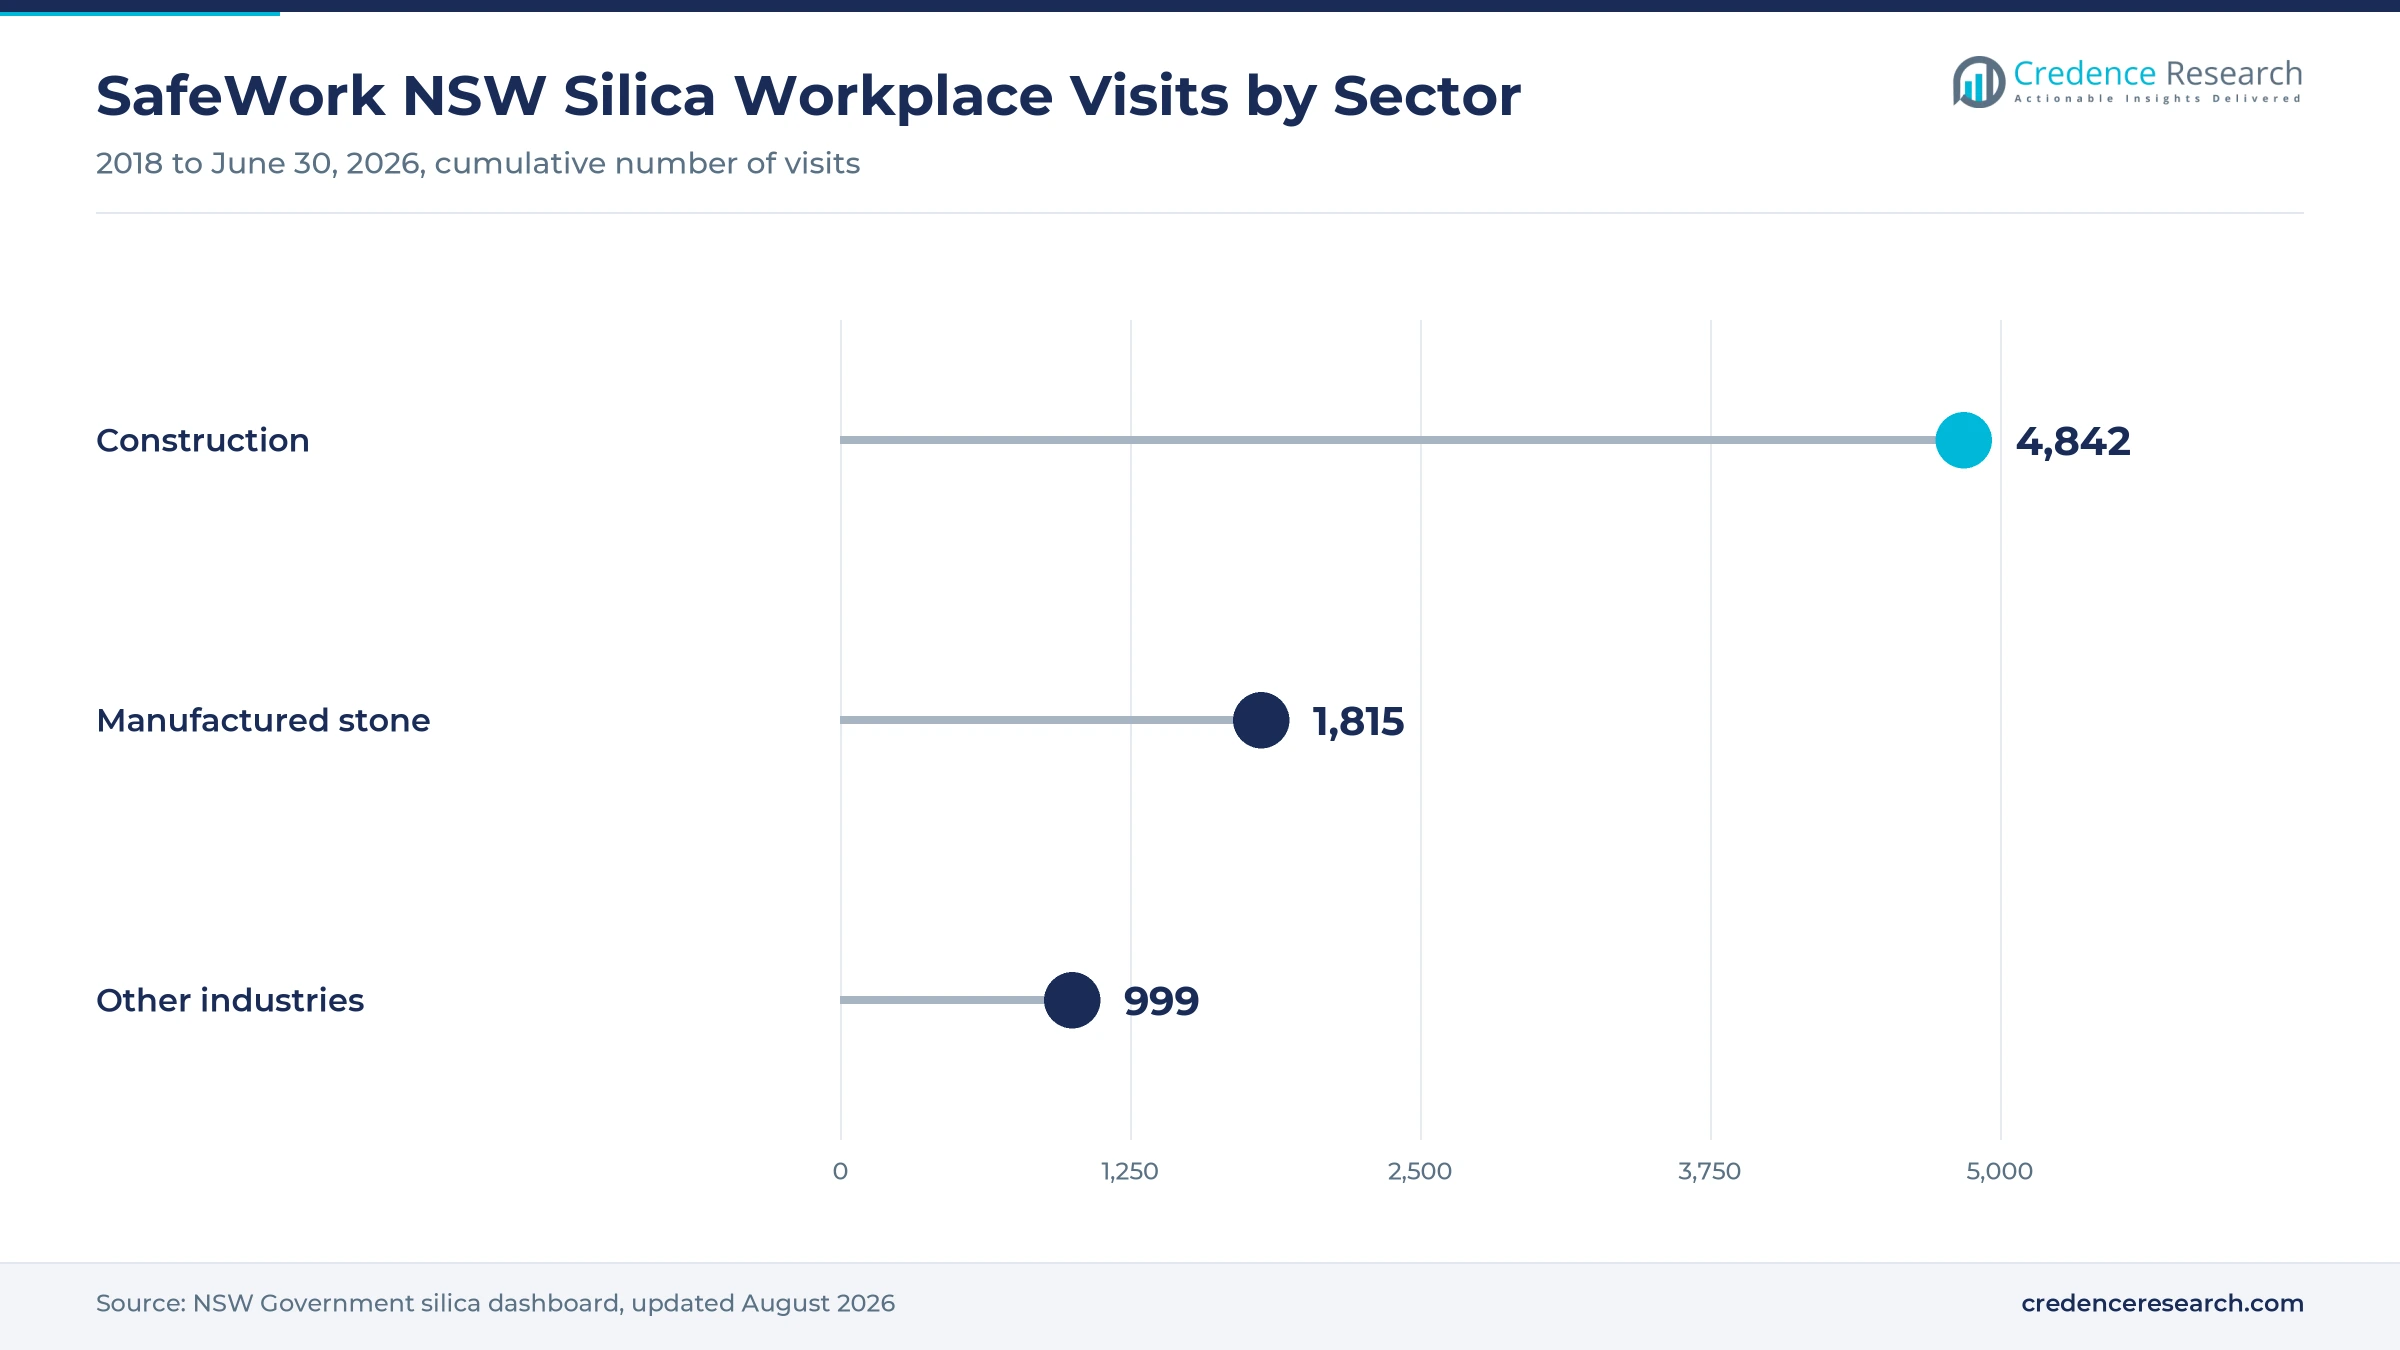
Compliance-driven retrofits create room for suppliers, because many stone, timber and construction workshops still rely on older or undersized extraction. SafeWork NSW issued 160 silica-related notices in the year to June 30, 2026, and recorded 52 silicosis cases over the same period. Its silica visit program has made 7,647 workplace visits since 2018, including 4,842 construction visits. Airtight Solutions positions its Australian-made pulse-jet collector for stone masonry, mining, powders and light foundry work. In turn, contractor procurement grows at 7.75% a year, the fastest channel rate, as builders and tunnelling contractors buy extraction packages alongside air pollution control systems for project sites.
Energy costs, explosion risk and skills test operators
How do energy costs weigh on operators?
Energy costs weigh on operators, because large fans and compressed-air cleaning run for every hour a plant operates. Higher power prices raise the running cost of each collector, especially at remote sites. As a result, some operators delay upgrades or run systems below design airflow. Suppliers respond with variable-speed drives, reverse-air cleaning and low-pressure-drop filters that cut power use while keeping capture velocity at each hood and filter life within the planned maintenance cycle.
Why does combustible material raise explosion risk?
Combustible material raises explosion risk, because fine coal, grain, timber and metal particles can ignite inside collectors and ducting. Operators must add explosion vents, isolation valves and spark detection, which raises project cost. In turn, smaller plants may defer new installations until budgets and safety approvals allow the work. Suppliers respond with certified explosion protection packages, risk assessments and design guidance that help buyers meet safety rules without oversizing equipment or adding unnecessary cost to each project.
How do skills gaps slow maintenance and projects?
Skills gaps slow maintenance and projects, because ventilation engineers, occupational hygienists and service technicians are in short supply. Infrastructure Australia estimates the public pipeline is 141,000 workers short of its needs. As a result, filter changes and airflow testing can be delayed at remote mines. Suppliers respond with remote monitoring, service contracts and training that help site teams maintain systems between visits and spot falling airflow before limits are exceeded.
Why do suppression methods limit some capture sales?
Suppression methods limit some capture sales, because water sprays, fogging and chemical suppressants cost less on haul roads and stockpiles. Operators often choose suppression first and add ducted capture only where limits are exceeded. In turn, suppliers of ducted equipment lose open-area work on haul roads, stockpiles and unsealed yards across mining regions. Engineering firms respond by targeting enclosed transfer points and machines, where capture removes particles more reliably than sprays and supports compliance records for regulators.
Sydney plants lead while Pilbara mining lifts the west
| State | Value, 2025 (USD million) | Share, 2025 | CAGR, 2026–2035 |
|---|---|---|---|
| New South Wales | 56.0 | 44.3% | 7.05% |
| Queensland | 34.3 | 27.1% | 7.45% |
| Western Australia | 29.0 | 22.9% | 7.55% |
| Remaining States and Territories | 7.2 | 5.7% | 6.85% |
Why do Sydney plants and tunnels keep New South Wales ahead?
New South Wales held a 44.3% share of 2025 value and grows at 7.05% a year, because Sydney, the Hunter and the Central Coast concentrate manufacturing, quarrying and tunnel construction. NSW has recorded 516 silicosis cases and 36 deaths since 2017, which keeps regulators focused on silica controls. Donaldson manufactures at Wyong, while Airtight Solutions builds collectors at Wetherill Park. However, population growth of 1.1% a year is slower than in Queensland and Western Australia.
How does Queensland support mining extraction demand?
Queensland held a 27.1% share of 2025 value and grows at 7.45% a year, because coal mines, metal refineries and ports need capture at crushers and transfer points. Queensland coal mines must meet respirable coal dust and silica limits that took effect on Sept. 1, 2020. Nederman entered Queensland through its June 2026 acquisition, and Fowlerex also runs an office in the state. The state population grew 1.6% in the year to March 2026.
Why is Western Australia the fastest-growing state?
Western Australia held a 22.9% share of 2025 value and grows fastest at 7.55% a year, because iron ore, gold and other mineral projects keep adding crushing, conveying and storage capacity across the region. Onslow Iron in the West Pilbara is designed to ship 35 million metric tons a year. The state introduced crystalline silica processing rules in September 2024 and recorded the fastest state population growth at 2.1% a year.
How do the remaining states and territories contribute?
The remaining states and territories held a 5.7% share of 2025 value and grow at 6.85% a year, because the client-defined split assigns most heavy mining and tunnelling demand to the three larger zones. Victoria, South Australia, Tasmania and the territories still add demand from food, timber and metal processing. Nederman already operated in Victoria before its Queensland acquisition, which supports service coverage in the south.
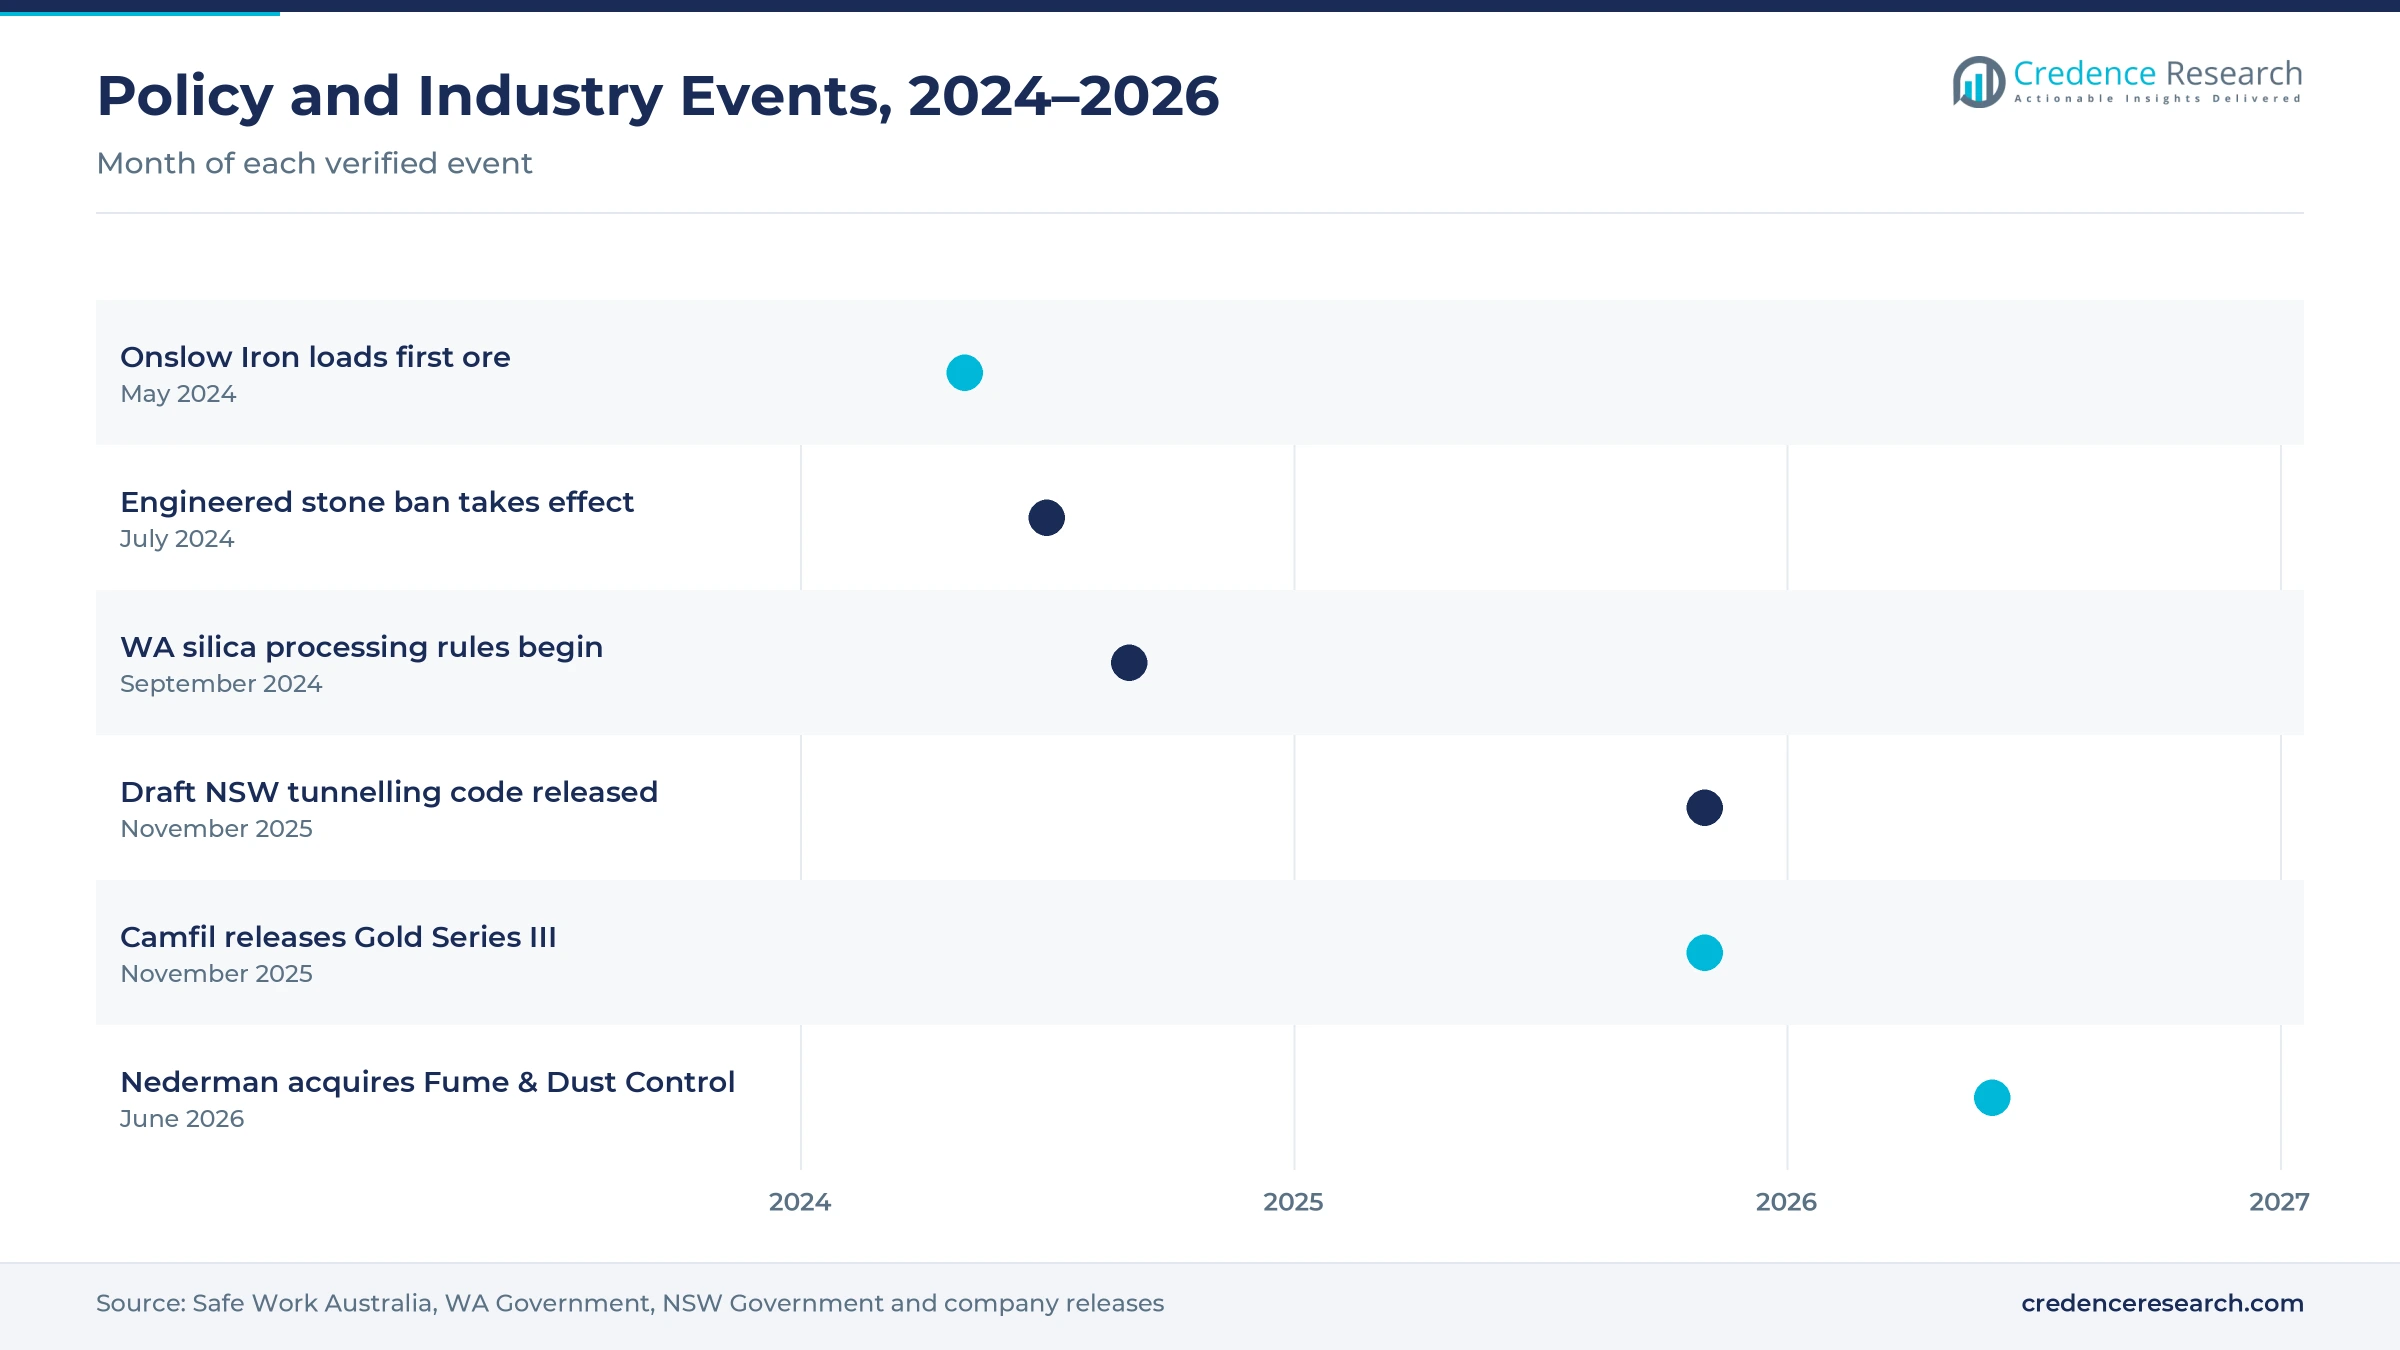
Silica bans, mine starts and acquisitions from 2024 to 2026
| Development | Status and market relevance |
|---|---|
| In May 2024, Onslow Iron began loading its first ore in the West Pilbara. | Designed to ship 35 million metric tons a year, adding capture needs at storage sheds |
| In July 2024, the national ban on engineered stone took effect across Australia. | Raised regulator focus on silica controls in workshops and construction |
| In September 2024, Western Australia began crystalline silica processing rules. | Requires risk control plans for high-risk silica work |
| In November 2025, Camfil Australia released its Gold Series III collector. | Targets mining, food, chemical and metalworking dust |
| In June 2026, Nederman acquired Brisbane distributor Fume & Dust Control. | Adds a direct presence in Queensland |
Pulse-jet, reverse-air and wet systems shape supply
- Pulse-jet dry filtration cleans bags or cartridges with short bursts of compressed air, which keeps airflow steady at crushers, machines and silos.
- Reverse-air collection cleans filter bags with low-pressure air flowing backward, which removes the need for compressed air at remote mines.
- Wet scrubbing and wet electrostatic precipitation capture sticky particles and fumes in water or on charged plates, which suits gold rooms, leaching and acid processing.
- Modular ducting and smart controls link hoods to collectors with clamp-together sections, sensors and variable-speed fans, which cut installation time and energy use.
Need a Custom Version of This Report?
Tailor the scope, geography, or segments to your exact requirements.
- Custom geography or segment scope
- Direct access to our analyst team
Global filter groups and local engineers compete
Competition combines global filtration groups with local engineering firms that design systems for each site. Donaldson manufactures filters at Wyong, while Camfil Australia sells Gold Series collectors for mining, food and metalworking. Nederman serves Victoria and New South Wales and added Queensland through its June 2026 acquisition. Luehr Filter supplies reverse-air systems to mines, and Fowlerex supplies wet scrubbers, bag houses and wet precipitators from offices in three states. Airtight Solutions builds Australian-made pulse-jet collectors at Wetherill Park, Nordfab supplies collectors and modular ducting, and WAM Australia supplies silo venting filters. Rivals compete on engineering design, energy use, filter life and local service. Filtaire Products and Total Air Pollution Control are listed suppliers whose recent local activity could not be confirmed for this edition.
Companies profiled and their roles in this market
| Company | Type | Role in the market |
|---|---|---|
| Donaldson Australasia Pty Ltd | Filter manufacturer | Makes heavy-duty filters at Wyong since 1973 |
| Camfil Australia Pty Ltd | Collector supplier | Released Gold Series III collector in November 2025 |
| Nederman Australia | Extraction supplier | Acquired Brisbane distributor Fume & Dust Control in June 2026 |
| Luehr Filter Australia Pty Ltd | Engineering supplier | Supplies reverse-air bag systems to mines since 1982 |
| Fowlerex Technologies | Engineering manufacturer | Makes wet scrubbers and wet precipitators |
| Airtight Solutions | Collector manufacturer | Builds Australian-made pulse-jet collectors at Wetherill Park |
| Nordfab Pty Ltd | Equipment supplier | Supplies collectors, fume arms and modular ducting |
| WAM Australia Pty Ltd | Bulk handling supplier | Supplies silo venting filters with automatic cleaning |
Credence Research view on Australian dust extraction
Credence Research's view is that Australian demand for ducted extraction will grow faster than general industrial spending because silica rules, mining output and infrastructure projects all require source capture. Collector equipment remains the core of the market, while fans, controls and contractor packages add faster growth. Export earnings above $400 billion and a large public pipeline give demand a broad base. However, energy costs, explosion risk and skills gaps will slow some projects. Suppliers with local service teams and low-energy designs should gain share fastest.
How the Australian dust extraction estimate was built
The report uses 2025 as the base year on a calendar basis, and market values come from the Credence Research model. That model combines workplace safety rules, mining exposure limits, regulator enforcement data, resources export forecasts, World Bank industry data, the public infrastructure pipeline and company information on products, sites and acquisitions. Segment splits and state growth rates are Credence Research estimates, while state shares follow the client-defined split. Sources used are official statistics, government releases, trade press and company websites, and no interviews or surveys were used.
Silica compliance and mining carry demand to 2035
Sales of ducted extraction systems are expected to reach USD 254.3 million by 2035, a 7.26% CAGR during 2026–2035, as silica compliance, mining throughput and infrastructure work keep demand rising. Growth should stay strong through 2030 while tunnelling and mine expansions run at high levels. After that, replacement filters, controls and retrofits will carry more growth as new projects slow. Lower commodity prices would reduce this outlook, while tighter silica limits under the new exposure framework would raise it. Suppliers with local service and low-energy designs are expected to gain the most.
Frequently Asked Questions
How big is the Australia industrial duct dust collection market?
Which product type leads ducted extraction in Australia?
Which state leads the Australia industrial duct dust collection market?
Why does mining lead end-use demand?
What drives demand for ducted extraction in Australia?
Which end use is growing fastest?
Who are the leading suppliers in Australia?
What are the main challenges for suppliers?
Table of Content
Chapter 1 Market Segmentation
- 1.1 Segmentation Framework
- 1.1.1 Product and Service Classification
- 1.1.2 Application and End-Use Classification
- 1.1.3 Technology and Solution Classification
- 1.1.4 Customer and Distribution Channel Classification
- 1.1.5 Geographic Segmentation
- 1.1.6 Market Segment Definitions and Boundaries
- 1.2 By Product Type
- 1.2.1 Collector Equipment
- 1.2.2 Ducting Systems
- 1.2.3 Filter Media and Parts
- 1.2.4 Air Movement and Controls
- 1.3 By End-Use Industry
- 1.3.1 Mining and Mineral Processing
- 1.3.2 Manufacturing and Process Industries
- 1.3.3 Construction and Infrastructure
- 1.3.4 Utilities and Energy
- 1.4 By Application
- 1.4.1 Transfer-Point Capture
- 1.4.2 Process-Machine Extraction
- 1.4.3 Bulk-Storage Venting
- 1.5 By Sales Channel
- 1.5.1 Direct Engineering Sales
- 1.5.2 Technical Distribution
- 1.5.3 Contractor Procurement
- 1.6 By State
- 1.6.1 New South Wales
- 1.6.2 Queensland
- 1.6.3 Western Australia
- 1.6.4 Remaining States and Territories
Chapter 2 Introduction
- 2.1 Report Objectives and Scope
- 2.2 Product Definition and Industry Terminology
- 2.3 Market Inclusions and Exclusions
- 2.4 Research Process
- 2.4.1 Primary Research and Expert Interviews
- 2.4.2 Secondary Research and Source Review
- 2.4.3 Top-Down and Bottom-Up Estimation
- 2.4.4 Data Triangulation and Verification
- 2.5 Market Size Measurement Basis
- 2.5.1 2025: USD 126.5 million → 2035: USD 254.3 million
- 2.6 Historical and Forecast Reference Periods
- 2.6.1 Historical Period: 2018-2025
- 2.6.2 Base Year: 2025
- 2.6.3 Forecast Period: 2025-2035
- 2.7 Research Assumptions and Limitations
Chapter 3 Executive Summary
- 3.1 Market Snapshot and Key Findings
- 3.2 Base-Year Market Size, 2025
- 3.3 Forecast Market Size, 2035
- 3.4 Revenue and Volume Growth Outlook
- 3.5 Key Demand and Supply Indicators
- 3.6 Leading Market Segments
- 3.7 Fastest-Growing Market Opportunities
- 3.8 Regional Performance Highlights
- 3.9 Technology and Industry Transformation
- 3.10 Competitive Landscape Summary
- 3.11 Analyst View and Strategic Implications
Chapter 4 Australia Industrial Duct Dust Collection Market Trends and Developments
- 4.1 Historical Industry Development, 2018-2025
- 4.2 Recent Market Trends and Developments
- 4.3 Demand and Customer Behavior Trends
- 4.4 Technology and Product Innovation
- 4.5 Artificial Intelligence, Automation and Digitalization
- 4.6 Local Manufacturing and Supply Chain Realignment
- 4.7 Industry Partnerships, Mergers and Acquisitions
- 4.8 Sustainability and Circular Economy Developments
- 4.9 Government and Private Sector Investment Trends
- 4.10 Emerging Business Models and Commercialization
- 4.11 Industry Developments and Announcements
Chapter 5 Australia Industrial Duct Dust Collection Market Production, Supply and Demand Analysis
- 5.1 Demand Trend and Consumption Analysis, 2018-2025
- 5.2 Demand Forecast, 2025-2035
- 5.3 Production and Output Trend, 2018-2025
- 5.4 Production and Output Forecast, 2025-2035
- 5.5 Installed Capacity and Capacity Utilization
- 5.6 Company-Wise Production Plants and Statistics
- 5.6.1 Installed Production Capacity
- 5.6.2 Actual Production
- 5.6.3 Planned Capacity and Expansion Targets
- 5.7 Supply Chain Structure and Procurement Trends
- 5.8 Supply-Demand Gap and Bottlenecks
- 5.9 Import Dependence and Sourcing Structure
- 5.10 Contract Manufacturing and Outsourcing
- 5.11 Regional Supply and Demand Concentration
Chapter 6 Australia Industrial Duct Dust Collection Market Pricing Analysis
- 6.1 Pricing Structure and Measurement
- 6.2 Historical Pricing Trends, 2018-2025
- 6.3 Pricing Outlook, 2025-2035
- 6.4 Average Selling Price and Unit Economics
- 6.5 Pricing by Product and Market Segment
- 6.6 Geographic Pricing Differences
- 6.7 Key Input, Energy, Labor and Logistics Costs
- 6.8 Contract Pricing and Purchasing Models
- 6.9 Pricing Sensitivity and Competitive Positioning
- 6.10 Price, Margin and Profitability Implications
Chapter 7 Australia Industrial Duct Dust Collection Market Dynamics
- 7.1 Market Growth Drivers
- 7.1.1 Demand-Side Drivers
- 7.1.2 Technology and Innovation Drivers
- 7.1.3 Infrastructure and Investment Drivers
- 7.1.4 Regulatory and Policy Drivers
- 7.2 Market Restraints
- 7.2.1 Cost and Affordability Constraints
- 7.2.2 Technology and Adoption Barriers
- 7.2.3 Supply Chain and Operational Constraints
- 7.3 Market Challenges
- 7.3.1 Competitive Pressure and Margin Erosion
- 7.3.2 Skills, Infrastructure and Implementation Gaps
- 7.4 Emerging Market Opportunities
- 7.5 Market Dynamics Impact and Time-Horizon Assessment
Chapter 8 Australia Industrial Duct Dust Collection Value Chain Analysis
- 8.1 Industry Value Chain Overview
- 8.2 Upstream Suppliers and Critical Inputs
- 8.3 Technology and Component Providers
- 8.4 Manufacturing or Service Delivery
- 8.5 Distribution, Channel Partners and Integrators
- 8.6 Downstream Applications and End Users
- 8.7 Value Addition and Profit Pools
- 8.8 Vertical Integration and Outsourcing
- 8.9 Supplier Concentration and Risk
- 8.10 Supply Chain Localization and Resilience
Chapter 9 Australia Industrial Duct Dust Collection Market Regulations and Policies
- 9.1 Relevant Laws, Standards and Compliance Frameworks
- 9.2 Product, Service, Safety and Quality Requirements
- 9.3 Government Policies, Incentives and Subsidies
- 9.4 Imports, Exports and Trade Barriers
- 9.5 Public Procurement and Local Content Requirements
- 9.6 Environmental and Sustainability Compliance
- 9.7 Upcoming Policy Changes and Market Implications
Chapter 10 Australia Industrial Duct Dust Collection Market Hotspots and Opportunities
- 10.1 Market Opportunity Mapping and Growth Hotspots
- 10.2 High-Growth Applications and Customer Groups
- 10.3 Underserved Markets and White-Space Opportunities
- 10.4 Emerging Technology and Product Opportunities
- 10.5 New Capacity and Investment Hotspots
- 10.6 Market Entry and Expansion Opportunities
- 10.7 Distribution and Partnership Opportunities
- 10.8 Near-Term and Long-Term Commercial Potential
- 10.9 Opportunity Attractiveness and Execution Risks
Chapter 11 Australia Industrial Duct Dust Collection Market Outlook, 2025-2035
- 11.1 Market Size and Analysis
- 11.1.1 Revenue (Market Measurement: 2025: USD 126.5 million → 2035: USD 254.3 million)
- 11.1.2 Market Volume and Quantity Sold
- 11.1.3 Historical Market Size, 2018-2025
- 11.1.4 Base-Year Market Size, 2025
- 11.2 Market Forecast, 2025-2035
- 11.2.1 Revenue Forecast to 2035
- 11.2.2 Volume Forecast to 2035
- 11.2.3 CAGR and Year-on-Year Growth
- 11.2.4 Incremental Revenue Opportunity
- 11.3 Forecast Assumptions and Scenario Analysis
- 11.3.1 Base-Case Forecast
- 11.3.2 Optimistic and Conservative Scenarios
- 11.3.3 Technology, Pricing and Policy Sensitivities
- 11.4 Market Attractiveness and Growth Outlook
Chapter 12 Australia Industrial Duct Dust Collection Market Segmentation and Outlook
- 12.1 Segmentation Summary and Market Shares, 2025
- 12.2 Largest and Fastest-Growing Segments
- 12.3 By Product Type - Market Size and Forecast, 2025-2035
- 12.3.1 Segment Definition and Scope
- 12.3.2 Historical Market Size, 2018-2025
- 12.3.3 Revenue Forecast, 2025-2035
- 12.3.4 Volume Forecast, 2025-2035
- 12.3.5 Base-Year Market Share, 2025
- 12.3.6 Segment CAGR and Growth Drivers
- 12.3.7 Subsegment Market Size and Forecast
- 12.3.7.1 Collector Equipment
- 12.3.7.2 Ducting Systems
- 12.3.7.3 Filter Media and Parts
- 12.3.7.4 Air Movement and Controls
- 12.3.8 Subsegment Pricing and Adoption Trends
- 12.3.9 Leading Suppliers and Competition
- 12.3.10 Regional Demand and Opportunities
- 12.4 By End-Use Industry - Market Size and Forecast, 2025-2035
- 12.4.1 Segment Definition and Scope
- 12.4.2 Historical Market Size, 2018-2025
- 12.4.3 Revenue Forecast, 2025-2035
- 12.4.4 Volume Forecast, 2025-2035
- 12.4.5 Base-Year Market Share, 2025
- 12.4.6 Segment CAGR and Growth Drivers
- 12.4.7 Subsegment Market Size and Forecast
- 12.4.7.1 Mining and Mineral Processing
- 12.4.7.2 Manufacturing and Process Industries
- 12.4.7.3 Construction and Infrastructure
- 12.4.7.4 Utilities and Energy
- 12.4.8 Subsegment Pricing and Adoption Trends
- 12.4.9 Leading Suppliers and Competition
- 12.4.10 Regional Demand and Opportunities
- 12.5 By Application - Market Size and Forecast, 2025-2035
- 12.5.1 Segment Definition and Scope
- 12.5.2 Historical Market Size, 2018-2025
- 12.5.3 Revenue Forecast, 2025-2035
- 12.5.4 Volume Forecast, 2025-2035
- 12.5.5 Base-Year Market Share, 2025
- 12.5.6 Segment CAGR and Growth Drivers
- 12.5.7 Subsegment Market Size and Forecast
- 12.5.7.1 Transfer-Point Capture
- 12.5.7.2 Process-Machine Extraction
- 12.5.7.3 Bulk-Storage Venting
- 12.5.8 Subsegment Pricing and Adoption Trends
- 12.5.9 Leading Suppliers and Competition
- 12.5.10 Regional Demand and Opportunities
- 12.6 By Sales Channel - Market Size and Forecast, 2025-2035
- 12.6.1 Segment Definition and Scope
- 12.6.2 Historical Market Size, 2018-2025
- 12.6.3 Revenue Forecast, 2025-2035
- 12.6.4 Volume Forecast, 2025-2035
- 12.6.5 Base-Year Market Share, 2025
- 12.6.6 Segment CAGR and Growth Drivers
- 12.6.7 Subsegment Market Size and Forecast
- 12.6.7.1 Direct Engineering Sales
- 12.6.7.2 Technical Distribution
- 12.6.7.3 Contractor Procurement
- 12.6.8 Subsegment Pricing and Adoption Trends
- 12.6.9 Leading Suppliers and Competition
- 12.6.10 Regional Demand and Opportunities
- 12.7 By State - Market Size and Forecast, 2025-2035
- 12.7.1 Segment Definition and Scope
- 12.7.2 Historical Market Size, 2018-2025
- 12.7.3 Revenue Forecast, 2025-2035
- 12.7.4 Volume Forecast, 2025-2035
- 12.7.5 Base-Year Market Share, 2025
- 12.7.6 Segment CAGR and Growth Drivers
- 12.7.7 Subsegment Market Size and Forecast
- 12.7.7.1 New South Wales
- 12.7.7.2 Queensland
- 12.7.7.3 Western Australia
- 12.7.7.4 Remaining States and Territories
- 12.7.8 Subsegment Pricing and Adoption Trends
- 12.7.9 Leading Suppliers and Competition
- 12.7.10 Regional Demand and Opportunities
- 12.8 Segment Growth Comparison
- 12.9 Segment Attractiveness and Priority Matrix
Chapter 13 Australia Industrial Duct Dust Collection End-Use and Application Market Outlook
- 13.1 End-Use Industry and Customer Demand Structure
- 13.2 Leading Applications and Customer Groups
- 13.3 End-Use Market Size, Share and Forecast
- 13.4 Major End-Use Industry Deep Dives
- 13.4.1 Customer Requirements and Use Cases
- 13.4.2 Demand and Replacement Cycles
- 13.4.3 Technical and Regulatory Considerations
- 13.4.4 Purchasing and Procurement Models
- 13.4.5 Leading Vendors and Distribution Channels
- 13.4.6 Forecast and Commercial Opportunities
- 13.5 Emerging Applications and Cross-Segment Demand
- 13.6 End-Use Industry Investment Priorities
Chapter 14 Australia Industrial Duct Dust Collection Geographic Market Outlook, 2025-2035
- 14.1 Domestic Market Distribution and Demand Clusters
- 14.2 State- or Province-Wise Market Size and Forecast, 2025-2035
- 14.3 City and Metropolitan Market Outlook
- 14.4 Industrial, Manufacturing and Commercial Clusters
- 14.5 Geographic Concentration of Key End Users
- 14.6 Local Pricing and Purchasing Differences
- 14.7 Domestic Production Facilities and Capacity Map
- 14.8 Local Infrastructure and Project Pipeline
- 14.9 State-Level Policy and Incentive Differences
- 14.10 Subnational Investment Hotspots and Opportunities
- 14.11 Distribution and Logistics Networks
- 14.12 Domestic Competitive Footprint
Chapter 15 Australia Industrial Duct Dust Collection Technology, Innovation and Sustainability Outlook
- 15.1 Technology Landscape and Maturity
- 15.2 Product, Process and Service Innovation
- 15.3 AI, Automation and Digital Tools in the Industry
- 15.4 Technology Adoption and Performance Benchmarking
- 15.5 Innovation Pipeline and R&D Investment
- 15.6 Patent and Intellectual Property Trends
- 15.7 Energy Efficiency and Resource Management
- 15.8 Sustainability, Recycling and Circularity
- 15.9 Technology Roadmap, 2025-2035
- 15.10 Risks of Obsolescence and Technology Substitution
Chapter 16 Australia Industrial Duct Dust Collection Market Key Strategic Imperatives
- 16.1 Growth and Market Entry Priorities
- 16.2 High-Return Products and Segments
- 16.3 Pricing, Profitability and Cost Optimization
- 16.4 Technology Investment and Product Differentiation
- 16.5 Supply Chain Localization and Resilience
- 16.6 Distribution and Customer Acquisition
- 16.7 Partnership, Acquisition and Capacity Strategy
- 16.8 Regional Expansion Priorities
- 16.9 Short-, Medium- and Long-Term Actions
Chapter 17 Competition Outlook
- 17.1 Industry Competition Characteristics
- 17.2 Market Structure and Concentration
- 17.3 Market Share and Competitive Positioning, 2025
- 17.4 Company-Wise Revenue and Product Benchmarking
- 17.5 Production and Service Capacity Benchmarking
- 17.6 Technology, Pricing and Differentiation
- 17.7 Regional Footprint and Distribution Strength
- 17.8 Mergers, Acquisitions and Strategic Alliances
- 17.9 New Entrants and Competitive Threats
- 17.10 Porter's Five Forces and Industry Attractiveness
- 17.11 Competitive Outlook, 2025-2035
Chapter 18 Company Profiles
- 18.1 Company Coverage and Selection Criteria
- 18.2 Donaldson Australasia Pty Ltd
- 18.2.1 Business Description
- 18.2.2 Company Ownership and Geographic Presence
- 18.2.3 Product and Service Portfolio
- 18.2.4 Manufacturing and Operating Footprint
- 18.2.5 Production Capacity and Expansion Plans
- 18.2.6 Financial Performance and Investment
- 18.2.7 Market Share and Competitive Position
- 18.2.8 Technology and Innovation Capabilities
- 18.2.9 Strategic Alliances or Partnerships
- 18.2.10 Recent Developments
- 18.2.11 Growth Strategy and Outlook
- 18.3 Nordfab Pty Ltd
- 18.4 Camfil Australia Pty Ltd
- 18.5 Nederman Australia
- 18.6 Filtaire Products
- 18.7 Fowlerex Technologies
- 18.8 Luehr Filter Australia Pty Ltd
- 18.9 WAM Australia Pty Ltd
- 18.10 Total Air Pollution Control
- 18.11 Airtight Solutions
- 18.12 Other Relevant Market Participants
Note: Every listed company is profiled on the structure shown under the first company. The company list is preliminary and may change based on research findings, market developments, data availability and client requirements.
Chapter 19 Disclaimer
- 19.1 Research and Forecast Disclaimer
- 19.2 Data Source and Estimation Limitations
Note: The depth of individual sections depends on data availability for this market. Volume, capacity, trade and other unit-based metrics are included where applicable.

