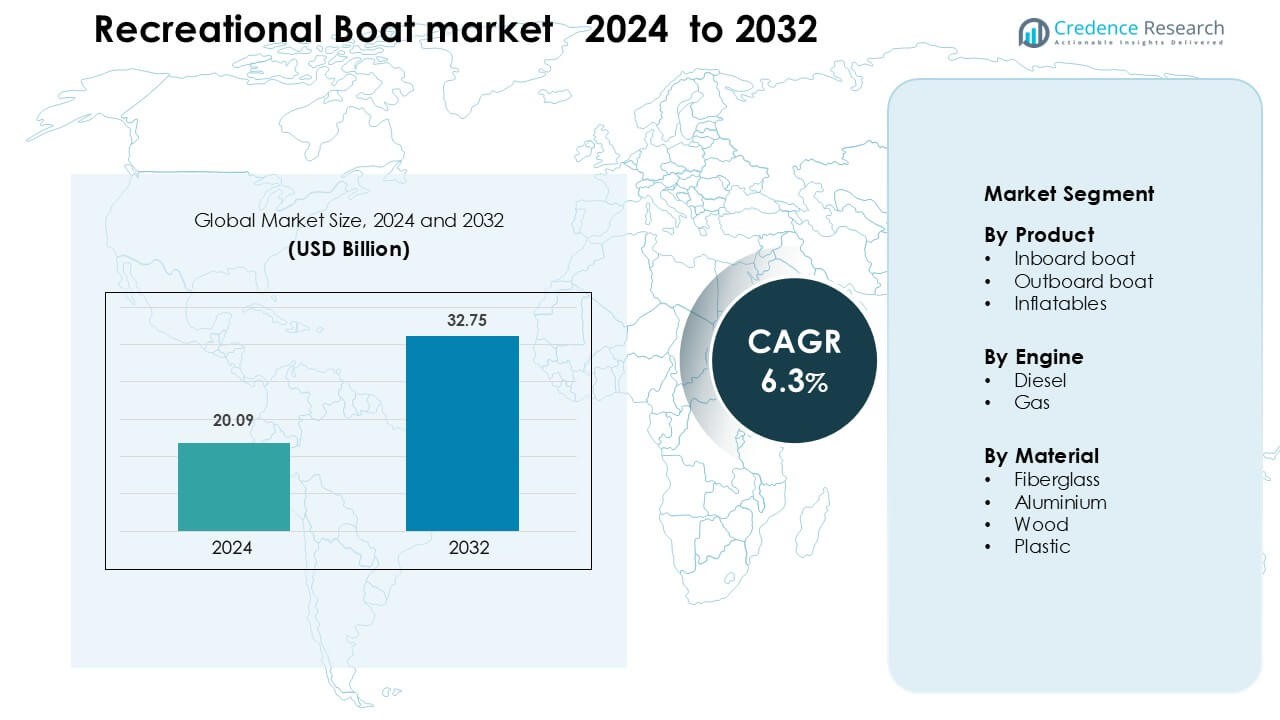
Home » Consumer Goods » Recreational Boat Market

Recreational Boat Market Based on Boat Type (Yachts, Sailboats, Personal Watercrafts, Inflatables, Others) Based on Boat Size (50 Feet) Based on Engine Placement (Outboards, Inboards, Others)-Growth, Future Prospects & Competitive Analysis, 2016 – 2030

Price: $4999

Published: | Report ID: 18518 | Report Format : PDF

Key Highlights of the Report

The global recreational boat market is divided into boat type, boat size, engine placement, engine type, power range, activity type, power source, and region. Engine-powered recreational boats are the most popular, with electric sector and ICE engine being the two principal engine type segments. The Cruising+Watersports sector is predicted to account for the largest market share, with North America dominating the market in 2022.

There are various drivers in the worldwide recreational boat market, including Tourism and water activities are becoming increasingly popular. Furthermore, environmental concerns, high ownership costs, and rigors emission rules for recreational boats are reducing demand. However, the market confronts substantial hurdles, such as environmental concerns, rules, and rising competition from other forms of recreation.

Even so, there are plenty of room for expansion in the global recreational boat market, and the internet market for the industry may help drive up demand for luxury yachts and increase sales in underserved regions. Additionally, there are now more options for financing potential future expansion.

Market Overview

The recreational boat market has been expanding steadily over the past several years and is predicted to do so again between 2023 and 2030 at a CAGR of 6.80%. In 2022, the market was valued at USD 16.9 billion, and in 2030, it is anticipated to grow to USD 26.7 billion.

What are The primary Drivers Of The Global Recreational Boat Market?

Several variables, including a, are what propel the global market for recreational boats. The popularity of both tourism and aquatic activities is rising.

What Are The Major Challenges Faced By The Global Recreational Boat Market?

The global recreational boat market also faces several challenges, including the environmental issues, rules, and increased competition from other recreational pursuits

What Are The Growth Opportunities In The Global Recreational Boat Market?

The recreational boat business has enormous potential for expansion, and the online market for the industry may help sales in underserved regions and increase demand for luxury yachts.

Design Element 2

Access crucial information at unmatched prices!

Request your free sample report today & start making informed decisions powered by Credence Research!

Download Free Sample
CTA Design Element 3

Executive Summary

Overview of the Global Recreational Boat Market

The global market for recreational boats is a well-established sector that caters to a wide range of consumers and is fueled by a variety of factors, such as rising disposable incomes, the popularity of water sports, and developments in technology and design. Despite intense competition, the industry is anticipated to expand over the next few years because to factors like rising earnings, a rise in the demand for luxury boats, and the expanding acceptance of water activities. The market must also overcome a variety of obstacles, including as environmental rules and issues, high operational costs, and growing competition from other leisure pursuits.

Market Definition

The market for boats used mostly for leisure and enjoyment is known as the recreational boat market. This industry is involved in the production, marketing, and distribution of these boats. Among the many types of boats that fall under this category are motorised boats, sailboats, personal watercraft, and inflatable boats. The recreational boat market caters to a wide spectrum of customers, including single people, families, and business operators, and offers a choice of boat types and price points to suit their demands. Manufacturers are vying for market dominance and satisfying consumer demand in a highly competitive market by competing on elements like price, quality, design, and features.

Market Insights

  • Recreational boat demand is predicted to increase by 6.80% between 2023 and 2030, from a value of USD 16.9 billion in 2022 to USD 26.7 billion in 2030.
  • the yacht category is the market leader in 2022,
  • The <30 foot boat size segment is predicted to capture the highest share of the recreational boat market.
  • Outboard boats will account for the majority of the recreational boat market in 2022
  • The electric sector is expected to grow at the fastest rate in the worldwide market.
  • The up to 100 kW power range segment is a large and increasing section in the recreational boat market.
  • The Cruising+Watersports sector is expected to account for the greatest market share.
  • The engine-powered segment is a prominent category in the recreational boat market.
  • North America dominated the market in 2022, accounting for more than 44.4% of worldwide revenue.
  • Tourism and water sports are growing in popularity are the major drivers of the market.
  • At the same time, the main obstacles are environmental issues, high ownership costs, and strict emission regulations for recreational boats to reduce demand.
  • One of the biggest opportunities in the market is to increase demand for luxury yachts by using the online market for the sector.

Segmentation by Boat Type

  • In terms of revenue generation in 2022, the yacht category is the market leader.
  • The sailboat segment is expected to increase significantly in the future years.
  • Another segment is inflatables, which contributes very little to the worldwide recreational boat market as compared to the yacht and sailboat categories.

Segmentation by Boat Size

  • The <30 foot boat size segment is predicted to capture the highest share of the recreational boat market.
  • The 30-50 ft. segment contributes the rest to the demand for recreational boats.

Segmentation by Engine Placement

  • Outboard boats will account for the majority of the recreational boat market in 2022.
  • Inboard boats holds significant share in the market.

Segmentation by Engine Type

  • The electric sector is expected to grow at the highest CAGR rate in the worldwide market.
  • The ICE engine type category is the global market’s second most dominant section.

Segmentation by Power Range

  • The up to 100 kW power range segment is a large and increasing section in the recreational boat market.
  • The power range above 200 kW is a significant section.

Segmentation by Activity Type

  • The Cruising+Watersports sector is expected to account for the greatest market share.
  • The Fishing segment contributes the rest to the demand for recreational boats.

Segmentation by Power source

  • The engine-powered segment is a prominent category in the recreational boat market.
  • In 2022, the sail-powered segment will be a significant category in the recreational boat industry.

Segmentation by Region

  • North America dominated the market in 2022, accounting for more than 44.4% of worldwide revenue.
  • Over the forecast period, the Europe market is expected to grow at the fastest CAGR.
  • Over the projection period, Asia Pacific is expected to increase significantly.
  • The rest of the World, including Latin America, The Middle East, and Africa, contributes the remainder to the demand for recreational boats.

Tourism and the growing popularity of water activities can be attributable to the rising demand for leisure boats. Strict Emission Regulations for Recreational Boats to Reduce Demand, Environmental Concerns, and High Ownership Costs, however, are restricting the market.

The popularity of marine recreational activities such as boating and cruising is growing in the United States. Due to increased boat sales in Florida, California, and New York, the United States alone owned a share of 57.4% in North America in 2022. Over the forecast period, the Europe market is expected to grow at the fastest CAGR. Surging demand for recreational boats in nations such as the United Kingdom, France, Germany, Italy, and Spain is expected to drive regional industry growth. Increased engagement in recreational boating activities is also expected to boost regional market growth.

Over the projection period, the China market is expected to display the highest CAGR of 6.4%. The availability of water resources, including as large coastline, inland lakes, and rivers, can be credited to the country’s expansion. Furthermore, steps implemented by the Chinese government to encourage yachting as a leisure activity are expected to increase demand for recreational watercraft in the country.

Overall, tourism and the increased popularity of water activities can be blamed for the rising demand for recreational boats.

Although the market for recreational boats is expanding, it still faces obstacles from environmental concerns, regulations, and rising competition from other recreational activities.

Increasing Tourism

The rising tourism industry will drive up demand for recreational boats. The increase of the recreational boat sector is mostly due to the expansion of the tourism industry.Over the last ten years, this market has proved its ability to grow alongside the tourism industry, notably in terms of pontoon, cruise, and water sports boat sales.Used boat and personal watercraft sales increased over the years since they gave customers and leasing companies with a pleasant holiday experience. Small sea and river issues have grown more appealing for small and medium-sized companies as the tourism sector grows.

Water sports are becoming more popular

The growing popularity of water sports is a primary market driver for the recreational boat industry. As more people participate in water sports, the need for boats designed for these activities will rise. This development is being driven by a number of factors, including the increased availability of water sports facilities and the growing popularity of extreme sports. Furthermore, advances in technology and design have made it easier for customers to participate in water sports, which has raised the appeal of these activities and the need for recreational boats. As a result, manufacturers are investing in the development of new boats and technology that are specifically built for water sports, which is fueling growth in the recreational boat market.

Strict Emission Standards for Recreational Boats in Order to Reduce Demand

Strict emission standards for recreational boats in order to minimise demand. The European Commision has mandated tougher restrictions for nitrogen oxide (NOx), hydrocarbons (H), and particulate matter in new motor boats, sailing boats, jet skis, and other recreational vehicles.It is proposed that propulsion engines be built to emit 34% less particulate matter and 20% fewer C+NOx emissions, respectively.The recreational boat market is likewise controlled by the US to reduce emissions.Its BA establishes boat discharge limitations in compliance with state regulations.For example, the discharge that these boats emit could be damaging to the fish, the ecosystem, and so on.It has also developed no-discharge zones to protect the ecosystem.

Concerns about the Environment

Boats can have a harmful impact on the environment, notably in terms of air and water pollution. Boats can emit toxic emissions into the air, such as carbon monoxide and nitrogen oxide, which can contribute to air pollution. Boats can also discharge oil, fuel, and other contaminants into the ocean, endangering marine life and harming ecosystems. As a result, there are increasing laws and limits on boating activities in many locations, which may impede the expansion of the recreational boat market. Furthermore, environmental concerns can contribute to negative opinions of boating among some consumers, thus limiting industry expansion.

To address these issues, manufacturers are investing in the development of more ecologically friendly boats and technology, which will assist fuel market growth while decreasing the environmental effect of boating activities.

High Ownership Costs

Boats are expensive to buy, maintain, and operate, making them out of reach for many people. Boat owners must pay for storage, upkeep, repairs, insurance, and gasoline in addition to the initial purchase price, which can add up to a large expense over time. The high cost of ownership may discourage many consumers from acquiring a recreational boat, limiting market growth. Furthermore, the cost of ownership can make it difficult for existing boat owners to update or replace their vessels, limiting market development even further.

As a result, manufacturers are investing in the development of new technologies and financing alternatives that will make recreational boats more affordable to consumers, which will help fuel market expansion in the future years.

The industry’s online market can enhance sales in unexplored markets

The newly growing online market for boats has provided a new channel for selling these boats. Earlier, most boating companies used to sell their boats majorly through dealers and boat shows. This resulted in the boats being sold in only some key regions across the worid. The growth of online mode of boat sales expanded the market for the boat manufacturers. Many manufacturers have been able to sell their boats in newer markets without setting up large scale dealership networks through these online markets. Online sales of boats also save on the dealership cost and increase the affordability of majority of these boats. All these factors have led to a growth in demand for recreational boats through an online sales medium.

In the coming years, we may expect rapid development in online sales of recreational boats for manufacturers, particularly from new markets around the world. E-commerce companies such as Amazon, Walmart, and Alibaba sell boats from prominent brands such as Intex, Bris, Classic, Solstice, Sea Eagle, FRP, and others. The most popular boats sold online are inflatables, pontoons, and watersports boats.

Increasing Demand for Luxury Yachts

As earnings rise and people become more prosperous, there is an increase in demand for high-end boats with premium features and services. High-end music systems, complex navigation systems, and opulent cabins may be found on these luxury boats. Furthermore, there is an increasing desire for boats with distinctive and customised characteristics, such as custom paint jobs and personalised interiors. This trend will promote growth in the recreational boat market, particularly in the luxury class. Manufacturers are investing in the creation of new luxury boats with premium features and customisation possibilities to capitalise on this potential, which is projected to fuel market growth in the coming years.

Competitive Landscape

Key Players

The global recreational boat market is highly competitive, with the presence of several key players. Some of the major players in the market and their market share are as follows:

  • Groupe Beneteau (France)
  • Brunswick Corporation (U.S.)
  • Marine Products Corporation (U.S.)
  • Carnival Corporation & plc (U.S.)
  • Royal Caribbean Cruises Ltd. (U.S.)
  • Norwegian Cruise Line Holdings Ltd. (U.S.)
  • MCBC Holdings, Inc. (U.S.)
  • Malibu Boats, Inc. (U.S.)
  • Grand Banks Yachts Ltd. (Singapore)
  • Porter, Inc. (U.S.)
  • Grady-White Boats, Inc. (U.S.)
  • Maverick Boat Group, Inc. (U.S.)
  • Correct Craft (U.S.)
  • Baja Marine (U.S.)
  • Pacific Asian Enterprises (U.S.)
  • Albemarle Boats (U.S.)
  • Yamaha Motors Co. Ltd. (Japan)
  • Sunseeker International Limited (U.K.).
  • Others

These companies focus on product innovation, expanding their distribution channels, and mergers and acquisitions to stay ahead in the market. The major players in the global recreational boat market are constantly striving to stay ahead by introducing new products and innovations.

In March 2022, Sportsman Manufacturing Inc. announced an investment of USD 8 billionto expand its operations in Dorchester County, South Carolina, which will boost the company’s manufacturing capacity to satisfy growing demand.

Vision Marine Technologies and Groupe Beneteau signed a cooperation in July 2022 to integrate Vision Marine Technologies’ high-power electric outboard motors onto multiple Groupe Beneteau brand models.

Mercury Marine, a division of Brunswick Corporation, announced a partnership with Alliant Energy in July 2022 to build a 5-megawatt, 32-acre solar array in eastern Fond du Lac County to enhance the company’s sustainability objectives and the region’s growing commitment to renewable energy.

Summary of Key Findings

  • Tourism and water sports are growing in popularity driving market growth
  • Market segmented by boat type, boat size, engine placement, engine type, power range, activity type, power source and region.
  • The up to 100 kW power range segment is a large and increasing section in the recreational boat market.
  • The electric sector is expected to grow at the highest CAGR rate in the worldwide market.
  • North America dominated the market in 2022, accounting for more than 44.4% of worldwide revenue..

Shape Your Report to Specific Countries or Regions & Enjoy 30% Off!

Future Outlook

  • Growing popularity of water activities
  • Technological and design advancements
  • Rising disposable incomes
  • Increased availability of financing alternatives
  • Growing demand for electric and hybrid boats
  • Growing popularity of boating among millennials

Segmentation

  • Based on Boat Type
    • Yachts
    • Sailboats
    • Personal Watercrafts
    • Inflatables
    • Others
  • Based on Boat Size
    • <30 Feet
    • 30-50 Feet
    • >50 Feet
  • Based on Engine Placement
    • Outboards
    • Inboards
    • Others
  • Based on Engine Type
    • ICE
    • Electric
  • Based on Power Range
    • Up to 100 kW
    • 100-200 kW
    • Above 200 kW
  • Based on Activity Type
    • Cruising+watersports
    • Fishing
  • Based on Power Source
    • Engine Powered
    • Sail Powered
    • Human Powered
  • Based on Distribution Channel
    • Dealer Network
    • Boat Shows
    • Online Sales
  • By Region
  • North America
    • U.S
    • Canada
    • Mexico
  • Europe
    • Germany
    • France
    • U.K.
    • Italy
    • Spain
    • Rest of Europe
  • Asia Pacific
    • China
    • Japan
    • India
    • South Korea
    • South-east Asia
    • Rest of Asia Pacific
  • Latin America
    • Brazil
    • Argentina
    • Rest of Latin America
  • Middle East & Africa
    • GCC Countries
    • South Africa
    • Rest of Middle East and Africa

1. Preface
1.1. Report Description
1.1.1. Purpose of the Report
1.1.2. Target Audience
1.1.3. USP and Key Offerings
1.2. Research Scope
1.3. Research Methodology
1.3.1. Phase I – Secondary Research
1.3.2. Phase II – Data Modelling
1.3.2.1. Company Share Analysis Model
1.3.2.2. Revenue Based Modelling
1.3.3. Phase III – Primary Research
1.3.4. Research Limitations
1.3.5. Assumptions
1.4. Market Introduction
1.5. Market Research Scope

2. Executive Summary
2.1. Market Snapshot: Global Recreational Boat Market
2.2. Global Recreational Boat Market, By Boat Type
2.3. Global Recreational Boat Market, By Boat Size
2.4. Global Recreational Boat Market, By Engine Placement
2.5. Global Recreational Boat Market, By Engine Type
2.6. Global Recreational Boat Market, By Power Range
2.7. Global Recreational Boat Market, By Activity Type
2.8. Global Recreational Boat Market, By Power Source
2.9. Global Recreational Boat Market, By Region

3. Market Dynamics & Factors Analysis
3.1. Introduction
3.1.1. Global Recreational Boat Market Value, 2017-2030, (US$ Billions)
3.1.2. Y-o-Y Growth Trend Analysis
3.2. Market Dynamics
3.2.1. Market Drivers
3.2.1.1. Driver 1
3.2.1.2. Driver 2
3.2.2. Market Restraints
3.2.2.1. Restraint 1
3.2.2.2. Restraint 2
3.2.3. Market Opportunities
3.2.3.1. Opportunity 1
3.2.3.2. Opportunity 2
3.2.4. Major Industry Challenges
3.2.4.1. Challenge 1
3.2.4.2. Challenge 2
3.3. Growth and Development Patterns
3.4. Investment Feasibility Analysis
3.5. Market Opportunity Analysis
3.5.1. Boat Type
3.5.2. Boat Size
3.5.3. Engine Placement
3.5.4. Engine Type
3.5.5. Power Range
3.5.6. Activity Type
3.5.7. Power Source
3.5.8. Geography

4. Premium Insights
4.1. STAR (Situation, Task, Action, Results) Analysis
4.2. Porter’s Five Forces Analysis
4.2.1. Threat of New Entrants
4.2.2. Bargaining Power of Buyers/Consumers
4.2.3. Bargaining Power of Suppliers
4.2.4. Threat of Substitute Types
4.2.5. Intensity of Competitive Rivalry
4.3. Key Market Trends
4.3.1. Demand Side Trends
4.3.2. Supply Side Trends
4.4. Value Chain Analysis
4.5. Boat Type Analysis
4.6. Analysis and Recommendations
4.7. Marketing Strategy Analysis
4.7.1. Direct Marketing
4.7.2. Indirect Marketing
4.7.3. Marketing Channel Development Trend

5. Market Positioning of Key Players, 2022
5.1. Company market share of key players, 2022
5.2. Competitive Benchmarking
5.3. Market Positioning of Key Vendors
5.4. Geographical Presence Analysis
5.5. Major Strategies Adopted by Key Players
5.5.1. Key Strategies Analysis
5.5.2. Mergers and Acquisitions
5.5.3. Partnerships
5.5.4. Packaging Launch
5.5.5. Geographical Expansion
5.5.6. Others

6. Economic Impact Analysis
6.1. Recession Impact
6.1.1. North America
6.1.2. Europe
6.1.3. Asia Pacific
6.1.4. Latin America
6.1.5. Middle East and Africa
6.2. Ukraine-Russia War Impact
6.2.1. North America
6.2.2. Europe
6.2.3. Asia Pacific
6.2.4. Latin America
6.2.5. Middle East and Africa
6.3. COVID-19 Impact Analysis
6.3.1. North America
6.3.2. Europe
6.3.3. Asia Pacific
6.3.4. Latin America
6.3.5. Middle East and Africa

7. Global Recreational Boat Market, By Boat Type
7.1. Global Recreational Boat Market Overview, By Boat Type
7.1.1. Global Recreational Boat Market Revenue Share, By Boat Type, 2022 Vs 2030 (in %)
7.2. Yachts
7.2.1. Global Recreational Boat Market, By Region, 2017-2030 (US$ Billions)
7.3. Sailboats
7.3.1. Global Recreational Boat Market, By Region, 2017-2030 (US$ Billions)
7.4. Personal Watercrafts
7.4.1. Global Recreational Boat Market, By Region, 2017-2030 (US$ Billions)
7.5. Inflatables
7.5.1. Global Recreational Boat Market, By Region, 2017-2030 (US$ Billions)
7.6. Others
7.6.1. Global Recreational Boat Market, By Region, 2017-2030 (US$ Billions)

8. Global Recreational Boat Market, By Boat Size
8.1. Global Recreational Boat Market Overview, By Boat Size
8.1.1. Global Recreational Boat Market, By Boat Size, 2022 vs. 2030 (in%)
8.2. <30 Feet
8.2.1. Global Recreational Boat Market, By Region, 2017-2030 (US$ Billions)
8.3. 30-50 Feet
8.3.1. Global Recreational Boat Market, By Region, 2017-2030 (US$ Billions)
8.4. >50 Feet
8.4.1. Global Recreational Boat Market, By Region, 2017-2030 (US$ Billions)

9. Global Recreational Boat Market, By Engine Placement, 2017-2030(US$ Billions)
9.1. Global Recreational Boat Market Overview, By Engine Placement
9.1.1. Global Recreational Boat Market, By Engine Placement, 2022 vs 2030 (in%)
9.2. Outboards
9.2.1. Global Recreational Boat Market, By Region, 2017-2030 (US$ Billions)
9.3. Inboards
9.3.1. Global Recreational Boat Market, By Region, 2017-2030 (US$ Billions)
9.4. Others
9.4.1. Global Recreational Boat Market, By Region, 2017-2030 (US$ Billions)

10. Global Recreational Boat Market, By Engine Type, 2017-2030(US$ Billions)
10.1 Global Recreational Boat Market Overview, By Engine Type
10.1.1. Global Recreational Boat Market, By Engine Type, 2022 vs 2030 (in %)
10.2. ICE
10.2.1. Global Recreational Boat Market, By Region, 2017-2030 (US$ Billions)
10.3. Electric
10.3.1. Global Recreational Boat Market, By Region, 2017-2030 (US$ Billions)

11. Global Recreational Boat Market, By Power Range, 2017-2030(US$ Billions)
11.2. Global Recreational Boat Market Overview, By Power Range
11.2.1. Global Recreational Boat Market, By Engine Type, 2022 vs 2030 (in %)
11.3. Up to 100 kW
11.3.1. Global Recreational Boat Market, By Region, 2017-2030 (US$ Billions)
11.4. 100-200 kW
11.4.1. Global Recreational Boat Market, By Region, 2017-2030 (US$ Billions)
11.5. Above 200 kW
11.5.1. Global Recreational Boat Market, By Region, 2017-2030 (US$ Billions)

12. Global Recreational Boat Market, By Activity Type, 2017-2030(US$ Billions)
12.2. Global Recreational Boat Market Overview, By Activity Type
12.2.1. Global Recreational Boat Market, By Engine Type, 2022 vs 2030 (in %)
12.3. Cruising+watersports
12.3.1. Global Recreational Boat Market, By Region, 2017-2030 (US$ Billions)
12.4. Fishing
12.4.1. Global Recreational Boat Market, By Region, 2017-2030 (US$ Billions)

13. Global Recreational Boat Market Overview, By Power Source
13.2.1. Global Recreational Boat Market, By Engine Type, 2022 vs 2030 (in %)
13.3. Engine Powered
13.3.1. Global Recreational Boat Market, By Region, 2017-2030 (US$ Billions)
13.4. Sail Powered
13.4.1. Global Recreational Boat Market, By Region, 2017-2030 (US$ Billions)
13.5. Human Powered
13.5.1. Global Recreational Boat Market, By Region, 2017-2030 (US$ Billions)

14. Global Recreational Boat Market, By Region
14.2. Global Recreational Boat Market Overview, by Region
14.2.1. Global Recreational Boat Market, By Region, 2022 vs 2030 (in%)
14.3. Boat Type
14.3.1. Global Recreational Boat Market, By Boat Type, 2017-2030 (US$ Billions)
14.4. Boat Size
14.4.1. Global Recreational Boat Market, By Boat Size, 2017-2030 (US$ Billions)
14.5. Engine Placement
14.5.1. Global Recreational Boat Market, By Engine Placement, 2017-2030 (US$ Billions)
14.6. Engine Type
14.6.1. Global Recreational Boat Market, By Engine Type, 2017-2030 (US$ Billions)
14.7. Power Range
14.7.1. Global Recreational Boat Market, By Power Range, 2017-2030 (US$ Billions)
14.8. Activity Type
14.8.1. Global Recreational Boat Market, By Activity Type, 2017-2030 (US$ Billions)
14.9. Power Source
14.9.1. Global Recreational Boat Market, By Power Source, 2017-2030 (US$ Billions)

15. North America Recreational Boat Market Analysis
15.2. North America Recreational Boat Market, By Boat Type, 2017-2030(US$ Billions)
15.2.1. Overview
15.2.2. SRC Analysis
15.3. North America Recreational Boat Market, By Boat Size, 2017-2030(US$ Billions)
15.3.1. Overview
15.3.2. SRC Analysis
15.4. North America Recreational Boat Market, By Engine Placement, 2017-2030(US$ Billions)
15.4.1. Overview
15.4.2. SRC Analysis
15.5. North America Recreational Boat Market, By Engine Type, 2017-2030(US$ Billions)
15.5.1. Overview
15.5.2. SRC Analysis
15.6. North America Recreational Boat Market, By Power Range, 2017-2030(US$ Billions)
15.6.1. Overview
15.6.2. SRC Analysis
15.7. North America Recreational Boat Market, By Activity Type, 2017-2030(US$ Billions)
15.7.1. Overview
15.7.2. SRC Analysis
15.8. North America Recreational Boat Market, By Power Source, 2017-2030(US$ Billions)
15.8.1. Overview
15.8.2. SRC Analysis
15.9. North America Recreational Boat Market, by Country, 2017-2030(US$ Billions)
15.9.1. North America Recreational Boat Market, by Country, 2022 Vs 2030 (in %)
15.9.2. U.S.
15.9.2.1. U.S. Recreational Boat Market Estimates and Forecast, 2017-2030(US$ Billions)
15.9.2.2. U.S. Recreational Boat, By Boat Type, 2017-2030(US$ Billions)
15.9.2.3. U.S. Recreational Boat, By Boat Size, 2017-2030(US$ Billions)
15.9.2.4. U.S. Recreational Boat, By Engine Placement, 2017-2030 (US$ Billions)
15.9.2.5. U.S. Recreational Boat, By Engine Type, 2017-2030 (US$ Billions)
15.9.2.6. Recreational Boat, By Power Range, 2017-2030 (US$ Billions)
15.9.2.7. Recreational Boat, By Activity Type, 2017-2030 (US$ Billions)
15.9.2.8. Recreational Boat, By Power Source, 2017-2030 (US$ Billions)
15.9.3. Canada
15.9.3.1. Canada Recreational Boat Market Estimates and Forecast, 2017-2030(US$ Billions)
15.9.3.2. Canada Recreational Boat, By Boat Type, 2017-2030(US$ Billions)
15.9.3.3. Canada Recreational Boat, By Boat Size, 2017-2030(US$ Billions)
15.9.3.4. Canada Recreational Boat, By Engine Placement, 2017-2030 (US$ Billions)
15.9.3.5. Canada Recreational Boat, By Engine Type, 2017-2030 (US$ Billions)
15.9.3.6. Canada Recreational Boat, By Power Range, 2017-2030 (US$ Billions)
15.9.3.7. Canada Recreational Boat, By Activity Type, 2017-2030 (US$ Billions)
15.9.3.8. Canada Recreational Boat, By Power Source, 2017-2030 (US$ Billions)
15.9.4. Mexico
15.9.4.1. Mexico Recreational Boat Market Estimates and Forecast, 2017-2030 (US$ Billions)
15.9.4.2. Mexico Recreational Boat, By Boat Type, 2017-2030 (US$ Billions)
15.9.4.3. Mexico Recreational Boat, By Boat Size, 2017-2030 (US$ Billions)
15.9.4.4. Mexico Recreational Boat, By Material, 2017-2030 (US$ Billions)
15.9.4.5. Mexico Recreational Boat, By Engine Type, 2017-2030 (US$ Billions)
15.9.4.6. Mexico Recreational Boat, By Power Range, 2017-2030 (US$ Billions)
15.9.4.7. Mexico Recreational Boat, By Activity Type, 2017-2030 (US$ Billions)
15.9.4.8. Mexico Recreational Boat, By Power Source, 2017-2030 (US$ Billions)

16. Europe Recreational Boat Market Analysis
16.2. Europe Recreational Boat Market, By Boat Type, 2017-2030(US$ Billions)
16.2.1. Overview
16.2.2. SRC Analysis
16.3. Europe Recreational Boat Market, By Boat Size, 2017-2030(US$ Billions)
16.3.1. Overview
16.3.2. SRC Analysis
16.4. Europe Recreational Boat Market, By Engine Placement, 2017-2030(US$ Billions)
16.4.1. Overview
16.4.2. SRC Analysis
16.5. Europe Recreational Boat Market, By Engine Type, 2017-2030(US$ Billions)
16.5.1. Overview
16.5.2. SRC Analysis
16.6. Europe Recreational Boat Market, By Power Range, 2017-2030(US$ Billions)
16.6.1. Overview
16.6.2. SRC Analysis
16.7. Europe Recreational Boat Market, By Activity Type, 2017-2030(US$ Billions)
16.7.1. Overview
16.7.2. SRC Analysis
16.8. Europe Recreational Boat Market, By Power Source, 2017-2030(US$ Billions)
16.8.1. Overview
16.8.2. SRC Analysis
16.9. Europe Recreational Boat Market, by Country, 2017-2030(US$ Billions)
16.9.1. Europe Recreational Boat Market, by Country, 2022 Vs 2030 (in%)
16.9.2. Germany
16.9.2.1. Germany Recreational Boat Market Estimates and Forecast, 2017-2030(US$ Billions)
16.9.2.2. Germany Recreational Boat, By Boat Type, 2017-2030(US$ Billions)
16.9.2.3. Germany Recreational Boat, By Boat Size, 2017-2030(US$ Billions)
16.9.3. Germany Recreational Boat, By Engine Placement, 2017-2030 (US$ Billions)
16.9.4. Germany Recreational Boat, By Engine Type, 2017-2030 (US$ Billions)
16.9.5. Germany Recreational Boat, By Power Range, 2017-2030 (US$ Billions)
16.9.6. Germany Recreational Boat, By Activity Type, 2017-2030 (US$ Billions)
16.9.7. Germany Recreational Boat, By Power Source, 2017-2030 (US$ Billions)
16.9.8. France
16.9.8.1. France Recreational Boat Market Estimates and Forecast, 2017-2030(US$ Billions)
16.9.8.2. France Recreational Boat, By Boat Type, 2017-2030(US$ Billions)
16.9.8.3. France Recreational Boat, By Boat Size, 2017-2030(US$ Billions)
16.9.8.4. France Recreational Boat, By Engine Placement, 2017-2030 (US$ Billions)
16.9.8.5. France Recreational Boat, By Engine Type, 2017-2030 (US$ Billions)
16.9.8.6. France Recreational Boat, By Power Range, 2017-2030 (US$ Billions)
16.9.8.7. France Recreational Boat, By Activity Type, 2017-2030 (US$ Billions)
16.9.8.8. France Recreational Boat, By Power Source, 2017-2030 (US$ Billions)
16.9.9. UK
16.9.9.1. UK Recreational Boat Market Estimates and Forecast, 2017-2030(US$ Billions)
16.9.9.2. UK Recreational Boat, By Boat Type, 2017-2030(US$ Billions)
16.9.9.3. UK Recreational Boat, By Boat Size, 2017-2030(US$ Billions)
16.9.9.4. UK Recreational Boat, By Engine Placement, 2017-2030 (US$ Billions)
16.9.9.5. UK Recreational Boat, By Engine Type, 2017-2030 (US$ Billions)
16.9.9.6. UK Recreational Boat, By Power Range, 2017-2030 (US$ Billions)
16.9.9.7. UK Recreational Boat, By Activity Type, 2017-2030 (US$ Billions)
16.9.9.8. UK Recreational Boat, By Power Source, 2017-2030 (US$ Billions)
16.9.10. Italy
16.9.10.1. Italy Recreational Boat Market Estimates and Forecast, 2017-2030(US$ Billions)
16.9.10.2. Italy Recreational Boat, By Boat Type, 2017-2030(US$ Billions)
16.9.10.3. Italy Recreational Boat, By Boat Size, 2017-2030(US$ Billions)
16.9.10.4. Italy Recreational Boat, By Engine Placement, 2017-2030 (US$ Billions)
16.9.10.5. Italy Recreational Boat, By Engine Type, 2017-2030 (US$ Billions)
16.9.10.6. Italy Recreational Boat, By Power Range, 2017-2030 (US$ Billions)
16.9.10.7. Italy Recreational Boat, By Activity Type, 2017-2030 (US$ Billions)
16.9.10.8. Italy Recreational Boat, By Power Source, 2017-2030 (US$ Billions)
16.9.11. Spain
16.9.11.1. Spain Recreational Boat Market Estimates and Forecast, 2017-2030(US$ Billions)
16.9.11.2. Spain Recreational Boat, By Boat Type, 2017-2030(US$ Billions)
16.9.11.3. Spain Recreational Boat, By Boat Size, 2017-2030(US$ Billions)
16.9.11.4. Spain Recreational Boat, By Engine Placement, 2017-2030 (US$ Billions)
16.9.11.5. Spain Recreational Boat, By Engine Type, 2017-2030 (US$ Billions)
16.9.11.6. Spain Recreational Boat, By Power Range, 2017-2030 (US$ Billions)
16.9.11.7. Spain Recreational Boat, By Activity Type, 2017-2030 (US$ Billions)
16.9.11.8. Spain Recreational Boat, By Power Source, 2017-2030 (US$ Billions)
16.9.12. Rest of Europe
16.9.12.1. Rest of Europe Recreational Boat Market Estimates and Forecast, 2017-2030(US$ Billions)
16.9.12.2. Rest of Europe Recreational Boat, By Boat Type, 2017-2030(US$ Billions)
16.9.12.3. Rest of Europe Recreational Boat, By Boat Size, 2017-2030(US$ Billions)
16.9.12.4. Rest of Europe Recreational Boat, By Engine Placement, 2017-2030 (US$ Billions)
16.9.12.5. Rest of Europe Recreational Boat, By Engine Type, 2017-2030 (US$ Billions)
16.9.12.6. Rest of Europe Recreational Boat, By Power Range, 2017-2030 (US$ Billions)
16.9.12.7. Rest of Europe Recreational Boat, By Activity Type, 2017-2030 (US$ Billions)
16.9.12.8. Rest of Europe Recreational Boat, By Power Source, 2017-2030 (US$ Billions)

17. Asia Pacific Recreational Boat Market Analysis
17.2. Asia Pacific Recreational Boat Market, By Boat Type, 2017-2030(US$ Billions)
17.2.1. Overview
17.2.2. SRC Analysis
17.3. Asia Pacific Recreational Boat Market, By Boat Size, 2017-2030(US$ Billions)
17.3.1. Overview
17.3.2. SRC Analysis
17.4. Asia Pacific Recreational Boat Market, By Engine Placement, 2017-2030(US$ Billions)
17.4.1. Overview
17.4.2. SRC Analysis
17.5. Asia Pacific Recreational Boat Market, By Engine Type, 2017-2030(US$ Billions)
17.5.1. Overview
17.5.2. SRC Analysis
17.6. Asia Pacific Recreational Boat Market, By Power Range, 2017-2030(US$ Billions)
17.6.1. Overview
17.6.2. SRC Analysis
17.7. Asia Pacific Recreational Boat Market, By Activity Type, 2017-2030(US$ Billions)
17.7.1. Overview
17.7.2. SRC Analysis
17.8. Asia Pacific Recreational Boat Market, By Power Source, 2017-2030(US$ Billions)
17.8.1. Overview
17.8.2. SRC Analysis
17.9. Asia Pacific Recreational Boat Market, by Country, 2017-2030(US$ Billions)
17.9.1. Asia Pacific Recreational Boat Market, by Country, 2022 Vs 2030 (in%)
17.9.2. China
17.9.2.1. China Recreational Boat Market Estimates and Forecast, 2017-2030(US$ Billions)
17.9.2.2. China Recreational Boat, By Boat Type, 2017-2030(US$ Billions)
17.9.2.3. China Recreational Boat, By Boat Size, 2017-2030(US$ Billions)
17.9.2.4. China Recreational Boat, By Engine Placement, 2017-2030 (US$ Billions)
17.9.2.5. China Recreational Boat, By Engine Type, 2017-2030 (US$ Billions)
17.9.2.6. China Recreational Boat, By Power Range, 2017-2030 (US$ Billions)
17.9.2.7. China Recreational Boat, By Activity Type, 2017-2030 (US$ Billions)
17.9.2.8. China Recreational Boat, By Power Source, 2017-2030 (US$ Billions)
17.9.3. Japan
17.9.3.1. Japan Recreational Boat Market Estimates and Forecast, 2017-2030(US$ Billions)
17.9.3.2. Japan Recreational Boat, By Boat Type, 2017-2030(US$ Billions)
17.9.3.3. Japan Recreational Boat, By Boat Size, 2017-2030(US$ Billions)
17.9.3.4. Japan Recreational Boat, By Engine Placement, 2017-2030 (US$ Billions)
17.9.3.5. Japan Recreational Boat, By Engine Type, 2017-2030 (US$ Billions)
17.9.3.6. Japan Recreational Boat, By Power Range, 2017-2030 (US$ Billions)
17.9.3.7. Japan Recreational Boat, By Activity Type, 2017-2030 (US$ Billions)
17.9.3.8. Japan Recreational Boat, By Power Source, 2017-2030 (US$ Billions)
17.9.4. India
17.9.4.1. India Recreational Boat Market Estimates and Forecast, 2017-2030(US$ Billions)
17.9.4.2. India Recreational Boat, By Boat Type, 2017-2030(US$ Billions)
17.9.4.3. India Recreational Boat, By Boat Size, 2017-2030(US$ Billions)
17.9.4.4. India Recreational Boat, By Engine Placement, 2017-2030 (US$ Billions)
17.9.4.5. India Recreational Boat, By Engine Type, 2017-2030 (US$ Billions)
17.9.4.6. India Recreational Boat, By Power Range, 2017-2030 (US$ Billions)
17.9.4.7. India Recreational Boat, By Activity Type, 2017-2030 (US$ Billions)
17.9.4.8. India Recreational Boat, By Power Source, 2017-2030 (US$ Billions)
17.9.5. South Korea
17.9.5.1. South Korea Recreational Boat Market Estimates and Forecast, 2017-2030(US$ Billions)
17.9.5.2. South Korea Recreational Boat, By Boat Type, 2017-2030(US$ Billions)
17.9.5.3. South Korea Recreational Boat, By Boat Size, 2017-2030(US$ Billions)
17.9.5.4. South Korea Recreational Boat, By Engine Placement, 2017-2030 (US$ Billions)
17.9.5.5. South Korea Recreational Boat, By Engine Type, 2017-2030 (US$ Billions)
17.9.5.6. South Korea Recreational Boat, By Power Range, 2017-2030 (US$ Billions)
17.9.5.7. South Korea Recreational Boat, By Activity Type, 2017-2030 (US$ Billions)
17.9.5.8. South Korea Recreational Boat, By Power Source, 2017-2030 (US$ Billions)
17.9.6. South-East Asia
17.9.6.1. South-East Asia Recreational Boat Market Estimates and Forecast, 2017-2030(US$ Billions)
17.9.6.2. South-East Asia Recreational Boat, By Boat Type, 2017-2030(US$ Billions)
17.9.6.3. South-East Asia Recreational Boat, By Boat Size, 2017-2030(US$ Billions)
17.9.6.4. South-East Asia Recreational Boat, By Engine Placement, 2017-2030 (US$ Billions)
17.9.6.5. South-East Asia Recreational Boat, By Engine Type, 2017-2030 (US$ Billions)
17.9.6.6. South-East Asia Recreational Boat, By Power Range, 2017-2030 (US$ Billions)
17.9.6.7. South-East Asia Recreational Boat, By Activity Type, 2017-2030 (US$ Billions)
17.9.6.8. South-East Asia Recreational Boat, By Power Source, 2017-2030 (US$ Billions)
17.9.7. Rest of Asia Pacific
17.9.7.1. Rest of Asia Pacific Recreational Boat Market Estimates and Forecast, 2017-2030(US$ Billions)
17.9.7.2. Rest of Asia Pacific Recreational Boat, By Boat Type, 2017-2030(US$ Billions)
17.9.7.3. Rest of Asia Pacific Recreational Boat, By Boat Size, 2017-2030(US$ Billions)
17.9.7.4. Rest of Asia Pacific Recreational Boat, By Engine Placement, 2017-2030 (US$ Billions)
17.9.7.5. Rest of Asia Pacific Recreational Boat, By Engine Type, 2017-2030 (US$ Billions)
17.9.7.6. Rest of Asia Pacific Recreational Boat, By Power Range, 2017-2030 (US$ Billions)
17.9.7.7. Rest of Asia Pacific Recreational Boat, By Activity Type, 2017-2030 (US$ Billions)
17.9.7.8. Rest of Asia Pacific Recreational Boat, By Power Source, 2017-2030 (US$ Billions)

18. Latin America Recreational Boat Market Analysis
18.2. Latin America Recreational Boat Market, By Boat Type, 2017-2030(US$ Billions)
18.2.1. Overview
18.2.2. SRC Analysis
18.3. Latin America Recreational Boat Market, By Boat Size, 2017-2030(US$ Billions)
18.3.1. Overview
18.3.2. SRC Analysis
18.4. Latin America Recreational Boat Market, By Engine Placement, 2017-2030(US$ Billions)
18.4.1. Overview
18.4.2. SRC Analysis
18.5. Latin America Recreational Boat Market, By Engine Type, 2017-2030(US$ Billions)
18.5.1. Overview
18.5.2. SRC Analysis
18.6. Latin America Recreational Boat Market, By Power Range, 2017-2030(US$ Billions)
18.6.1. Overview
18.6.2. SRC Analysis
18.7. Latin America Recreational Boat Market, By Activity Type, 2017-2030(US$ Billions)
18.7.1. Overview
18.7.2. SRC Analysis
18.8. Latin America Recreational Boat Market, By Power Source, 2017-2030(US$ Billions)
18.8.1. Overview
18.8.2. SRC Analysis
18.9. Latin America Recreational Boat Market, by Country, 2017-2030(US$ Billions)
18.9.1. Latin America Recreational Boat Market, by Country, 2022 Vs 2030 (in%)
18.9.2. Brazil
18.9.2.1. Brazil Recreational Boat Market Estimates and Forecast, 2017-2030(US$ Billions)
18.9.2.2. Brazil Recreational Boat, By Boat Type, 2017-2030(US$ Billions)
18.9.2.3. Brazil Recreational Boat, By Boat Size, 2017-2030(US$ Billions)
18.9.2.4. Brazil Recreational Boat, By Engine Placement, 2017-2030 (US$ Billions)
18.9.2.5. Brazil Recreational Boat, By Engine Type, 2017-2030 (US$ Billions)
18.9.2.6. Brazil Recreational Boat, By Power Range, 2017-2030 (US$ Billions)
18.9.2.7. Brazil Recreational Boat, By Activity Type, 2017-2030 (US$ Billions)
18.9.2.8. Brazil Recreational Boat, By Power Source, 2017-2030 (US$ Billions)
18.9.3. Argentina
18.9.3.1. Argentina Recreational Boat Market Estimates and Forecast, 2017-2030(US$ Billions)
18.9.3.2. Argentina Recreational Boat, By Boat Type, 2017-2030(US$ Billions)
18.9.3.3. Argentina Recreational Boat, By Boat Size, 2017-2030(US$ Billions)
18.9.3.4. Argentina Recreational Boat, By Engine Placement, 2017-2030 (US$ Billions)
18.9.3.5. Argentina Recreational Boat, By Engine Type, 2017-2030 (US$ Billions)
18.9.3.6. Argentina Recreational Boat, By Power Range, 2017-2030 (US$ Billions)
18.9.3.7. Argentina Recreational Boat, By Activity Type, 2017-2030 (US$ Billions)
18.9.3.8. Argentina Recreational Boat, By Power Source, 2017-2030 (US$ Billions)
18.9.4. Rest of Latin America
18.9.4.1. Rest of Latin America Recreational Boat Market Estimates and Forecast, 2017-2030(US$ Billions)
18.9.4.2. Rest of Latin America Recreational Boat, By Boat Type, 2017-2030(US$ Billions)
18.9.4.3. Rest of Latin America Recreational Boat, By Boat Size, 2017-2030(US$ Billions)
18.9.4.4. Rest of Latin America Recreational Boat, By Engine Placement, 2017-2030 (US$ Billions)
18.9.4.5. Rest of Latin America Recreational Boat, By Engine Type, 2017-2030 (US$ Billions)
18.9.4.6. Rest of Latin America Recreational Boat, By Power Range, 2017-2030 (US$ Billions)
18.9.4.7. Rest of Latin America Recreational Boat, By Activity Type, 2017-2030 (US$ Billions)
18.9.4.8. Rest of Latin America Recreational Boat, By Power Source, 2017-2030 (US$ Billions)

19. Middle East and Africa Recreational Boat Market Analysis
19.2. Middle East and Africa Recreational Boat Market, By Boat Type, 2017-2030(US$ Billions)
19.2.1. Overview
19.2.2. SRC Analysis
19.3. Middle East and Africa Recreational Boat Market, By Boat Size, 2017-2030(US$ Billions)
19.3.1. Overview
19.3.2. SRC Analysis
19.4. Middle East and Africa Recreational Boat Market, By Engine Placement, 2017-2030(US$ Billions)
19.4.1. Overview
19.4.2. SRC Analysis
19.5. Middle East and Africa Recreational Boat Market, By Engine Type, 2017-2030(US$ Billions)
19.5.1. Overview
19.5.2. SRC Analysis
19.6. Middle East and Africa Recreational Boat Market, By Power Range, 2017-2030(US$ Billions)
19.6.1. Overview
19.6.2. SRC Analysis
19.7. Middle East and Africa Recreational Boat Market, By Activity Type, 2017-2030(US$ Billions)
19.7.1. Overview
19.7.2. SRC Analysis
19.8. Middle East and Africa Recreational Boat Market, By Power Source, 2017-2030(US$ Billions)
19.8.1. Overview
19.8.2. SRC Analysis
19.9. Middle East and Africa Recreational Boat Market, by Country, 2017-2030(US$ Billions)
19.9.1. Middle East and Africa Recreational Boat Market, by Country, 2022 Vs 2030 (in%)
19.9.2. GCC Countries
19.9.2.1. GCC Countries Recreational Boat Market Estimates and Forecast, 2017-2030(US$ Billions)
19.9.2.2. GCC Countries Recreational Boat, By Boat Type, 2017-2030(US$ Billions)
19.9.2.3. GCC Countries Recreational Boat, By Boat Size, 2017-2030(US$ Billions)
19.9.2.4. GCC Countries Recreational Boat, By Engine Placement, 2017-2030 (US$ Billions)
19.9.2.5. GCC Countries Recreational Boat, By Engine Type, 2017-2030 (US$ Billions)
19.9.2.6. GCC Countries Recreational Boat, By Power Range, 2017-2030 (US$ Billions)
19.9.2.7. GCC Countries Recreational Boat, By Activity Type, 2017-2030 (US$ Billions)
19.9.2.8. GCC Countries Recreational Boat, By Power Source, 2017-2030 (US$ Billions)
19.9.3. South Africa
19.9.3.1. South Africa Recreational Boat Market Estimates and Forecast, 2017-2030(US$ Billions)
19.9.3.2. South Africa Recreational Boat, By Boat Type, 2017-2030(US$ Billions)
19.9.3.3. South Africa Recreational Boat, By Boat Size, 2017-2030(US$ Billions)
19.9.3.4. South Africa Recreational Boat, By Engine Placement, 2017-2030 (US$ Billions)
19.9.3.5. South Africa Recreational Boat, By Engine Type, 2017-2030 (US$ Billions)
19.9.3.6. South Africa Recreational Boat, By Power Range, 2017-2030 (US$ Billions)
19.9.3.7. South Africa Recreational Boat, By Activity Type, 2017-2030 (US$ Billions)
19.9.3.8. South Africa Recreational Boat, By Power Source, 2017-2030 (US$ Billions)
19.9.4. Rest of Middle East and Africa
19.9.4.1. Rest of Middle East and Africa Recreational Boat Market Estimates and Forecast, 2017-2030(US$ Billions)
19.9.4.2. Rest of Middle East and Africa Recreational Boat, By Boat Type, 2017-2030(US$ Billions)
19.9.4.3. Rest of Middle East and Africa Recreational Boat, By Boat Size, 2017-2030(US$ Billions)
19.9.4.4. Rest of Middle East and Africa Recreational Boat, By Engine Placement, 2017-2030 (US$ Billions)
19.9.4.5. Rest of Middle East and Africa Recreational Boat, By Engine Type, 2017-2030 (US$ Billions)
19.9.4.6. Rest of Middle East and Africa Recreational Boat, By Power Range, 2017-2030 (US$ Billions)
19.9.4.7. Rest of Middle East and Africa Recreational Boat, By Activity Type, 2017-2030 (US$ Billions)
19.9.4.8. Rest of Middle East and Africa Recreational Boat, By Power Source, 2017-2030 (US$ Billions)

20. Company Profiles
20.2. Groupe Beneteau
20.2.1. Company Overview
20.2.2. Boat Type/Services Portfolio
20.2.3. Geographical Presence
20.2.4. Financial Summary
20.2.4.1. Market Revenue and Net Profit (2019-2022)
20.2.4.2. Business Segment Revenue Analysis
20.2.4.3. Geographical Revenue Analysis
20.3. Brunswick Corporation (U.S.)
20.4. Marine Products Corporation (U.S.)
20.5. Carnival Corporation & plc (U.S.)
20.6. Royal Caribbean Cruises Ltd. (U.S.)
20.7. Norwegian Cruise Line Holdings Ltd. (U.S.)
20.8. MCBC Holdings, Inc. (U.S.)
20.9. Malibu Boats, Inc. (U.S.)
20.10. Grand Banks Yachts Ltd. (Singapore)
20.11. Porter, Inc. (U.S.)
20.12. Grady-White Boats, Inc. (U.S.)
20.13. Maverick Boat Group, Inc. (U.S.)
20.14. Correct Craft (U.S.)
20.15. Baja Marine (U.S.)
20.16. Pacific Asian Enterprises (U.S.)
20.17. Albemarle Boats (U.S.)
20.18. Yamaha Motors Co. Ltd. (Japan)
20.19. Sunseeker International Limited (U.K.).

List of Figures
FIG. 1 Global Recreational Boat Market: Research Methodology
FIG. 2 Market Size Estimation – Top Down & Bottom up Approach
FIG. 3 Global Recreational Boat Market Segmentation
FIG. 4 Global Recreational Boat Market, By Boat Type, 2022(US$ Billions)
FIG. 5 Global Recreational Boat Market, By Boat Size, 2022(US$ Billions)
FIG. 6 Global Recreational Boat Market, By Engine Placement, 2022 (US$ Billions)
FIG. 7 Global Recreational Boat Market, By Engine Type, 2022 (US$ Billions)
FIG. 8 Global Recreational Boat Market, By Power Range, 2022 (US$ Billions)
FIG. 9 Global Recreational Boat Market, By Activity Type, 2022 (US$ Billions)
FIG. 10 Global Recreational Boat Market, By Power Source, 2022 (US$ Billions)
FIG. 11 Global Recreational Boat Market, by Geography, 2022(US$ Billions)
FIG. 12 Attractive Investment Proposition, By Boat Type, 2022
FIG. 13 Attractive Investment Proposition, By Boat Size, 2022
FIG. 14 Attractive Investment Proposition, By Engine Placement, 2022
FIG. 15 Attractive Investment Proposition, By Engine Type, 2022
FIG. 16 Attractive Investment Proposition, By Power Range, 2022
FIG. 17 Attractive Investment Proposition, By Activity Type, 2022
FIG. 18 Attractive Investment Proposition, By Power Source, 2022
FIG. 19 Attractive Investment Proposition, by Geography, 2022
FIG. 20 Global Market Share Analysis of Key Recreational Boat Market Manufacturers, 2022
FIG. 21 Global Market Positioning of Key Recreational Boat Market Manufacturers, 2022
FIG. 22 Global Recreational Boat Market Value Contribution, By Boat Type, 2022&2030 (Value %)
FIG. 23 Global Recreational BoatMarket, by Yachts , Value, 2017-2030(US$ Billions)
FIG. 24 Global Recreational BoatMarket, by Sailboats , Value, 2017-2030(US$ Billions)
FIG. 25 Global Recreational Boat Market, by Personal Watercrafts, Value, 2017-2030 (US$ Billions)
FIG. 26 Global Recreational Boat Market, by Inflatables, Value, 2017-2030 (US$ Billions)
FIG. 27 Global Recreational Boat Market, by Others, Value, 2017-2030 (US$ Billions)
FIG. 28 Global Recreational Boat Market Value Contribution, By Boat Size, 2022&2030 (Value %)
FIG. 29 Global Recreational Boat Market, by <30 Feet, Value, 2017-2030(US$ Billions)
FIG. 30 Global Recreational Boat Market, by 30-50 Feet, 2017-2030(US$ Billions)
FIG. 31 Global Recreational Boat Market, by >50 Feet, 2017-2030(US$ Billions)
FIG. 32 Global Recreational Boat Market Value Contribution, By Engine Placement, 2022 & 2030 (Value %)
FIG. 33 Global Recreational Boat Market, by Outboards, Value, 2017-2030 (US$ Billions)
FIG. 34 Global Recreational Boat Market, by Inboards, 2017-2030 (US$ Billions)
FIG. 35 Global Recreational Boat Market, by Others, 2017-2030 (US$ Billions)
FIG. 36 Global Recreational Boat Market Value Contribution, By Engine Type, 2022 & 2030 (Value %)
FIG. 37 Global Recreational Boat Market, by ICE, Value, 2017-2030 (US$ Billions)
FIG. 38 Global Recreational Boat Market, by Electric, Value, 2017-2030 (US$ Billions)
FIG. 39 Global Recreational Boat Market Value Contribution, By Power Range, 2022 & 2030 (Value %)
FIG. 40 Global Recreational Boat Market, by Up to 100 kW, Value, 2017-2030 (US$ Billions)
FIG. 41 Global Recreational Boat Market, by 100-200 kW, Value, 2017-2030 (US$ Billions)
FIG. 42 Global Recreational Boat Market, by Above 200 kW, Value, 2017-2030 (US$ Billions)
FIG. 43 Global Recreational Boat Market Value Contribution, By Activity Type, 2022 & 2030 (Value %)
FIG. 44 Global Recreational Boat Market, by Cruising+watersports, Value, 2017-2030 (US$ Billions)
FIG. 45 Global Recreational Boat Market, by Fishing, Value, 2017-2030 (US$ Billions)
FIG. 46 Global Recreational Boat Market Value Contribution, By Power Source, 2022 & 2030 (Value %)
FIG. 47 Global Recreational Boat Market, by Engine Powered, Value, 2017-2030 (US$ Billions)
FIG. 48 Global Recreational Boat Market, by Sail Powered, Value, 2017-2030 (US$ Billions)
FIG. 49 Global Recreational Boat Market, by Human Powered, 2017-2030 (US$ Billions)
FIG. 50 North America Recreational Boat Market, 2017-2030 (US$ Billions)
FIG. 51 U.S. Recreational Boat Market, 2017-2030(US$ Billions)
FIG. 52 Canada Recreational Boat Market, 2017-2030(US$ Billions)
FIG. 53 Europe Recreational Boat Market, 2017-2030 (US$ Billions)
FIG. 54 Germany Recreational Boat Market, 2017-2030(US$ Billions)
FIG. 55 France Recreational Boat Market, 2017-2030(US$ Billions)
FIG. 56 U.K. Recreational Boat Market, 2017-2030(US$ Billions)
FIG. 57 Italy Recreational Boat Market, 2017-2030(US$ Billions)
FIG. 58 Spain Recreational Boat Market, 2017-2030(US$ Billions)
FIG. 59 Rest of Europe Recreational Boat Market, 2017-2030(US$ Billions)
FIG. 60 Asia Pacific Recreational Boat Market, 2017-2030 (US$ Billions)
FIG. 61 China Recreational Boat Market, 2017-2030(US$ Billions)
FIG. 62 Japan Recreational Boat Market, 2017-2030(US$ Billions)
FIG. 63 India Recreational Boat Market, 2017-2030(US$ Billions)
FIG. 64 South Korea Recreational Boat Market, 2017-2030(US$ Billions)
FIG. 65 South-East Asia Recreational Boat Market, 2017-2030(US$ Billions)
FIG. 66 Rest of Asia Pacific Recreational Boat Market, 2017-2030(US$ Billions)
FIG. 67 Latin America Recreational Boat Market, 2017-2030(US$ Billions)
FIG. 68 Brazil Recreational Boat Market, 2017-2030(US$ Billions)
FIG. 69 Mexico Recreational Boat Market, 2017-2030(US$ Billions)
FIG. 70 Rest of Latin America Recreational Boat Market, 2017-2030(US$ Billions)
FIG. 71 Middle East & Africa Recreational Boat Market, 2017-2030(US$ Billions)
FIG. 72 GCC Countries Recreational Boat Market, 2017-2030(US$ Billions)
FIG. 73 South Africa Recreational Boat Market, 2017-2030(US$ Billions)
FIG. 74 Rest of Middle East and Africa Recreational Boat Market, 2017-2030(US$ Billions)

List of Tables
TABLE 1 Market Snapshot: Global Recreational Boat Market
TABLE 2 Global Recreational Boat Market: Market Drivers Impact Analysis
TABLE 3 Global Recreational Boat Market: Market Restraints Impact Analysis
TABLE 4 Global Recreational Boat Market, by Competitive Benchmarking,2022
TABLE 5 Global Recreational Boat Market, by Geographical Presence Analysis, 2022
TABLE 6 Global Recreational Boat Market, by Key Strategies Analysis, 2022
TABLE 7 Global Recreational Boat Market, by Yachts , By Region, 2017-2022(US$ Billions)
TABLE 8 Global Recreational Boat Market, by Yachts , By Region, 2023-2030 (US$ Billions)
TABLE 9 Global Recreational Boat Market, by Sailboats , By Region, 2017-2022 (US$ Billions)
TABLE 10 Global Recreational Boat Market, by Sailboats , By Region, 2023-2030(US$ Billions)
TABLE 11 Global Recreational Boat Market, by Personal Watercrafts, By Region, 2017-2022 (US$ Billions)
TABLE 12 Global Recreational Boat Market, by Personal Watercrafts, By Region, 2023-2030(US$ Billions)
TABLE 13 Global Recreational Boat Market, by Inflatables, By Region, 2017-2022 (US$ Billions)
TABLE 14 Global Recreational Boat Market, by Inflatables, By Region, 2023-2030(US$ Billions)
TABLE 15 Global Recreational Boat Market, by Others, By Region, 2017-2022 (US$ Billions)
TABLE 16 Global Recreational Boat Market, by Others, By Region, 2023-2030(US$ Billions)
TABLE 17 Global Recreational Boat Market, by <30 Feet, By Region, 2017-2022(US$ Billions)
TABLE 18 Global Recreational Boat Market, by <30 Feet, By Region, 2023-2030(US$ Billions)
TABLE 19 Global Recreational Boat Market, by 30-50 Feet, By Region, 2017-2022(US$ Billions)
TABLE 20 Global Recreational Boat Market, by 30-50 Feet, By Region, 2023-2030(US$ Billions)
TABLE 21 Global Recreational Boat Market, by >50 Feet, By Region, 2017-2022(US$ Billions)
TABLE 22 Global Recreational Boat Market, by >50 Feet, By Region, 2023-2030(US$ Billions)
TABLE 23 Global Recreational Boat Market, by Outboards, By Region, 2017-2022(US$ Billions)
TABLE 24 Global Recreational Boat Market, by Outboards, By Region, 2023-2030(US$ Billions)
TABLE 25 Global Recreational Boat Market, by Inboards, By Region, 2017-2022(US$ Billions)
TABLE 26 Global Recreational Boat Market, by Inboards, By Region, 2023-2030(US$ Billions)
TABLE 27 Global Recreational Boat Market, by Others, By Region, 2017-2022(US$ Billions)
TABLE 28 Global Recreational Boat Market, by Others, By Region, 2023-2030(US$ Billions)
TABLE 29 Global Recreational Boat Market, By Boat Type, 2017-2022(US$ Billions)
TABLE 30 Global Recreational Boat Market, By Boat Type, 2023-2030(US$ Billions)
TABLE 31 Global Recreational Boat Market, By Boat Size, 2017-2022(US$ Billions)
TABLE 32 Global Recreational Boat Market, By Boat Size, 2023-2030(US$ Billions)
TABLE 33 Global Recreational Boat Market, By Engine Placement, 2017-2022(US$ Billions)
TABLE 34 Global Recreational Boat Market, By Engine Placement, 2023-2030 (US$ Billions)
TABLE 35 Global Recreational Boat Market, By Engine Type, 2017-2022(US$ Billions)
TABLE 36 Global Recreational Boat Market, By Engine Type, 2023-2030(US$ Billions)
TABLE 37 Global Recreational Boat Market, By Power Range, 2017-2022(US$ Billions)
TABLE 38 Global Recreational Boat Market, By Power Range, 2023-2030(US$ Billions)
TABLE 39 Global Recreational Boat Market, By Activity Type, 2017-2022(US$ Billions)
TABLE 40 Global Recreational Boat Market, By Activity Type, 2023-2030(US$ Billions)
TABLE 41 Global Recreational Boat Market, By Power Source, 2017-2022(US$ Billions)
TABLE 42 Global Recreational Boat Market, By Power Source, 2023-2030(US$ Billions)
TABLE 43 Global Recreational Boat Market, by Region, 2017-2022(US$ Billions)
TABLE 44 Global Recreational Boat Market, by Region, 2023-2030(US$ Billions)
TABLE 45 North America Recreational Boat Market, By Boat Type, 2017-2022(US$ Billions)
TABLE 46 North America Recreational Boat Market, By Boat Type, 2023-2030(US$ Billions)
TABLE 47 North America Recreational Boat Market, By Boat Size, 2017-2022(US$ Billions)
TABLE 48 North America Recreational Boat Market, By Boat Size, 2023-2030(US$ Billions)
TABLE 49 North America Recreational Boat Market, By Engine Placement, 2017-2022(US$ Billions)
TABLE 50 North America Recreational Boat Market, By Engine Placement, 2023-2030(US$ Billions)
TABLE 51 North America Recreational Boat Market, By Engine Type, 2017-2022(US$ Billions)
TABLE 52 North America Recreational Boat Market, By Engine Type, 2023-2030(US$ Billions)
TABLE 53 North America Recreational Boat Market, By Power Range, 2017-2022(US$ Billions)
TABLE 54 North America Recreational Boat Market, By Power Range, 2023-2030(US$ Billions)
TABLE 55 North America Recreational Boat Market, By Activity Type, 2017-2022(US$ Billions)
TABLE 56 North America Recreational Boat Market, By Activity Type, 2023-2030(US$ Billions)
TABLE 57 North America Recreational Boat Market, By Power Source, 2017-2022(US$ Billions)
TABLE 58 North America Recreational Boat Market, By Activity Type, 2023-2030(US$ Billions)
TABLE 59 North America Recreational Boat Market, by Country, 2017-2022(US$ Billions)
TABLE 60 North America Recreational Boat Market, by Country, 2023-2030(US$ Billions)
TABLE 61 United States Recreational Boat Market, By Boat Type, 2017-2022(US$ Billions)
TABLE 62 United States Recreational Boat Market, By Boat Type, 2023-2030(US$ Billions)
TABLE 63 United States Recreational Boat Market, By Boat Size, 2017-2022(US$ Billions)
TABLE 64 United States Recreational Boat Market, By Boat Size, 2023-2030(US$ Billions)
TABLE 65 United States Recreational Boat Market, By Engine Placement, 2017-2022(US$ Billions)
TABLE 66 United States Recreational Boat Market, By Engine Placement, 2023-2030(US$ Billions)
TABLE 67 United States Recreational Boat Market, By Engine Type, 2017-2022(US$ Billions)
TABLE 68 United States Recreational Boat Market, By Engine Type, 2023-2030(US$ Billions)
TABLE 69 United States Recreational Boat Market, By Power Range, 2017-2022(US$ Billions)
TABLE 70 United States Recreational Boat Market, By Power Range, 2023-2030(US$ Billions)
TABLE 71 United States Recreational Boat Market, By Activity Type, 2017-2022(US$ Billions)
TABLE 72 United States Recreational Boat Market, By Activity Type, 2023-2030(US$ Billions)
TABLE 73 United States Recreational Boat Market, By Power Source, 2017-2022(US$ Billions)
TABLE 74 United States Recreational Boat Market, By Power Source, 2023-2030(US$ Billions)
TABLE 75 Canada Recreational Boat Market, By Boat Type, 2017-2022(US$ Billions)
TABLE 76 Canada Recreational Boat Market, By Boat Type, 2023-2030(US$ Billions)
TABLE 77 Canada Recreational Boat Market, by Boat Size, 2017-2022(US$ Billions)
TABLE 78 Canada Recreational Boat Market, by Boat Size, 2023-2030(US$ Billions)
TABLE 79 Canada Recreational Boat Market, By Engine Placement, 2017-2022(US$ Billions)
TABLE 80 Canada Recreational Boat Market, By Engine Placement, 2023-2030(US$ Billions)
TABLE 81 Canada Recreational Boat Market, By Engine Type, 2017-2022(US$ Billions)
TABLE 82 Canada Recreational Boat Market, By Engine Type, 2023-2030(US$ Billions)
TABLE 83 Canada Recreational Boat Market, By Power Range, 2017-2022(US$ Billions)
TABLE 84 Canada Recreational Boat Market, By Power Range, 2023-2030(US$ Billions)
TABLE 85 Canada Recreational Boat Market, By Activity Type, 2017-2022(US$ Billions)
TABLE 86 Canada Recreational Boat Market, By Activity Type, 2023-2030(US$ Billions)
TABLE 87 Canada Recreational Boat Market, By Power Source, 2017-2022(US$ Billions)
TABLE 88 Canada Recreational Boat Market, By Power Source, 2023-2030(US$ Billions)
TABLE 89 Mexico Recreational Boat Market, By Boat Type, 2017-2022(US$ Billions)
TABLE 90 Mexico Recreational Boat Market, By Boat Type, 2023-2030(US$ Billions)
TABLE 91 Mexico Recreational Boat Market, by Boat Size, 2017-2022(US$ Billions)
TABLE 92 Mexico Recreational Boat Market, by Boat Size, 2023-2030(US$ Billions)
TABLE 93 Mexico Recreational Boat Market, By Engine Placement, 2017-2022(US$ Billions)
TABLE 94 Mexico Recreational Boat Market, By Engine Placement, 2023-2030(US$ Billions)
TABLE 95 Mexico Recreational Boat Market, By Engine Type, 2017-2022(US$ Billions)
TABLE 96 Mexico Recreational Boat Market, By Engine Type, 2023-2030(US$ Billions)
TABLE 97 Mexico Recreational Boat Market, By Power Range, 2017-2022(US$ Billions)
TABLE 98 Mexico Recreational Boat Market, By Power Range, 2023-2030(US$ Billions)
TABLE 99 Mexico Recreational Boat Market, By Activity Type, 2017-2022(US$ Billions)
TABLE 100 Mexico Recreational Boat Market, By Activity Type, 2023-2030(US$ Billions)
TABLE 101 Mexico Recreational Boat Market, By Power Source, 2017-2022(US$ Billions)
TABLE 102 Mexico Recreational Boat Market, By Power Source, 2023-2030(US$ Billions)
TABLE 103 Europe Recreational Boat Market, By Boat Type, 2017-2022(US$ Billions)
TABLE 104 Europe Recreational Boat Market, By Boat Type, 2023-2030(US$ Billions)
TABLE 105 Europe Recreational Boat Market, by Boat Size, 2017-2022(US$ Billions)
TABLE 106 Europe Recreational Boat Market, by Boat Size, 2023-2030(US$ Billions)
TABLE 107 Europe Recreational Boat Market, By Engine Placement, 2017-2022(US$ Billions)
TABLE 108 Europe Recreational Boat Market, By Engine Placement, 2023-2030(US$ Billions)
TABLE 109 Europe Recreational Boat Market, By Engine Type, 2017-2022(US$ Billions)
TABLE 110 Europe Recreational Boat Market, By Engine Type, 2023-2030(US$ Billions)
TABLE 111 Europe Recreational Boat Market, By Power Range, 2017-2022(US$ Billions)
TABLE 112 Europe Recreational Boat Market, By Power Range, 2023-2030(US$ Billions)
TABLE 113 Europe Recreational Boat Market, By Activity Type, 2017-2022(US$ Billions)
TABLE 114 Europe Recreational Boat Market, By Activity Type, 2023-2030(US$ Billions)
TABLE 115 Europe Recreational Boat Market, By Power Source, 2017-2022(US$ Billions)
TABLE 116 Europe Recreational Boat Market, By Power Source, 2023-2030(US$ Billions)
TABLE 117 Germany Recreational Boat Market, By Boat Type, 2017-2022(US$ Billions)
TABLE 118 Germany Recreational Boat Market, By Boat Type, 2023-2030(US$ Billions)
TABLE 119 Germany Recreational Boat Market, by Boat Size, 2017-2022(US$ Billions)
TABLE 120 Germany Recreational Boat Market, by Boat Size, 2023-2030(US$ Billions)
TABLE 121 Germany Recreational Boat Market, By Engine Placement, 2017-2022(US$ Billions)
TABLE 122 Germany Recreational Boat Market, By Engine Placement, 2023-2030(US$ Billions)
TABLE 123 Germany Recreational Boat Market, By Engine Type, 2017-2022(US$ Billions)
TABLE 124 Germany Recreational Boat Market, By Engine Type, 2023-2030(US$ Billions)
TABLE 125 Germany Recreational Boat Market, By Power Range, 2017-2022(US$ Billions)
TABLE 126 Germany Recreational Boat Market, By Power Range, 2023-2030(US$ Billions)
TABLE 127 Germany Recreational Boat Market, By Activity Type, 2017-2022(US$ Billions)
TABLE 128 Germany Recreational Boat Market, By Activity Type, 2023-2030(US$ Billions)
TABLE 129 Germany Recreational Boat Market, By Power Source, 2017-2022(US$ Billions)
TABLE 130 Germany Recreational Boat Market, By Power Source, 2023-2030(US$ Billions)
TABLE 131 France Recreational Boat Market, By Boat Type, 2017-2022(US$ Billions)
TABLE 132 France Recreational Boat Market, By Boat Type, 2023-2030(US$ Billions)
TABLE 133 France Recreational Boat Market, by Boat Size, 2017-2022(US$ Billions)
TABLE 134 France Recreational Boat Market, by Boat Size, 2023-2030(US$ Billions)
TABLE 135 France Recreational Boat Market, By Engine Placement, 2017-2022(US$ Billions)
TABLE 136 France Recreational Boat Market, By Engine Placement, 2023-2030(US$ Billions)
TABLE 137 France Recreational Boat Market, By Engine Type, 2017-2022(US$ Billions)
TABLE 138 France Recreational Boat Market, By Engine Type, 2023-2030(US$ Billions)
TABLE 139 France Recreational Boat Market, By Power Range, 2017-2022(US$ Billions)
TABLE 140 France Recreational Boat Market, By Power Range, 2023-2030(US$ Billions)
TABLE 141 France Recreational Boat Market, By Activity Type, 2017-2022(US$ Billions)
TABLE 142 France Recreational Boat Market, By Activity Type, 2023-2030(US$ Billions)
TABLE 143 France Recreational Boat Market, By Power Source, 2017-2022(US$ Billions)
TABLE 144 France Recreational Boat Market, By Power Source, 2023-2030(US$ Billions)
TABLE 145 United Kingdom Recreational Boat Market, By Boat Type, 2017-2022(US$ Billions)
TABLE 146 United Kingdom Recreational Boat Market, By Boat Type, 2023-2030(US$ Billions)
TABLE 147 United Kingdom Recreational Boat Market, by Boat Size, 2017-2022(US$ Billions)
TABLE 148 United Kingdom Recreational Boat Market, by Boat Size, 2023-2030(US$ Billions)
TABLE 149 United Kingdom Recreational Boat Market, By Engine Placement, 2017-2022(US$ Billions)
TABLE 150 United Kingdom Recreational Boat Market, By Engine Placement, 2023-2030(US$ Billions)
TABLE 151 United Kingdom Recreational Boat Market, By Engine Type, 2017-2022(US$ Billions)
TABLE 152 United Kingdom Recreational Boat Market, By Engine Type, 2023-2030(US$ Billions)
TABLE 153 United Kingdom Recreational Boat Market, By Power Range, 2017-2022(US$ Billions)
TABLE 154 United Kingdom Recreational Boat Market, By Power Range, 2023-2030(US$ Billions)
TABLE 155 United Kingdom Recreational Boat Market, By Activity Type, 2017-2022(US$ Billions)
TABLE 156 United Kingdom Recreational Boat Market, By Activity Type, 2023-2030(US$ Billions)
TABLE 157 United Kingdom Recreational Boat Market, By Power Source, 2017-2022(US$ Billions)
TABLE 158 United Kingdom Recreational Boat Market, By Power Source, 2023-2030(US$ Billions)
TABLE 159 Italy Recreational Boat Market, By Boat Type, 2017-2022(US$ Billions)
TABLE 160 Italy Recreational Boat Market, By Boat Type, 2023-2030(US$ Billions)
TABLE 161 Italy Recreational Boat Market, by Boat Size, 2017-2022(US$ Billions)
TABLE 162 Italy Recreational Boat Market, by Boat Size, 2023-2030(US$ Billions)
TABLE 163 Italy Recreational Boat Market, By Engine Placement, 2017-2022(US$ Billions)
TABLE 164 Italy Recreational Boat Market, By Engine Placement, 2023-2030(US$ Billions)
TABLE 165 Italy Recreational Boat Market, By Engine Type, 2017-2022(US$ Billions)
TABLE 166 Italy Recreational Boat Market, By Engine Type, 2023-2030(US$ Billions)
TABLE 167 Italy Recreational Boat Market, By Power Range, 2017-2022(US$ Billions)
TABLE 168 Italy Recreational Boat Market, By Power Range, 2023-2030(US$ Billions)
TABLE 169 Italy Recreational Boat Market, By Activity Type, 2017-2022(US$ Billions)
TABLE 170 Italy Recreational Boat Market, By Activity Type, 2023-2030(US$ Billions)
TABLE 171 Italy Recreational Boat Market, By Power Source, 2017-2022(US$ Billions)
TABLE 172 Italy Recreational Boat Market, By Power Source, 2023-2030(US$ Billions)
TABLE 173 Spain Recreational Boat Market, By Boat Type, 2017-2022(US$ Billions)
TABLE 174 Spain Recreational Boat Market, By Boat Type, 2023-2030(US$ Billions)
TABLE 175 Spain Recreational Boat Market, by Boat Size, 2017-2022(US$ Billions)
TABLE 176 Spain Recreational Boat Market, by Boat Size, 2023-2030(US$ Billions)
TABLE 177 Spain Recreational Boat Market, By Engine Placement, 2017-2022(US$ Billions)
TABLE 178 Spain Recreational Boat Market, By Engine Placement, 2023-2030(US$ Billions)
TABLE 179 Spain Recreational Boat Market, By Engine Type, 2017-2022(US$ Billions)
TABLE 180 Spain Recreational Boat Market, By Engine Type, 2023-2030(US$ Billions)
TABLE 181 Spain Recreational Boat Market, By Power Range, 2017-2022(US$ Billions)
TABLE 182 Spain Recreational Boat Market, By Power Range, 2023-2030(US$ Billions)
TABLE 183 Spain Recreational Boat Market, By Activity Type, 2017-2022(US$ Billions)
TABLE 184 Spain Recreational Boat Market, By Activity Type, 2023-2030(US$ Billions)
TABLE 185 Spain Recreational Boat Market, By Power Source, 2017-2022(US$ Billions)
TABLE 186 Spain Recreational Boat Market, By Power Source, 2023-2030(US$ Billions)
TABLE 187 Rest of Europe Recreational Boat Market, By Boat Type, 2017-2022(US$ Billions)
TABLE 188 Rest of Europe Recreational Boat Market, By Boat Type, 2023-2030(US$ Billions)
TABLE 189 Rest of Europe Recreational Boat Market, by Boat Size, 2017-2022(US$ Billions)
TABLE 190 Rest of Europe Recreational Boat Market, by Boat Size, 2023-2030(US$ Billions)
TABLE 191 Rest of Europe Recreational Boat Market, By Engine Placement, 2017-2022(US$ Billions)
TABLE 192 Rest of Europe Recreational Boat Market, By Engine Placement, 2023-2030(US$ Billions)
TABLE 193 Rest of Europe Recreational Boat Market, By Engine Type, 2017-2022(US$ Billions)
TABLE 194 Rest of Europe Recreational Boat Market, By Engine Type, 2023-2030(US$ Billions)
TABLE 195 Rest of Europe Recreational Boat Market, By Power Range, 2017-2022(US$ Billions)
TABLE 196 Rest of Europe Recreational Boat Market, By Power Range, 2023-2030(US$ Billions)
TABLE 197 Rest of Europe Recreational Boat Market, By Activity Type, 2017-2022(US$ Billions)
TABLE 198 Rest of Europe Recreational Boat Market, By Activity Type, 2023-2030(US$ Billions)
TABLE 199 Rest of Europe Recreational Boat Market, By Power Source, 2017-2022(US$ Billions)
TABLE 200 Rest of Europe Recreational Boat Market, By Power Source, 2023-2030(US$ Billions)
TABLE 201
TABLE 202 Asia Pacific Recreational Boat Market, By Boat Type, 2017-2022(US$ Billions)
TABLE 203 Asia Pacific Recreational Boat Market, By Boat Type, 2023-2030(US$ Billions)
TABLE 204 Asia Pacific Recreational Boat Market, by Boat Size, 2017-2022(US$ Billions)
TABLE 205 Asia Pacific Recreational Boat Market, by Boat Size, 2023-2030(US$ Billions)
TABLE 206 Asia Pacific Recreational Boat Market, By Engine Placement, 2017-2022(US$ Billions)
TABLE 207 Asia Pacific Recreational Boat Market, By Engine Placement, 2023-2030(US$ Billions)
TABLE 208 Asia Pacific Recreational Boat Market, By Engine Type, 2017-2022(US$ Billions)
TABLE 209 Asia Pacific Recreational Boat Market, By Engine Type, 2023-2030(US$ Billions)
TABLE 210 Asia Pacific Recreational Boat Market, By Power Range, 2017-2022(US$ Billions)
TABLE 211 Asia Pacific Recreational Boat Market, By Power Range, 2023-2030(US$ Billions)
TABLE 212 Asia Pacific Recreational Boat Market, By Activity Type, 2017-2022(US$ Billions)
TABLE 213 Asia Pacific Recreational Boat Market, By Activity Type, 2023-2030(US$ Billions)
TABLE 214 Asia Pacific Recreational Boat Market, By Power Source, 2017-2022(US$ Billions)
TABLE 215 Asia Pacific Recreational Boat Market, By Power Source, 2023-2030(US$ Billions)
TABLE 216 China Recreational Boat Market, By Boat Type, 2017-2022(US$ Billions)
TABLE 217 China Recreational Boat Market, By Boat Type, 2023-2030(US$ Billions)
TABLE 218 China Recreational Boat Market, by Boat Size, 2017-2022(US$ Billions)
TABLE 219 China Recreational Boat Market, by Boat Size, 2023-2030(US$ Billions)
TABLE 220 China Recreational Boat Market, By Engine Placement, 2017-2022(US$ Billions)
TABLE 221 China Recreational Boat Market, By Engine Placement, 2023-2030(US$ Billions)
TABLE 222 China Recreational Boat Market, By Engine Type, 2017-2022(US$ Billions)
TABLE 223 China Recreational Boat Market, By Engine Type, 2023-2030(US$ Billions)
TABLE 224 China Recreational Boat Market, By Power Range, 2017-2022(US$ Billions)
TABLE 225 China Recreational Boat Market, By Power Range, 2023-2030(US$ Billions)
TABLE 226 China Recreational Boat Market, By Activity Type, 2017-2022(US$ Billions)
TABLE 227 China Recreational Boat Market, By Activity Type, 2023-2030(US$ Billions)
TABLE 228 China Recreational Boat Market, By Power Source, 2017-2022(US$ Billions)
TABLE 229 China Recreational Boat Market, By Power Source, 2023-2030(US$ Billions)
TABLE 230 Japan Recreational Boat Market, By Boat Type, 2017-2022(US$ Billions)
TABLE 231 Japan Recreational Boat Market, By Boat Type, 2023-2030(US$ Billions)
TABLE 232 Japan Recreational Boat Market, by Boat Size, 2017-2022(US$ Billions)
TABLE 233 Japan Recreational Boat Market, by Boat Size, 2023-2030(US$ Billions)
TABLE 234 Japan Recreational Boat Market, By Engine Placement, 2017-2022(US$ Billions)
TABLE 235 Japan Recreational Boat Market, By Engine Placement, 2023-2030(US$ Billions)
TABLE 236 Japan Recreational Boat Market, By Engine Type, 2017-2022(US$ Billions)
TABLE 237 Japan Recreational Boat Market, By Engine Type, 2023-2030(US$ Billions)
TABLE 238 Japan Recreational Boat Market, By Power Range, 2017-2022(US$ Billions)
TABLE 239 Japan Recreational Boat Market, By Power Range, 2023-2030(US$ Billions)
TABLE 240 Japan Recreational Boat Market, By Activity Type, 2017-2022(US$ Billions)
TABLE 241 Japan Recreational Boat Market, By Activity Type, 2023-2030(US$ Billions)
TABLE 242 India Recreational Boat Market, By Boat Type, 2017-2022(US$ Billions)
TABLE 243 India Recreational Boat Market, By Boat Type, 2023-2030(US$ Billions)
TABLE 244 India Recreational Boat Market, by Boat Size, 2017-2022(US$ Billions)
TABLE 245 India Recreational Boat Market, by Boat Size, 2023-2030(US$ Billions)
TABLE 246 India Recreational Boat Market, By Engine Placement, 2017-2022(US$ Billions)
TABLE 247 India Recreational Boat Market, By Engine Placement, 2023-2030(US$ Billions)
TABLE 248 India Recreational Boat Market, By Engine Type, 2017-2022(US$ Billions)
TABLE 249 India Recreational Boat Market, By Engine Type, 2023-2030(US$ Billions)
TABLE 250 India Recreational Boat Market, By Power Range, 2017-2022(US$ Billions)
TABLE 251 India Recreational Boat Market, By Power Range, 2023-2030(US$ Billions)
TABLE 252 India Recreational Boat Market, By Activity Type, 2017-2022(US$ Billions)
TABLE 253 India Recreational Boat Market, By Activity Type, 2023-2030(US$ Billions)
TABLE 254 India Recreational Boat Market, By Power Source, 2017-2022(US$ Billions)
TABLE 255 India Recreational Boat Market, By Power Source, 2023-2030(US$ Billions)
TABLE 256 South Korea Recreational Boat Market, By Boat Type, 2017-2022(US$ Billions)
TABLE 257 South Korea Recreational Boat Market, By Boat Type, 2023-2030(US$ Billions)
TABLE 258 South Korea Recreational Boat Market, by Boat Size, 2017-2022(US$ Billions)
TABLE 259 South Korea Recreational Boat Market, by Boat Size, 2023-2030(US$ Billions)
TABLE 260 South Korea Recreational Boat Market, By Engine Placement, 2017-2022(US$ Billions)
TABLE 261 South Korea Recreational Boat Market, By Engine Placement, 2023-2030(US$ Billions)
TABLE 262 South Korea Recreational Boat Market, By Engine Type, 2017-2022(US$ Billions)
TABLE 263 South Korea Recreational Boat Market, By Engine Type, 2023-2030(US$ Billions)
TABLE 264 South Korea Recreational Boat Market, By Power Range, 2017-2022(US$ Billions)
TABLE 265 South Korea Recreational Boat Market, By Power Range, 2023-2030(US$ Billions)
TABLE 266 South Korea Recreational Boat Market, By Activity Type, 2017-2022(US$ Billions)
TABLE 267 South Korea Recreational Boat Market, By Activity Type, 2023-2030(US$ Billions)
TABLE 268 South Korea Recreational Boat Market, By Power Source, 2017-2022(US$ Billions)
TABLE 269 South Korea Recreational Boat Market, By Power Source, 2023-2030(US$ Billions)
TABLE 270 South-East Asia Recreational Boat Market, By Boat Type, 2017-2022(US$ Billions)
TABLE 271 South-East Asia Recreational Boat Market, By Boat Type, 2023-2030(US$ Billions)
TABLE 272 South-East Asia Recreational Boat Market, by Boat Size, 2017-2022(US$ Billions)
TABLE 273 South-East Asia Recreational Boat Market, by Boat Size, 2023-2030(US$ Billions)
TABLE 274 South-East Asia Recreational Boat Market, By Engine Placement, 2017-2022(US$ Billions)
TABLE 275 South-East Asia Recreational Boat Market, By Engine Placement, 2023-2030(US$ Billions)
TABLE 276 South-East Asia Recreational Boat Market, By Engine Type, 2017-2022(US$ Billions)
TABLE 277 South-East Asia Recreational Boat Market, By Engine Type, 2023-2030(US$ Billions)

TABLE 278 South-East Asia Recreational Boat Market, By Power Range, 2017-2022(US$ Billions)
TABLE 279 South-East Asia Recreational Boat Market, By Power Range, 2023-2030(US$ Billions)
TABLE 280 South-East Asia Recreational Boat Market, By Activity Type, 2017-2022(US$ Billions)
TABLE 281 South-East Asia Recreational Boat Market, By Activity Type, 2023-2030(US$ Billions)
TABLE 282 South-East Asia Recreational Boat Market, By Power Source, 2017-2022(US$ Billions)
TABLE 283 South-East Asia Recreational Boat Market, By Power Source, 2023-2030(US$ Billions)
TABLE 284 Rest of Asia Pacific Recreational Boat Market, By Boat Type, 2017-2022(US$ Billions)
TABLE 285 Rest of Asia Pacific Recreational Boat Market, By Boat Type, 2023-2030(US$ Billions)
TABLE 286 Rest of Asia Pacific Recreational Boat Market, by Boat Size, 2017-2022(US$ Billions)
TABLE 287 Rest of Asia Pacific Recreational Boat Market, by Boat Size, 2023-2030(US$ Billions)
TABLE 288 Rest of Asia Pacific Recreational Boat Market, By Engine Placement, 2017-2022(US$ Billions)
TABLE 289 Rest of Asia Pacific Recreational Boat Market, By Engine Placement, 2023-2030(US$ Billions)
TABLE 290 Rest of Asia Pacific Recreational Boat Market, By Engine Type, 2017-2022(US$ Billions)
TABLE 291 Rest of Asia Pacific Recreational Boat Market, By Engine Type, 2023-2030(US$ Billions)
TABLE 292 Rest of Asia Pacific Recreational Boat Market, By Power Range, 2017-2022(US$ Billions)
TABLE 293 Rest of Asia Pacific Recreational Boat Market, By Power Range, 2023-2030(US$ Billions)
TABLE 294 Rest of Asia Pacific Recreational Boat Market, By Activity Type, 2017-2022(US$ Billions)
TABLE 295 Rest of Asia Pacific Recreational Boat Market, By Activity Type, 2023-2030(US$ Billions)
TABLE 296 Rest of Asia Pacific Recreational Boat Market, By Power Source, 2017-2022(US$ Billions)
TABLE 297 Rest of Asia Pacific Recreational Boat Market, By Power Source, 2023-2030(US$ Billions)
TABLE 298 Latin America Recreational Boat Market, By Boat Type, 2017-2022(US$ Billions)
TABLE 299 Latin America Recreational Boat Market, By Boat Type, 2023-2030(US$ Billions)
TABLE 300 Latin America Recreational Boat Market, by Boat Size, 2017-2022(US$ Billions)
TABLE 301 Latin America Recreational Boat Market, by Boat Size, 2023-2030(US$ Billions)
TABLE 302 Latin America Recreational Boat Market, By Engine Placement, 2017-2022(US$ Billions)
TABLE 303 Latin America Recreational Boat Market, By Engine Placement, 2023-2030(US$ Billions)
TABLE 304 Latin America Recreational Boat Market, By Engine Type, 2017-2022(US$ Billions)
TABLE 305 Latin America Recreational Boat Market, By Engine Type, 2023-2030(US$ Billions)
TABLE 306 Latin America Recreational Boat Market, By Power Range, 2017-2022(US$ Billions)
TABLE 307 Latin America Recreational Boat Market, By Power Range, 2023-2030(US$ Billions)
TABLE 308 Latin America Recreational Boat Market, By Activity Type, 2017-2022(US$ Billions)
TABLE 309 Latin America Recreational Boat Market, By Activity Type, 2023-2030(US$ Billions)
TABLE 310 Latin America Recreational Boat Market, By Power Source, 2017-2022(US$ Billions)
TABLE 311 Latin America Recreational Boat Market, By Power Source, 2023-2030(US$ Billions)
TABLE 312 Brazil Recreational Boat Market, By Boat Type, 2017-2022(US$ Billions)
TABLE 313 Brazil Recreational Boat Market, By Boat Type, 2023-2030(US$ Billions)
TABLE 314 Brazil Recreational Boat Market, by Boat Size, 2017-2022(US$ Billions)
TABLE 315 Brazil Recreational Boat Market, by Boat Size, 2023-2030(US$ Billions)
TABLE 316 Brazil Recreational Boat Market, By Engine Placement, 2017-2022(US$ Billions)
TABLE 317 Brazil Recreational Boat Market, By Engine Placement, 2023-2030(US$ Billions)
TABLE 318 Brazil Recreational Boat Market, By Engine Type, 2017-2022(US$ Billions)
TABLE 319 Brazil Recreational Boat Market, By Engine Type, 2023-2030(US$ Billions)
TABLE 320 Brazil Recreational Boat Market, By Power Range, 2017-2022(US$ Billions)
TABLE 321 Brazil Recreational Boat Market, By Power Range, 2023-2030(US$ Billions)
TABLE 322 Brazil Recreational Boat Market, By Activity Type, 2017-2022(US$ Billions)
TABLE 323 Brazil Recreational Boat Market, By Activity Type, 2023-2030(US$ Billions)
TABLE 324 Brazil Recreational Boat Market, By Power Source, 2017-2022(US$ Billions)
TABLE 325 Brazil Recreational Boat Market, By Power Source, 2023-2030(US$ Billions)
TABLE 326 Argentina Recreational Boat Market, By Boat Type, 2017-2022(US$ Billions)
TABLE 327 Argentina Recreational Boat Market, By Boat Type, 2023-2030(US$ Billions)
TABLE 328 Argentina Recreational Boat Market, by Boat Size, 2017-2022(US$ Billions)
TABLE 329 Argentina Recreational Boat Market, by Boat Size, 2023-2030(US$ Billions)
TABLE 330 Argentina Recreational Boat Market, By Engine Placement, 2017-2022(US$ Billions)
TABLE 331 Argentina Recreational Boat Market, By Engine Placement, 2023-2030(US$ Billions)
TABLE 332 Argentina Recreational Boat Market, By Engine Type, 2017-2022(US$ Billions)
TABLE 333 Argentina Recreational Boat Market, By Engine Type, 2023-2030(US$ Billions)
TABLE 334 Argentina Recreational Boat Market, By Power Range, 2017-2022(US$ Billions)
TABLE 335 Argentina Recreational Boat Market, By Power Range, 2023-2030(US$ Billions)
TABLE 336 Argentina Recreational Boat Market, By Activity Type, 2017-2022(US$ Billions)
TABLE 337 Argentina Recreational Boat Market, By Activity Type, 2023-2030(US$ Billions)
TABLE 338 Argentina Recreational Boat Market, By Power Source, 2017-2022(US$ Billions)
TABLE 339 Argentina Recreational Boat Market, By Power Source, 2023-2030(US$ Billions)
TABLE 340 Rest of Latin America Recreational Boat Market, By Boat Type, 2017-2022(US$ Billions)
TABLE 341 Rest of Latin America Recreational Boat Market, By Boat Type, 2023-2030(US$ Billions)
TABLE 342 Rest of Latin America Recreational Boat Market, by Boat Size, 2017-2022(US$ Billions)
TABLE 343 Rest of Latin America Recreational Boat Market, by Boat Size, 2023-2030(US$ Billions)
TABLE 344 Rest of Latin America Recreational Boat Market, By Engine Placement, 2017-2022(US$ Billions)
TABLE 345 Rest of Latin America Recreational Boat Market, By Engine Placement, 2023-2030(US$ Billions)
TABLE 346 Rest of Latin America Recreational Boat Market, By Engine Type , 2017-2022(US$ Billions)
TABLE 347 Rest of Latin America Recreational Boat Market, By Engine Type, 2023-2030(US$ Billions)
TABLE 348 Rest of Latin America Recreational Boat Market, By Power Range , 2017-2022(US$ Billions)
TABLE 349 Rest of Latin America Recreational Boat Market, By Power Range, 2023-2030(US$ Billions)
TABLE 350 Rest of Latin America Recreational Boat Market, By Activity Type , 2017-2022(US$ Billions)
TABLE 351 Rest of Latin America Recreational Boat Market, By Activity Type, 2023-2030(US$ Billions)
TABLE 352 Rest of Latin America Recreational Boat Market, By Power Source, 2017-2022(US$ Billions)
TABLE 353 Rest of Latin America Recreational Boat Market, By Power Source, 2023-2030(US$ Billions)
TABLE 354 Middle East and Africa Recreational Boat Market, By Boat Type, 2017-2022(US$ Billions)
TABLE 355 Middle East and Africa Recreational Boat Market, By Boat Type, 2023-2030(US$ Billions)
TABLE 356 Middle East and Africa Recreational Boat Market, by Boat Size, 2017-2022(US$ Billions)
TABLE 357 Middle East and Africa Recreational Boat Market, by Boat Size, 2023-2030(US$ Billions)
TABLE 358 Middle East and Africa Recreational Boat Market, By Engine Placement, 2017-2022(US$ Billions)
TABLE 359 Middle East and Africa Recreational Boat Market, By Engine Placement, 2023-2030(US$ Billions)
TABLE 360 Middle East and Africa Recreational Boat Market, By Engine Type, 2017-2022(US$ Billions)
TABLE 361 Middle East and Africa Recreational Boat Market, By Power Range, 2023-2030(US$ Billions)
TABLE 362 Middle East and Africa Recreational Boat Market, By Power Range, 2017-2022(US$ Billions)
TABLE 363 Middle East and Africa Recreational Boat Market, By Activity Type, 2023-2030(US$ Billions)
TABLE 364 Middle East and Africa Recreational Boat Market, By Activity Type, 2017-2022(US$ Billions)
TABLE 365 Middle East and Africa Recreational Boat Market, By Activity Type, 2023-2030(US$ Billions)
TABLE 366 Middle East and Africa Recreational Boat Market, By Power Source, 2017-2022(US$ Billions)
TABLE 367 Middle East and Africa Recreational Boat Market, By Power Source, 2023-2030(US$ Billions)
TABLE 368 GCC Countries Recreational Boat Market, By Boat Type, 2017-2022(US$ Billions)
TABLE 369 GCC Countries Recreational Boat Market, By Boat Type, 2023-2030(US$ Billions)
TABLE 370 GCC Countries Recreational Boat Market, by Boat Size, 2017-2022(US$ Billions)
TABLE 371 GCC Countries Recreational Boat Market, by Boat Size, 2023-2030(US$ Billions)
TABLE 372 GCC Countries Recreational Boat Market, By Engine Placement, 2017-2022(US$ Billions)
TABLE 373 GCC Countries Recreational Boat Market, By Engine Placement, 2023-2030(US$ Billions)
TABLE 374 GCC Countries Recreational Boat Market, By Engine Type, 2017-2022(US$ Billions)
TABLE 375 GCC Countries Recreational Boat Market, By Engine Type, 2023-2030(US$ Billions)
TABLE 376 GCC Countries Recreational Boat Market, By Power Range, 2017-2022(US$ Billions)
TABLE 377 GCC Countries Recreational Boat Market, By Power Range, 2023-2030(US$ Billions)
TABLE 378 GCC Countries Recreational Boat Market, By Activity Type, 2017-2022(US$ Billions)
TABLE 379 GCC Countries Recreational Boat Market, By Activity Type, 2023-2030(US$ Billions)
TABLE 380 GCC Countries Recreational Boat Market, By Power Source, 2017-2022(US$ Billions)
TABLE 381 GCC Countries Recreational Boat Market, By Power Source, 2023-2030(US$ Billions)
TABLE 382 South Africa Recreational Boat Market, By Boat Type, 2017-2022(US$ Billions)
TABLE 383 South Africa Recreational Boat Market, By Boat Type, 2023-2030(US$ Billions)
TABLE 384 South Africa Recreational Boat Market, by Boat Size, 2017-2022(US$ Billions)
TABLE 385 South Africa Recreational Boat Market, by Boat Size, 2023-2030(US$ Billions)
TABLE 386 South Africa Recreational Boat Market, By Engine Placement, 2017-2022(US$ Billions)
TABLE 387 South Africa Recreational Boat Market, By Engine Placement, 2023-2030(US$ Billions)
TABLE 388 South Africa Recreational Boat Market, By Engine Type, 2017-2022(US$ Billions)
TABLE 389 South Africa Recreational Boat Market, By Engine Type, 2023-2030(US$ Billions)
TABLE 390 South Africa Recreational Boat Market, By Power Range, 2017-2022(US$ Billions)
TABLE 391 South Africa Recreational Boat Market, By Power Range, 2023-2030(US$ Billions)
TABLE 392 South Africa Recreational Boat Market, By Activity Type, 2017-2022(US$ Billions)
TABLE 393 South Africa Recreational Boat Market, By Activity Type, 2023-2030(US$ Billions)
TABLE 394 South Africa Recreational Boat Market, By Power Source, 2017-2022(US$ Billions)
TABLE 395 South Africa Recreational Boat Market, By Power Source, 2023-2030(US$ Billions)
TABLE 396 Rest of Middle East and Africa Recreational Boat Market, By Boat Type, 2017-2022(US$ Billions)
TABLE 397 Rest of Middle East and Africa Recreational Boat Market, By Boat Type, 2023-2030(US$ Billions)
TABLE 398 Rest of Middle East and Africa Recreational Boat Market, by Boat Size, 2017-2022(US$ Billions)
TABLE 399 Rest of Middle East and Africa Recreational Boat Market, by Boat Size, 2023-2030(US$ Billions)
TABLE 400 Rest of Middle East and Africa Recreational Boat Market, By Engine Placement, 2017-2022(US$ Billions)
TABLE 401 Rest of Middle East and Africa Recreational Boat Market, By Engine Placement, 2023-2030(US$ Billions)
TABLE 402 Rest of Middle East and Africa Recreational Boat Market, By Engine Type, 2017-2022(US$ Billions)
TABLE 403 Rest of Middle East and Africa Recreational Boat Market, By Engine Type, 2023-2030(US$ Billions)
TABLE 404 Rest of Middle East and Africa Recreational Boat Market, By Power Range, 2017-2022(US$ Billions)
TABLE 405 Rest of Middle East and Africa Recreational Boat Market, By Power Range, 2023-2030(US$ Billions)
TABLE 406 Rest of Middle East and Africa Recreational Boat Market, By Activity Type, 2017-2022(US$ Billions)
TABLE 407 Rest of Middle East and Africa Recreational Boat Market, By Activity Type, 2023-2030(US$ Billions)
TABLE 408 Rest of Middle East and Africa Recreational Boat Market, By Power Source, 2017-2022(US$ Billions)
TABLE 409 Rest of Middle East and Africa Recreational Boat Market, By Power Source, 2023-2030(US$ Billions)

Frequently Asked Questions

What is the current size of the global recreational boat market?

In 2022, the market for recreational boats was estimated to be worth USD 16.9 billion.

What is the expected growth rate of the recreational boat market between 2023 and 2030?

The recreational boat market is anticipated to reach USD 26.7 billion in 2030, growing at a CAGR of 6.80% between 2023 and 2030.

Which segment is leading the market share in terms of boat type?

In terms of revenue generation in 2022, the yacht category is the market leader.

Which activity type segment governs the demand for recreational boats in the world?

The Fishing segment contributes the rest to the demand for recreational boats.

Which segment is expected to post the highest CAGR during the forecast period?

The electric sector is expected to grow at the highest CAGR rate in the worldwide market.

Which region is fueling the growth of the recreational boat industry?

North America dominated the market in 2022, accounting for more than 44.4% of worldwide revenue.

Who are the major players in the global recreational boat market?

The top players include Groupe Beneteau, Marine Products Corporation, Royal Caribbean Cruises Ltd, and Brunswick Corporation. Other major players include MCBC Holdings, Inc, Grand Banks Yachts Ltd, Porter, Inc, and Grady-White Boats, Inc..

What are the major market drivers of the recreational boat industry?

Tourism and water sports are growing in popularity are the major market drivers.

What are the major market restraints of the recreational boat industry?

The biggest market restrictions include strict emission regulations for recreational boats, environmental concerns, and high ownership costs.

What are the major market opportunities of the recreational boat industry?

The recreational boat industry’s primary opportunities are the online market for the sector, which may enhance sales in untapped markets and Drive Up Demand for Luxury Yachts.

Electric Guitars Market

Published:
Report ID: 37121

United Kingdom Toothpaste Tablet Market

Published:
Report ID: 36979

Electronic Cigarettes Market

Published:
Report ID: 36948

Soy Protein Ingredients Market

Published:
Report ID: 9445

Wine Corks Market

Published:
Report ID: 36862

Bag in Box Market

Published:
Report ID: 2124

Towel Warmers Market

Published:
Report ID: 36800

Fermented Tea Market

Published:
Report ID: 36734

Luxury Bath and Body Products Market

Published:
Report ID: 36700

Lint Remover Market

Published:
Report ID: 36697

Dishwashing Detergent Market

Published:
Report ID: 36688

CBD Wine Market

Published:
Report ID: 36685

Purchase Options

$2999
Delivery Format: Excel.
$4999
Designed for the individual purchaser.
$6999
Users located at a single corporate site or regional office.
$7999
Allowed for unlimited sharing globally within one company.
Smallform of Sample request

Have a question?

User Profile

Don’t settle for less – trust Mitul to help you find the best solution.

Report delivery within 24 to 48 hours

– Other Info –

What people say?-

User Review

I am very impressed with the information in this report. The author clearly did their research when they came up with this product and it has already given me a lot of ideas.

Jana Schmidt
CEDAR CX Technologies

– Connect with us –

Phone

+91 6232 49 3207


support

24/7 Research Support


sales@credenceresearch.com

– Research Methodology –

Going beyond the basics: advanced techniques in research methodology

– Trusted By –

Pepshi, LG, Nestle
Motorola, Honeywell, Johnson and johnson
LG Chem, SIEMENS, Pfizer
Unilever, Samsonite, QIAGEN