
Home diffusing and skin care anchor frankincense demand
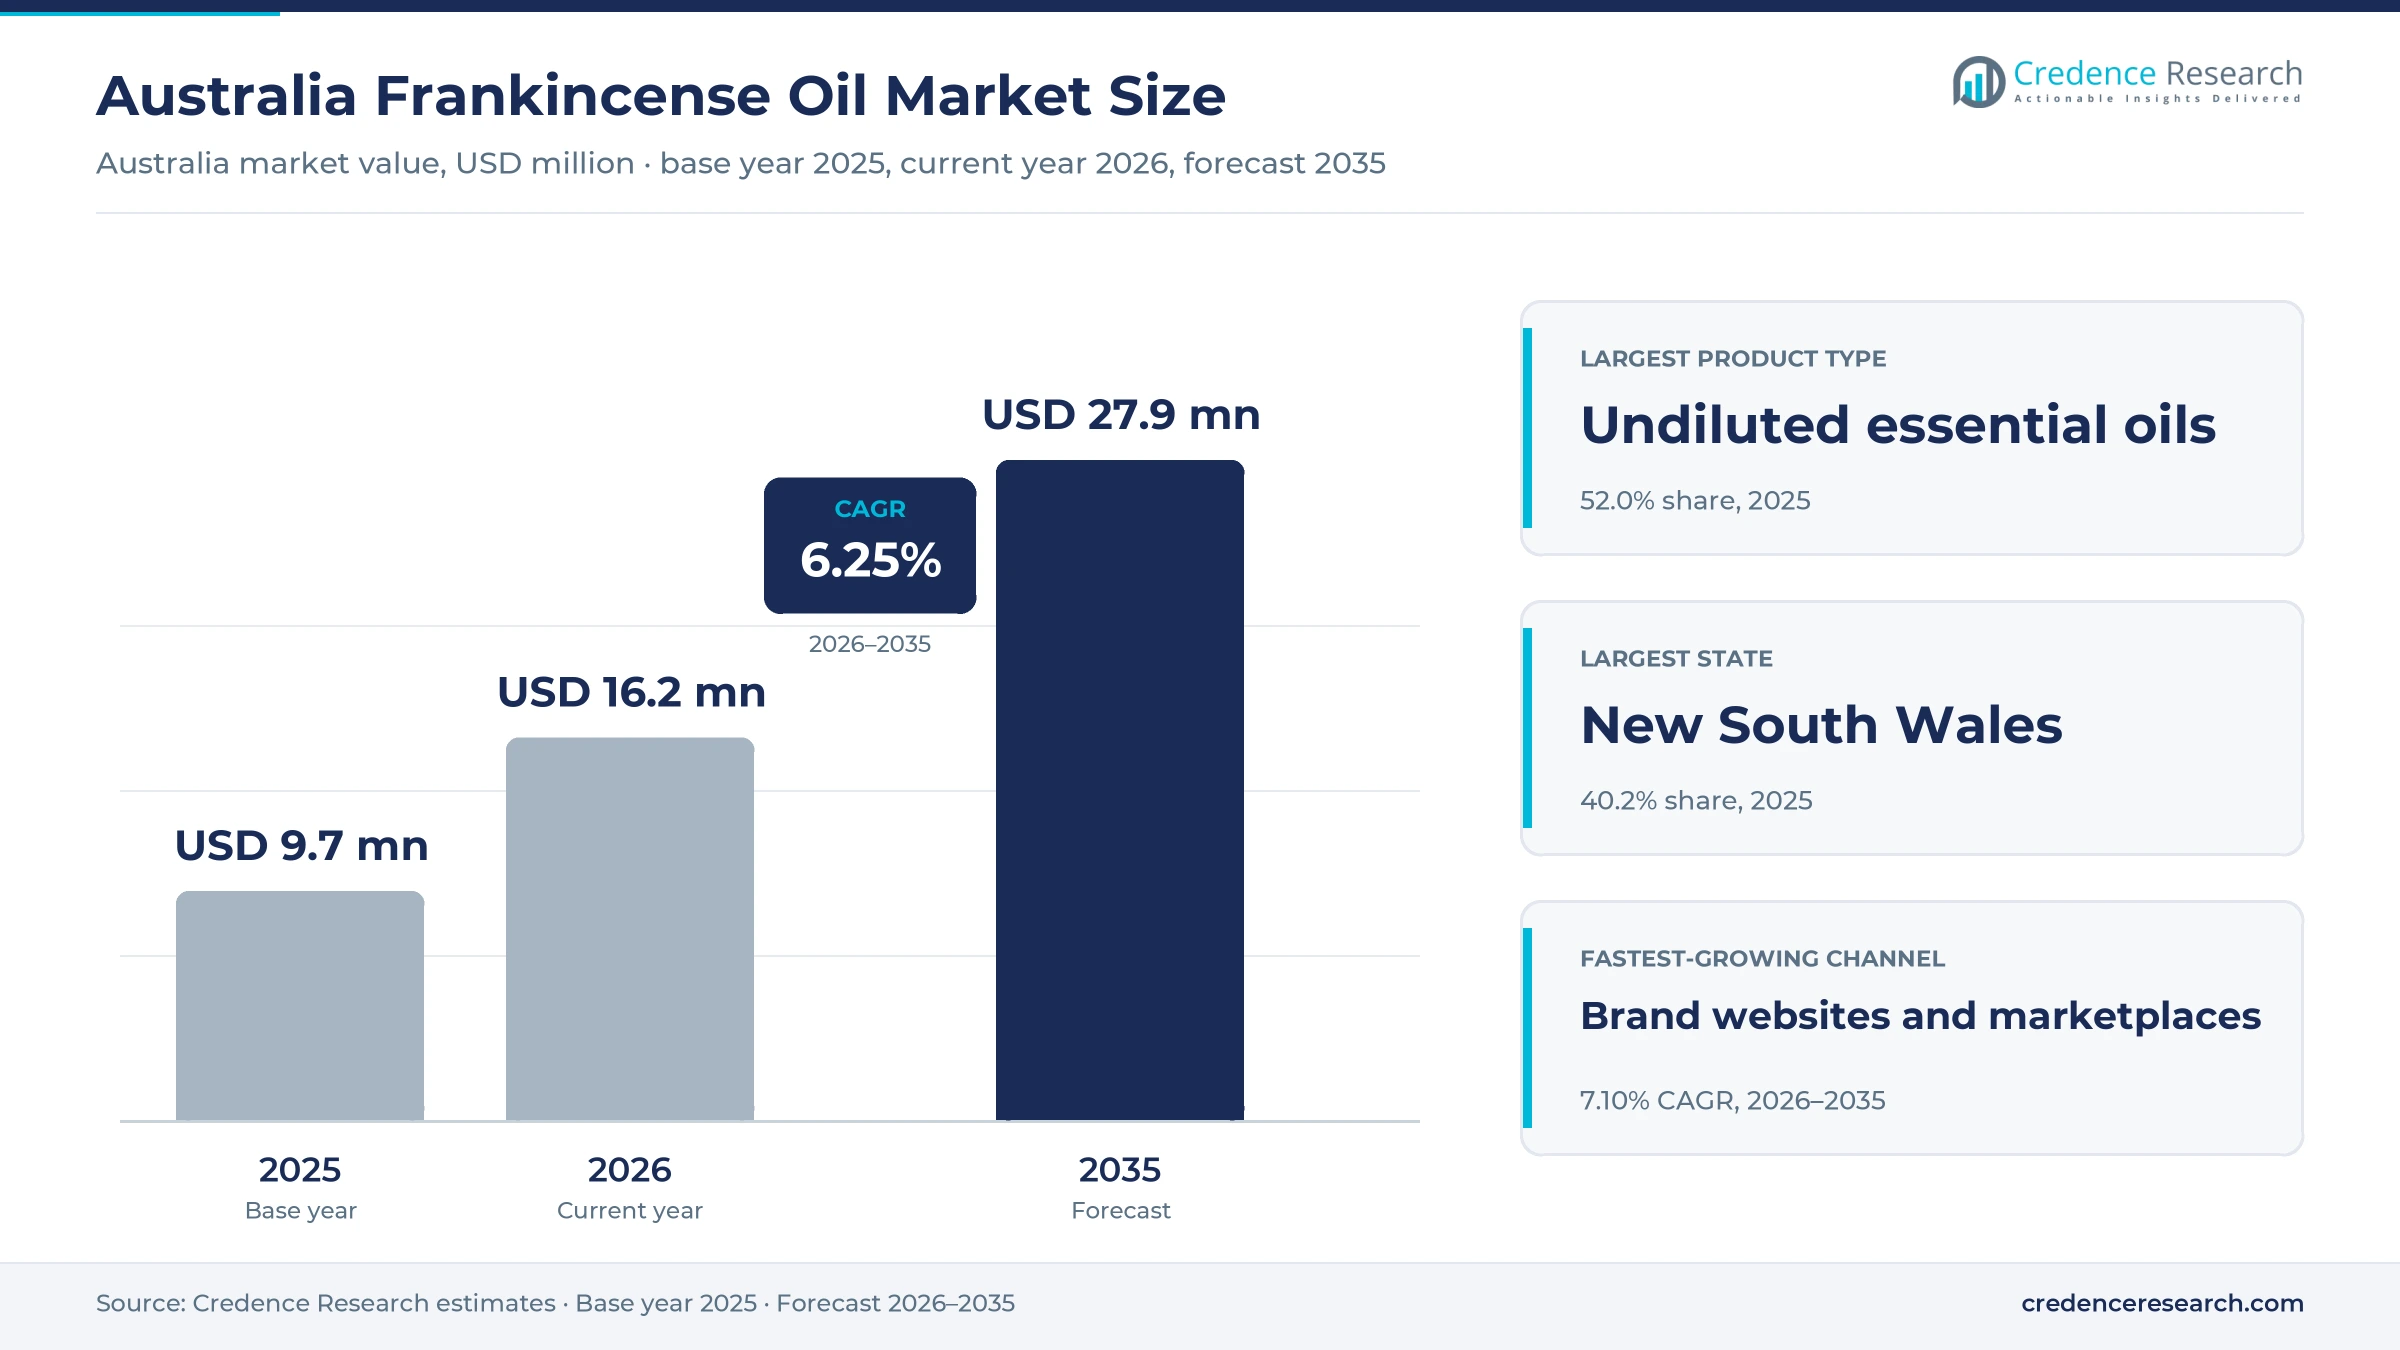
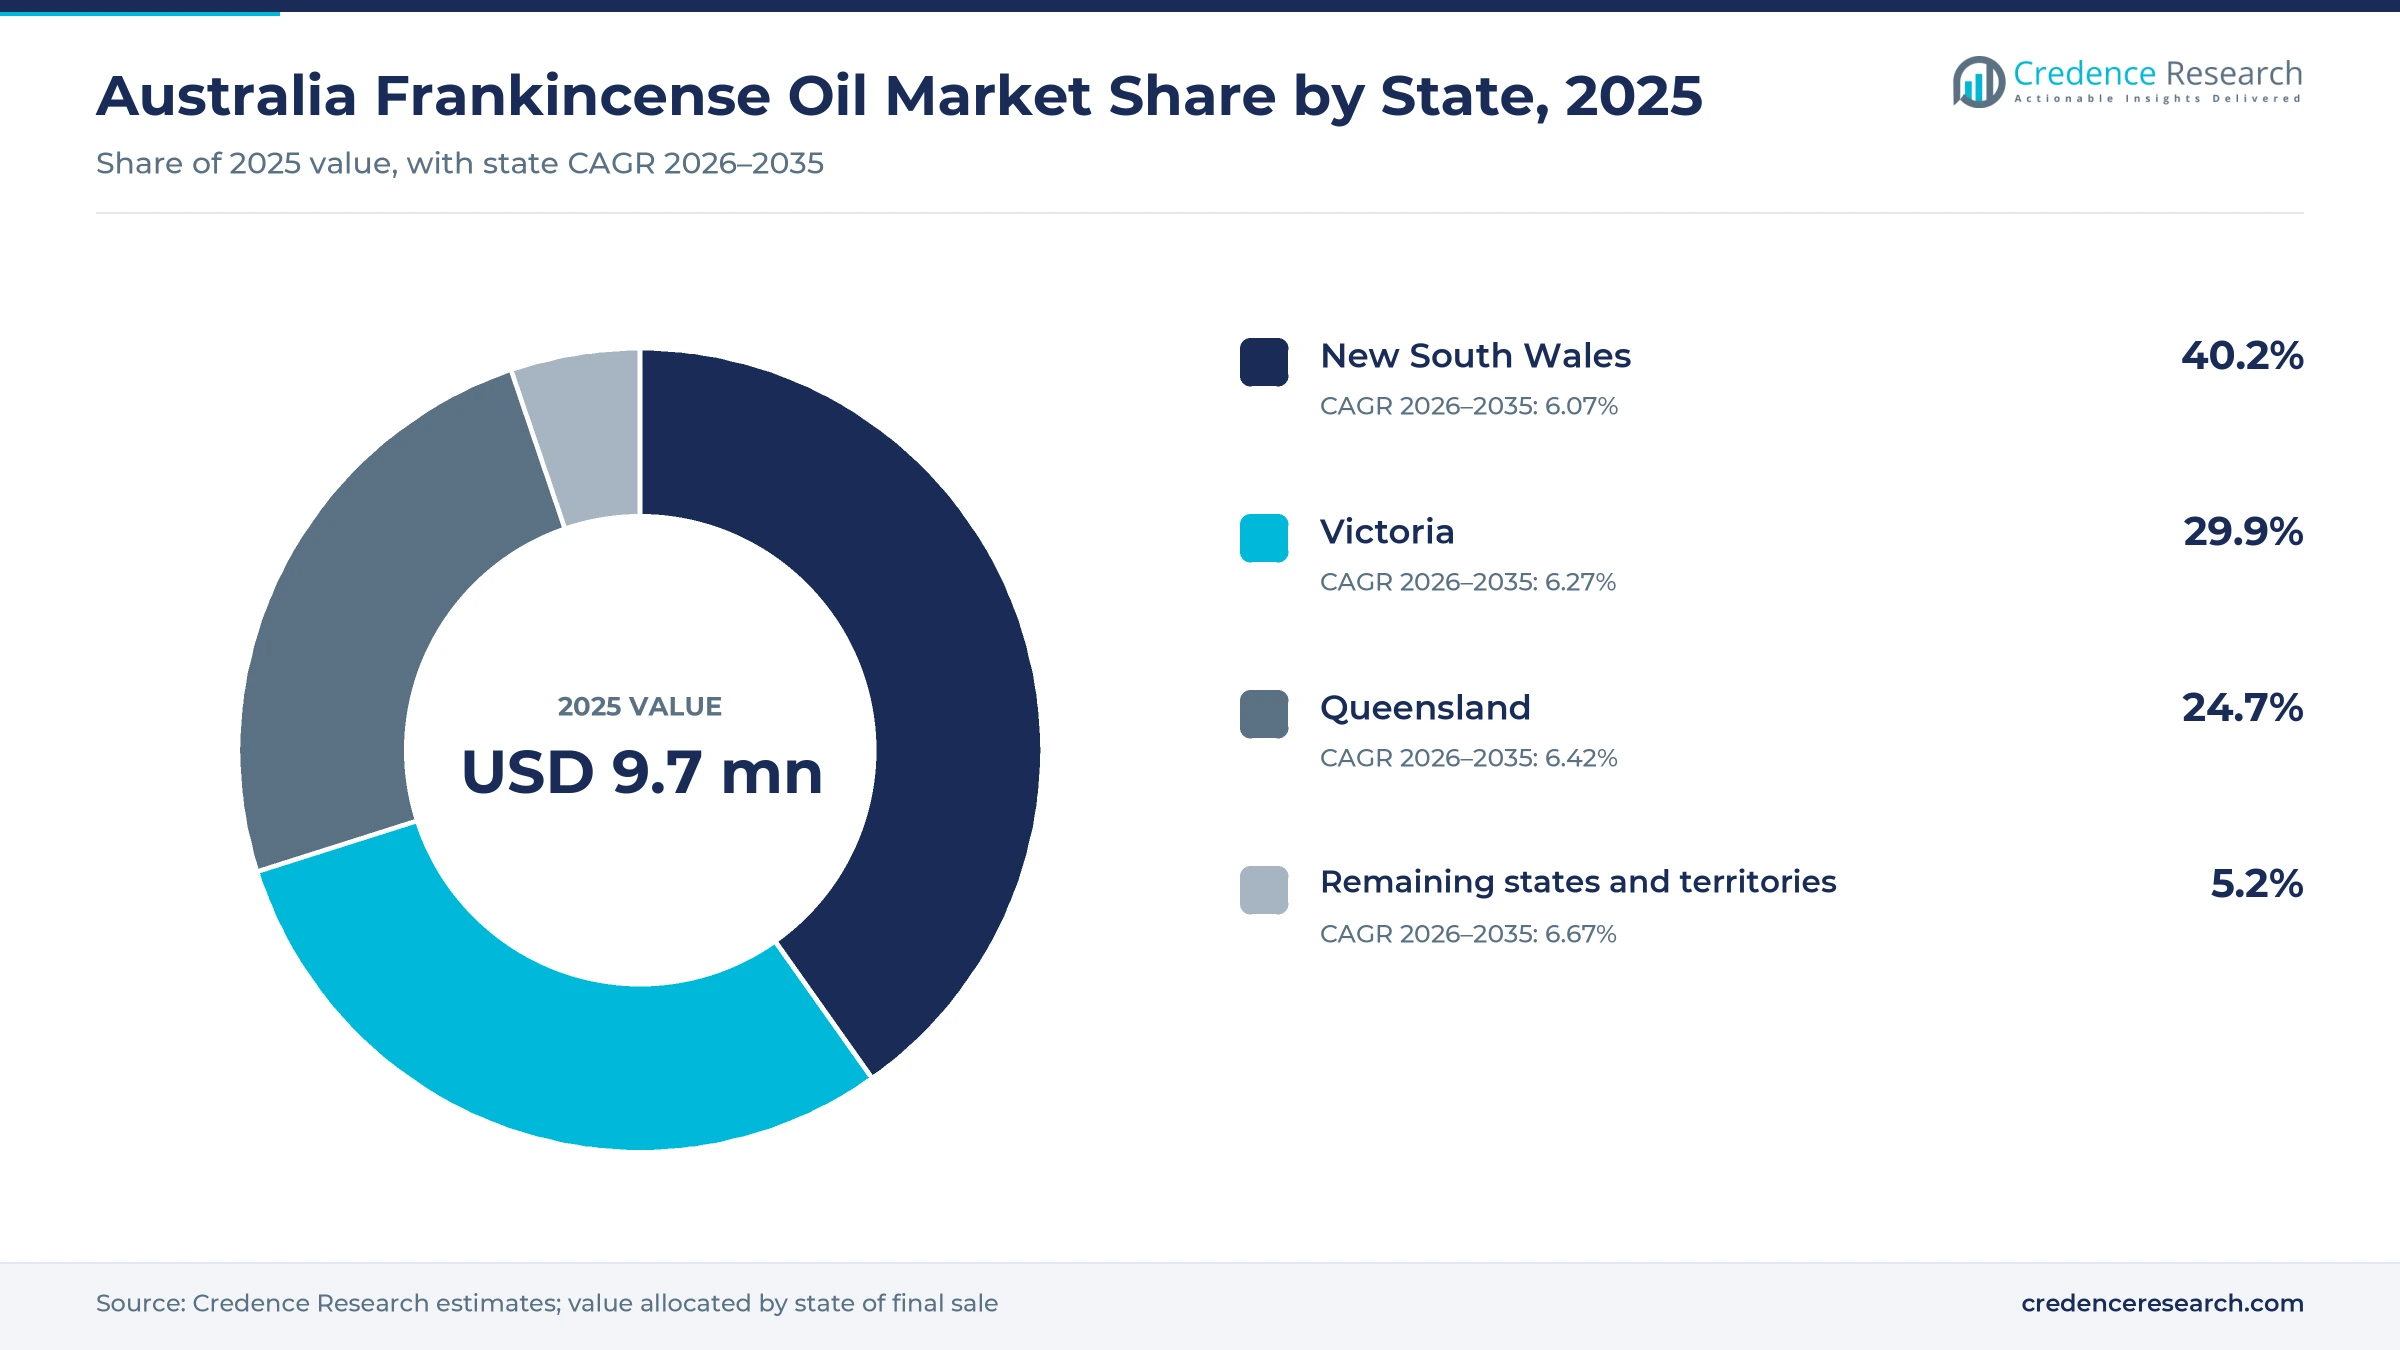
The Australia frankincense oil market was valued at USD 9.7 million in 2025 and is projected to increase from USD 16.2 million in 2026 to USD 27.9 million by 2035, registering a CAGR of 6.25% during 2026–2035. Demand comes from households that use frankincense oil in diffusers for relaxation and meditation, from buyers who add it to skin care for dry and mature skin and from massage and wellness practitioners. New South Wales held the largest state share, 40.2% in 2025, because Sydney has the largest population and the highest online spend. The remaining states and territories form the fastest-growing zone at 6.67% a year, as Western Australia leads national population growth. Most oil reaches buyers through direct sellers, brand websites, marketplaces, specialty stores and pharmacies. Several frankincense oils also appear on the Australian Register of Therapeutic Goods as listed medicines, which lets their sponsors use permitted health claims on labels.
Which frankincense oils and buyers does the estimate cover?
The estimate measures the value of oil distilled or extracted from Boswellia resin and sold in Australia. It covers undiluted essential oils, blends led by frankincense, carrier oils infused with frankincense and carbon dioxide extracts. Values are stated at brand owner and importer selling prices across direct selling, brand websites, marketplaces, specialty stores, pharmacies and professional supply.
The estimate excludes raw resin sold for burning, incense sticks and supplements made from Boswellia serrata extract. The value chain runs from resin tappers in the Horn of Africa, Arabia and India through overseas distillers to Australian importers, bottlers and brands, which sell to households, practitioners, cosmetic makers and venues.
Australia Frankincense Oil Market Insights
- The Australia frankincense oil market was valued at USD 9.7 million in 2025 and is projected to reach USD 27.9 million by 2035, registering a CAGR of 6.25% during 2026–2035.
- New South Wales held a 40.2% share of 2025 value, because Sydney has the largest population and the highest online spend in the country.
- Undiluted essential oils led with a 52.0% share of 2025 value, because buyers use single-note frankincense in diffusers and their own blends.
- A 2025 Royal Botanic Garden Edinburgh review found over 60% of surveyed Boswellia sacra trees had been cut for resin, raising supply scrutiny.
- Australian online spending rose 13.9% in 2025 to a record, which makes brand websites the fastest-growing route to frankincense buyers.
Undiluted oils lead while infused carrier oils grow fastest
Why do undiluted oils lead frankincense sales?
Based on product type, the market is categorized into undiluted essential oils, frankincense-led blends, frankincense-infused carrier oils and carbon dioxide extracts. Undiluted essential oils led with a 52.0% share of 2025 value, because buyers use single-note oil in diffusers and in their own blends. Frankincense-infused carrier oils grow fastest at 7.01% a year, as buyers want ready-to-apply products for skin and massage.
How does skin care outpace home diffusing?
Based on application, the market is categorized into home aromatherapy, personal skin care, professional wellness and specialised labelled uses. Home aromatherapy led with a 46.0% share of 2025 value, because most bottles are bought for diffusing at home. Personal skin care grows fastest at 6.88% a year, as brands promote frankincense for dry and mature skin.
How do direct sellers and websites reach buyers?
Based on distribution channel, the market is categorized into direct selling, brand websites and marketplaces, specialty retail and pharmacies and professional supply. Direct selling led with a 38.0% share of 2025 value, because member networks sell large oil ranges to households. Brand websites and marketplaces grow fastest at 7.10% a year, as shoppers compare origin and price on screen.
Why are super-premium oils gaining share?
Based on price tier, the market is categorized into value, premium and super-premium oils. Premium led with a 48.0% share of 2025 value, because most specialty brands price 10-milliliter bottles in this band. Super-premium grows fastest at 6.73% a year, as certified organic and origin-labeled oils attract buyers who pay more. Value oils sell mainly through pharmacies and online retailers, where shoppers compare the price per milliliter across brands and bottle sizes.
| Segment Group | Leading Sub-segment | Share, 2025 | Fastest-growing Sub-segment | CAGR, 2026–2035 |
|---|---|---|---|---|
| By Product Type | Undiluted essential oils | 52.0% | Frankincense-infused carrier oils | 7.01% |
| By Application | Home aromatherapy | 46.0% | Personal skin care | 6.88% |
| By Distribution Channel | Direct selling | 38.0% | Brand websites and marketplaces | 7.10% |
| By Price Tier | Premium | 48.0% | Super-premium | 6.73% |
Request a Free Sample
Fill in your details and we'll send you a free sample report.
- Sample data tables & charts
- Research methodology
Household use, skin care and online discovery lift sales
How does broader household demand lift frankincense sales?
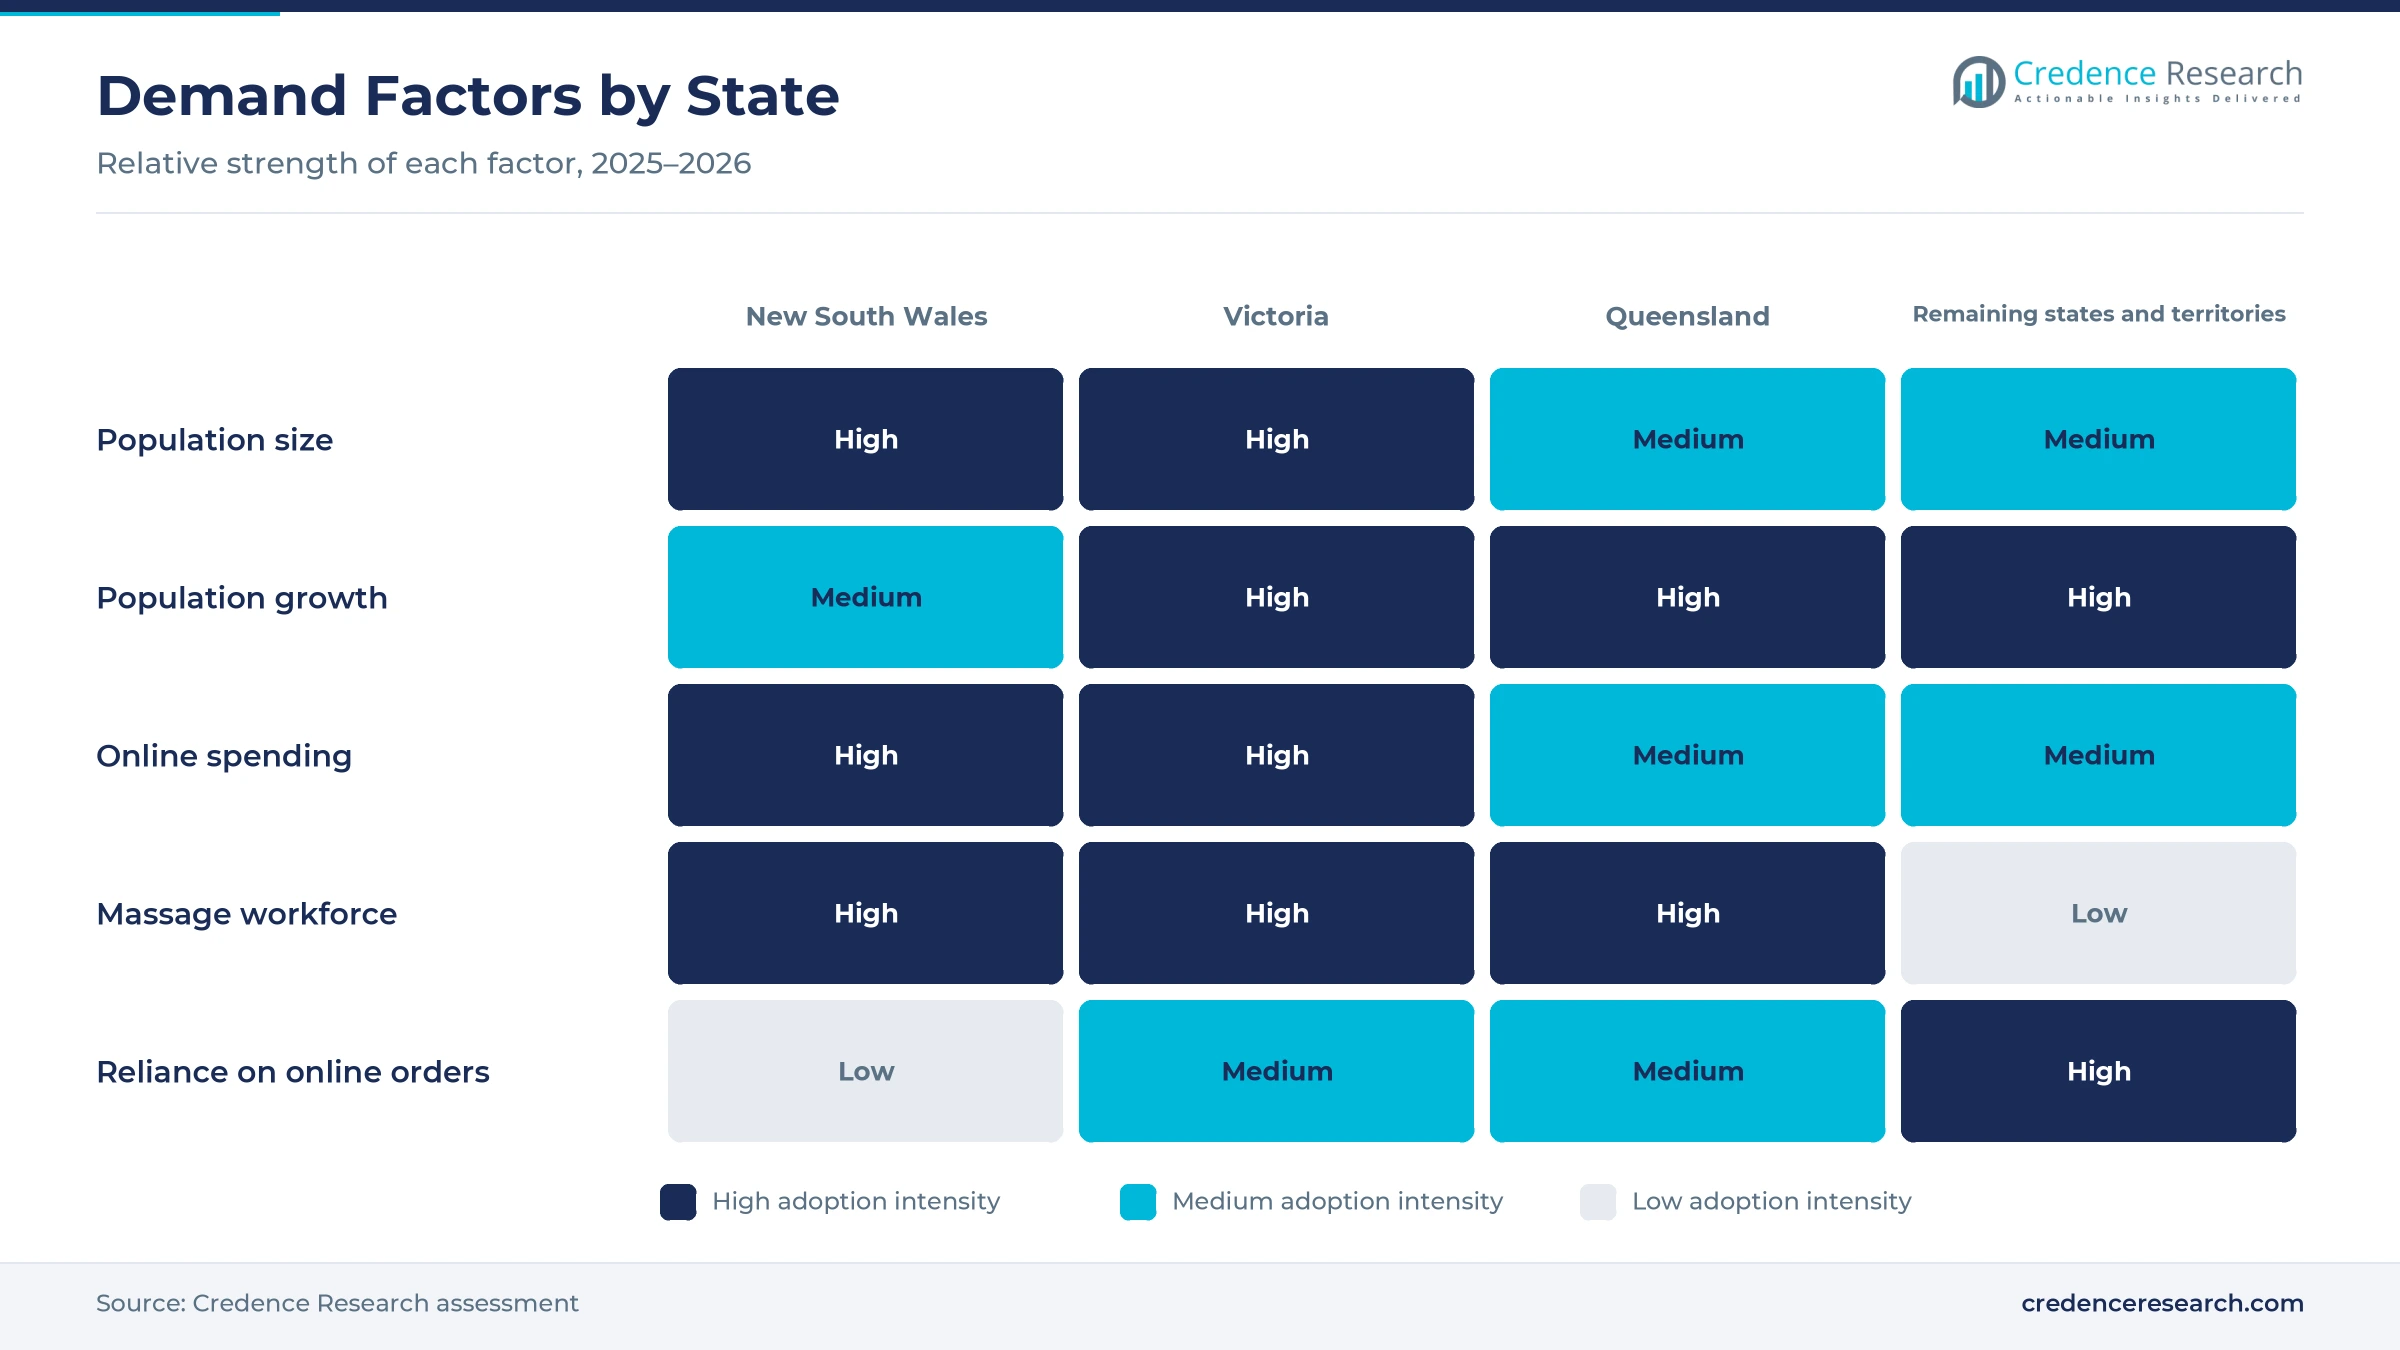
Broader household demand lifts sales, because more homes use frankincense in diffusers for relaxation and meditation. Australia's population reached 27.92 million at March 31, 2026, after growing 1.4% over the year, according to the Australian Bureau of Statistics. Household spending power is also high, as GDP per capita reached about $65,130 in 2025, according to World Bank data. Brands target these home routines directly, since the ECO Modern Essentials brand promotes its 10-milliliter frankincense oil for stress relief and meditation. Oil Garden also sells a 12-milliliter frankincense oil through Amcal pharmacies for nervous tension and mild stress. As a result, home aromatherapy holds a 46.0% share of 2025 value, and repeat buying follows population gains.
Why does skin care format expansion add value?
Skin care format expansion adds value, because brands now position frankincense for dry, mature and damaged skin as well as for diffusing. Springfields recommends its frankincense oil for dry and mature skin and for supporting skin repair, and lists a 5-milliliter bottle at a $49.95 recommended price. Perfect Potion says its products carry Australian Certified Organic and COSMOS certification and are made under ISO 22716 good manufacturing practice. Cosmetic makers that buy any ingredient overseas must also register with the industrial chemicals regulator, regardless of volume, which favors established formulators. These steps place frankincense next to natural cosmetics on shelves. In turn, personal skin care grows at 6.88% a year, the fastest application rate in the forecast.
How does digital product discovery widen access?
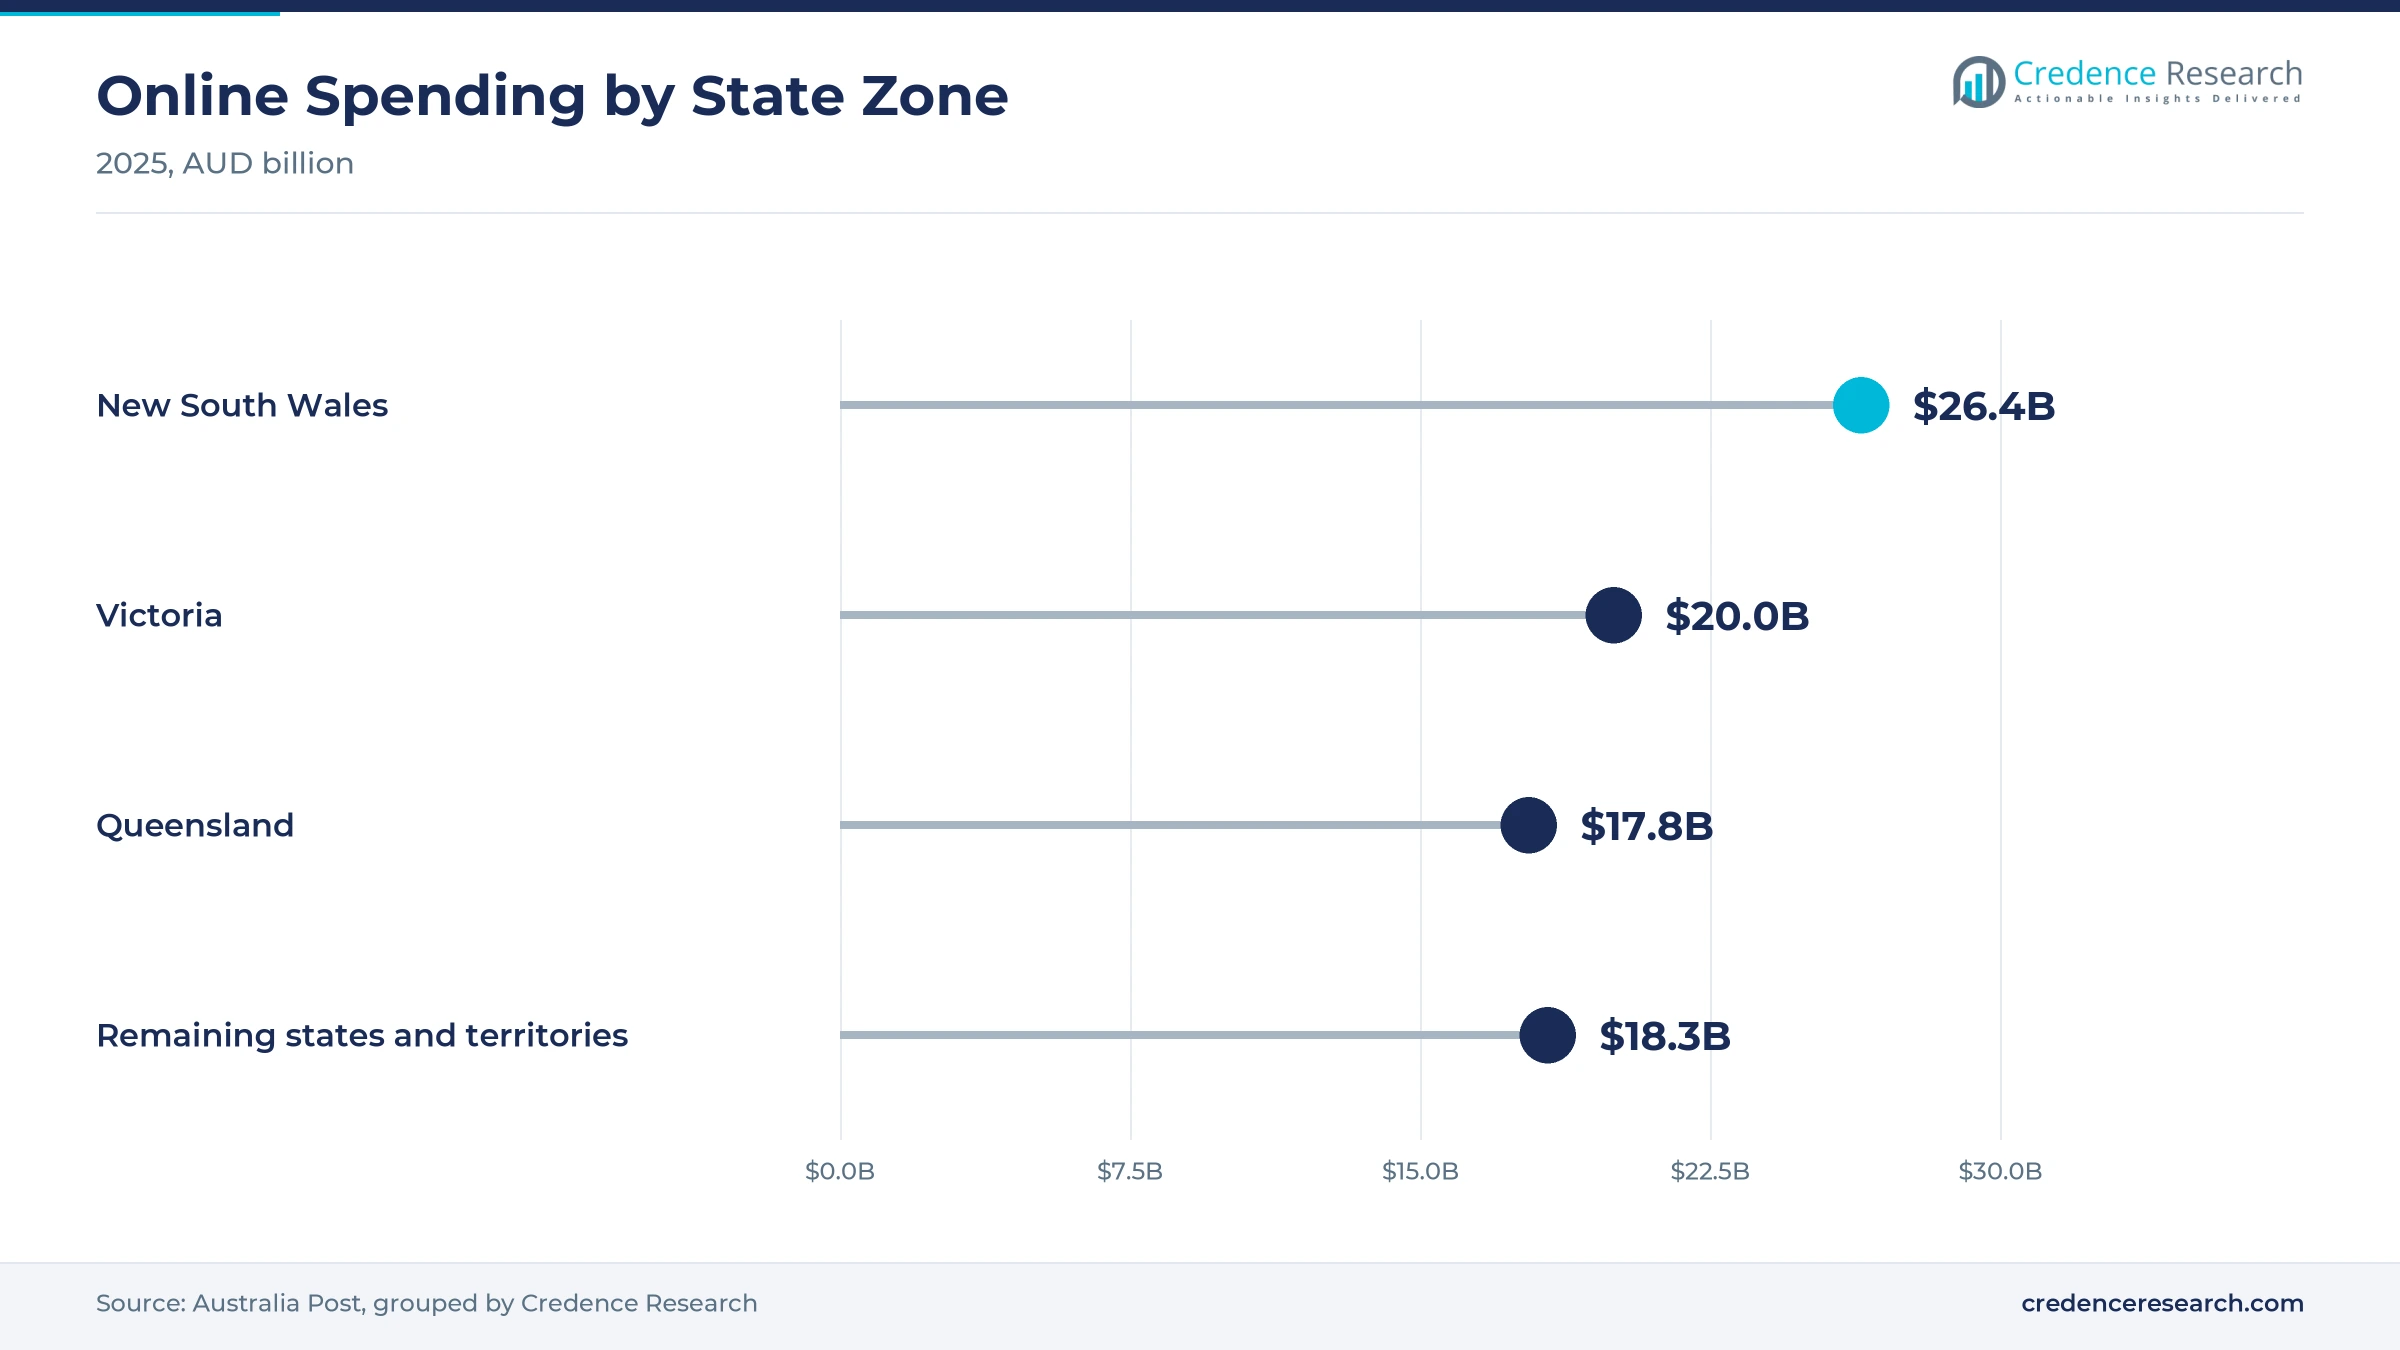
Digital product discovery widens access, because buyers compare resin origin, botanical name and bottle size on screen before they order. Australians spent a record $82.6 billion online in 2025, up 13.9% on the prior year, and 9.8 million households shopped online, according to Australia Post data. Online marketplaces alone took $18.9 billion of that spend, which gives small aromatherapy brands national reach. New South Wales shoppers spent $26.4 billion online, ahead of Victoria at $20 billion and Queensland at $17.8 billion. Pharmacies also sell oils through online pharmacy stores with home delivery. As a result, brand websites and marketplaces grow at 7.10% a year, the fastest channel rate.
Why do listed medicine status and member networks matter?
Listed medicine status and member networks matter, because they let leading brands make permitted claims and reach buyers through personal advice. The Australian Register of Therapeutic Goods lists dōTERRA Frankincense with olibanum oil as a medicine, according to the Therapeutic Goods Administration. Young Living frankincense essential oil also holds a register entry under ID 326511 with Boswellia carterii as its ingredient. Listed medicines must use only indications from the regulator's permitted list, which keeps label claims within set limits. Both brands sell through direct selling networks, which helps explain why direct selling holds a 38.0% share of 2025 value.
Organic labels and resin supply scrutiny reshape buying
How is the rise of organic and origin labels changing buying?
The rise of organic and origin labels is changing buying, because shoppers now check the species and source country before they pay premium prices. Perfect Potion lists its frankincense as steam-distilled Boswellia carterii from Somalia, priced at $74.95 for a 10-milliliter bottle. Buckley & Phillips Aromatics, based in Lilydale, Victoria, sells a certified organic Boswellia serrata oil from India that is steam distilled from gum resin. The ECO Modern Essentials brand sells a 10-milliliter Boswellia serrata oil at $40 through an online retailer, which shows a wide price spread between species. As a result, premium oils hold a 48.0% share of 2025 value, while super-premium oils grow at 6.73% a year.
Why is the shift to resin supply scrutiny gaining ground?
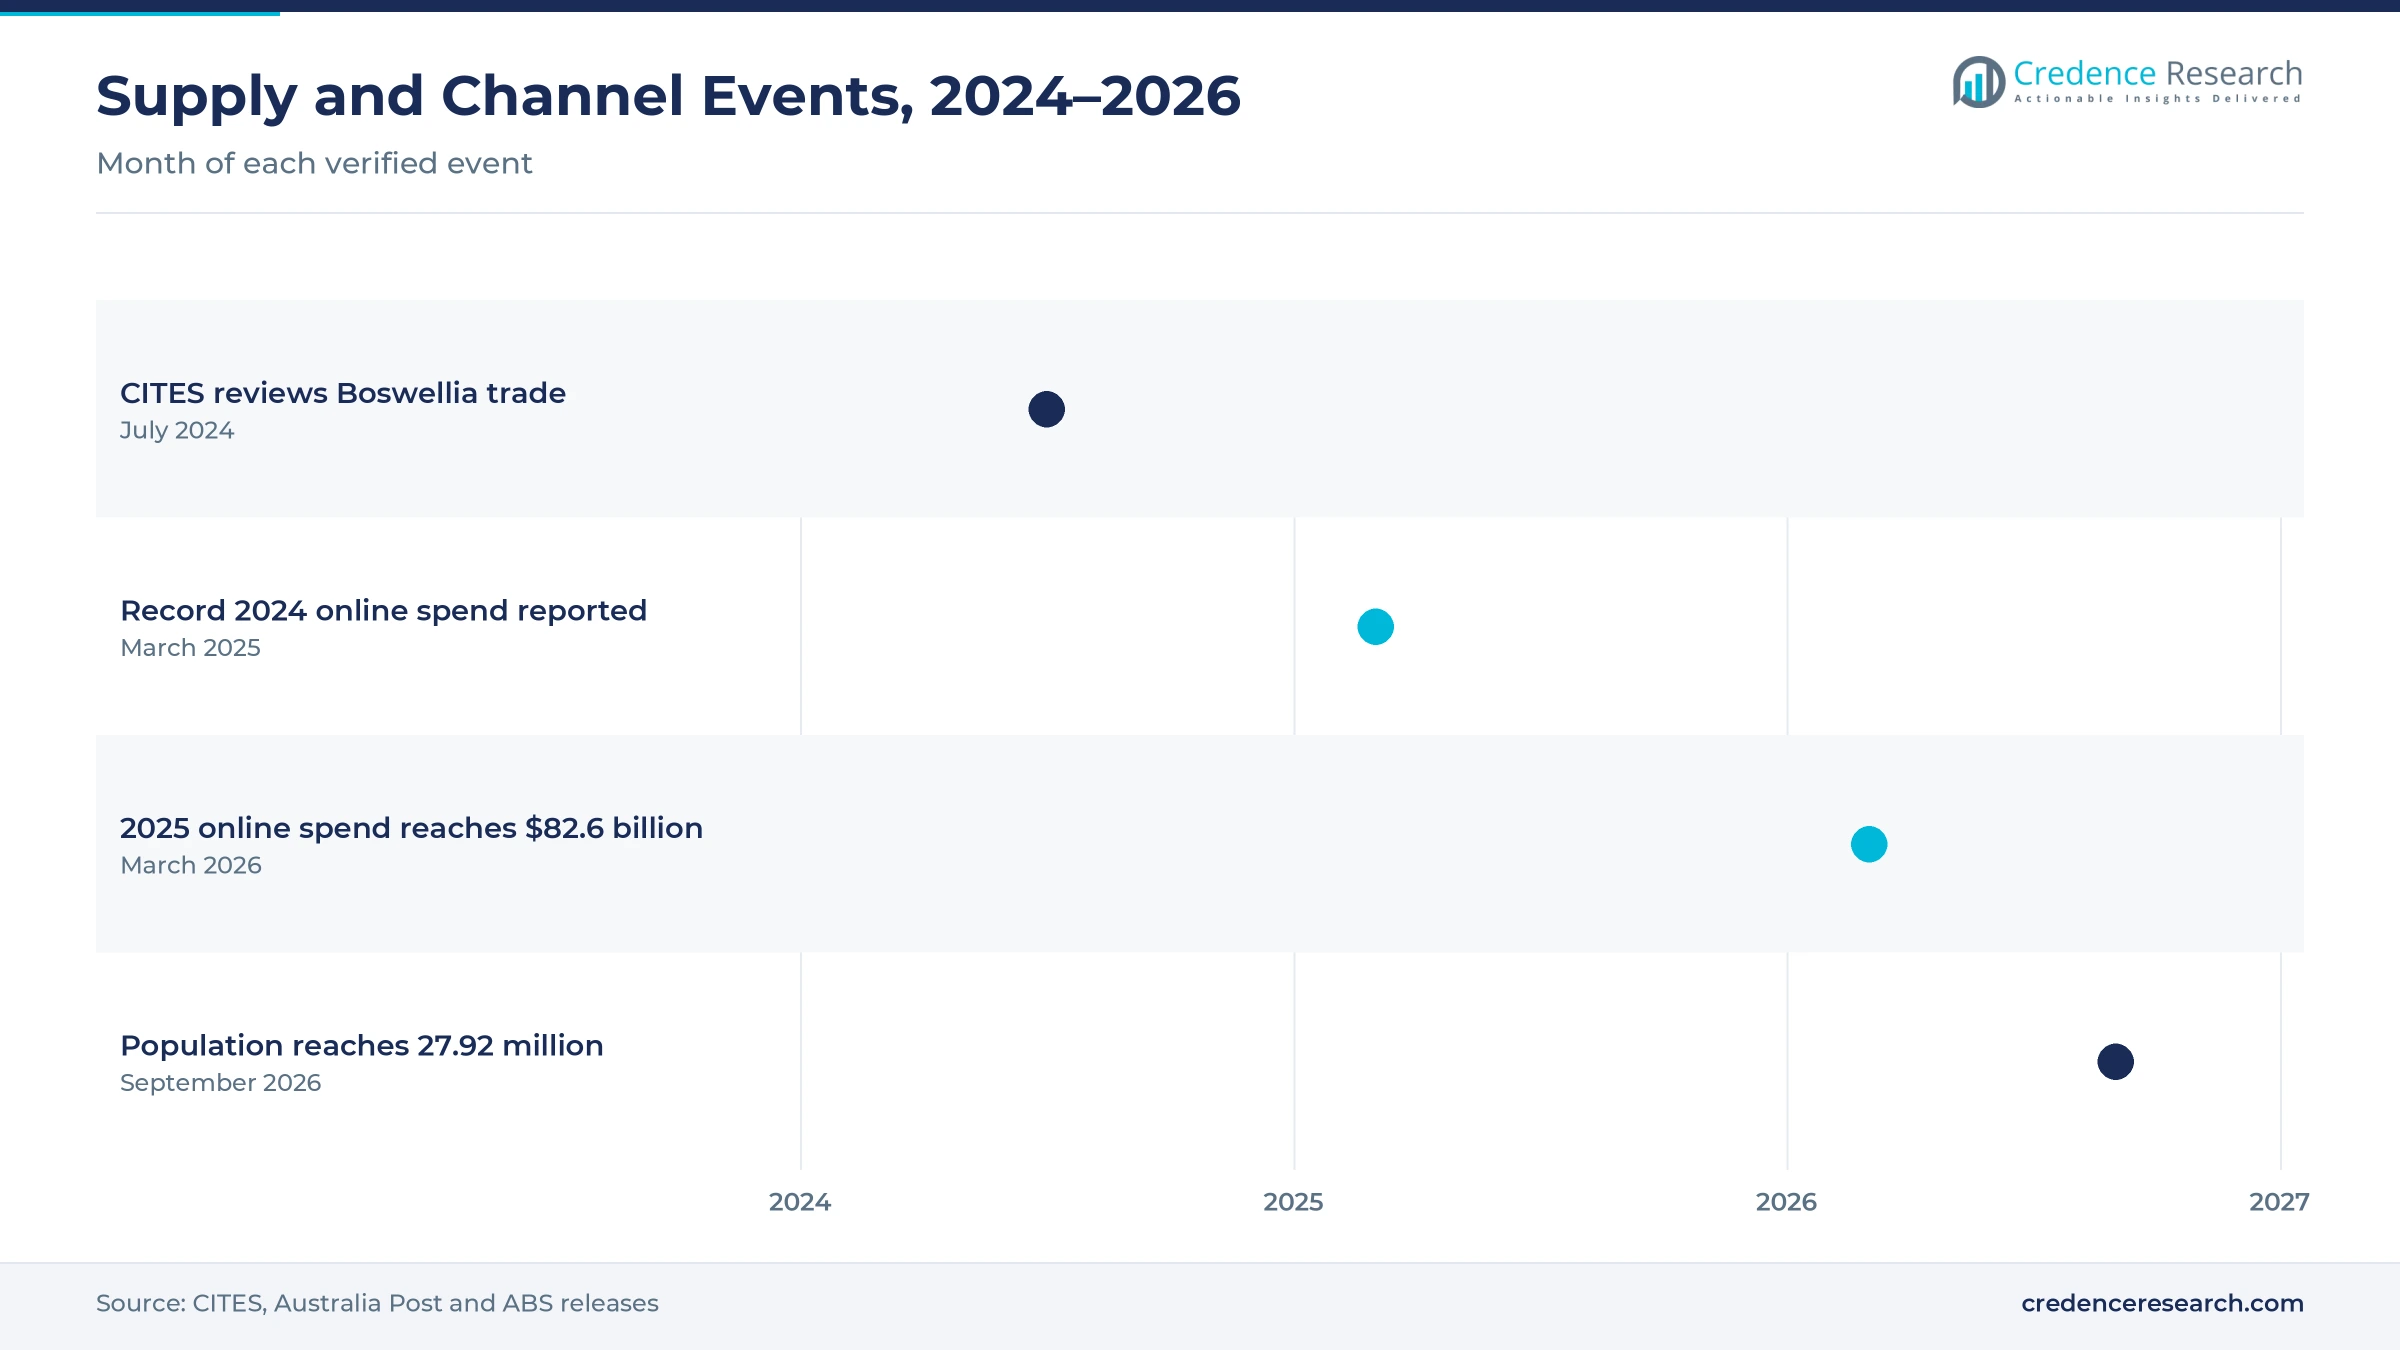
The shift to resin supply scrutiny is gaining ground, because studies show that heavy tapping is damaging Boswellia trees in source countries. A Nature Sustainability study published on July 1, 2019, projected that frankincense output could halve within about 20 years, as 18 of 23 studied tree populations had hardly any young trees. The CITES Plants Committee reviewed Boswellia trade at its meeting in Geneva from July 8 to July 13, 2024, naming four main species in trade. A 2025 Royal Botanic Garden Edinburgh report found over 60% of surveyed Boswellia sacra trees had been cut for resin and moved Boswellia serrata to Near Threatened. In turn, brands that document origin and harvest practices gain trust with premium buyers.
Can pre-diluted formats open safer home use?
Pre-diluted formats can open safer home use, because ready-to-apply carrier oil blends reduce the risk of misuse with concentrated oil. A Medical Journal of Australia study found that a New South Wales poisons information service received 4,412 essential oil exposure calls from July 2014 to June 2018. Children under 15 were involved in 63% of those cases, and 80% of all exposures were accidental. The same study noted that child-resistant closures were required only on containers over 15 milliliters, although as little as five milliliters can harm a child. As a result, frankincense-infused carrier oils grow at 7.01% a year, the fastest product rate in the forecast.
Is there room to grow practitioner and venue supply?
Practitioner and venue supply has room to grow, because massage therapists, spas and hotels buy larger bottles and blends for repeated treatments. Australia had 19,500 employed massage therapists in 2025, of whom 79% were women and 73% worked part-time, according to Jobs and Skills Australia. New South Wales held 32.9% of that workforce in February 2026, ahead of Victoria at 25.2% and Queensland at 23.1%. Buckley & Phillips sells through a wholesale catalogue for trade buyers, while Perfect Potion runs a separate wholesale store for stockists and practitioners. In turn, venues and practitioners add steady repeat orders for larger bottles and blends across the eastern states.
Child safety, authenticity and compliance limit growth
How does child poisoning risk limit retail growth?
Child poisoning risk limits retail growth, because concentrated oils are kept in many homes where young children can reach them. Poisons center data show that most exposure calls involve children and accidental use. As a result, retailers and parents grow cautious about small bottles without child-resistant closures. Brands respond with safety warnings, storage advice, dropper inserts and pre-diluted roll-on products that lower the dose in each application.
Why does resin authenticity create supply risk?
Resin authenticity creates supply risk, because a 2025 botanical review found that resin chemistry alone cannot reliably identify each Boswellia species. Buyers cannot easily confirm whether an oil matches the species named on its label. In turn, cheaper oils can be blended or mislabeled before they reach Australian shelves. Brands respond by publishing botanical names and source countries, buying from fewer distillers and testing batches with gas chromatography.
How do cosmetic and medicine rules add compliance cost?
Cosmetic and medicine rules add compliance cost, because importers of cosmetics must register with the industrial chemicals regulator and file annual declarations by Nov. 30. Brands that list frankincense oils as medicines must also use only permitted indications. As a result, small importers spend more time on paperwork and label checks. Larger brands spread these costs across many products, which pushes some small sellers toward simpler uses and generic claims.
Why do price gaps between species confuse buyers?
Price gaps between species confuse buyers, because a 10-milliliter bottle can cost from about $40 to $75 depending on species and certification. Shoppers who do not know the difference between Boswellia carterii and Boswellia serrata may pick on price alone. In turn, premium brands must explain their value on every product page. They respond with origin stories, organic certification and sample sizes that let buyers compare scent before buying full bottles.
New South Wales leads while smaller states grow fastest
| State | Value, 2025 (USD million) | Share, 2025 | CAGR, 2026–2035 |
|---|---|---|---|
| New South Wales | 3.9 | 40.2% | 6.07% |
| Victoria | 2.9 | 29.9% | 6.27% |
| Queensland | 2.4 | 24.7% | 6.42% |
| Remaining states and territories | 0.5 | 5.2% | 6.67% |
Why does New South Wales hold the largest share?
New South Wales held a 40.2% share of 2025 value and grows at 6.07% a year, because Sydney has the largest population and the highest online spend. The state had about 8.67 million residents at March 31, 2026, and its shoppers spent $26.4 billion online in 2025. New South Wales also held 32.9% of employed massage therapists. However, growth is slower than in other zones, because population growth was 1.1% over the year.
How does Victoria support premium buying?
Victoria held a 29.9% share of 2025 value and grows at 6.27% a year, because Melbourne has a large base of wellness buyers and local aromatherapy suppliers. Victoria's population grew 1.6% to about 7.15 million in the year to March 2026, and its shoppers spent $20 billion online in 2025. Buckley & Phillips Aromatics also bottles certified organic oils in Lilydale, east of Melbourne, for retail and trade buyers. As a result, premium and organic oils sell well in the state.
Why is Queensland gaining share?
Queensland held a 24.7% share of 2025 value and grows at 6.42% a year, because Brisbane and the Gold Coast attract new residents and support a large spa and resort sector. Queensland had about 5.74 million residents in March 2026 and grew 1.6% over the year. Shoppers in the region also spent $17.8 billion online in 2025. In turn, demand for massage blends and diffuser refills rises with tourism and new households.
What drives growth in the remaining states and territories?
The remaining states and territories held a 5.2% share of 2025 value and grow fastest at 6.67% a year, because Western Australia had the fastest population growth at 2.1%. Shoppers in Western Australia spent $9.1 billion online in 2025, while South Australian shoppers spent $5.4 billion. Long distances from eastern warehouses push buyers toward online orders. As a result, brands with fast delivery gain buyers in Perth and Adelaide.
Resin reviews and record online spend marked 2024 to 2026
| Development | Status and market relevance |
|---|---|
| In July 2024, a CITES working group reported on Boswellia trade, and the Plants Committee announced next steps in Geneva. | Raised international scrutiny of frankincense resin supply |
| In March 2025, Australia Post announced that Australians spent a record $69 billion online in 2024. | Showed rising online buying that supports oil brand websites |
| In March 2026, Australia Post announced that online spending reached $82.6 billion in 2025, up 13.9%. | Confirmed marketplaces and brand websites as the fastest route to buyers |
| In September 2026, the Australian Bureau of Statistics announced a population of 27.92 million at March 31, 2026. | Showed the household base for home aromatherapy growing 1.4% a year |
Distillation and extraction methods separate oil grades
- Steam distillation passes steam through crushed resin, which gives the clear, light oil that most specialty brands sell.
- Hydrodistillation boils resin directly in water, which suits small distillers in source countries with simple equipment.
- Carbon dioxide extraction uses pressurized carbon dioxide at low heat, which keeps heavier resin compounds for premium skin care.
- Carrier oil infusion dilutes frankincense in plant oils such as jojoba or coconut, which gives ready-to-apply roll-on products.
Need a Custom Version of This Report?
Tailor the scope, geography, or segments to your exact requirements.
- Custom geography or segment scope
- Direct access to our analyst team
Direct sellers and local aromatherapy brands compete
Competition is led by direct selling brands with large member networks and by local aromatherapy brands sold through specialty stores, pharmacies and websites. dōTERRA and Young Living hold frankincense entries on the Australian Register of Therapeutic Goods, which supports permitted label claims. Perfect Potion sells steam-distilled Somali frankincense at a premium price, while Buckley & Phillips Aromatics sells a certified organic Indian oil from Victoria. Springfields positions its oil for meditation and mature skin, and Oil Garden reaches buyers through pharmacy chains. The ECO Modern Essentials brand sells through online and gift retailers at a lower price point. Rivals compete on species, origin, organic certification, price per milliliter and channel reach. Brands that prove origin and offer pre-diluted products are best placed to gain share.
Companies profiled and their roles in this market
| Company | Type | Role in the market |
|---|---|---|
| doTERRA | Direct seller | Holds an ARTG listed medicine entry for dōTERRA Frankincense with olibanum oil |
| Young Living | Direct seller | Holds an ARTG entry for Young Living frankincense essential oil |
| Perfect Potion | Aromatherapy brand | Sells steam-distilled Boswellia carterii oil from Somalia |
| Buckley & Phillips Aromatics | Organic supplier | Sells certified organic Boswellia serrata oil through wholesale |
| Springfields Aromatherapy | Aromatherapy brand | Positions frankincense for meditation and mature skin |
| Oil Garden | Pharmacy brand | Sells a 12 mL frankincense oil through Amcal pharmacies |
| ECO. Modern Essentials | Lifestyle brand | Sells a 10 mL Boswellia serrata oil through online retailers |
Documented sourcing will pick frankincense winners
Credence Research's view is that Australian frankincense oil demand will grow steadily because households keep using diffusers and more buyers add the oil to skin care. Undiluted oils remain the base of the market, while infused carrier oils and carbon dioxide extracts gain share. Brand websites and marketplaces grow fastest as buyers compare species and origin online. However, child safety concerns, resin authenticity and compliance costs will limit growth for small sellers. Brands that combine documented origin, organic certification and safe formats should gain share fastest.
Population, online spend and registers shaped the estimate
The report uses 2025 as the base year on a calendar basis, and market values come from the Credence Research model. That model combines population statistics, World Bank income data, online spending data, workforce data, regulator registers and company product pages with retailer price listings. Segment splits and state growth rates are Credence Research estimates, while state shares follow the client-defined split. Sources used are public reports, official statistics, scientific studies, company websites and news releases, and no interviews or surveys were used.
Skin care and online reach carry demand to 2035
Sales of frankincense oil in Australia are expected to reach USD 27.9 million by 2035, a 6.25% CAGR during 2026–2035, as skin care use, online discovery and home diffusing keep demand rising. Growth should be strongest in the early years as brands expand infused and pre-diluted ranges and online stores. After that, tighter resin supply and origin checks may raise prices, which favors premium and super-premium oils. Weaker household spending would lower this outlook, while faster skin care adoption would raise it. Brands with documented sourcing and strong online reach are expected to gain the most.
Frequently Asked Questions
How big is the Australia frankincense oil market?
Which product type leads frankincense sales in Australia?
Which state leads the Australia frankincense oil market?
Which sales channel is growing fastest?
What drives frankincense oil demand in Australia?
Why is frankincense resin supply under scrutiny?
Who are the leading companies in Australia?
What are the main challenges for suppliers?
Table of Content
Chapter 1 Market Segmentation
- 1.1 Segmentation Framework
- 1.1.1 Product and Service Classification
- 1.1.2 Application and End-Use Classification
- 1.1.3 Technology and Solution Classification
- 1.1.4 Customer and Distribution Channel Classification
- 1.1.5 Geographic Segmentation
- 1.1.6 Market Segment Definitions and Boundaries
- 1.2 By Product Type
- 1.2.1 Undiluted essential oils
- 1.2.2 Frankincense-led blends
- 1.2.3 Frankincense-infused carrier oils
- 1.2.4 Carbon dioxide extracts
- 1.3 By Application
- 1.3.1 Home aromatherapy
- 1.3.2 Personal skin care
- 1.3.3 Professional wellness
- 1.3.4 Specialised labelled uses
- 1.4 By Price Tier
- 1.4.1 Value
- 1.4.2 Premium
- 1.4.3 Super-premium
- 1.5 By State
- 1.5.1 New South Wales
- 1.5.2 Victoria
- 1.5.3 Queensland
- 1.5.4 Remaining states and territories
Chapter 2 Introduction
- 2.1 Report Objectives and Scope
- 2.2 Product Definition and Industry Terminology
- 2.3 Market Inclusions and Exclusions
- 2.4 Research Process
- 2.4.1 Primary Research and Expert Interviews
- 2.4.2 Secondary Research and Source Review
- 2.4.3 Top-Down and Bottom-Up Estimation
- 2.4.4 Data Triangulation and Verification
- 2.5 Market Size Measurement Basis
- 2.5.1 2025: USD 9.7 million → 2035: USD 27.9 million
- 2.6 Historical and Forecast Reference Periods
- 2.6.1 Historical Period: 2018-2025
- 2.6.2 Base Year: 2025
- 2.6.3 Forecast Period: 2025-2035
- 2.7 Research Assumptions and Limitations
Chapter 3 Executive Summary
- 3.1 Market Snapshot and Key Findings
- 3.2 Base-Year Market Size, 2025
- 3.3 Forecast Market Size, 2035
- 3.4 Revenue and Volume Growth Outlook
- 3.5 Key Demand and Supply Indicators
- 3.6 Leading Market Segments
- 3.7 Fastest-Growing Market Opportunities
- 3.8 Regional Performance Highlights
- 3.9 Technology and Industry Transformation
- 3.10 Competitive Landscape Summary
- 3.11 Analyst View and Strategic Implications
Chapter 4 Australia Frankincense Oil Market Trends and Developments
- 4.1 Historical Industry Development, 2018-2025
- 4.2 Recent Market Trends and Developments
- 4.3 Demand and Customer Behavior Trends
- 4.4 Technology and Product Innovation
- 4.5 Artificial Intelligence, Automation and Digitalization
- 4.6 Local Manufacturing and Supply Chain Realignment
- 4.7 Industry Partnerships, Mergers and Acquisitions
- 4.8 Sustainability and Circular Economy Developments
- 4.9 Government and Private Sector Investment Trends
- 4.10 Emerging Business Models and Commercialization
- 4.11 Industry Developments and Announcements
Chapter 5 Australia Frankincense Oil Market Production, Supply and Demand Analysis
- 5.1 Demand Trend and Consumption Analysis, 2018-2025
- 5.2 Demand Forecast, 2025-2035
- 5.3 Production and Output Trend, 2018-2025
- 5.4 Production and Output Forecast, 2025-2035
- 5.5 Installed Capacity and Capacity Utilization
- 5.6 Company-Wise Production Plants and Statistics
- 5.6.1 Installed Production Capacity
- 5.6.2 Actual Production
- 5.6.3 Planned Capacity and Expansion Targets
- 5.7 Supply Chain Structure and Procurement Trends
- 5.8 Supply-Demand Gap and Bottlenecks
- 5.9 Import Dependence and Sourcing Structure
- 5.10 Contract Manufacturing and Outsourcing
- 5.11 Regional Supply and Demand Concentration
Chapter 6 Australia Frankincense Oil Market Pricing Analysis
- 6.1 Pricing Structure and Measurement
- 6.2 Historical Pricing Trends, 2018-2025
- 6.3 Pricing Outlook, 2025-2035
- 6.4 Average Selling Price and Unit Economics
- 6.5 Pricing by Product and Market Segment
- 6.6 Geographic Pricing Differences
- 6.7 Key Input, Energy, Labor and Logistics Costs
- 6.8 Contract Pricing and Purchasing Models
- 6.9 Pricing Sensitivity and Competitive Positioning
- 6.10 Price, Margin and Profitability Implications
Chapter 7 Australia Frankincense Oil Market Dynamics
- 7.1 Market Growth Drivers
- 7.1.1 Demand-Side Drivers
- 7.1.2 Technology and Innovation Drivers
- 7.1.3 Infrastructure and Investment Drivers
- 7.1.4 Regulatory and Policy Drivers
- 7.2 Market Restraints
- 7.2.1 Cost and Affordability Constraints
- 7.2.2 Technology and Adoption Barriers
- 7.2.3 Supply Chain and Operational Constraints
- 7.3 Market Challenges
- 7.3.1 Competitive Pressure and Margin Erosion
- 7.3.2 Skills, Infrastructure and Implementation Gaps
- 7.4 Emerging Market Opportunities
- 7.5 Market Dynamics Impact and Time-Horizon Assessment
Chapter 8 Australia Frankincense Oil Value Chain Analysis
- 8.1 Industry Value Chain Overview
- 8.2 Upstream Suppliers and Critical Inputs
- 8.3 Technology and Component Providers
- 8.4 Manufacturing or Service Delivery
- 8.5 Distribution, Channel Partners and Integrators
- 8.6 Downstream Applications and End Users
- 8.7 Value Addition and Profit Pools
- 8.8 Vertical Integration and Outsourcing
- 8.9 Supplier Concentration and Risk
- 8.10 Supply Chain Localization and Resilience
Chapter 9 Australia Frankincense Oil Market Regulations and Policies
- 9.1 Relevant Laws, Standards and Compliance Frameworks
- 9.2 Product, Service, Safety and Quality Requirements
- 9.3 Government Policies, Incentives and Subsidies
- 9.4 Imports, Exports and Trade Barriers
- 9.5 Public Procurement and Local Content Requirements
- 9.6 Environmental and Sustainability Compliance
- 9.7 Upcoming Policy Changes and Market Implications
Chapter 10 Australia Frankincense Oil Market Hotspots and Opportunities
- 10.1 Market Opportunity Mapping and Growth Hotspots
- 10.2 High-Growth Applications and Customer Groups
- 10.3 Underserved Markets and White-Space Opportunities
- 10.4 Emerging Technology and Product Opportunities
- 10.5 New Capacity and Investment Hotspots
- 10.6 Market Entry and Expansion Opportunities
- 10.7 Distribution and Partnership Opportunities
- 10.8 Near-Term and Long-Term Commercial Potential
- 10.9 Opportunity Attractiveness and Execution Risks
Chapter 11 Australia Frankincense Oil Market Outlook, 2025-2035
- 11.1 Market Size and Analysis
- 11.1.1 Revenue (Market Measurement: 2025: USD 9.7 million → 2035: USD 27.9 million)
- 11.1.2 Market Volume and Quantity Sold
- 11.1.3 Historical Market Size, 2018-2025
- 11.1.4 Base-Year Market Size, 2025
- 11.2 Market Forecast, 2025-2035
- 11.2.1 Revenue Forecast to 2035
- 11.2.2 Volume Forecast to 2035
- 11.2.3 CAGR and Year-on-Year Growth
- 11.2.4 Incremental Revenue Opportunity
- 11.3 Forecast Assumptions and Scenario Analysis
- 11.3.1 Base-Case Forecast
- 11.3.2 Optimistic and Conservative Scenarios
- 11.3.3 Technology, Pricing and Policy Sensitivities
- 11.4 Market Attractiveness and Growth Outlook
Chapter 12 Australia Frankincense Oil Market Segmentation and Outlook
- 12.1 Segmentation Summary and Market Shares, 2025
- 12.2 Largest and Fastest-Growing Segments
- 12.3 By Product Type - Market Size and Forecast, 2025-2035
- 12.3.1 Segment Definition and Scope
- 12.3.2 Historical Market Size, 2018-2025
- 12.3.3 Revenue Forecast, 2025-2035
- 12.3.4 Volume Forecast, 2025-2035
- 12.3.5 Base-Year Market Share, 2025
- 12.3.6 Segment CAGR and Growth Drivers
- 12.3.7 Subsegment Market Size and Forecast
- 12.3.7.1 Undiluted essential oils
- 12.3.7.2 Frankincense-led blends
- 12.3.7.3 Frankincense-infused carrier oils
- 12.3.7.4 Carbon dioxide extracts
- 12.3.8 Subsegment Pricing and Adoption Trends
- 12.3.9 Leading Suppliers and Competition
- 12.3.10 Regional Demand and Opportunities
- 12.4 By Application - Market Size and Forecast, 2025-2035
- 12.4.1 Segment Definition and Scope
- 12.4.2 Historical Market Size, 2018-2025
- 12.4.3 Revenue Forecast, 2025-2035
- 12.4.4 Volume Forecast, 2025-2035
- 12.4.5 Base-Year Market Share, 2025
- 12.4.6 Segment CAGR and Growth Drivers
- 12.4.7 Subsegment Market Size and Forecast
- 12.4.7.1 Home aromatherapy
- 12.4.7.2 Personal skin care
- 12.4.7.3 Professional wellness
- 12.4.7.4 Specialised labelled uses
- 12.4.8 Subsegment Pricing and Adoption Trends
- 12.4.9 Leading Suppliers and Competition
- 12.4.10 Regional Demand and Opportunities
- 12.5 By Price Tier - Market Size and Forecast, 2025-2035
- 12.5.1 Segment Definition and Scope
- 12.5.2 Historical Market Size, 2018-2025
- 12.5.3 Revenue Forecast, 2025-2035
- 12.5.4 Volume Forecast, 2025-2035
- 12.5.5 Base-Year Market Share, 2025
- 12.5.6 Segment CAGR and Growth Drivers
- 12.5.7 Subsegment Market Size and Forecast
- 12.5.7.1 Value
- 12.5.7.2 Premium
- 12.5.7.3 Super-premium
- 12.5.8 Subsegment Pricing and Adoption Trends
- 12.5.9 Leading Suppliers and Competition
- 12.5.10 Regional Demand and Opportunities
- 12.6 By State - Market Size and Forecast, 2025-2035
- 12.6.1 Segment Definition and Scope
- 12.6.2 Historical Market Size, 2018-2025
- 12.6.3 Revenue Forecast, 2025-2035
- 12.6.4 Volume Forecast, 2025-2035
- 12.6.5 Base-Year Market Share, 2025
- 12.6.6 Segment CAGR and Growth Drivers
- 12.6.7 Subsegment Market Size and Forecast
- 12.6.7.1 New South Wales
- 12.6.7.2 Victoria
- 12.6.7.3 Queensland
- 12.6.7.4 Remaining states and territories
- 12.6.8 Subsegment Pricing and Adoption Trends
- 12.6.9 Leading Suppliers and Competition
- 12.6.10 Regional Demand and Opportunities
- 12.7 Segment Growth Comparison
- 12.8 Segment Attractiveness and Priority Matrix
Chapter 13 Australia Frankincense Oil End-Use and Application Market Outlook
- 13.1 End-Use Industry and Customer Demand Structure
- 13.2 Leading Applications and Customer Groups
- 13.3 End-Use Market Size, Share and Forecast
- 13.4 Major End-Use Industry Deep Dives
- 13.4.1 Customer Requirements and Use Cases
- 13.4.2 Demand and Replacement Cycles
- 13.4.3 Technical and Regulatory Considerations
- 13.4.4 Purchasing and Procurement Models
- 13.4.5 Leading Vendors and Distribution Channels
- 13.4.6 Forecast and Commercial Opportunities
- 13.5 Emerging Applications and Cross-Segment Demand
- 13.6 End-Use Industry Investment Priorities
Chapter 14 Australia Frankincense Oil Geographic Market Outlook, 2025-2035
- 14.1 Domestic Market Distribution and Demand Clusters
- 14.2 State- or Province-Wise Market Size and Forecast, 2025-2035
- 14.3 City and Metropolitan Market Outlook
- 14.4 Industrial, Manufacturing and Commercial Clusters
- 14.5 Geographic Concentration of Key End Users
- 14.6 Local Pricing and Purchasing Differences
- 14.7 Domestic Production Facilities and Capacity Map
- 14.8 Local Infrastructure and Project Pipeline
- 14.9 State-Level Policy and Incentive Differences
- 14.10 Subnational Investment Hotspots and Opportunities
- 14.11 Distribution and Logistics Networks
- 14.12 Domestic Competitive Footprint
Chapter 15 Australia Frankincense Oil Technology, Innovation and Sustainability Outlook
- 15.1 Technology Landscape and Maturity
- 15.2 Product, Process and Service Innovation
- 15.3 AI, Automation and Digital Tools in the Industry
- 15.4 Technology Adoption and Performance Benchmarking
- 15.5 Innovation Pipeline and R&D Investment
- 15.6 Patent and Intellectual Property Trends
- 15.7 Energy Efficiency and Resource Management
- 15.8 Sustainability, Recycling and Circularity
- 15.9 Technology Roadmap, 2025-2035
- 15.10 Risks of Obsolescence and Technology Substitution
Chapter 16 Australia Frankincense Oil Market Key Strategic Imperatives
- 16.1 Growth and Market Entry Priorities
- 16.2 High-Return Products and Segments
- 16.3 Pricing, Profitability and Cost Optimization
- 16.4 Technology Investment and Product Differentiation
- 16.5 Supply Chain Localization and Resilience
- 16.6 Distribution and Customer Acquisition
- 16.7 Partnership, Acquisition and Capacity Strategy
- 16.8 Regional Expansion Priorities
- 16.9 Short-, Medium- and Long-Term Actions
Chapter 17 Competition Outlook
- 17.1 Industry Competition Characteristics
- 17.2 Market Structure and Concentration
- 17.3 Market Share and Competitive Positioning, 2025
- 17.4 Company-Wise Revenue and Product Benchmarking
- 17.5 Production and Service Capacity Benchmarking
- 17.6 Technology, Pricing and Differentiation
- 17.7 Regional Footprint and Distribution Strength
- 17.8 Mergers, Acquisitions and Strategic Alliances
- 17.9 New Entrants and Competitive Threats
- 17.10 Porter's Five Forces and Industry Attractiveness
- 17.11 Competitive Outlook, 2025-2035
Chapter 18 Company Profiles
- 18.1 Company Coverage and Selection Criteria
- 18.2 doTERRA
- 18.2.1 Business Description
- 18.2.2 Company Ownership and Geographic Presence
- 18.2.3 Product and Service Portfolio
- 18.2.4 Manufacturing and Operating Footprint
- 18.2.5 Production Capacity and Expansion Plans
- 18.2.6 Financial Performance and Investment
- 18.2.7 Market Share and Competitive Position
- 18.2.8 Technology and Innovation Capabilities
- 18.2.9 Strategic Alliances or Partnerships
- 18.2.10 Recent Developments
- 18.2.11 Growth Strategy and Outlook
- 18.3 Young Living
- 18.4 In Essence
- 18.5 Springfields Aromatherapy
- 18.6 Perfect Potion
- 18.7 New Directions Australia
- 18.8 ECO. Modern Essentials
- 18.9 Oil Garden
- 18.10 Buckley & Phillips Aromatics
- 18.11 Sydney Essential Oil Company
- 18.12 Other Relevant Market Participants
Note: Every listed company is profiled on the structure shown under the first company. The company list is preliminary and may change based on research findings, market developments, data availability and client requirements.
Chapter 19 Disclaimer
- 19.1 Research and Forecast Disclaimer
- 19.2 Data Source and Estimation Limitations
Note: The depth of individual sections depends on data availability for this market. Volume, capacity, trade and other unit-based metrics are included where applicable.

