
| REPORT ATTRIBUTE | DETAILS |
|---|---|
| Historical Period | 2020-2023 |
| Base Year | 2024 |
| Forecast Period | 2025-2032 |
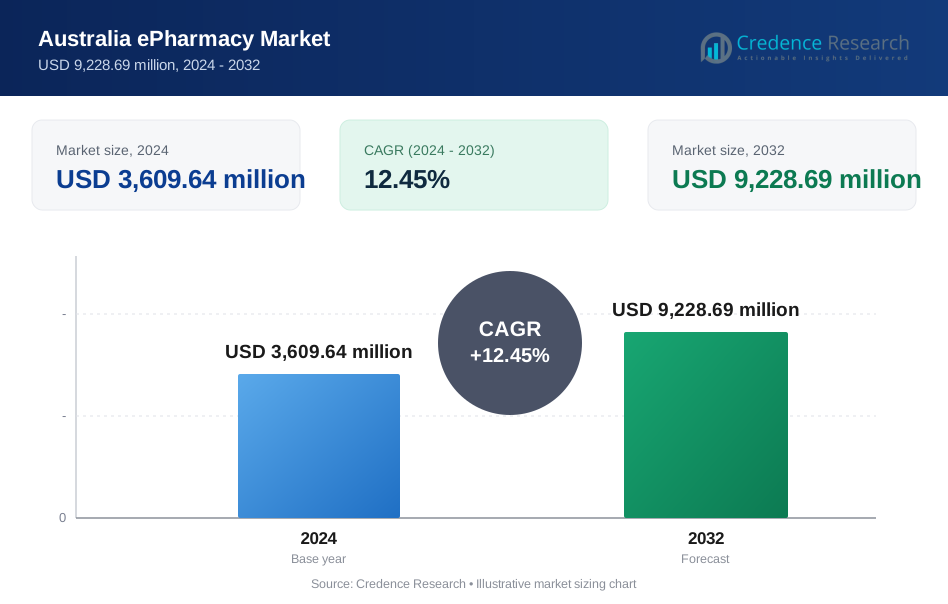
| Australia ePharmacy Market Size 2024 | USD3,609.64 million |
| Australia ePharmacy Market, CAGR | 12.45% |
| Australia ePharmacy Market Size 2032 | USD9,228.69 million |
Market Overview
The Australia ePharmacy Market is projected to grow from USD3,609.64 million in 2024 to an estimated USD9,228.69 million based on 2032, with a compound annual growth rate (CAGR) 12.45% from 2025 to 2032. The market has gained widespread traction as consumers embrace online purchase of prescription and over-the-counter medications.
Healthcare digitalization and evolving consumer preferences rapidly drive market expansion. Patients value contactless delivery, seamless subscription refill models and automated medication reminders, prompting ePharmacies to enhance user interfaces and offer personalized care. Regulatory reforms that clarify online pharmacy licensing encourage new entrants while promoting industry compliance. Meanwhile, technology advancements such as AI-powered chatbots, data analytics for demand forecasting and mobile applications streamline the ordering process and optimize inventory management.
On a regional level, metropolitan centers including Sydney and Melbourne account for the majority of transaction volumes, though emerging demand is visible in Queensland and Western Australia. Rural and remote communities significantly benefit from improved access to essential medicines, reducing travel requirements and bridging healthcare gaps. Key players such as Chemist Warehouse, Pharmacy Online, My Chemist, TerryWhite Chemmart and Priceline Pharmacy lead the competitive landscape by leveraging omnichannel strategies and strong supply-chain networks. Smaller platforms differentiate through niche offerings such as specialty compounding and chronic disease management programs.
Market Insights
- The market will expand from USD 3,609.64 million in 2024 to USD 9,228.69 million by 2032, reflecting a 12.45% CAGR through 2025–2032.
- Rising internet penetration and secure digital payments accelerate online medication purchases.
- Telehealth integration strengthens prescription-to-delivery workflows and fuels service uptake.
- Subscription refill models and automated reminders enhance patient adherence and lifetime value.
- Strict licensing requirements and diverse state regulations slow new market entrants.
- Complex cold-chain logistics and last-mile delivery challenges increase operational costs.
- Sydney and Melbourne drive the bulk of demand, while Queensland and Western Australia show rapid digital adoption in underserved areas.
Report Scope
This report segments the Australia ePharmacy Market as follows:
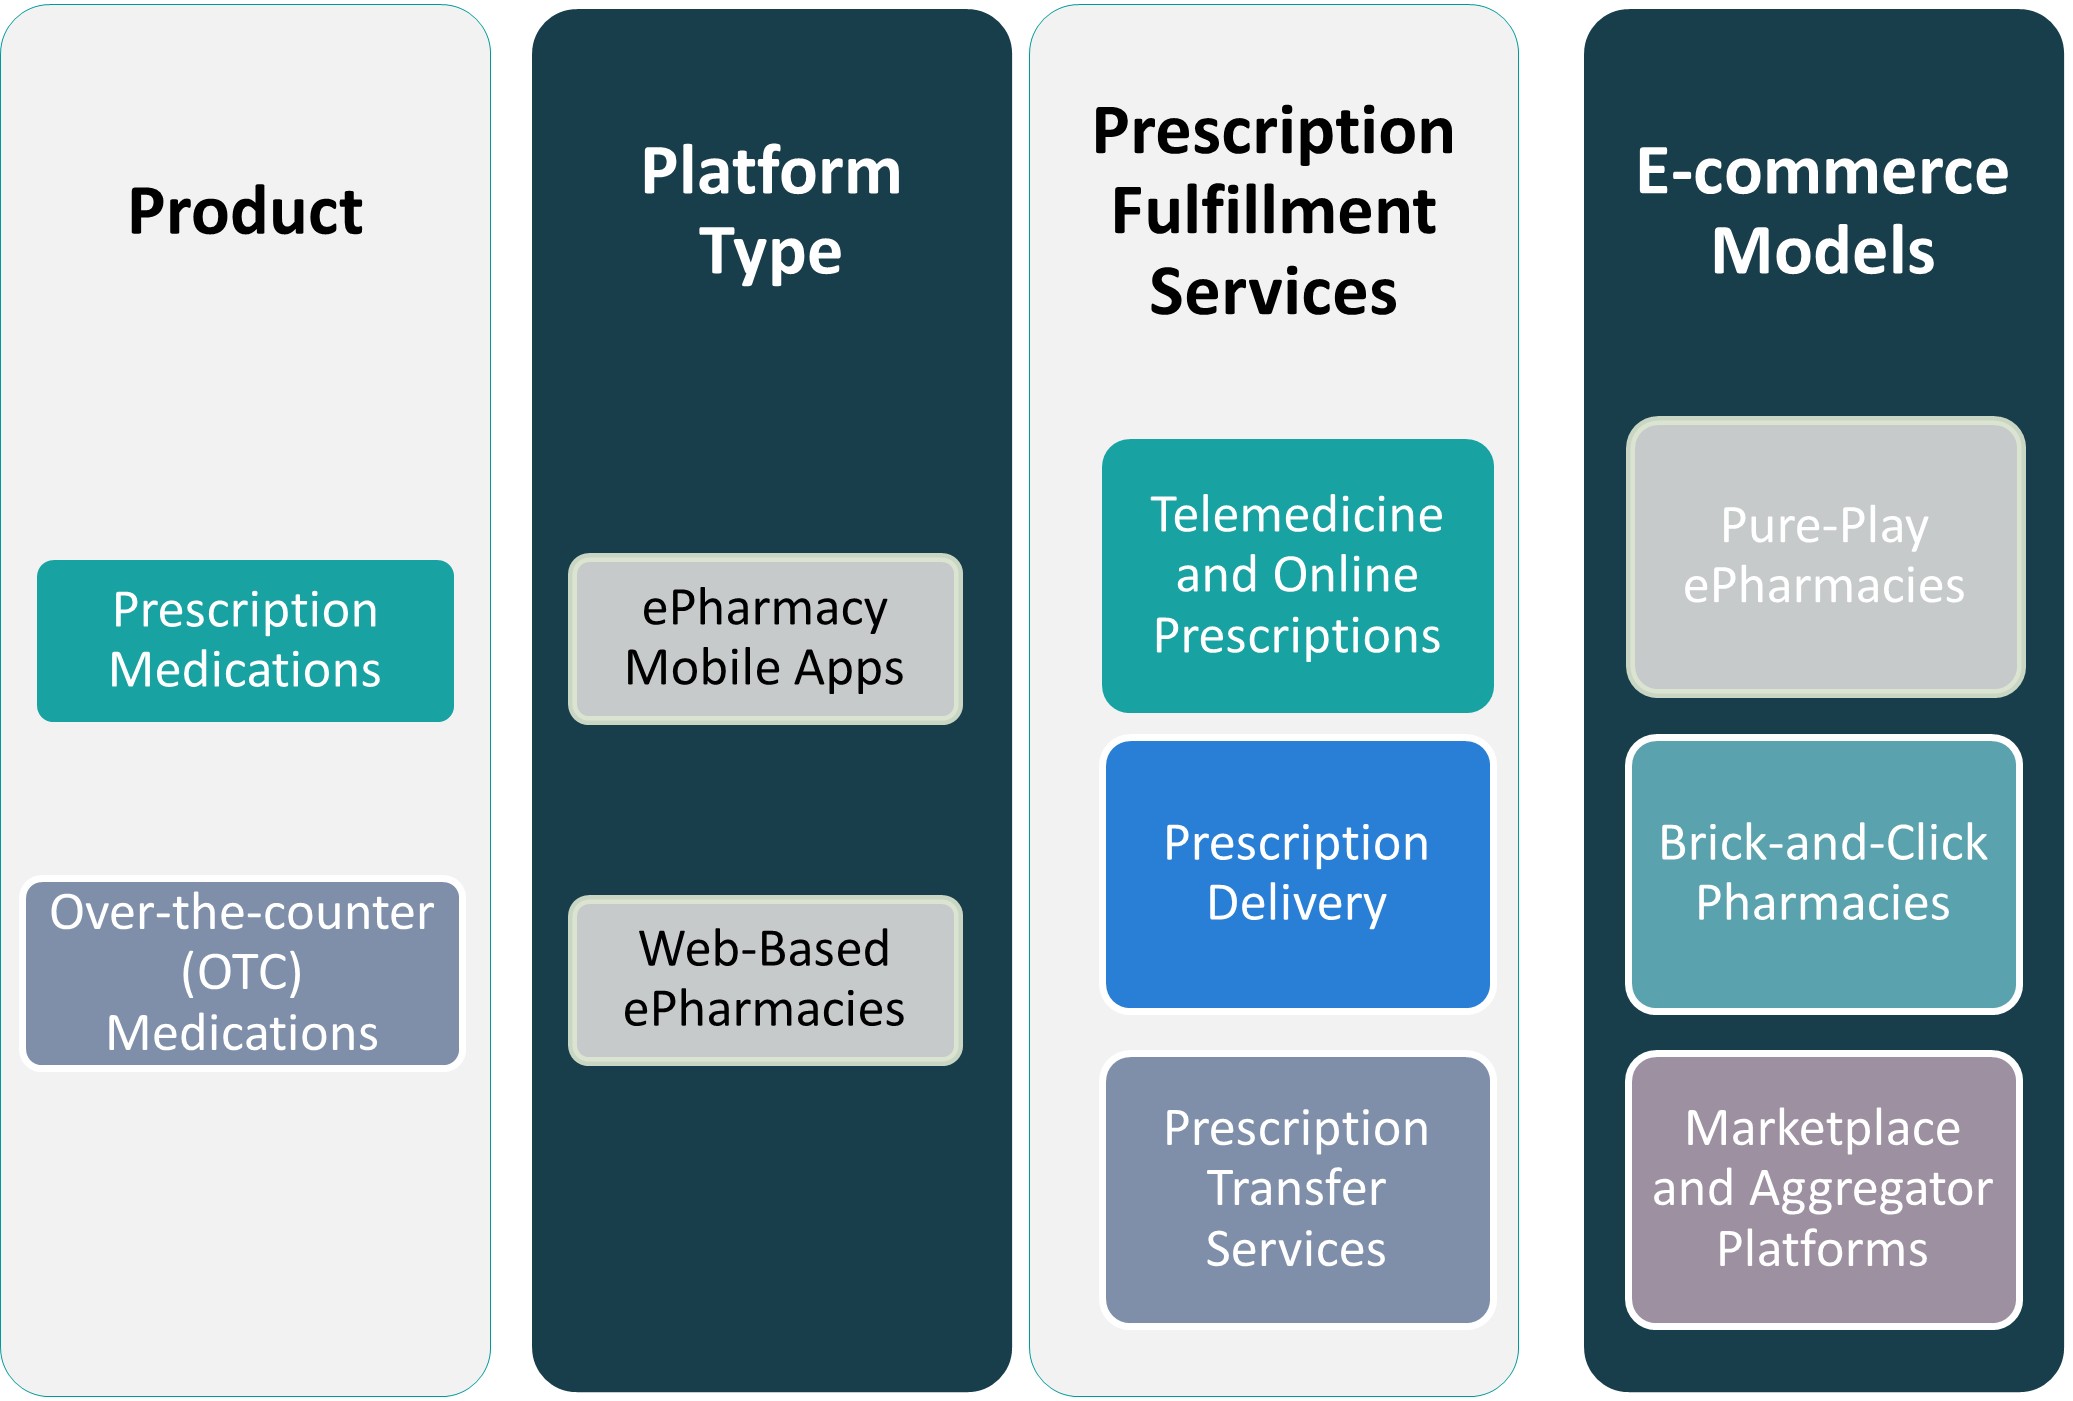
Market Drivers
Rapid Digital Platform Adoption and Telehealth Integration
Consumers and providers embrace online pharmacy channels at an unprecedented pace. The Australia ePharmacy Market benefits from higher internet penetration and expanded telehealth services that connect virtual consultations to digital fulfillment. It simplifies therapy continuity by pairing prescription approvals with home delivery schedules. It prompts pharmacies to build robust web portals and mobile applications. This trend drives competitive differentiation among service providers. It sustains momentum through improved user experiences and boosts patient trust.
- For instance, major pharmacy chains in Australia reported a 35% increase in online prescription orders following the integration of telehealth services.
Enhanced Regutory Frameworks and Clear Licensing Pathways
Government bodies clarify online pharmacy guidelines and strengthen oversight across the supply chain. The Australia ePharmacy Market gains stability through consistent approval processes and rigorous quality standards. It compels platforms to adopt verification protocols and train staff on compliance measures. It protects patients by enforcing safe dispensing practices. It drives investor confidence and supports market entrants. It relies on transparent reporting systems for adverse event management and audit readiness.
- For instance, regulatory authorities introduced a new digital verification system that reduced licensing approval times for online pharmacies by 40%, fostering market stability.
Growing Demand for Contactless Dispensing and Subscription Models
Health-conscious consumers favor subscription services that ensure timely medication supply. The Australia ePharmacy Market responds with automated refill reminders and tiered delivery options. It enhances adherence through scheduled shipments and flexible payment plans. It builds loyalty by offering personalized care packages and remote pharmacist consultations. It reduces prescription abandonment and mitigates stockouts in chronic care segments. It achieves efficiency via integrated CRM systems that track usage patterns.
Advanced Supply Chain Infrastructure and Data-Driven Logistics Solutions
Robust distribution networks and cold-chain logistics ensure medication quality during transit. The Australia ePharmacy Market leverages real-time tracking and predictive analytics to optimize inventory allocation. It reduces lead times and lowers operating costs. It pushes providers to partner with third-party logistics specialists that meet stringent handling requirements. It fosters resilience against disruptions through diversified supplier relationships and contingency planning. It sustains customer satisfaction with reliable order fulfillment and proactive communication.
Market Trends
Expansion of Telepharmacy Services and Mobile Health Applications
Telepharmacy expansions link remote patients to licensed pharmacists via video consultations and digital prescriptions. The Australia ePharmacy Market leverages these channels to improve service reach in underserved areas. It drives investment in secure telemedicine platforms certified by healthcare authorities. It demands user-friendly interfaces that handle prescription uploads and payment processing seamlessly. It fosters stronger patient engagement through direct pharmacist interactions at home. It shapes competition by requiring providers to offer real-time counseling and order status updates. It increases access to over-the-counter therapies under professional guidance.
- For instance, Australia recorded over 2.5 million telehealth consultations in the past year, with more than 1,200 licensed pharmacists participating in digital prescription services.
Integration of Personalized Care Solutions and Data Analytics Platforms
Providers implement predictive analytics to forecast prescription demand and optimize inventory. The Australia ePharmacy Market integrates patient health data with custom medication reminders and dosage-tracking tools. It uses secure data hubs for chronic disease management through tailored treatment plans. It encourages partnerships with software developers to boost algorithm accuracy and safeguard user privacy. It reduces stockouts by aligning supply orders with usage patterns. It raises quality standards through performance metrics and feedback loops. It enhances decision-making through real-time sales and delivery insights for stakeholders.
- For instance, over 900 healthcare facilities in Australia now utilize personalized medication tracking systems, processing nearly 10 million patient prescriptions annually.
Market Challenges
Regulatory Restrictions and Complex Compliance Requirements Impede Market Expansion
Regulators enforce strict licensing standards for online dispensaries and control distribution channels. The Australia ePharmacy Market faces high approval burdens that delay new entrants. It must meet varied state laws and pharmacy board mandates to maintain licensing. It requires detailed audit trails for each transaction and regular reporting to authorities. It compels platforms to allocate substantial resources for compliance teams and legal support. It increases overhead costs and limits investment in service improvements. It challenges smaller operators that lack scale for compliance expenses.
- For instance, the Pharmacy Board of Australia recorded 466 notifications lodged with regulatory authorities regarding compliance issues in the ePharmacy sector
Logistical Complexities and Data Security Expectations Challenge Operational Sustainability
Epharmacies need robust cold-chain networks to handle temperature-sensitive medications without spoilage. The Australia ePharmacy Market relies on precise tracking systems and fast delivery zones to avoid delays. It must secure patient records against cyber threats and comply with privacy laws. It faces risk of packet loss during transport in remote regions and must devise backup routes. It demands staff training for safe substance storage and emergency response. It compels investment in encrypted platforms and incident response protocols. It raises operational costs and reduces profit margins for small providers.
Market Opportunities
Capitalizing on Remote Area Penetration Through Telepharmacy Expansion
The Australia ePharmacy Market gains access to rural patients who struggle with pharmacy access. It offers direct shipment models that bypass travel barriers. Partnerships with local clinics deliver prescriptions and basic consultation support. Telehealth collaboration enables licensed pharmacists to consult via video and phone. Regulatory incentives fund infrastructure deployment in underserved regions. Patient adoption rates climb when service reliability meets expectations. Market players attract government grants by demonstrating improved healthcare coverage.
Developing Value-Added Digital Services and Strategic Partnerships
Providers develop subscription plans that ensure continuous medication supply and loyalty. The Australia ePharmacy Market can integrate AI for personalized dosage reminders and therapy adjustments. It forges alliances with insurance firms to include digital pharmacy benefits in coverage. It leverages health data platforms to deliver chronic disease management tools. It taps into wearable device integration for real-time monitoring and alerts. Strategic collaboration with telemedicine vendors expands service portfolios. Investors support technology pilots that demonstrate improved adherence and cost savings.
Market Segmentation Analysis
By Product Type
The Australia ePharmacy Market divides into prescription medications and over-the-counter (OTC) medications. Prescription medications command the larger share due to high demand for chronic-care therapies. It supports complex dispensing requirements and integrates with telemedicine platforms. OTC medications follow, driven by consumer preference for self-care and preventive health products. Retailers stock expanded OTC portfolios to capture impulse purchases and wellness trends.
By Platform Type
Market platforms split into mobile apps and web-based ePharmacies. Mobile apps lead in user engagement through push notifications, refill alerts and streamlined payments. It enables one-touch ordering and digital wallet integration. Web-based ePharmacies continue strong performance by offering detailed product catalogs and desktop-friendly interfaces. Providers maintain both channels to maximize reach and accommodate diverse user preferences.
Segments
Based on Product Type
- Prescription Medications
- Over-the-counter (OTC) Medications
Based on Platform Type
- ePharmacy Mobile Apps
- Web-Based ePharmacies
Based on Prescription Fulfillment
- Telemedicine and Online Prescriptions
- Prescription Delivery
- Prescription Transfer Services
Based on E-Commerce Models
- Pure-Play ePharmacies
- Brick-and-Click Pharmacies
- Marketplace and Aggregator Platforms
Based on Region
- New South Wales
- Victoria
- Queensland
- South Australia
- Western Australia
- Tasmania
- Northern Territory
- Australian Capital Territory
Regional Analysis
New South Wales and Victoria Drive Market Growth
New South Wales and Victoria account for the highest transaction volumes and revenue generation in the Australia ePharmacy Market. Major urban centers in Sydney and Melbourne host dense patient populations with reliable internet access and advanced healthcare infrastructure. It supports high adoption rates for online prescription fulfillment and telepharmacy consultations. Retailers in these states maintain extensive distribution hubs that reduce delivery windows. Government health initiatives fund digital health pilots and foster public trust in online dispensaries. Competition among local and national players further improves service quality and pricing.
Emerging Demand in Queensland and Western Australia
Queensland and Western Australia exhibit steady upticks in ePharmacy usage that reflect growing digital literacy and rural coverage expansion. It benefits from pilot programs connecting remote clinics with licensed pharmacists through video consultations. Regional logistics providers partner with ePharmacy platforms to strengthen last-mile delivery into outlying communities. State regulators streamline licensing procedures to accommodate innovative fulfillment models. Pharmacy networks launch targeted marketing campaigns that highlight home-delivery convenience and subscription savings. Patient education drives greater willingness to adopt online medication management services.
Opportunities in Smaller Territories and Rural Regions
Tasmania, Northern Territory and the Australian Capital Territory demonstrate untapped potential for digital pharmacy solutions. It experiences chronic medication shortages and travel constraints that elevate the value of ePharmacy offerings. Local healthcare agencies collaborate with online platforms to pilot mobile dispensing units and curbside pickup points. Operators design tailored service tiers that include remote adherence support and emergency prescription transfers. It addresses seasonal demand spikes by aligning inventory with regional health trends. Strategic investment in these areas can yield significant market share gains.
Key players
- Chemist Warehouse
- Priceline Pharmacy
- Amcal Pharmacies
- Chemist Direct Online
- Advanced Pharmacy Australia
Competitive Analysis
The Australia ePharmacy Market exhibits strong competition among major providers. Chemist Warehouse and Priceline Pharmacy maintain dominant positions through large-scale logistics and aggressive pricing strategies. It challenges competitors by offering in-store pick-up options and subscription bundles. Amcal Pharmacies differentiates through pharmacist-led teleconsultations and loyalty tiers. It attracts health-centric customers with curated wellness products. Chemist Direct Online focuses on streamlined digital experiences and targeted promotions that improve conversion rates. It uses data insights to adjust inventory and pricing in real time. Advanced Pharmacy Australia targets specialized services such as compounding and high-acuity therapies. It builds partnerships with clinics to secure steady prescription volumes. This competitive environment drives service innovation, pricing optimization and expanded fulfillment models, benefiting consumers and pressuring new entrants to refine their value propositions.
Recent Developments
- On 28 August 2024, The Society of Hospital Pharmacists of Australia (SHPA) officially began trading as Advanced Pharmacy Australia, adopting a new brand identity and broadened mandate to extend advanced pharmacy practice beyond hospitals
- In January 2025, Amcal Pharmacy updated its mobile app to introduce “Tap-To-Refill” for one-tap prescription orders, automatic medication lists, home delivery payments,and recurring script reminders.
Market Concentration and Characteristics
Market concentration in the Australia ePharmacy Market remains moderate, with leading players capturing significant revenue shares while smaller operators carve out niche segments. It features a handful of dominant pharmacies that leverage extensive distribution networks and strong brand recognition to maintain pricing power. Mid-tier providers compete through specialized services, such as compounding and chronic care management. Niche platforms target underserved communities and offer personalized digital solutions. Competitive dynamics drive continuous investment in logistics, technology and customer engagement tools. Regulatory oversight and high compliance costs create barriers that protect established firms. Shifts in consumer behavior toward online health services sustain market growth and encourage new entrants to seek distinct value propositions.
Report Coverage
The research report offers an in-depth analysis based on Product Type, Platform Type, Prescription Fulfillment, E-Commerce Models and Region. It details leading market players, providing an overview of their business, product offerings, investments, revenue streams, and key applications. Additionally, the report includes insights into the competitive environment, SWOT analysis, current market trends, as well as the primary drivers and constraints. Furthermore, it discusses various factors that have driven market expansion in recent years. The report also explores market dynamics, regulatory scenarios, and technological advancements that are shaping the industry. It assesses the impact of external factors and global economic changes on market growth. Lastly, it provides strategic recommendations for new entrants and established companies to navigate the complexities of the market.
Future Outlook
- Providers will expand telepharmacy networks to serve remote communities, reducing medication access gaps. They will deploy mobile dispensing units and partner with local clinics to streamline prescription fulfillment.
- Platforms will integrate artificial intelligence to analyze patient data and tailor dosage schedules. They will send adaptive reminders and adjust refill plans based on real-time adherence insights
- Developers will roll out advanced app features such as voice-activated prescription refills and biometric authentication. They will improve user retention through gamified adherence tracking and secure digital wallets.
- E-pharmacies will scale subscription services that automate refills and offer tiered pricing plans. They will foster long-term customer loyalty through bundled health-and-wellness offerings.
- Market leaders will forge partnerships with telehealth platforms to bundle virtual consultations and pharmacy services. They will co-develop integrated portals that manage prescriptions end-to-end.
- Stakeholders will adopt blockchain to trace medication provenance and ensure cold-chain integrity. They will publish immutable transaction records to bolster patient trust and regulatory compliance.
- Operators will introduce niche services for chronic and rare disease management, including biologics handling and compounding. They will integrate pharmacist counseling for complex therapy regimens.
- Policymakers will refine online pharmacy regulations to accommodate innovative fulfillment models. They will offer fast-track licensing for platforms demonstrating secure operations and patient safety measures.
- E-pharmacies will ingest data from smart devices to personalize therapy recommendations and detect adherence lapses. They will collaborate with device manufacturers to create unified patient dashboards.
- Larger chains will acquire niche digital players to strengthen market positions and broaden service portfolios. They will leverage combined logistics networks and shared technology investments.
Request a Free Sample
Fill in your details and we'll send you a free sample report.
- Sample data tables & charts
- Research methodology
Need a Custom Version of This Report?
Tailor the scope, geography, or segments to your exact requirements.
- Custom geography or segment scope
- Direct access to our analyst team
Frequently Asked Questions
What was the market size in 2023, what is it projected to be in 2032, and what is the CAGR?
Which factors drive the growth of the Australia ePharmacy Market?
What role do logistics and cold-chain systems play?
Who leads the competitive landscape in the Australia ePharmacy Market?
Table of Content
Chapter 1. Report Introduction
- 1.1 Report Description & Purpose
- 1.1.1 Report Title & Market Definition
- 1.1.2 Unique Selling Propositions (USP) & Key Differentiators
- 1.1.3 Value Proposition for Stakeholders
- 1.2 Research Objectives
- 1.2.1 Market Sizing Objectives (Volume & Revenue) (Volume Where Applicable)
- 1.2.2 Segmentation Objectives
- 1.2.3 Competitive Intelligence Objectives
- 1.2.4 Forecast & Scenario Objectives
- 1.3 Report Scope
- 1.3.1 Australia ePharmacy Scope – Segments & Subsegments Covered
- 1.3.2 Geographic Scope – Selected Country & Subnational Markets Covered
- 1.3.3 Historical Period, Base Year & Forecast Period (2024; forecast to 2032)
- 1.3.4 Inclusions & Exclusions
- 1.4 Industry Classification & Applicable Codes
- 1.5 Currency, Measurement Units & Valuation Basis
- 1.6 Target Stakeholders
- 1.7 Limitations & Assumptions
Chapter 2. Executive Summary
- 2.1 Australia ePharmacy Snapshot
- 2.1.1 Market Size – Historical (2024) & Forecast (2024-2032) (2024: USD 3,609.64 million → 2032: USD 9,228.69 million)
- 2.1.2 Volume & Revenue – National Totals (Volume Where Applicable)
- 2.1.3 Key Market Highlights – Top Five Facts
- 2.2 Australia ePharmacy Segmentation Snapshot
- 2.2.1 Market Split by Subnational Area – 2024 vs. 2032
- 2.3 Competitive Snapshot
- 2.3.1 Top 10 Players by Revenue Share – 2024
- 2.3.2 Top 10 Players by Volume Share – 2024 (Volume Where Applicable)
- 2.3.3 Recent Strategic Developments (18-Month Summary)
- 2.4 Key Investment Highlights & Strategic Conclusions
Chapter 3. Australia ePharmacy Dynamics & Industry Analysis
- 3.1 Market Overview & Context
- 3.1.1 Australia ePharmacy Position in the Broader Industry Value Chain
- 3.1.2 Demand Structure & Purchasing Dynamics
- 3.1.3 Market Maturity & Development Stage Across Domestic Markets
- 3.2 Australia ePharmacy Drivers
- 3.3 Australia ePharmacy Restraints & Challenges
- 3.4 Australia ePharmacy Opportunities
- 3.5 Porter's Five Forces Analysis
- 3.5.1 Threat of New Entrants
- 3.5.2 Bargaining Power of Suppliers
- 3.5.3 Bargaining Power of Buyers
- 3.5.4 Threat of Substitutes
- 3.5.5 Competitive Rivalry – Intensity Assessment
- 3.6 Australia ePharmacy Value Chain Analysis
- 3.6.1 Upstream – Key Inputs, Resources & Suppliers
- 3.6.1.1 Key Input/Resource 1
- 3.6.1.2 Key Input/Resource 2
- 3.6.1.3 Key Input/Resource 3
- 3.6.2 Midstream – Core Operations & Value Creation
- 3.6.2.1 Operating Model & Process Overview
- 3.6.2.2 Key Operating Locations & Capabilities by Company
- 3.6.3 Downstream – Market Channels & End Users
- 3.6.3.1 Direct Sales & Customer Engagement Channels
- 3.6.3.2 Indirect Sales, Intermediaries & Partner Channels
- 3.6.4 Value Chain Profitability Analysis
- 3.6.1 Upstream – Key Inputs, Resources & Suppliers
- 3.7 PESTEL Analysis
- 3.7.1 Political Factors
- 3.7.2 Economic Factors
- 3.7.3 Social Factors
- 3.7.4 Technological Factors
- 3.7.5 Environmental Factors
- 3.7.6 Legal Factors
- 3.8 Australia ePharmacy Supply Chain Analysis
- 3.8.1 Critical Input & Resource Availability Risk Assessment
- 3.8.2 Supplier & Operational Concentration Risk (Geographic Exposure)
- 3.8.3 Supply & Service Disruption Impact Analysis
- 3.9 National & Subnational Regulatory Landscape
Note: The regulatory and policy landscape section covers regulations based on their applicability to the market, Australia ePharmacy category, geography, and scope of the study. Only regulatory frameworks with a material impact on operations, compliance, trade, sustainability, or market access are analyzed in detail.
Chapter 4. Key Investment Pockets & Opportunity Analysis
- 4.1 Australia ePharmacy Attractiveness Analysis
- 4.1.1 By Subnational Area – Investment Attractiveness Matrix (Market Size × CAGR)
- 4.2 Absolute Revenue Growth Opportunity
- 4.2.1 By Subnational Area – Absolute Revenue Growth Through 2032
- 4.3 Incremental Demand Opportunity
- 4.3.1 By Subnational Area – Incremental Demand Through 2032
- 4.3.2 Segment – Incremental Demand
- 4.4 Emerging Submarket Opportunity Deep Dive (Subject to Applicability)
- 4.5 Priority Domestic Market Opportunity Scorecards
- 4.5.1 Priority Domestic Market 1
- 4.5.2 Priority Domestic Market 2
- 4.5.3 Priority Domestic Market 3
- 4.5.4 Priority Domestic Market 4
Note: Domestic market scorecards cover relevant states, provinces, territories, cities, or economic zones within the selected country. Numbered entries are populated with market names suited to the national administrative structure and research scope. Geographic share tables use one consistent, nonoverlapping set of areas.
Chapter 5. Australia ePharmacy Cross-Border Trade & Market Access Analysis
- 5.1 National Trade & International Partner Overview
- 5.1.1 Export Value by Destination Country (2024)
- 5.1.2 Export Volume by Destination Country (2024) (Where Applicable)
- 5.1.3 Import Value by Source Country (2024)
- 5.1.4 Import Volume by Source Country (2024) (Where Applicable)
- 5.1.5 National & Partner-Country Trade Balances (2024)
- 5.2 Export Analysis – Segment
- 5.2.1 Category 1 (Applicable Classification Code)
- 5.2.2 Category 2 (Applicable Classification Code)
- 5.2.3 Category 3 (Applicable Classification Code)
- 5.2.4 Category 4 (Applicable Classification Code)
- 5.2.5 Category 5 (Applicable Classification Code)
- 5.3 Import Analysis – Segment
- 5.3.1 Category 1 (Applicable Classification Code)
- 5.3.2 Category 2 (Applicable Classification Code)
- 5.3.3 Category 3 (Applicable Classification Code)
- 5.3.4 Category 4 (Applicable Classification Code)
- 5.3.5 Category 5 (Applicable Classification Code)
- 5.4 Cross-Border Pricing & Transaction Benchmarks
- 5.4.1 Export Pricing – Segment & Destination Country
- 5.4.2 Import Pricing – Segment & Source Country
- 5.4.3 Price Trends (2024)
- 5.5 Key Cross-Border Trade & Delivery Routes
- 5.5.1 Cross-Border Trade/Delivery Route 1
- 5.5.2 Cross-Border Trade/Delivery Route 2
- 5.5.3 Cross-Border Trade/Delivery Route 3
- 5.5.4 Cross-Border Trade/Delivery Route 4
- 5.5.5 Cross-Border Trade/Delivery Route 5
- 5.6 Trade Policy & Market Access Impact Assessment
- 5.6.1 Tariff & Non-Tariff Barriers
- 5.6.2 National Participation in Regional Trade & Economic Frameworks
- 5.6.3 Bilateral & Multilateral Trade Agreements
- 5.6.4 Cross-Border Operating, Licensing & Localization Requirements
Note: This chapter covers international trade relevant to Australia ePharmacy in the selected country. Exports are analyzed by destination and imports by source. Domestic interregional flows are excluded from international trade totals. Goods, services, and digital offerings use applicable classifications; volume and route analyses apply only where meaningful.
Chapter 6. Competitive Landscape & Company Benchmarking
- 6.1 Australia ePharmacy Concentration & Structure
- 6.1.1 Herfindahl-Hirschman Index (HHI) – vs. 2024
- 6.1.2 Leading, Mid-Sized & Emerging Player Structure
- 6.1.3 Multinational, National & Local Player Dynamics
- 6.2 Australia ePharmacy Share Analysis – 2024
- 6.2.1 National Revenue Share by Company
- 6.2.2 National Volume Share by Company (Volume Where Applicable)
- 6.2.3 Company Revenue Share by Subnational Area
- 6.2.4 Market Share Evolution ( vs. 2024)
- 6.2.5 Company Market Share by Key Segment
- 6.2.6 Company Market Share by Customer Group
- 6.3 Operating Scale, Capacity & Infrastructure Analysis
- 6.3.1 National Operating Scale & Supply Capacity
- 6.3.2 Resource Utilization & Operating Efficiency
- 6.3.3 Output, Service Delivery & Activity Metrics
- 6.3.4 Operating Footprint & Infrastructure Map
- 6.3.5 Planned Operational & Capacity Expansion
- 6.4 Australia ePharmacy Competitive Benchmarking Matrix
- 6.4.1 Revenue, Growth, Profitability & Operating Metric Comparison
- 6.4.2 Channel Revenue Mix
- 6.4.3 Revenue Exposure Across Domestic Markets
- 6.4.4 R&D Intensity
- 6.4.5 Sustainability Maturity
- 6.5 Strategic Developments in Australia ePharmacy (Last 24 Months)
- 6.5.1 Mergers, Acquisitions & Divestments
- 6.5.2 New Products, Services & Solutions in Australia ePharmacy
- 6.5.3 Operational & Infrastructure Expansions
- 6.5.4 Strategic Alliances, Joint Ventures & Partnerships
- 6.5.5 Distribution Expansion & Market Entry
- 6.5.6 Sustainability & ESG Initiatives
- 6.6 Competitive Strategy Mapping
- 6.6.1 Leader, Challenger, Follower & Niche Classification
- 6.6.2 Pricing Strategy Comparison
- 6.6.3 Channel Strategy Matrix
Note: Strategic developments are included based on their materiality and the availability of reliable information.
Chapter 7. Australia ePharmacy – By Sales & Delivery Channel
- 7.1 Segment Overview
- 7.1.1 Volume & Revenue Split by Channel (2024 & 2032) (Volume Where Applicable)
- 7.1.2 Channel Mix Evolution (2024-2032)
Chapter 8. Subnational Market Analysis – Country Overview
- 8.1 Domestic Geographic Market Overview
- 8.1.1 Subnational Volume Share (Where Applicable)
- 8.1.2 Subnational Revenue Share
- 8.1.3 Market Volume by Subnational Area (Where Applicable)
- 8.1.4 Market Revenue by Subnational Area
- 8.1.5 Subnational Forecasts Through 2032
- 8.2 Cross-Area Segment Analysis Within the Country
- 8.2.1 By Sales & Delivery Channel
- 8.2.2 By Competitive Positioning & Price Tier
Chapter 9. Australia ePharmacy – Priority Domestic Market 1
Chapter 10. Australia ePharmacy – Priority Domestic Market 2
Chapter 11. Australia ePharmacy – Priority Domestic Market 3
Chapter 12. Australia ePharmacy – Priority Domestic Market 4
Chapter 13. Australia ePharmacy Company Profiles
- 13.1 [Company 01]
- 13.1.1 Company Overview
- 13.1.2 Key Management Personnel
- 13.1.3 Products & Services Portfolio
- 13.1.4 Financial Performance
- 13.1.5 Domestic Market Focus & Local Operating Presence
- 13.1.6 Recent Developments & Strategic Initiatives
Note: The company profile list is preliminary and may change based on research findings, market developments, data availability, and client requirements.
Chapter 14. Appendices
- Appendix A – List of Abbreviations & Acronyms
- Appendix B – Industry Classification Code Reference – Full Series
- Appendix C – Supply, Output & Operating Capacity Data Tables
- Appendix D – End-Use & Demand Base Tables
- Appendix E – Demand, Adoption & Usage Assumptions
- Appendix F – Pricing & Revenue Metric Reference Tables
- Appendix G – Company Operations & Infrastructure Database
- Appendix H – Cross-Border Trade & Activity Data Tables (Where Applicable)
- Appendix I – Regulatory Summary Tables
- Appendix J – Primary Research Participant List (Anonymized)
- Appendix K – Primary Research Questionnaire Framework
- Appendix L – Data Sources & Bibliography
- Appendix M – Market Size Divergence & Source Comparison
Chapter 15. Research Methodology
- 15.1 Research Framework & Philosophy
- 15.2 Secondary Research – Sources, Hierarchy & Data Extraction
- 15.3 Data Modeling – National Market Sizing & Subnational Allocation
- 15.4 Primary Research – Stakeholder Framework, LOI & Sample Sizes
- 15.5 Forecast Methodology – Regression, Scenario & Sensitivity Analysis
- 15.6 Quality Control – Four-Layer Validation Framework
- 15.7 Limitations & Standard Assumptions
- 15.8 Disclaimer
