
Market Overviews
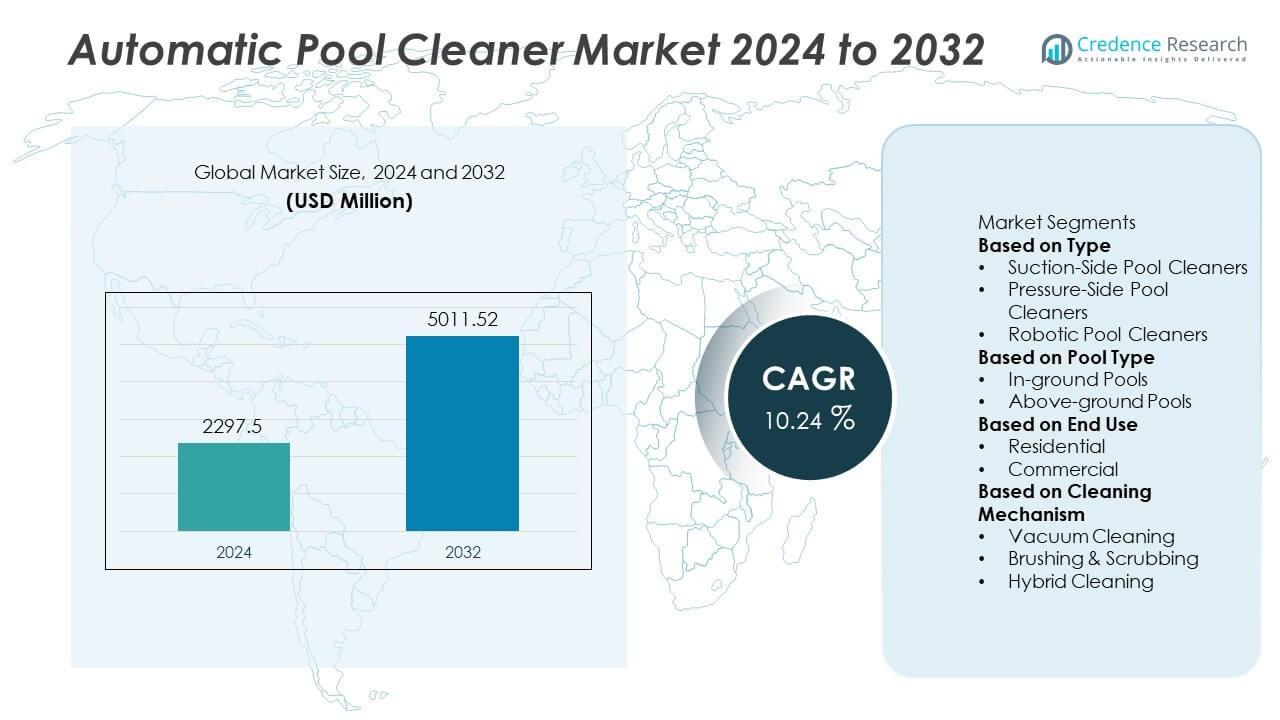
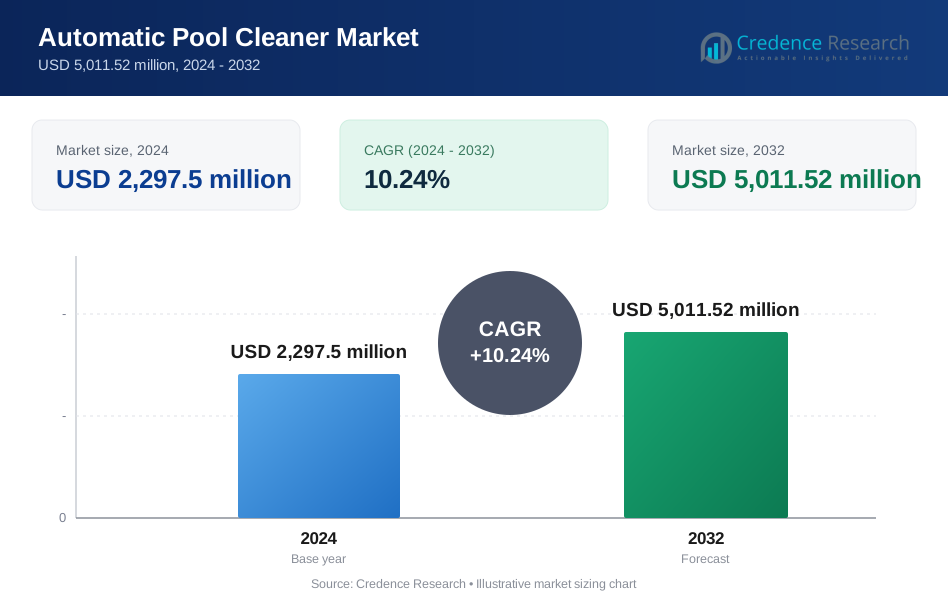
The Automatic Pool Cleaner market reached USD 2,297.5 million in 2024 and is projected to rise to USD 5,011.52 million by 2032, supported by a CAGR of 10.24% during the forecast period.
| REPORT ATTRIBUTE | DETAILS |
|---|---|
| Historical Period | 2020-2023 |
| Base Year | 2024 |
| Forecast Period | 2025-2032 |
| Automatic Pool Cleaner Market Size 2024 | USD 2,297.5 Million |
| Automatic Pool Cleaner Market, CAGR | 10.24% |
| Automatic Pool Cleaner Market Size 2032 | USD 5,011.52 Million |
The Automatic Pool Cleaner market is led by major players such as Maytronics Ltd., Zodiac Pool Systems (Fluidra), Hayward Industries, Inc., Pentair plc, Waterco Ltd., Kokido Development Ltd., iRobot Corporation, Aquabot (Aqua Products), Polaris (Fluidra), and Desjoyaux Pools. These companies focus on advanced robotic systems, stronger filtration performance, and smart connectivity features to improve cleaning efficiency for residential and commercial pools. North America leads the global market with a 38% share, supported by high pool ownership and strong demand for robotic cleaners. Europe follows with a 29% share, driven by advanced product adoption and strict hygiene standards, while Asia Pacific holds a 23% share, fueled by rising pool installations and growing interest in automated cleaning solutions.
Market Insights
- The market reached USD 2,297.5 million in 2024 and is projected to reach USD 5,011.52 million by 2032, growing at a 10.24% CAGR during the forecast period.
- Demand rises due to growing residential pool installations and strong adoption of robotic pool cleaners, supported by the need for faster, hands-free cleaning and improved water hygiene.
- Robotic cleaners lead the type segment with a 57% share, driven by smart navigation, stronger suction, and lower operating cost, while in-ground pools dominate pool type with a 68% share due to higher usage and deeper cleaning needs.
- North America leads with a 38% share, followed by Europe at 29% and Asia Pacific at 23%, driven by strong pool ownership, hospitality growth, and rising adoption of automated cleaning systems.
- Competition intensifies as top players enhance filtration performance and smart features, while high robotic cleaner costs and limited awareness in emerging markets act as restraints.
Market Segmentation Analysis:
By Type
Robotic pool cleaners dominate the segment with a 57% market share, driven by strong demand for energy-efficient, fully automated cleaning solutions. Users prefer robotic systems for their advanced navigation, superior debris removal, and reduced reliance on pool pumps. These cleaners offer faster cleaning cycles and lower long-term operating costs, supporting strong adoption in both residential and commercial settings. Suction-side cleaners remain popular in budget-focused markets due to easy installation and low upfront cost. Pressure-side cleaners continue to serve large pools requiring high-power debris removal, but their share declines as consumers shift toward compact and intelligent robotic models.
- For instance, Maytronics introduced a dual-motor robotic drive system that boosts maneuverability with two independent 24-volt motors. The system supports a filtration capacity of 4,000 gallons per hour, enhancing deep debris extraction.
By Pool Type
In-ground pools lead the segment with a 68% market share, supported by higher installation rates in residential villas, hotels, resorts, and sports facilities. These pools require frequent and thorough cleaning, driving strong demand for robotic and pressure-side cleaners with advanced wall-climbing and deep-scrubbing capabilities. As urban housing expands, in-ground pools gain traction in premium real estate developments, further boosting sales. Above-ground pools hold a smaller share due to simpler maintenance needs, but demand grows as homeowners adopt lightweight suction and robotic units designed for portable pool setups.
- For instance, Hayward Industries developed efficient motors for its in-ground pool robots that improve wall adhesion and enable comprehensive cleaning patterns. Its popular TigerShark robotic pool cleaners come equipped with a large debris chamber, typically around 5 liters in capacity, which extends cleaning cycles by holding a significant amount of leaves, dirt, and acorns.
By End Use
The residential sector accounts for a 72% market share, driven by rising pool ownership, increased preference for low-maintenance living, and wider adoption of robotic cleaners. Homeowners choose automatic pool cleaners to reduce manual labor, improve water hygiene, and maintain consistent cleanliness throughout the year. Smart features such as app control, programmable cycles, and energy-saving operation further strengthen adoption in households. The commercial segment, including hotels, clubs, fitness centers, and public facilities, follows with steady demand for high-capacity units capable of handling larger pools and heavy debris loads.
Key Growth Drivers
Rising Adoption of Robotic Pool Cleaning Technologies
Demand for robotic pool cleaners grows rapidly as users seek automated, energy-efficient, and time-saving cleaning solutions. These systems offer advanced navigation, strong suction, multi-layer filtration, and wall-climbing capabilities that improve cleaning precision. Homeowners prefer robotic units due to low operating cost and independence from pool pumps. Commercial facilities adopt them to maintain hygiene standards and reduce manual labor. Growing smart-home penetration supports wider acceptance of app-controlled and programmable robotic models. This shift drives strong market expansion across developed and developing regions.
- For instance, Zodiac (Fluidra) enhanced its Alpha iQ Pro series with a cyclone suction system. The unit uses a four-wheel-drive mechanism powered by a 30-volt DC motor for stable movement.
Growing Popularity of Residential Swimming Pools
Rising pool construction in residential properties fuels strong demand for automatic pool cleaners. Homeowners invest in advanced cleaning solutions to maintain hygiene, improve water clarity, and reduce manual maintenance. Increasing adoption of lifestyle amenities and rapid expansion of modern housing communities drive pool installations. Robotic and suction-side cleaners provide cost-effective cleaning, appealing to both premium and budget segments. Seasonal demand also strengthens as users prepare pools for year-round use. This trend boosts consistent growth across North America, Europe, and key Asia Pacific markets.
- For instance, Pentair introduced the Prowler 930W with a powerful high-speed scrubbing brush, capturing both large and ultra-fine debris. The cleaner operates independently from the pool's filtration system and uses a 60-foot tangle-free swivel cable for broad pool coverage.
Increasing Need for Efficient Commercial Pool Maintenance
Commercial pools in hotels, resorts, sports clubs, and water parks require high-performance cleaning solutions. Automatic pool cleaners support consistent cleanliness by removing algae, debris, and fine particles more quickly than manual cleaning. Large facilities prefer robotic and pressure-side models due to stronger scrubbing power and long cleaning cycles. Rising tourism and hospitality investments contribute to the growing number of commercial pools. Regulatory emphasis on hygiene and water quality further drives adoption of automated solutions. Businesses adopt these systems to reduce labor costs and improve operational efficiency.
Key Trends & Opportunities
Strong Shift Toward Smart and IoT-Enabled Pool Cleaners
IoT-based pool cleaners gain popularity as users adopt connected devices that support remote operation, real-time monitoring, and automated scheduling. Manufacturers integrate mobile apps, sensor-based navigation, and AI-driven route optimization to improve cleaning accuracy. Smart models offer energy tracking, maintenance alerts, and customizable cleaning modes. Growing smart-home adoption expands opportunities for connected pool-cleaning ecosystems. This trend also supports higher demand in technologically mature regions such as North America and Europe, encouraging manufacturers to invest in digital enhancements.
- For instance, iRobot's Mirra 530 pool-cleaning robot used iAdapt Nautiq Responsive Cleaning Technology to assess pool dimensions and select an optimum cleaning cycle. The system used two powerful motors (one for drive, one for pumping) and a self-contained vacuum, pump, and filter system to circulate 70 gallons of water per minute.
Rising Demand for Eco-Friendly and Energy-Efficient Cleaning Solutions
Environmental concerns encourage the use of energy-efficient robotic cleaners that reduce water wastage and electricity consumption. Manufacturers develop lightweight designs, low-voltage motors, and multi-layer filtration systems that minimize chemical usage. Solar-assisted and battery-efficient models emerge as attractive alternatives for sustainable pool maintenance. Consumers and commercial facilities adopt these solutions to lower utility costs and reduce environmental impact. Growing emphasis on green technologies strengthens opportunities for innovative, high-efficiency pool-cleaning systems.
- For instance, Waterco introduced an eco-focused cleaner equipped with an 18-volt DC motor that operates at 120 watts for low energy draw. The filtration module processes 3,800 liters of water per hour using a dual-cartridge filter system rated to capture particles down to 5 microns.
Key Challenges
High Initial Cost of Robotic Pool Cleaners
Robotic models offer advanced performance but remain expensive for cost-sensitive users. Their high purchase price limits adoption in markets with lower disposable income. Commercial facilities may delay upgrades due to budget constraints. Although long-term operating cost is lower, upfront affordability remains a barrier. Manufacturers must balance pricing with advanced features to expand market reach. Cost challenges slow penetration across developing regions despite rising demand.
Limited Awareness and Technical Complexity in Emerging Markets
In developing countries, many users remain unaware of the benefits of automated pool cleaning technologies. Lack of familiarity with robotic systems and concerns about maintenance reduce adoption rates. Technical complexity, including software updates and component servicing, discourages some consumers. Limited distribution networks and fewer service centers further restrict market expansion. Manufacturers need targeted education, simplified product designs, and stronger after-sales support to improve adoption.
Regional Analysis
North America
North America holds a 38% market share, driven by strong residential pool ownership and high adoption of robotic cleaning technologies. The United States leads due to widespread use of in-ground pools and growing interest in smart, app-controlled cleaning systems. Consumers prefer automated cleaners to reduce maintenance time and improve water hygiene. Commercial facilities, including hotels and sports clubs, also invest in high-capacity robotic models to meet cleanliness standards. Strong distribution networks and frequent product upgrades from major brands support steady growth. Rising demand for energy-efficient and eco-friendly solutions further strengthens market expansion across the region.
Europe
Europe accounts for a 29% market share, supported by growing popularity of home pools in countries such as France, Spain, Italy, and Germany. The region benefits from rising adoption of robotic and pressure-side cleaners that enhance cleaning efficiency and reduce manual labor. Strict hygiene regulations in commercial pools encourage investment in advanced cleaning systems. Consumers increasingly choose lightweight, energy-saving models that support sustainability goals. Expanding tourism and hospitality sectors drive additional demand for commercial pool maintenance solutions. Strong technology innovation from European manufacturers further accelerates market development.
Asia Pacific
Asia Pacific holds a 23% market share, driven by increasing pool construction in residential complexes, luxury villas, hotels, and resorts across China, Australia, India, and Southeast Asia. Urbanization and rising disposable incomes support higher adoption of automatic cleaning systems, especially robotic models. Commercial facilities adopt advanced cleaners to maintain water quality in high-traffic pools. Growing awareness of hygiene and convenience accelerates the shift from manual cleaning to automated solutions. Expanding e-commerce channels and competitive pricing from regional manufacturers boost accessibility. The region is emerging as a high-growth market for smart and energy-efficient pool cleaners.
Latin America
Latin America holds a 6% market share, supported by growing pool installations in Brazil, Mexico, and Argentina. Residential users increasingly adopt suction and robotic cleaners to manage routine maintenance in warm-climate regions where pools are used year-round. Hotels and resorts also invest in automated systems to maintain cleanliness standards efficiently. Economic improvements and rising interest in home leisure amenities further support demand. However, cost sensitivity limits adoption of premium robotic models, prompting higher sales of mid-range cleaners. Expanding distribution networks and greater product awareness drive steady growth across the region.
Middle East & Africa
The Middle East & Africa region accounts for a 4% market share, driven by strong pool construction in luxury homes, hotels, and recreational facilities across the UAE, Saudi Arabia, and South Africa. Hot climatic conditions increase pool usage, raising the need for frequent cleaning and boosting demand for automated systems. High-end consumers adopt robotic cleaners for convenience and deep-cleaning capability. Commercial facilities also prefer advanced units to maintain water clarity under heavy footfall. Growth remains steady, though high product costs and limited awareness in some markets restrict broader adoption. Increasing tourism and premium housing projects support future expansion.
Market Segmentations:
By Type
- Suction-Side Pool Cleaners
- Pressure-Side Pool Cleaners
- Robotic Pool Cleaners
By Pool Type
- In-ground Pools
- Above-ground Pools
By End Use
- Residential
- Commercial
By Cleaning Mechanism
- Vacuum Cleaning
- Brushing & Scrubbing
- Hybrid Cleaning
By Geography
- North America
- U.S.
- Canada
- Mexico
- Europe
- Germany
- France
- U.K.
- Italy
- Spain
- Rest of Europe
- Asia Pacific
- China
- Japan
- India
- South Korea
- South-east Asia
- Rest of Asia Pacific
- Latin America
- Brazil
- Argentina
- Rest of Latin America
- Middle East & Africa
- GCC Countries
- South Africa
- Rest of the Middle East and Africa
Competitive Landscape
The competitive landscape includes major participants such as Maytronics Ltd., Zodiac Pool Systems (Fluidra), Hayward Industries, Inc., Pentair plc, Waterco Ltd., Kokido Development Ltd., iRobot Corporation, Aquabot (Aqua Products), Polaris (Fluidra), and Desjoyaux Pools. These companies compete through advanced robotic technologies, stronger suction capabilities, and energy-efficient cleaning mechanisms tailored for both residential and commercial pools. Leading manufacturers focus on innovation in navigation systems, multi-layer filtration, and smart connectivity to enhance cleaning precision and user convenience. Partnerships with distributors and expansion of e-commerce channels strengthen global reach. Companies also invest in durable designs suitable for in-ground and above-ground pools to meet diverse customer needs. Competitive intensity increases as brands introduce AI-enabled route optimization, app-based control, and eco-friendly models to attract tech-driven consumers. Continuous improvements in performance, automation, and battery efficiency remain central to maintaining market leadership.
Key Player Analysis
- Maytronics Ltd.
- Zodiac Pool Systems (Fluidra)
- Hayward Industries, Inc.
- Pentair plc
- Waterco Ltd.
- Kokido Development Ltd.
- iRobot Corporation
- Aquabot (Aqua Products)
- Polaris (Fluidra)
- Desjoyaux Pools
Recent Developments
- In April 2025, Fluidra SA (via its brand Zodiac Pool Systems) announced a 27% stake investment in Aiper, a cordless robotic-pool-cleaner specialist.
- In January 2025, Waterco Ltd. released a next-generation cordless pool-cleaning solution, targeted for pools with interior obstacles.
- In November 2024, Maytronics Ltd. announced a major expansion of its cordless robotic pool-cleaner portfolio at the Piscine Global event, introducing new lines including the Dolphin LIBERTY™, Niya Tracker, and Dolphin Skimmi.
Report Coverage
The research report offers an in-depth analysis based on Type, Pool Type, End Use, Cleaning Mechanism and Geography. It details leading market players, providing an overview of their business, product offerings, investments, revenue streams, and key applications. Additionally, the report includes insights into the competitive environment, SWOT analysis, current market trends, as well as the primary drivers and constraints. Furthermore, it discusses various factors that have driven market expansion in recent years. The report also explores market dynamics, regulatory scenarios, and technological advancements that are shaping the industry. It assesses the impact of external factors and global economic changes on market growth. Lastly, it provides strategic recommendations for new entrants and established companies to navigate the complexities of the market.
Future Outlook
- Robotic pool cleaners will gain stronger adoption as users shift toward fully automated solutions.
- Smart and app-controlled models will expand due to rising integration with IoT ecosystems.
- Demand for energy-efficient and eco-friendly cleaners will increase across residential pools.
- Commercial facilities will adopt high-capacity robotic units to maintain strict hygiene standards.
- Hybrid models combining vacuuming and brushing functions will see higher market penetration.
- AI-based navigation and route optimization will become key differentiators for top brands.
- Battery-efficient and cordless robotic cleaners will gain popularity for improved mobility.
- E-commerce channels will drive faster product adoption in emerging markets.
- Manufacturers will expand distribution networks to strengthen global availability.
- Asia Pacific will emerge as the fastest-growing region due to increasing pool installations.
Request a Free Sample
Fill in your details and we'll send you a free sample report.
- Sample data tables & charts
- Research methodology
Market Dynamics
Rising Adoption of Robotic Pool Cleaning Technologies
Consumers and commercial facilities are increasingly choosing robotic pool cleaners for their advanced navigation, energy efficiency, and hands-free operation. These units offer superior cleaning precision, lower operating costs, and smart features such as app control, driving rapid market expansion.
Growing Popularity of Residential Swimming Pools
The increase in residential pool construction, especially in urban and premium housing developments, is fueling demand for automatic pool cleaners. Homeowners seek efficient, low-maintenance solutions to maintain water hygiene and clarity, boosting sales of both robotic and suction-side cleaners.
Increasing Need for Efficient Commercial Pool Maintenance
Hotels, resorts, sports clubs, and public facilities require high-performance cleaning solutions to meet strict hygiene standards and reduce manual labor. Automatic pool cleaners, particularly robotic and pressure-side models, are being adopted to handle large pools and heavy debris loads efficiently.
Strong Shift Toward Smart and IoT-Enabled Pool Cleaners
The integration of IoT, mobile apps, and AI-driven navigation in pool cleaners is attracting tech-savvy consumers and commercial operators. Smart features such as remote operation, real-time monitoring, and automated scheduling are becoming key differentiators, especially in developed markets.
Rising Demand for Eco-Friendly and Energy-Efficient Cleaning Solutions
Environmental concerns and the need to reduce utility costs are driving the adoption of energy-efficient, low-voltage, and eco-friendly pool cleaners. Manufacturers are responding with lightweight designs, solar-assisted models, and advanced filtration systems that minimize water and chemical usage.
Need a Custom Version of This Report?
Tailor the scope, geography, or segments to your exact requirements.
- Custom geography or segment scope
- Direct access to our analyst team
Frequently Asked Questions
What is the current market size for the Automatic Pool Cleaner market, and what is its projected size in 2032?
At what Compound Annual Growth Rate is the Automatic Pool Cleaner market projected to grow between 2025 and 2032?
Which Automatic Pool Cleaner market segment held the largest share in 2024?
What are the primary factors fueling the growth of the Automatic Pool Cleaner market?
Who are the leading companies in the Automatic Pool Cleaner market?
Which region commanded the largest share of the Automatic Pool Cleaner market in 2024?
Table of Content
Chapter 1 Market Segmentation
- 1.1 Segmentation Framework
- 1.1.1 Product and Service Classification
- 1.1.2 Application and End-Use Classification
- 1.1.3 Technology and Solution Classification
- 1.1.4 Customer and Distribution Channel Classification
- 1.1.5 Geographic Segmentation
- 1.1.6 Market Segment Definitions and Boundaries
- 1.2 By Type
- 1.2.1 Suction-Side Pool Cleaners
- 1.2.2 Pressure-Side Pool Cleaners
- 1.2.3 Robotic Pool Cleaners
- 1.3 By End Use
- 1.3.1 Residential
- 1.3.2 Commercial
- 1.4 By Pool Type
- 1.4.1 In-ground Pools
- 1.4.2 Above-ground Pools
- 1.5 By Cleaning Mechanism
- 1.5.1 Vacuum Cleaning
- 1.5.2 Brushing & Scrubbing
- 1.5.3 Hybrid Cleaning
Chapter 2 Introduction
- 2.1 Report Objectives and Scope
- 2.2 Product Definition and Industry Terminology
- 2.3 Market Inclusions and Exclusions
- 2.4 Research Process
- 2.4.1 Primary Research and Expert Interviews
- 2.4.2 Secondary Research and Source Review
- 2.4.3 Top-Down and Bottom-Up Estimation
- 2.4.4 Data Triangulation and Verification
- 2.5 Market Size Measurement Basis
- 2.5.1 2024: USD 2,297.5 million → 2032: USD 5,011.52 million
- 2.6 Historical and Forecast Reference Periods
- 2.6.1 Base Year: 2024
- 2.6.2 Forecast Period: 2024-2032
- 2.7 Research Assumptions and Limitations
Chapter 3 Executive Summary
- 3.1 Market Snapshot and Key Findings
- 3.2 Base-Year Market Size, 2024
- 3.3 Forecast Market Size, 2032
- 3.4 Revenue and Volume Growth Outlook
- 3.5 Key Demand and Supply Indicators
- 3.6 Leading Market Segments
- 3.7 Fastest-Growing Market Opportunities
- 3.8 Regional Performance Highlights
- 3.9 Technology and Industry Transformation
- 3.10 Competitive Landscape Summary
- 3.11 Analyst View and Strategic Implications
Chapter 4 Global Automatic Pool Cleaner Market Trends and Developments
- 4.1 Historical Industry Development
- 4.2 Recent Market Trends and Developments
- 4.3 Demand and Customer Behavior Trends
- 4.4 Technology and Product Innovation
- 4.5 Artificial Intelligence, Automation and Digitalization
- 4.6 Local Manufacturing and Supply Chain Realignment
- 4.7 Industry Partnerships, Mergers and Acquisitions
- 4.8 Sustainability and Circular Economy Developments
- 4.9 Government and Private Sector Investment Trends
- 4.10 Emerging Business Models and Commercialization
- 4.11 Industry Developments and Announcements
Chapter 5 Global Automatic Pool Cleaner Market Production, Supply and Demand Analysis
- 5.1 Demand Trend and Consumption Analysis
- 5.2 Demand Forecast, 2024-2032
- 5.3 Production and Output Trend
- 5.4 Production and Output Forecast, 2024-2032
- 5.5 Installed Capacity and Capacity Utilization
- 5.6 Company-Wise Production Plants and Statistics
- 5.6.1 Installed Production Capacity
- 5.6.2 Actual Production
- 5.6.3 Planned Capacity and Expansion Targets
- 5.7 Supply Chain Structure and Procurement Trends
- 5.8 Supply-Demand Gap and Bottlenecks
- 5.9 Import Dependence and Sourcing Structure
- 5.10 Contract Manufacturing and Outsourcing
- 5.11 Regional Supply and Demand Concentration
Chapter 6 Global Automatic Pool Cleaner Market Pricing Analysis
- 6.1 Pricing Structure and Measurement
- 6.2 Historical Pricing Trends
- 6.3 Pricing Outlook, 2024-2032
- 6.4 Average Selling Price and Unit Economics
- 6.5 Pricing by Product and Market Segment
- 6.6 Geographic Pricing Differences
- 6.7 Key Input, Energy, Labor and Logistics Costs
- 6.8 Contract Pricing and Purchasing Models
- 6.9 Pricing Sensitivity and Competitive Positioning
- 6.10 Price, Margin and Profitability Implications
Chapter 7 Global Automatic Pool Cleaner Market Dynamics
- 7.1 Market Growth Drivers
- 7.1.1 Demand-Side Drivers
- 7.1.2 Technology and Innovation Drivers
- 7.1.3 Infrastructure and Investment Drivers
- 7.1.4 Regulatory and Policy Drivers
- 7.2 Market Restraints
- 7.2.1 Cost and Affordability Constraints
- 7.2.2 Technology and Adoption Barriers
- 7.2.3 Supply Chain and Operational Constraints
- 7.3 Market Challenges
- 7.3.1 Competitive Pressure and Margin Erosion
- 7.3.2 Skills, Infrastructure and Implementation Gaps
- 7.4 Emerging Market Opportunities
- 7.5 Market Dynamics Impact and Time-Horizon Assessment
Chapter 8 Global Automatic Pool Cleaner Value Chain Analysis
- 8.1 Industry Value Chain Overview
- 8.2 Upstream Suppliers and Critical Inputs
- 8.3 Technology and Component Providers
- 8.4 Manufacturing or Service Delivery
- 8.5 Distribution, Channel Partners and Integrators
- 8.6 Downstream Applications and End Users
- 8.7 Value Addition and Profit Pools
- 8.8 Vertical Integration and Outsourcing
- 8.9 Supplier Concentration and Risk
- 8.10 Supply Chain Localization and Resilience
Chapter 9 Global Automatic Pool Cleaner Market Regulations and Policies
- 9.1 Relevant Laws, Standards and Compliance Frameworks
- 9.2 Product, Service, Safety and Quality Requirements
- 9.3 Government Policies, Incentives and Subsidies
- 9.4 Imports, Exports and Trade Barriers
- 9.5 Public Procurement and Local Content Requirements
- 9.6 Environmental and Sustainability Compliance
- 9.7 Upcoming Policy Changes and Market Implications
Chapter 10 Global Automatic Pool Cleaner Market Hotspots and Opportunities
- 10.1 Market Opportunity Mapping and Growth Hotspots
- 10.2 High-Growth Applications and Customer Groups
- 10.3 Underserved Markets and White-Space Opportunities
- 10.4 Emerging Technology and Product Opportunities
- 10.5 New Capacity and Investment Hotspots
- 10.6 Market Entry and Expansion Opportunities
- 10.7 Distribution and Partnership Opportunities
- 10.8 Near-Term and Long-Term Commercial Potential
- 10.9 Opportunity Attractiveness and Execution Risks
Chapter 11 Global Automatic Pool Cleaner Market Outlook, 2024-2032
- 11.1 Market Size and Analysis
- 11.1.1 Revenue (Market Measurement: 2024: USD 2,297.5 million → 2032: USD 5,011.52 million)
- 11.1.2 Market Volume and Quantity Sold
- 11.1.3 Historical Market Size
- 11.1.4 Base-Year Market Size, 2024
- 11.2 Market Forecast, 2024-2032
- 11.2.1 Revenue Forecast to 2032
- 11.2.2 Volume Forecast to 2032
- 11.2.3 CAGR and Year-on-Year Growth
- 11.2.4 Incremental Revenue Opportunity
- 11.3 Forecast Assumptions and Scenario Analysis
- 11.3.1 Base-Case Forecast
- 11.3.2 Optimistic and Conservative Scenarios
- 11.3.3 Technology, Pricing and Policy Sensitivities
- 11.4 Market Attractiveness and Growth Outlook
Chapter 12 Global Automatic Pool Cleaner Market Segmentation and Outlook
- 12.1 Segmentation Summary and Market Shares, 2024
- 12.2 Largest and Fastest-Growing Segments
- 12.3 By Type - Market Size and Forecast, 2024-2032
- 12.3.1 Segment Definition and Scope
- 12.3.2 Historical Market Size
- 12.3.3 Revenue Forecast, 2024-2032
- 12.3.4 Volume Forecast, 2024-2032
- 12.3.5 Base-Year Market Share, 2024
- 12.3.6 Segment CAGR and Growth Drivers
- 12.3.7 Subsegment Market Size and Forecast
- 12.3.7.1 Suction-Side Pool Cleaners
- 12.3.7.2 Pressure-Side Pool Cleaners
- 12.3.7.3 Robotic Pool Cleaners
- 12.3.8 Subsegment Pricing and Adoption Trends
- 12.3.9 Leading Suppliers and Competition
- 12.3.10 Regional Demand and Opportunities
- 12.4 By End Use - Market Size and Forecast, 2024-2032
- 12.4.1 Segment Definition and Scope
- 12.4.2 Historical Market Size
- 12.4.3 Revenue Forecast, 2024-2032
- 12.4.4 Volume Forecast, 2024-2032
- 12.4.5 Base-Year Market Share, 2024
- 12.4.6 Segment CAGR and Growth Drivers
- 12.4.7 Subsegment Market Size and Forecast
- 12.4.7.1 Residential
- 12.4.7.2 Commercial
- 12.4.8 Subsegment Pricing and Adoption Trends
- 12.4.9 Leading Suppliers and Competition
- 12.4.10 Regional Demand and Opportunities
- 12.5 By Pool Type - Market Size and Forecast, 2024-2032
- 12.5.1 Segment Definition and Scope
- 12.5.2 Historical Market Size
- 12.5.3 Revenue Forecast, 2024-2032
- 12.5.4 Volume Forecast, 2024-2032
- 12.5.5 Base-Year Market Share, 2024
- 12.5.6 Segment CAGR and Growth Drivers
- 12.5.7 Subsegment Market Size and Forecast
- 12.5.7.1 In-ground Pools
- 12.5.7.2 Above-ground Pools
- 12.5.8 Subsegment Pricing and Adoption Trends
- 12.5.9 Leading Suppliers and Competition
- 12.5.10 Regional Demand and Opportunities
- 12.6 By Cleaning Mechanism - Market Size and Forecast, 2024-2032
- 12.6.1 Segment Definition and Scope
- 12.6.2 Historical Market Size
- 12.6.3 Revenue Forecast, 2024-2032
- 12.6.4 Volume Forecast, 2024-2032
- 12.6.5 Base-Year Market Share, 2024
- 12.6.6 Segment CAGR and Growth Drivers
- 12.6.7 Subsegment Market Size and Forecast
- 12.6.7.1 Vacuum Cleaning
- 12.6.7.2 Brushing & Scrubbing
- 12.6.7.3 Hybrid Cleaning
- 12.6.8 Subsegment Pricing and Adoption Trends
- 12.6.9 Leading Suppliers and Competition
- 12.6.10 Regional Demand and Opportunities
- 12.7 Segment Growth Comparison
- 12.8 Segment Attractiveness and Priority Matrix
Chapter 13 Global Automatic Pool Cleaner End-Use and Application Market Outlook
- 13.1 End-Use Industry and Customer Demand Structure
- 13.2 Leading Applications and Customer Groups
- 13.3 End-Use Market Size, Share and Forecast
- 13.4 Major End-Use Industry Deep Dives
- 13.4.1 Customer Requirements and Use Cases
- 13.4.2 Demand and Replacement Cycles
- 13.4.3 Technical and Regulatory Considerations
- 13.4.4 Purchasing and Procurement Models
- 13.4.5 Leading Vendors and Distribution Channels
- 13.4.6 Forecast and Commercial Opportunities
- 13.5 Emerging Applications and Cross-Segment Demand
- 13.6 End-Use Industry Investment Priorities
Chapter 14 Global Automatic Pool Cleaner Geographic Market Outlook, 2024-2032
- 14.1 Regional Market Size and Share, 2024
- 14.2 Regional Market Forecast, 2024-2032
- 14.3 Regional Pricing, Production and Demand Differences
- 14.4 North America
- 14.4.1 United States
- 14.4.2 Canada
- 14.4.3 Mexico
- 14.5 Europe
- 14.5.1 Germany
- 14.5.2 France
- 14.5.3 Italy
- 14.5.4 United Kingdom
- 14.5.5 Spain
- 14.5.6 Poland
- 14.5.7 Russia
- 14.5.8 Netherlands
- 14.5.9 Belgium
- 14.5.10 Sweden
- 14.5.11 Denmark
- 14.5.12 Norway
- 14.5.13 Rest of Europe
- 14.6 Asia Pacific
- 14.6.1 China
- 14.6.2 India
- 14.6.3 Japan
- 14.6.4 South Korea
- 14.6.5 Thailand
- 14.6.6 Indonesia
- 14.6.7 Vietnam
- 14.6.8 Malaysia
- 14.6.9 Australia
- 14.6.10 Rest of Asia Pacific
- 14.7 Latin America
- 14.7.1 Brazil
- 14.7.2 Argentina
- 14.7.3 Colombia
- 14.7.4 Chile
- 14.7.5 Rest of Latin America
- 14.8 Middle East
- 14.8.1 Saudi Arabia
- 14.8.2 United Arab Emirates
- 14.8.3 Turkey
- 14.8.4 Israel
- 14.8.5 Iran
- 14.8.6 Rest of the Middle East
- 14.9 Africa
- 14.9.1 South Africa
- 14.9.2 Egypt
- 14.9.3 Nigeria
- 14.9.4 Morocco
- 14.9.5 Rest of Africa
- 14.10 Regional Investment, Policy and Supply Chain Differences
- 14.11 Regional Competitive Landscape
- 14.12 Geographic Growth Hotspots
Chapter 15 Global Automatic Pool Cleaner Technology, Innovation and Sustainability Outlook
- 15.1 Technology Landscape and Maturity
- 15.2 Product, Process and Service Innovation
- 15.3 AI, Automation and Digital Tools in the Industry
- 15.4 Technology Adoption and Performance Benchmarking
- 15.5 Innovation Pipeline and R&D Investment
- 15.6 Patent and Intellectual Property Trends
- 15.7 Energy Efficiency and Resource Management
- 15.8 Sustainability, Recycling and Circularity
- 15.9 Technology Roadmap, 2024-2032
- 15.10 Risks of Obsolescence and Technology Substitution
Chapter 16 Global Automatic Pool Cleaner Market Key Strategic Imperatives
- 16.1 Growth and Market Entry Priorities
- 16.2 High-Return Products and Segments
- 16.3 Pricing, Profitability and Cost Optimization
- 16.4 Technology Investment and Product Differentiation
- 16.5 Supply Chain Localization and Resilience
- 16.6 Distribution and Customer Acquisition
- 16.7 Partnership, Acquisition and Capacity Strategy
- 16.8 Regional Expansion Priorities
- 16.9 Short-, Medium- and Long-Term Actions
Chapter 17 Competition Outlook
- 17.1 Industry Competition Characteristics
- 17.2 Market Structure and Concentration
- 17.3 Market Share and Competitive Positioning, 2024
- 17.4 Company-Wise Revenue and Product Benchmarking
- 17.5 Production and Service Capacity Benchmarking
- 17.6 Technology, Pricing and Differentiation
- 17.7 Regional Footprint and Distribution Strength
- 17.8 Mergers, Acquisitions and Strategic Alliances
- 17.9 New Entrants and Competitive Threats
- 17.10 Porter's Five Forces and Industry Attractiveness
- 17.11 Competitive Outlook, 2024-2032
Chapter 18 Company Profiles
- 18.1 Company Coverage and Selection Criteria
- 18.2 Maytronics Ltd.
- 18.2.1 Business Description
- 18.2.2 Company Ownership and Geographic Presence
- 18.2.3 Product and Service Portfolio
- 18.2.4 Manufacturing and Operating Footprint
- 18.2.5 Production Capacity and Expansion Plans
- 18.2.6 Financial Performance and Investment
- 18.2.7 Market Share and Competitive Position
- 18.2.8 Technology and Innovation Capabilities
- 18.2.9 Strategic Alliances or Partnerships
- 18.2.10 Recent Developments
- 18.2.11 Growth Strategy and Outlook
- 18.3 Zodiac Pool Systems (Fluidra)
- 18.4 Hayward Industries, Inc.
- 18.5 Pentair plc
- 18.6 Waterco Ltd.
- 18.7 Kokido Development Ltd.
- 18.8 iRobot Corporation
- 18.9 Aquabot (Aqua Products)
- 18.10 Polaris (Fluidra)
- 18.11 Desjoyaux Pools
- 18.12 Other Relevant Market Participants
Note: Every listed company is profiled on the structure shown under the first company. The company list is preliminary and may change based on research findings, market developments, data availability and client requirements.
Chapter 19 Disclaimer
- 19.1 Research and Forecast Disclaimer
- 19.2 Data Source and Estimation Limitations
Note: The depth of individual sections depends on data availability for this market. Volume, capacity, trade and other unit-based metrics are included where applicable.

