
Ingredient-aware shoppers lift plant-based care sales
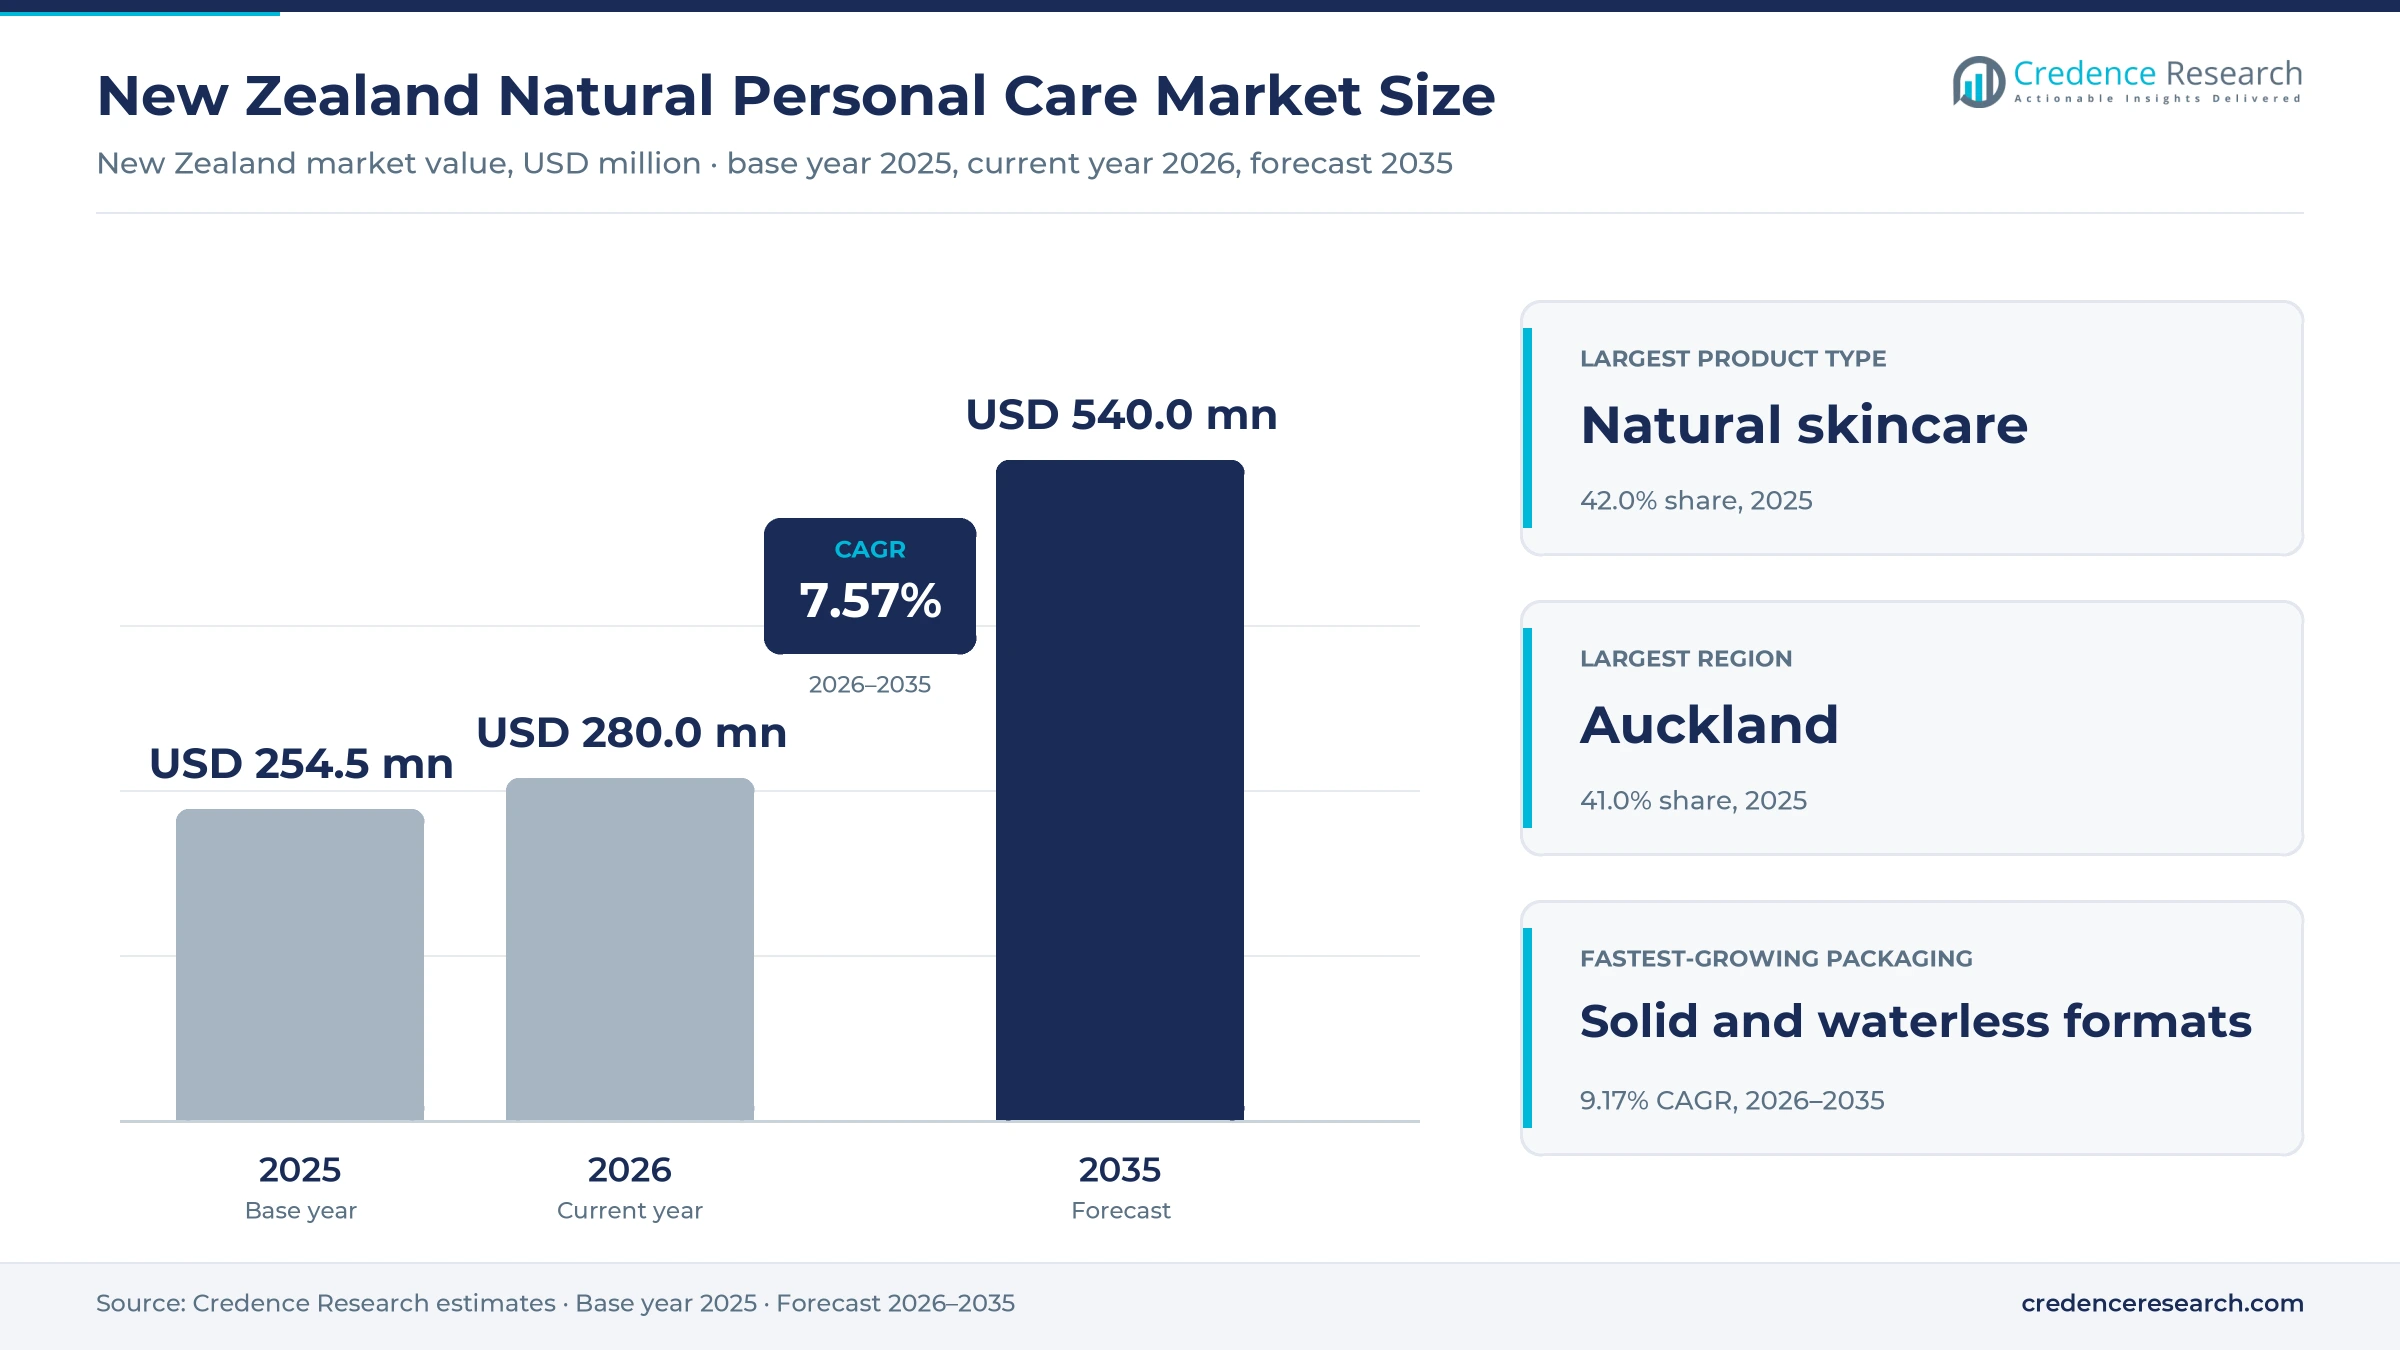
The New Zealand natural personal care market was valued at USD 254.5 million in 2025 and is projected to increase from USD 280.0 million in 2026 to USD 540.0 million by 2035, registering a CAGR of 7.57% during 2026–2035. Demand comes from shoppers who check ingredient lists and packaging, and who buy plant-based skincare, haircare, bath products, toothpaste and deodorants from supermarkets, pharmacies, specialty stores and brand websites. Auckland held the largest regional share, 41.0% in 2025, because the region holds about 1.82 million residents and the densest network of pharmacies and beauty stores. Canterbury is the fastest-growing region at 8.15% a year, as it posted the quickest population growth in the year to June 2025. In turn, the Environmental Protection Authority decided in January 2024 to ban PFAS chemicals in cosmetics, which pushes brands to prove that their formulas are free of persistent synthetic ingredients.
Which plant-based care products does the estimate cover?
The estimate measures retail sales in New Zealand of natural skincare, haircare, bath and body, oral care and deodorant products made mainly from plant, mineral or naturally derived ingredients. It covers mass, masstige, premium and prestige ranges sold through supermarkets, pharmacies, specialty stores, brand websites and online marketplaces.
The estimate excludes color cosmetics, fragrances, medicines, professional salon services and conventional personal care products that make no natural ingredient claim. The value chain runs from ingredient growers and formulators through local manufacturers and importers to retailers, websites and the households that buy each product.
New Zealand Natural Personal Care Market Insights
- The New Zealand natural personal care market was valued at USD 254.5 million in 2025 and is projected to reach USD 540.0 million by 2035, registering a CAGR of 7.57% during 2026–2035.
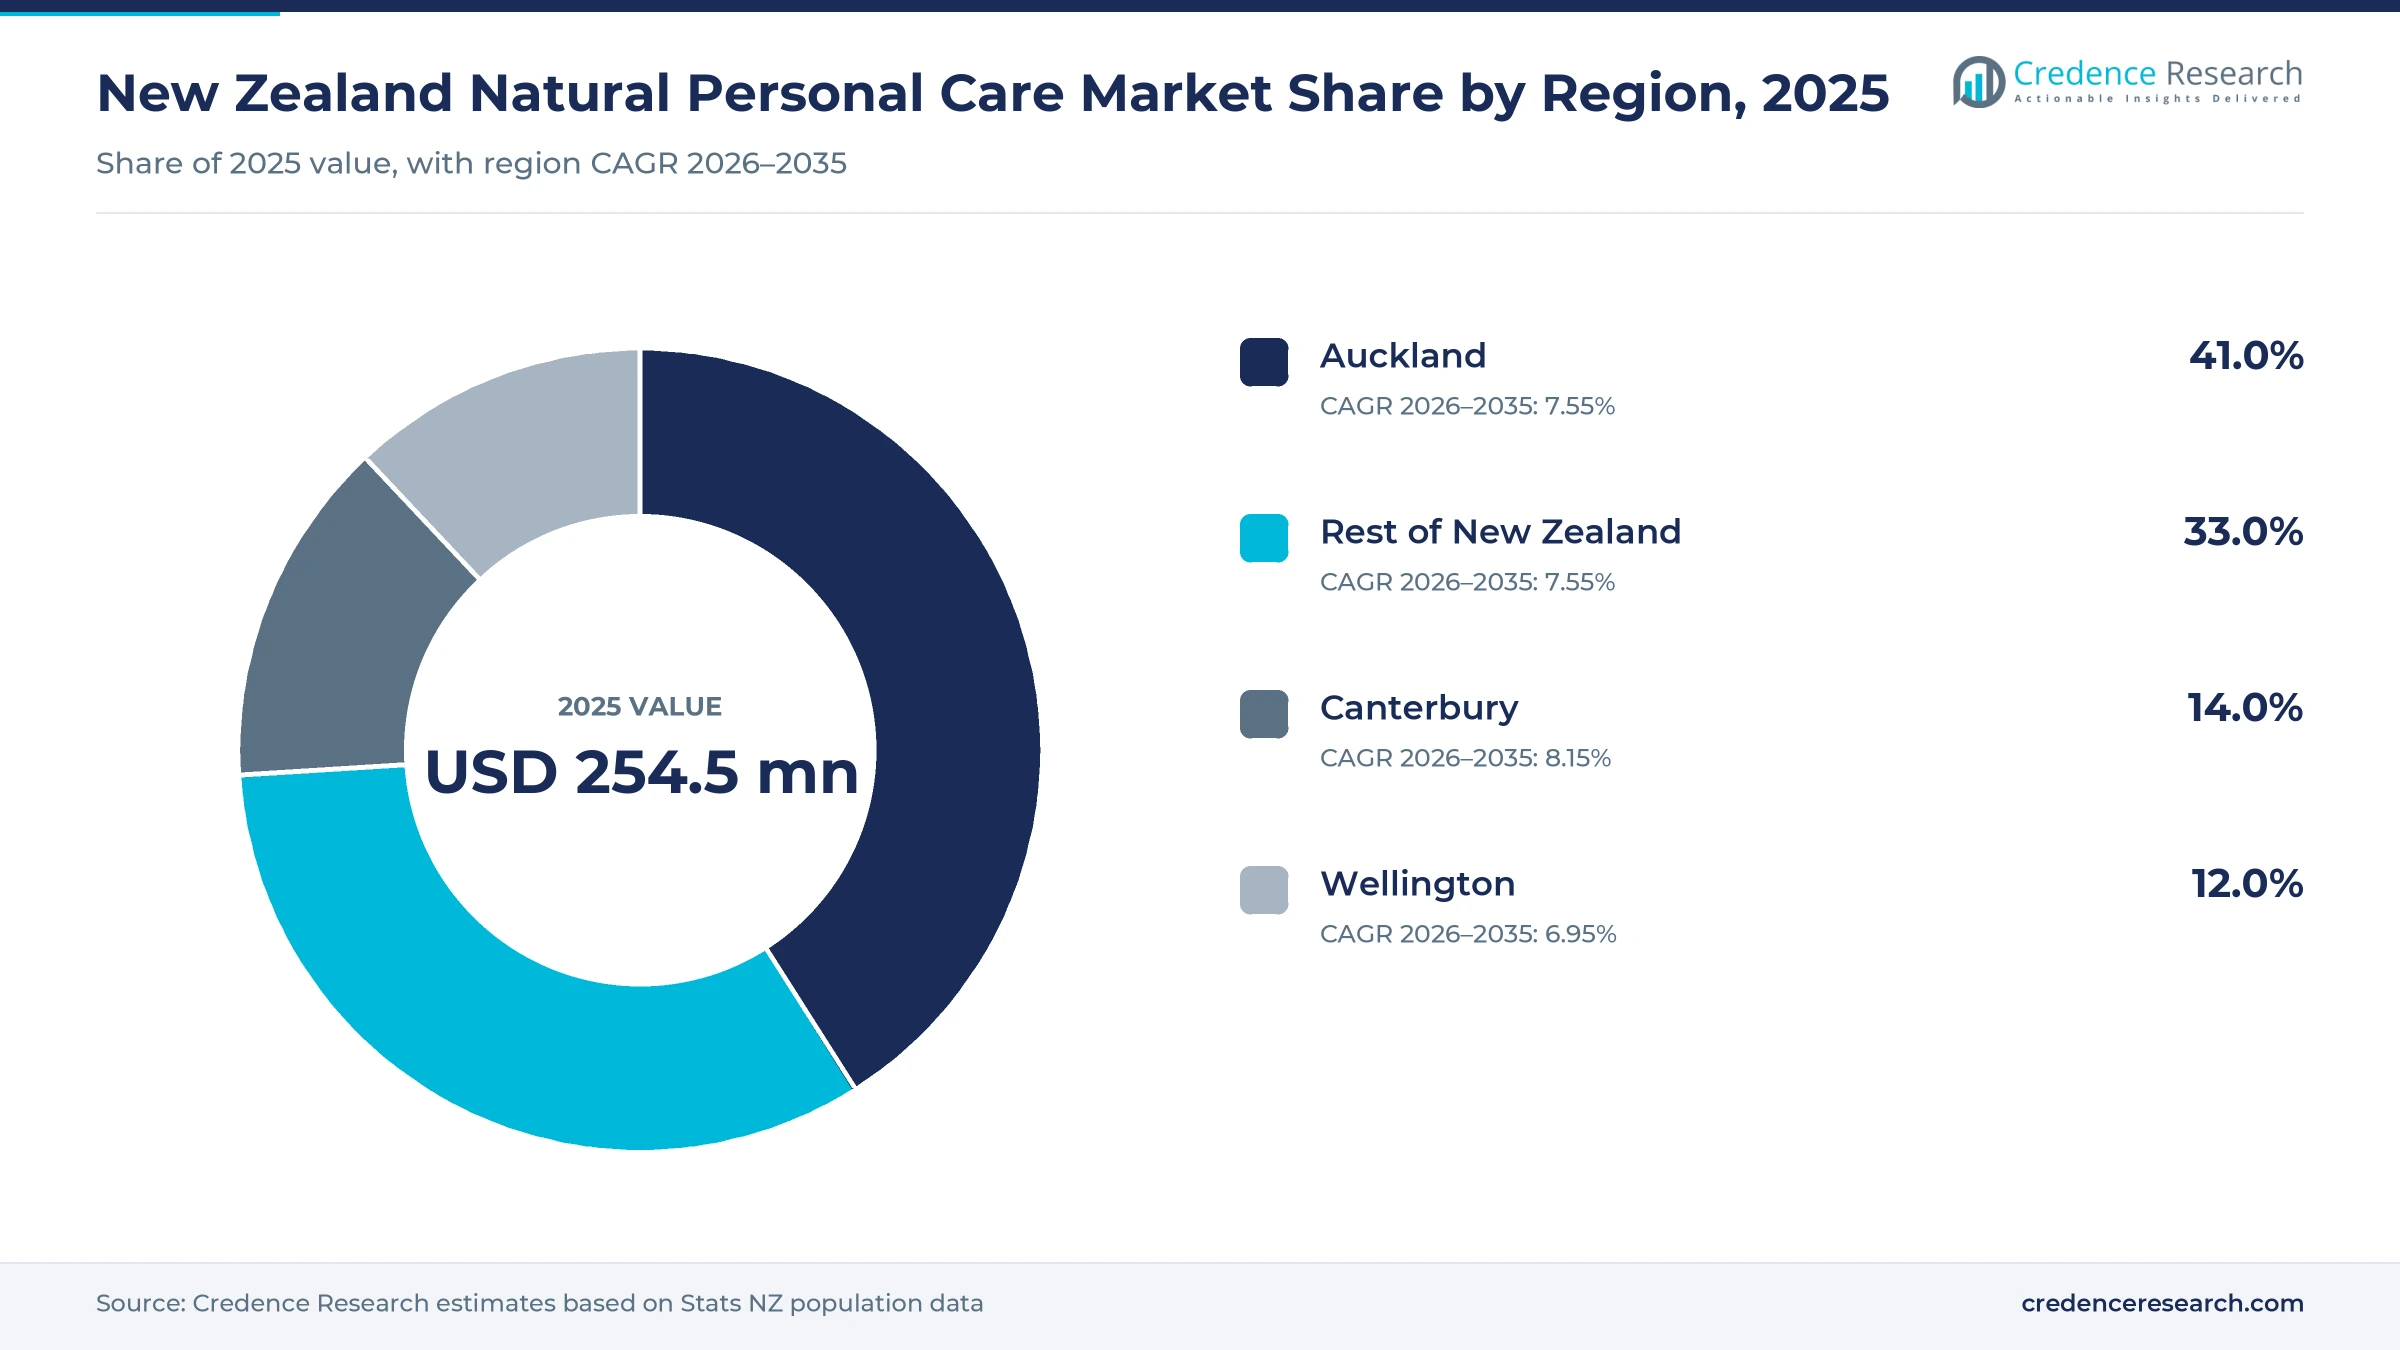
- Auckland held a 41.0% share of 2025 value, because the region holds about 1.82 million residents and the densest retail beauty network.
- Natural skincare led with a 42.0% share of 2025 value, because cleansers, oils and moisturizers are bought often and carry higher prices.
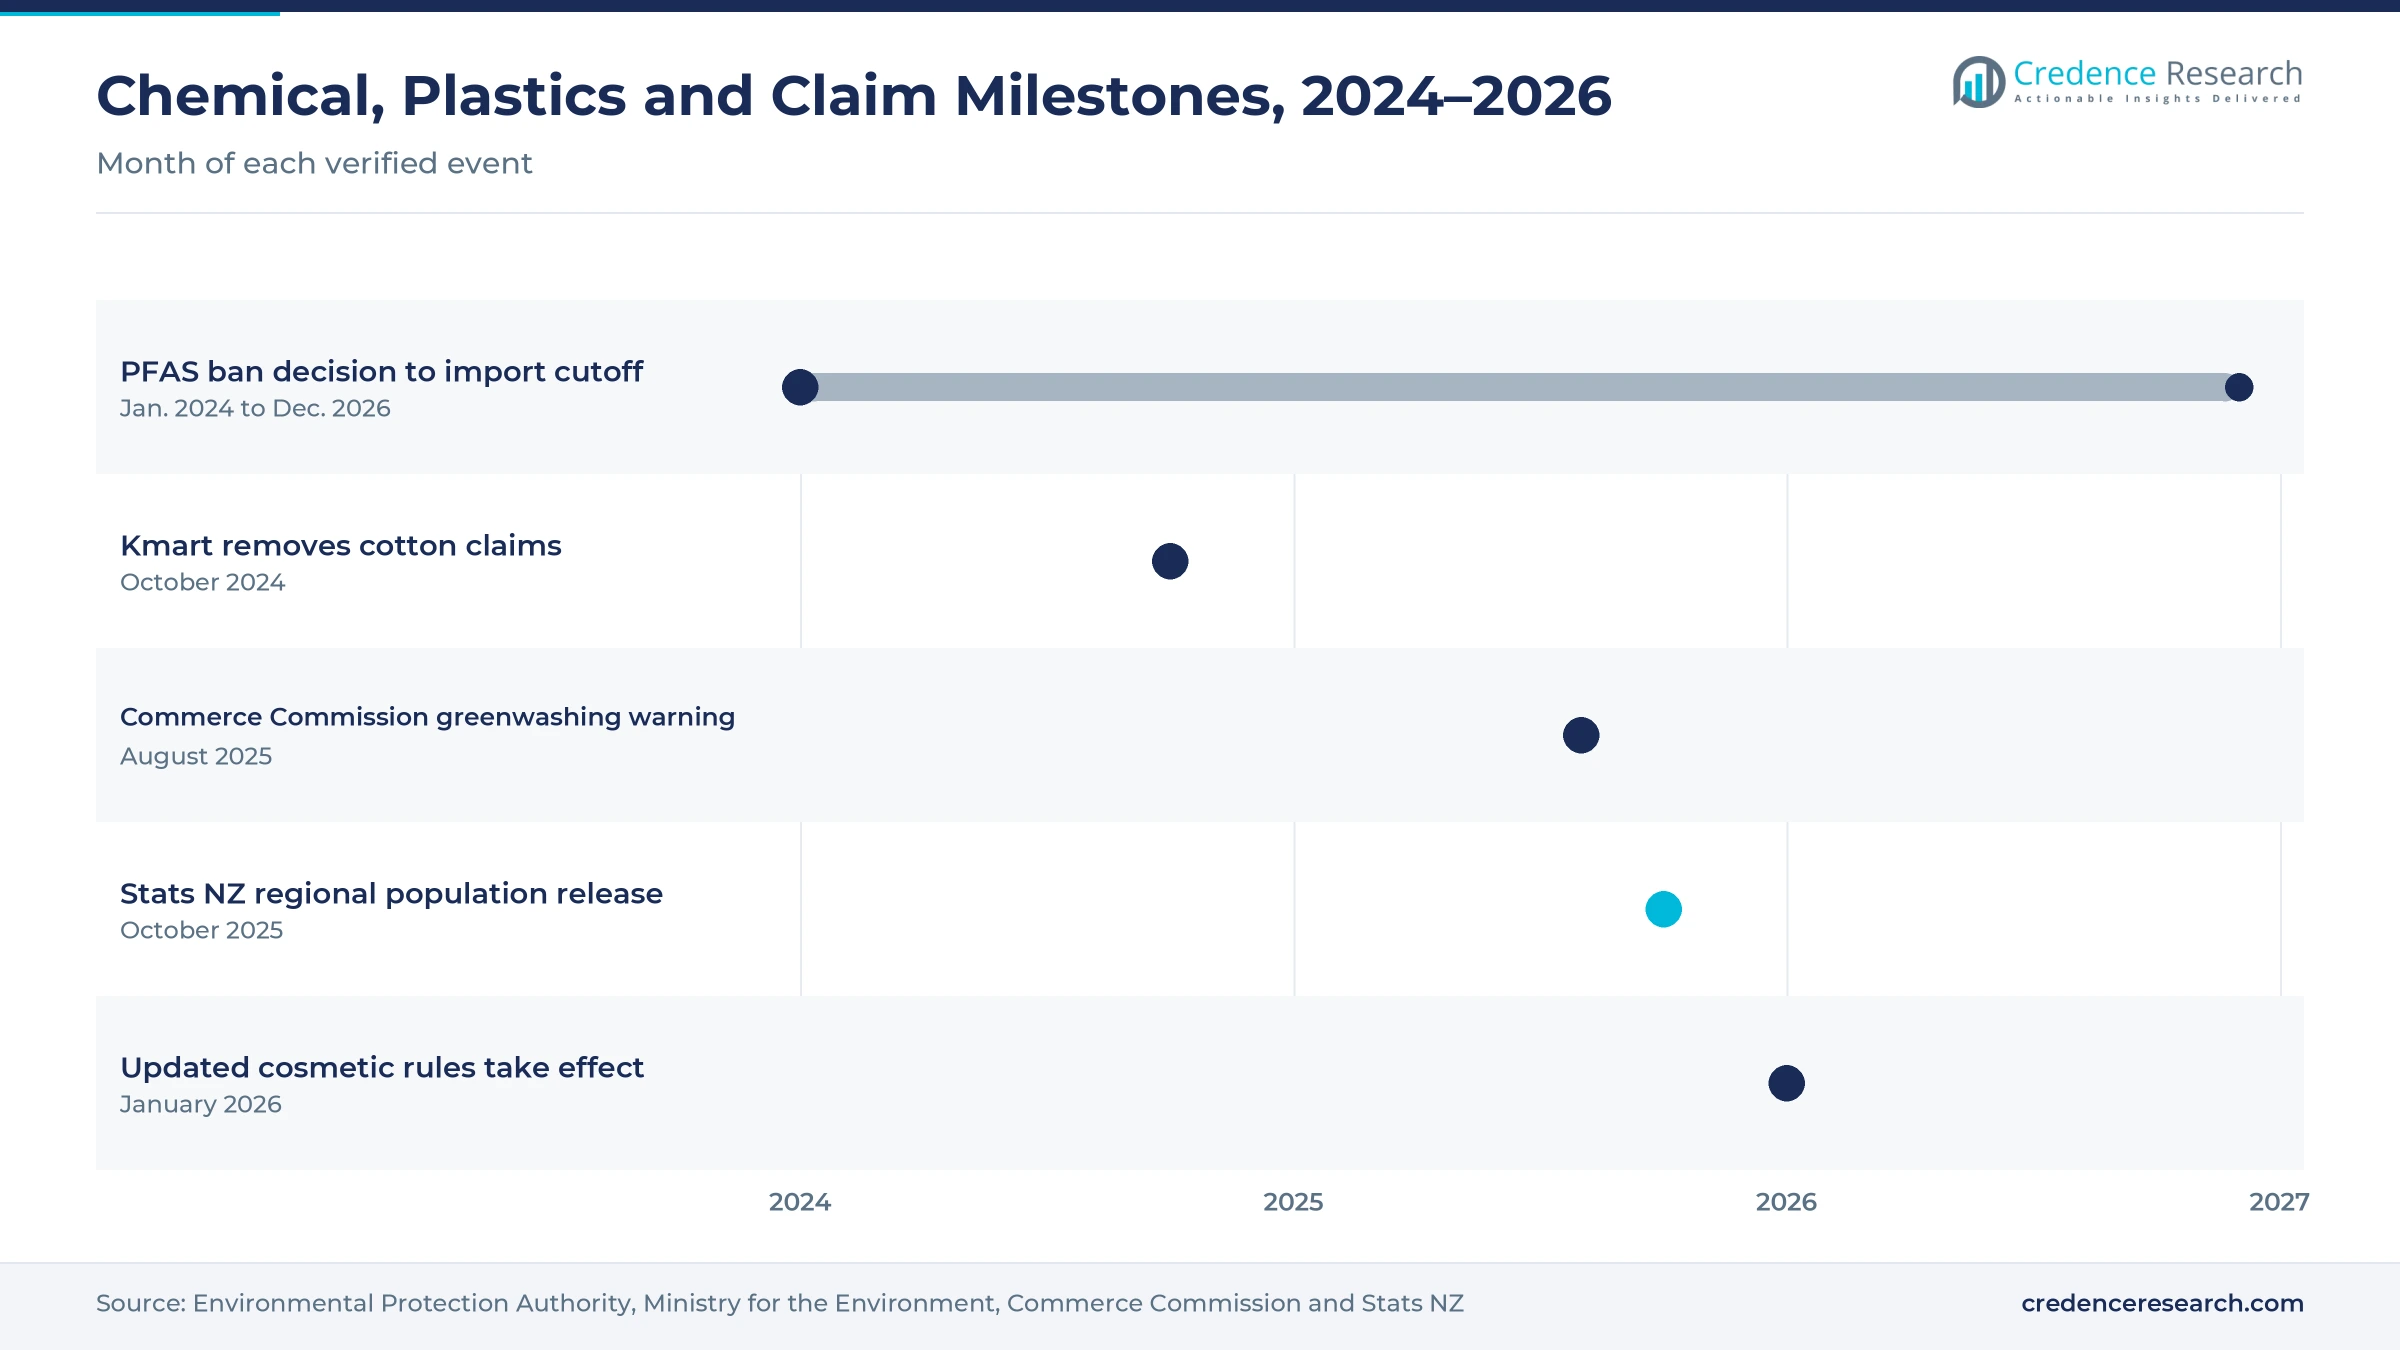
- The Environmental Protection Authority decided in January 2024 that cosmetics containing PFAS cannot be imported or made in New Zealand after Dec. 31, 2026.
- Solid and waterless formats grow fastest at 9.17% a year during 2026–2035, as shoppers replace plastic bottles with bars and concentrates.
Skincare leads while oral care and deodorants grow fastest
Why does natural skincare take the largest share?
Based on product type, the market is categorized into natural skincare, natural haircare, natural bath and body, and natural oral care and deodorants. Natural Skincare led with a 42.0% share of 2025 value, because face oils and moisturizers sell at higher prices. Natural Oral Care and Deodorants grow fastest at 8.65% a year, as shoppers switch toothpaste and deodorant to plant-based formulas.
How do mass and premium ranges split spending?
Based on price tier, the market is categorized into mass natural, masstige natural, premium natural and prestige natural ranges. Mass Natural led with a 34.0% share of 2025 value, because supermarket shoppers buy plant-based basics in large volumes. Premium Natural grows fastest at 8.09% a year, as certified botanical brands attract buyers who pay more for proven ingredients.
Where do shoppers buy plant-based care products?
Based on distribution channel, the market is categorized into supermarkets and hypermarkets, pharmacies and drugstores, specialty beauty and health stores, and direct-to-consumer and marketplaces. Supermarkets and Hypermarkets led with a 35.0% share of 2025 value, because weekly grocery trips include basic care items. Direct-to-Consumer and Marketplaces grow fastest at 9.00% a year, as brands sell refills online.
Which packaging formats are gaining ground?
Based on packaging format, the market is categorized into recyclable bottles and jars, refillable systems, solid and waterless formats, and compostable and paper-based packs. Recyclable Bottles and Jars led with a 58.0% share of 2025 value, because most liquids still ship in bottles. Solid and Waterless Formats grow fastest at 9.17% a year, as paper tubes change deodorant packaging.
| Segment Group | Leading Sub-segment | Share, 2025 | Fastest-growing Sub-segment | CAGR, 2026–2035 |
|---|---|---|---|---|
| By Product Type | Natural Skincare | 42.0% | Natural Oral Care and Deodorants | 8.65% |
| By Price Tier | Mass Natural | 34.0% | Premium Natural | 8.09% |
| By Distribution Channel | Supermarkets and Hypermarkets | 35.0% | Direct-to-Consumer and Marketplaces | 9.00% |
| By Packaging Format | Recyclable Bottles and Jars | 58.0% | Solid and Waterless Formats | 9.17% |
Request a Free Sample
Fill in your details and we'll send you a free sample report.
- Sample data tables & charts
- Research methodology
Clean labels, low-waste packs and online sales lift demand
How does preference for natural ingredients lift demand?
Consumer preference for natural ingredients lifts demand, because more shoppers now read labels and avoid persistent synthetic chemicals in products they use daily. The Environmental Protection Authority decided in January 2024 to ban PFAS in cosmetics, with import and manufacture ending on Dec. 31, 2026, according to 1News. Sale and supply must end by Dec. 31, 2027, and remaining stock must be disposed of by June 30, 2028. The authority received 20 submissions during its 2023 consultation, and 14 came from the cosmetics industry. Weleda has made plant-based medicines in Havelock North since 1955 from gardens farmed to biodynamic standards. As a result, natural skincare holds 42.0% of 2025 value.
Why do sustainable and low-waste formats expand sales?
Expansion of sustainable and low-waste formats widens sales, because shoppers and regulators both push brands to cut single-use plastic. The government phased out plastic-stemmed cotton buds and degradable plastics in late 2022 and extended bans to other PVC and polystyrene food packaging in mid-2025, according to the Ministry for the Environment. Ethique had kept about 6.5 million plastic bottles out of landfill by June 2020 and set a target of 50 million by 2025. Ecostore passed 100 refill stations in New Zealand in 2021 and more than 200 worldwide. In turn, solid and waterless formats grow at 9.17% a year during 2026–2035.
How do online sales and direct brand ties raise reach?
E-commerce and direct brand relationships raise reach, because small natural brands can sell refills, bundles and subscriptions without paying for shelf space. Online health and beauty spending grew 37% in the first quarter of 2022 from a year earlier, according to postal data reported by eCommerceNews. Spending at drug stores and pharmacies online rose 52% in the same quarter, which shows that care products moved online quickly. Shoppers spent over $2.2 billion online on physical goods in that quarter across nearly 17 million transactions. As a result, direct-to-consumer and marketplaces grow at 9.00% a year, as brands build loyalty through their own websites.
Why do high incomes and urban growth support premium ranges?
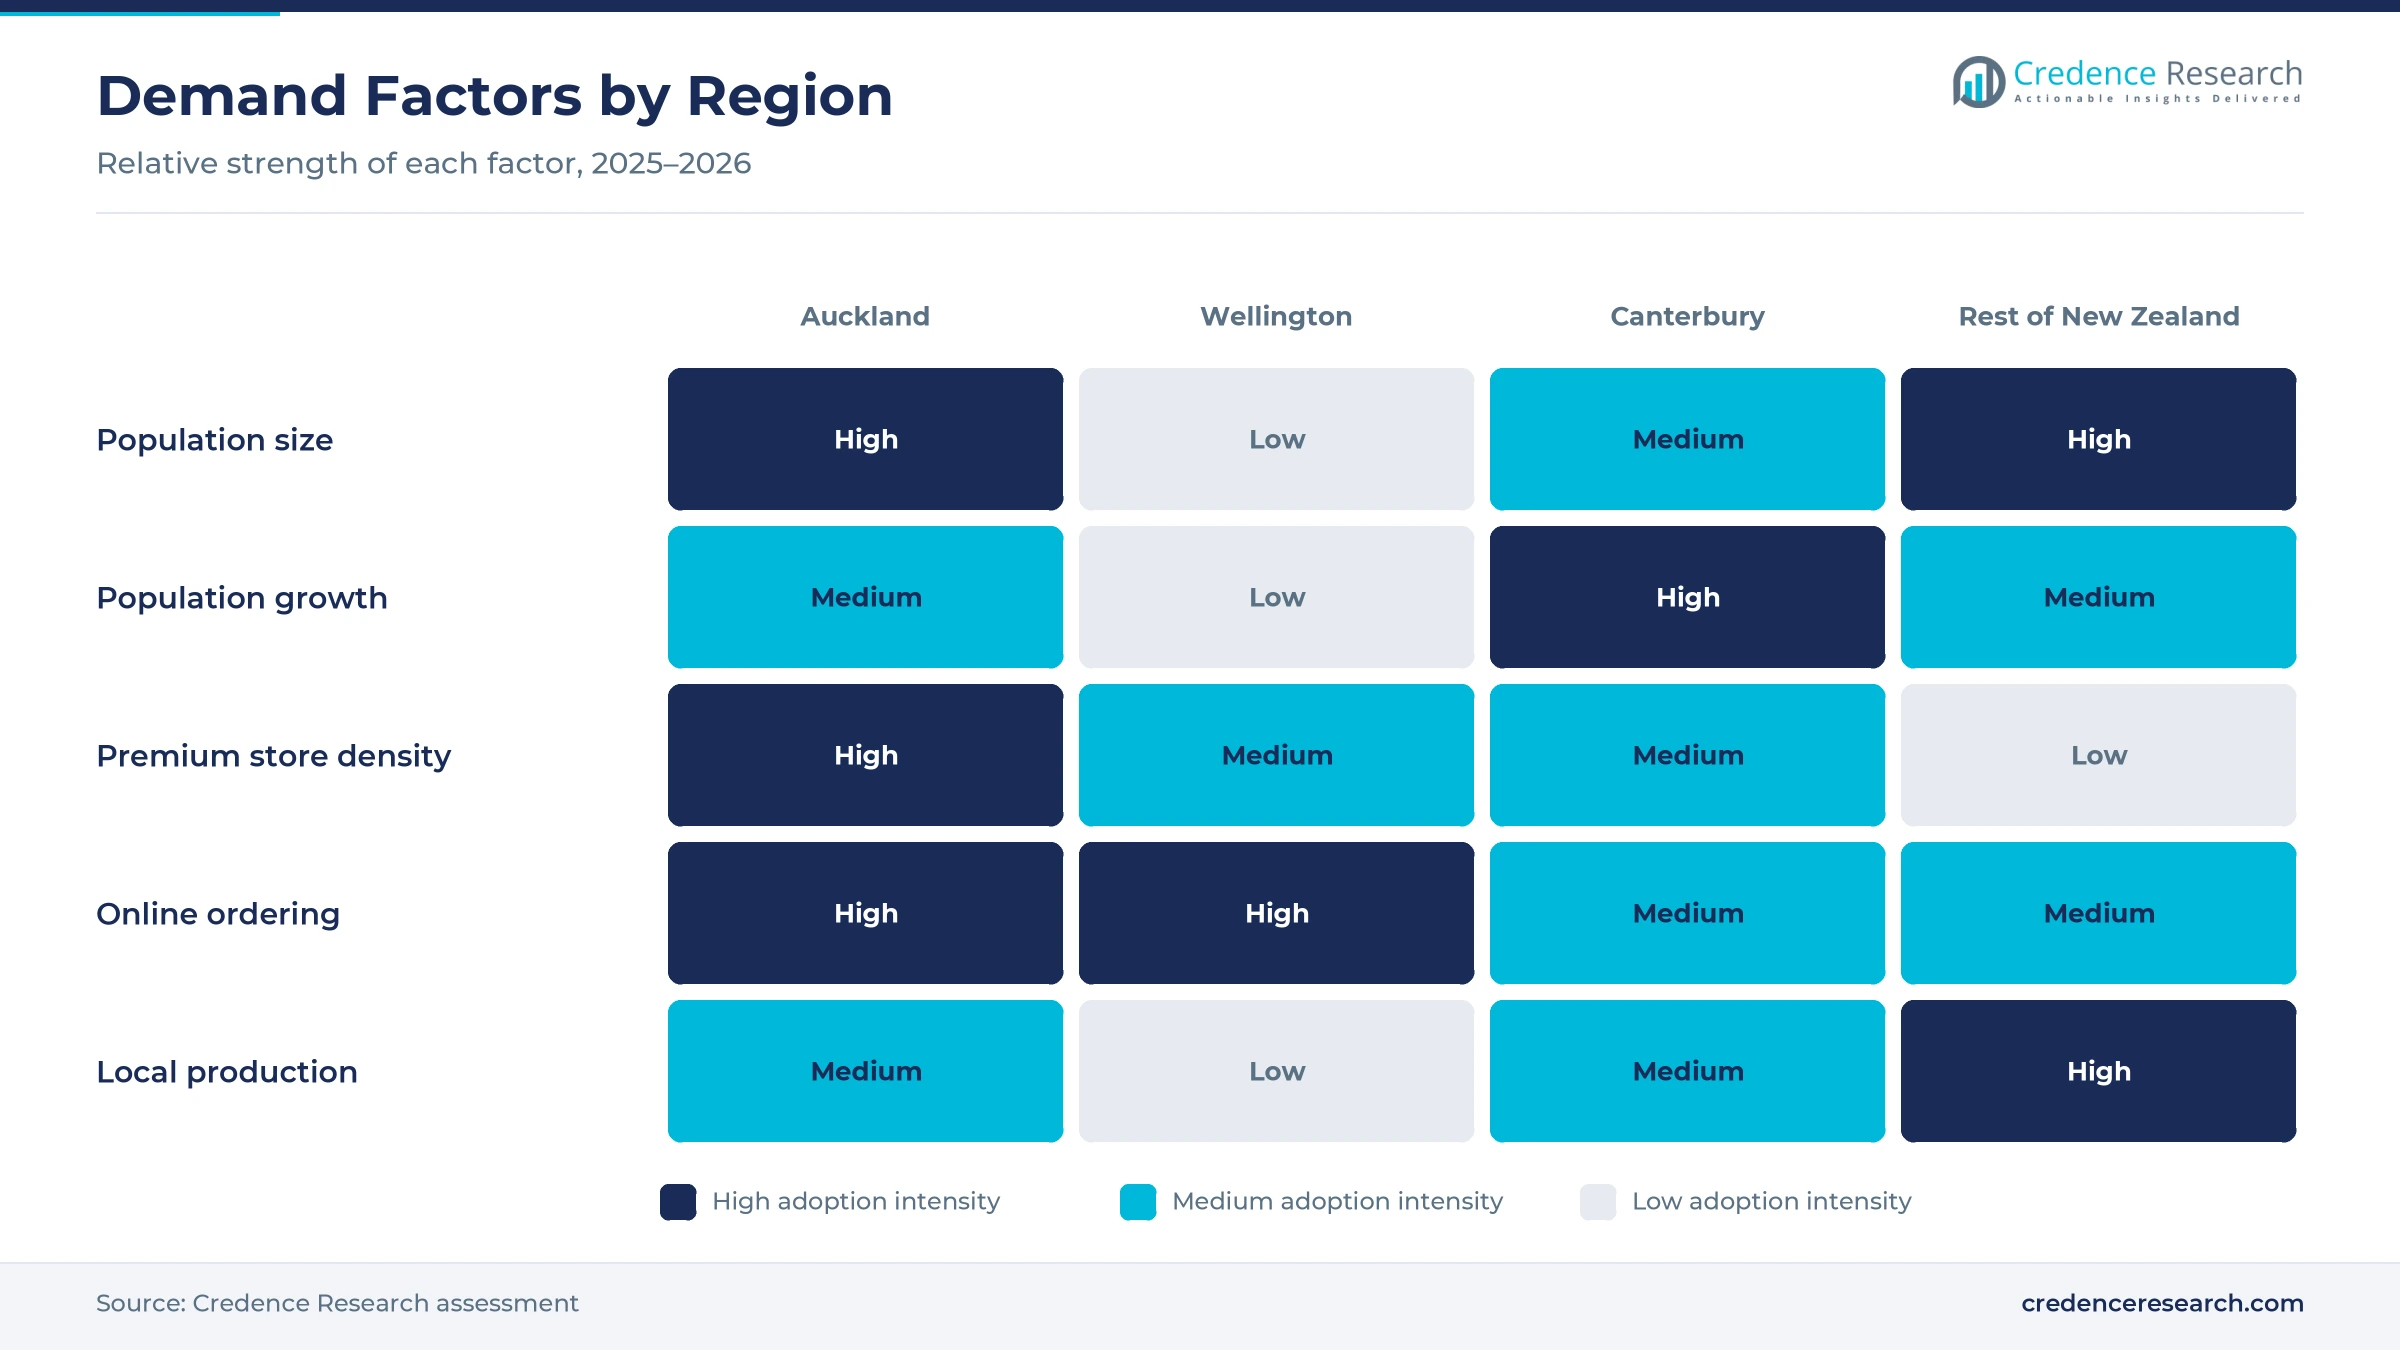
High incomes and urban population growth support premium ranges, because households with more spending power trade up to certified botanical products. Gross domestic product per person reached about USD 49,432 in 2024, according to the World Bank, and the population reached 5.29 million in the same year. Canterbury grew 1.1% in the year to June 2025, adding about 7,600 people, and was the fastest-growing region. Auckland grew 1.0% in the same period, while national growth slowed to 0.7% from 1.7% a year earlier. In turn, premium natural ranges grow at 8.09% a year, as city shoppers pay more for proven formulas.
Solid bars, proven claims and safer formulas reshape care
How is the rise of solid bars and refills changing ranges?
The rise of solid bars and refills is changing product ranges, because brands now design formulas that need no plastic bottle at all. Ethique relaunched its solid haircare at Target in 953 stores with 14 products and the message that one solid shampoo equals three liquid bottles. Ethique has been owned by Bansk Group since 2020, and the brand holds B Corp accreditation and carbon neutral certification. Ecostore runs refill stations in Japan, Korea, Hong Kong and Australia, with 45 stations in Japan alone. As a result, refillable systems and solid formats take a growing share of packaging, while recyclable bottles and jars still hold 58.0%.
Why is the shift to proven green claims significant?
The shift to proven green claims is significant, because regulators now warn retailers that sustainability statements must be backed by evidence. The Commerce Commission warned Kmart on Aug. 14, 2025, over claims of 100% sustainably sourced cotton, according to the Commerce Commission. Those claims ran from Aug. 4, 2023, until they were removed on Oct. 4, 2024, after the commission began its investigation. The commission joined 19 other consumer agencies in an open letter on environmental claims, and Fair Trading Act fines reach NZD 600,000 for companies. In turn, natural care brands invest in certification, ingredient disclosure and recyclability testing before making claims.
Can certified natural credentials open premium shelf space?
Certified natural credentials can open premium shelf space, because pharmacies and specialty stores favor brands that prove ingredient origin and ethics. Weleda has produced in New Zealand since 1955 and displays B Corp, Natrue and Union for Ethical BioTrade marks, and its plant gardens are farmed to certified biodynamic standards. Its Havelock North production site follows Good Manufacturing Practice and is licensed and audited by Medsafe. Ethique holds B Corp accreditation and carbon neutral certification, and it sold 52 products through Countdown and Farmers in 2020. These marks matter in Wellington, which holds 12.0% of 2025 value and has many high-income buyers. As a result, premium natural ranges gain buyers, even as mass natural lines keep 34.0% of 2025 value.
Is PFAS-free reformulation an opening for exporters?
PFAS-free reformulation offers an opening for exporters, because brands that comply early can sell the same clean formula at home and abroad. The PFAS ban forms part of an update to the Cosmetic Products Group Standard, which also brings non-hazardous products with hazardous ingredients under regulation. Trilogy launched in 1,080 Ulta Beauty stores in July 2018 with five products led by certified organic rosehip oil. Ethique made 85% of its sales outside New Zealand in 2020, mainly in the United States and Britain. Because PFAS products cannot be imported or made after Dec. 31, 2026, early reformulation also protects shelf space in local stores. In turn, local makers of organic beauty products gain export credibility.
Price, claim scrutiny and small scale weigh on brands
How do higher prices limit mass adoption?
Higher prices limit mass adoption, because certified botanical ingredients and small production runs cost more than synthetic inputs. As a result, many households buy natural products only for face care and keep cheaper conventional items for the bathroom. Brands respond with larger packs, refill pouches and lower-priced supermarket ranges. In turn, mass natural lines keep the largest share while premium ranges grow on quality and proven results.
Why does claim scrutiny raise compliance costs?
Claim scrutiny raises compliance costs, because every natural, recyclable or compostable statement must be backed by tests and supplier records. In turn, small brands spend more on certification, lab work and legal review before launches. Large retailers also ask for written proof before listing new natural products. As a result, brands with documented supply chains move faster, launch more often and win more shelf space in pharmacies.
How does small domestic scale affect costs?
Small domestic scale affects costs, because a population of about 5.29 million limits production volumes for local makers. As a result, packaging, ingredients and freight cost more per unit than in larger markets. Brands respond by exporting to Australia, Asia and North America to spread fixed costs across more units. In turn, export growth helps support local factories, research teams and ingredient growers across the country.
Why do reformulation deadlines strain smaller brands?
Reformulation deadlines strain smaller brands, because the PFAS ban requires ingredient checks across every product and supplier. In turn, companies must test raw materials, change formulas and relabel stock before Dec. 31, 2027. Smaller firms often lack the large technical teams needed for this work. As a result, contract formulators and ingredient suppliers gain demand for compliance support during the transition period.
Auckland leads while Canterbury grows fastest
| Region | Value, 2025 (USD million) | Share, 2025 | CAGR, 2026–2035 |
|---|---|---|---|
| Auckland | 104.3 | 41.0% | 7.55% |
| Rest of New Zealand | 84.0 | 33.0% | 7.55% |
| Canterbury | 35.6 | 14.0% | 8.15% |
| Wellington | 30.5 | 12.0% | 6.95% |
Why does Auckland hold the top share?
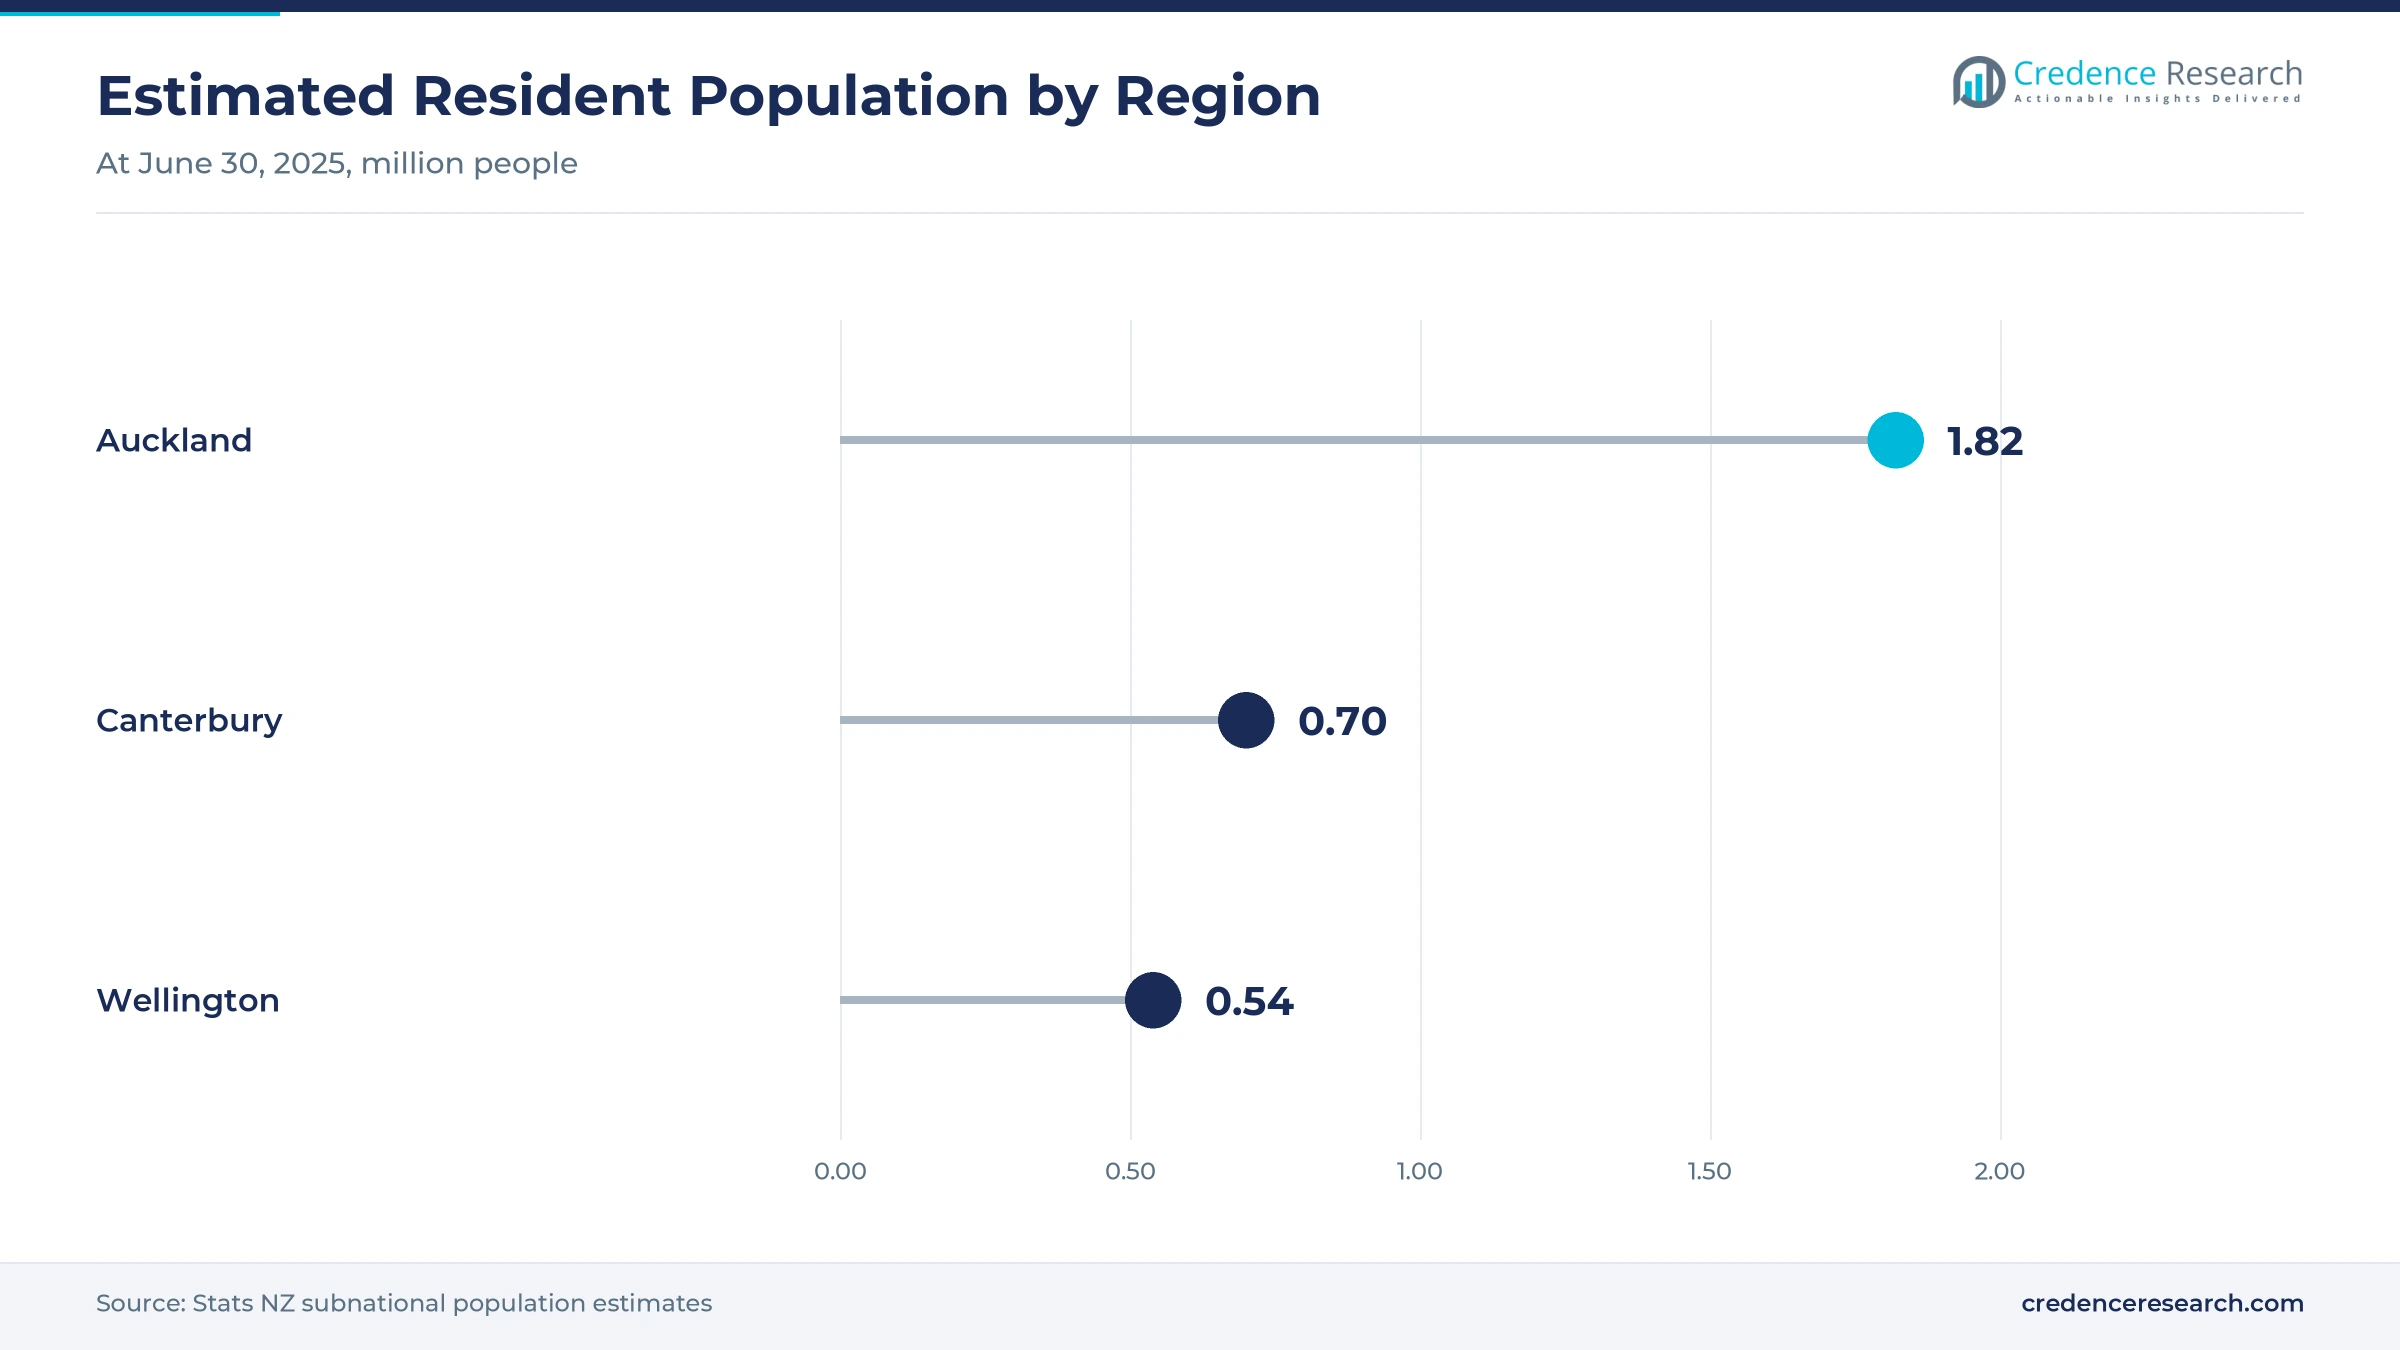
Auckland held a 41.0% share of 2025 value and grows at 7.55% a year, because the region held about 1.82 million residents at June 30, 2025, according to Stats NZ estimates. Its population grew 1.0% in the year to June 2025. The region also hosts the densest network of pharmacies, beauty stores and brand offices. As a result, Auckland remains the main market for premium launches and online deliveries.
How does the rest of the country add volume?
Rest of New Zealand held a 33.0% share of 2025 value and grows at 7.55% a year, because Waikato, Bay of Plenty, Otago, Hawke's Bay and other regions add large household demand. Weleda makes its products in Havelock North in Hawke's Bay, which keeps a major producer outside the main cities. Supermarkets and pharmacies carry natural ranges in most regional towns and cities. In turn, mass natural products sell strongly across these areas.
How fast is Canterbury growing?
Canterbury held a 14.0% share of 2025 value and grows fastest at 8.15% a year, because the region reached 698,200 residents at June 30, 2025, after growth of 1.1%. That rate made Canterbury the fastest-growing region in the year. Christchurch shoppers buy plant-based care through supermarkets, pharmacies and online stores. As a result, the region gains share over the forecast period.
Why does Wellington grow more slowly?
Wellington held a 12.0% share of 2025 value and grows at 6.95% a year, because its population of about 543,400 was flat in the year to June 2025. The region lost 1,700 people through net international migration in that year. However, high incomes and public-sector jobs support spending on premium products. In turn, Wellington stays a steady market for certified brands.
Chemical rules, plastics bans and claim warnings
| Development | Status and market relevance |
|---|---|
| In January 2024, the Environmental Protection Authority decided to ban PFAS in cosmetics, with import and manufacture ending on Dec. 31, 2026. | Forces ingredient checks across all brands |
| In August 2025, the Commerce Commission issued a greenwashing warning to Kmart and urged businesses to back up environmental claims. | Raises proof standards for natural brands |
| In October 2025, the Environmental Protection Authority extended the phase-out deadline for cosmetics containing more than 10% homosalate, a UV filter. | Gives sunscreen makers more time to reformulate |
| In October 2025, Stats NZ released population estimates showing Canterbury as the fastest-growing region at 1.1%. | Shifts retail growth toward the South Island |
| In January 2026, the updated Cosmetic Products Group Standard took effect, with ingredient schedules aligned with European rules and PFAS added to the prohibited list. | Requires importers and makers to comply now |
Plant extracts, solid bars and refills shape ranges
- Botanical extraction turns local and imported plant oils into stable actives, which helps brands replace synthetic ingredients in creams, oils and cleansers.
- Solid bar formulation removes most water from shampoos, conditioners and cleansers, which cuts packaging, freight weight and plastic use for every wash.
- Refill systems let shoppers fill durable containers in stores or buy concentrated pouches online, which reduces single-use bottles across the range.
- Ingredient testing screens raw materials for PFAS and other restricted chemicals, which helps brands meet the new cosmetic rules before the deadlines.
Need a Custom Version of This Report?
Tailor the scope, geography, or segments to your exact requirements.
- Custom geography or segment scope
- Direct access to our analyst team
Local botanical brands compete on proof and packaging
Competition is led by local botanical brands, international natural brands with New Zealand operations and supermarket ranges. Weleda competes from its Havelock North site with biodynamic gardens, Medsafe-licensed production and B Corp credentials. Ethique competes with solid haircare and skincare bars and a large export base. Ecostore competes with plant-based body and household products and a wide refill station network. Trilogy competes with rosehip oil skincare that has reached large overseas retailers. Rivals compete on ingredient proof, certification, packaging, price and retail reach. Because regulators and shoppers now check claims closely, brands with tested formulas and clear packaging data usually win more shelf space. Supermarket ranges add price competition, which pushes premium brands to explain the value of certified ingredients and refill formats more clearly.
Which brands lead plant-based care in New Zealand?
| Company | Type | Role in the market |
|---|---|---|
| Weleda New Zealand | Natural care and medicine maker | Produces in Havelock North since 1955 under Medsafe licensing |
| Ethique | Solid beauty brand | Owned by Bansk Group since 2020, with B Corp accreditation |
| ecostore | Plant-based body and home care brand | Runs more than 100 refill stations in New Zealand |
| Trilogy Natural Products | Botanical skincare brand | Known for certified organic rosehip oil sold in Ulta Beauty stores |
Credence Research view on plant-based care in New Zealand
Credence Research's view is that natural personal care in New Zealand will grow steadily because shoppers, retailers and regulators all push for safer ingredients and less plastic. Natural skincare remains the largest value pool, while oral care, deodorants, solid formats and online sales add the fastest growth. The PFAS ban and closer review of green claims will reward brands that test ingredients and document packaging. Exporters with certified credentials should gain the most, while price pressure and small domestic scale limit mass adoption.
How the national plant-based care estimate was built
The report uses 2025 as the base year on a calendar basis, and market values come from the Credence Research model. That model combines population and income statistics, retail and online spending data, regulatory decisions and company information. Regional shares, segment splits and growth rates are Credence Research estimates, because the client sheet gave regions without shares. Sources used are official statistics, regulator and ministry releases, news reports and company pages, and no interviews or surveys were used.
Low-waste formats and exports carry growth to 2035
The New Zealand natural personal care market is expected to reach USD 540.0 million by 2035, a 7.57% CAGR during 2026–2035, as shoppers move more of their daily care routine to plant-based and low-waste products. Growth should be strongest in oral care and deodorants, solid formats, online sales and Canterbury, because these areas gain most from new habits and population growth. Chemical and claim rules will favor tested brands, while higher prices and small scale could slow mass adoption.
Frequently Asked Questions
How big is the New Zealand natural personal care market?
Which product type leads natural personal care in New Zealand?
Which region leads the New Zealand market?
When does the PFAS ban in cosmetics take effect?
Which packaging format is growing fastest?
Which distribution channel is growing fastest?
Who are the leading companies in the New Zealand market?
What are the main challenges for natural care brands in New Zealand?
Table of Content
Chapter 1 Market Segmentation
- 1.1 Segmentation Framework
- 1.1.1 Product and Service Classification
- 1.1.2 Application and End-Use Classification
- 1.1.3 Technology and Solution Classification
- 1.1.4 Customer and Distribution Channel Classification
- 1.1.5 Geographic Segmentation
- 1.1.6 Market Segment Definitions and Boundaries
- 1.2 By Product Type
- 1.2.1 Natural Skincare
- 1.2.2 Natural Haircare
- 1.2.3 Natural Bath and Body
- 1.2.4 Natural Oral Care and Deodorants
- 1.3 By Price Tier
- 1.3.1 Mass Natural
- 1.3.2 Masstige Natural
- 1.3.3 Premium Natural
- 1.3.4 Prestige Natural
- 1.4 By Packaging Format
- 1.4.1 Recyclable Bottles and Jars
- 1.4.2 Refillable Systems
- 1.4.3 Solid and Waterless Formats
- 1.4.4 Compostable and Paper-based Packs
Chapter 2 Introduction
- 2.1 Report Objectives and Scope
- 2.2 Product Definition and Industry Terminology
- 2.3 Market Inclusions and Exclusions
- 2.4 Research Process
- 2.4.1 Primary Research and Expert Interviews
- 2.4.2 Secondary Research and Source Review
- 2.4.3 Top-Down and Bottom-Up Estimation
- 2.4.4 Data Triangulation and Verification
- 2.5 Market Size Measurement Basis
- 2.5.1 2025: USD 254.5 million → 2035: USD 540.0 million
- 2.6 Historical and Forecast Reference Periods
- 2.6.1 Historical Period: 2018-2025
- 2.6.2 Base Year: 2025
- 2.6.3 Forecast Period: 2025-2035
- 2.7 Research Assumptions and Limitations
Chapter 3 Executive Summary
- 3.1 Market Snapshot and Key Findings
- 3.2 Base-Year Market Size, 2025
- 3.3 Forecast Market Size, 2035
- 3.4 Revenue and Volume Growth Outlook
- 3.5 Key Demand and Supply Indicators
- 3.6 Leading Market Segments
- 3.7 Fastest-Growing Market Opportunities
- 3.8 Regional Performance Highlights
- 3.9 Technology and Industry Transformation
- 3.10 Competitive Landscape Summary
- 3.11 Analyst View and Strategic Implications
Chapter 4 New Zealand Natural Personal Care Market Trends and Developments
- 4.1 Historical Industry Development, 2018-2025
- 4.2 Recent Market Trends and Developments
- 4.3 Demand and Customer Behavior Trends
- 4.4 Technology and Product Innovation
- 4.5 Artificial Intelligence, Automation and Digitalization
- 4.6 Local Manufacturing and Supply Chain Realignment
- 4.7 Industry Partnerships, Mergers and Acquisitions
- 4.8 Sustainability and Circular Economy Developments
- 4.9 Government and Private Sector Investment Trends
- 4.10 Emerging Business Models and Commercialization
- 4.11 Industry Developments and Announcements
Chapter 5 New Zealand Natural Personal Care Market Production, Supply and Demand Analysis
- 5.1 Demand Trend and Consumption Analysis, 2018-2025
- 5.2 Demand Forecast, 2025-2035
- 5.3 Production and Output Trend, 2018-2025
- 5.4 Production and Output Forecast, 2025-2035
- 5.5 Installed Capacity and Capacity Utilization
- 5.6 Company-Wise Production Plants and Statistics
- 5.6.1 Installed Production Capacity
- 5.6.2 Actual Production
- 5.6.3 Planned Capacity and Expansion Targets
- 5.7 Supply Chain Structure and Procurement Trends
- 5.8 Supply-Demand Gap and Bottlenecks
- 5.9 Import Dependence and Sourcing Structure
- 5.10 Contract Manufacturing and Outsourcing
- 5.11 Regional Supply and Demand Concentration
Chapter 6 New Zealand Natural Personal Care Market Pricing Analysis
- 6.1 Pricing Structure and Measurement
- 6.2 Historical Pricing Trends, 2018-2025
- 6.3 Pricing Outlook, 2025-2035
- 6.4 Average Selling Price and Unit Economics
- 6.5 Pricing by Product and Market Segment
- 6.6 Geographic Pricing Differences
- 6.7 Key Input, Energy, Labor and Logistics Costs
- 6.8 Contract Pricing and Purchasing Models
- 6.9 Pricing Sensitivity and Competitive Positioning
- 6.10 Price, Margin and Profitability Implications
Chapter 7 New Zealand Natural Personal Care Market Dynamics
- 7.1 Market Growth Drivers
- 7.1.1 Demand-Side Drivers
- 7.1.2 Technology and Innovation Drivers
- 7.1.3 Infrastructure and Investment Drivers
- 7.1.4 Regulatory and Policy Drivers
- 7.2 Market Restraints
- 7.2.1 Cost and Affordability Constraints
- 7.2.2 Technology and Adoption Barriers
- 7.2.3 Supply Chain and Operational Constraints
- 7.3 Market Challenges
- 7.3.1 Competitive Pressure and Margin Erosion
- 7.3.2 Skills, Infrastructure and Implementation Gaps
- 7.4 Emerging Market Opportunities
- 7.5 Market Dynamics Impact and Time-Horizon Assessment
Chapter 8 New Zealand Natural Personal Care Value Chain Analysis
- 8.1 Industry Value Chain Overview
- 8.2 Upstream Suppliers and Critical Inputs
- 8.3 Technology and Component Providers
- 8.4 Manufacturing or Service Delivery
- 8.5 Distribution, Channel Partners and Integrators
- 8.6 Downstream Applications and End Users
- 8.7 Value Addition and Profit Pools
- 8.8 Vertical Integration and Outsourcing
- 8.9 Supplier Concentration and Risk
- 8.10 Supply Chain Localization and Resilience
Chapter 9 New Zealand Natural Personal Care Market Regulations and Policies
- 9.1 Relevant Laws, Standards and Compliance Frameworks
- 9.2 Product, Service, Safety and Quality Requirements
- 9.3 Government Policies, Incentives and Subsidies
- 9.4 Imports, Exports and Trade Barriers
- 9.5 Public Procurement and Local Content Requirements
- 9.6 Environmental and Sustainability Compliance
- 9.7 Upcoming Policy Changes and Market Implications
Chapter 10 New Zealand Natural Personal Care Market Hotspots and Opportunities
- 10.1 Market Opportunity Mapping and Growth Hotspots
- 10.2 High-Growth Applications and Customer Groups
- 10.3 Underserved Markets and White-Space Opportunities
- 10.4 Emerging Technology and Product Opportunities
- 10.5 New Capacity and Investment Hotspots
- 10.6 Market Entry and Expansion Opportunities
- 10.7 Distribution and Partnership Opportunities
- 10.8 Near-Term and Long-Term Commercial Potential
- 10.9 Opportunity Attractiveness and Execution Risks
Chapter 11 New Zealand Natural Personal Care Market Outlook, 2025-2035
- 11.1 Market Size and Analysis
- 11.1.1 Revenue (Market Measurement: 2025: USD 254.5 million → 2035: USD 540.0 million)
- 11.1.2 Market Volume and Quantity Sold
- 11.1.3 Historical Market Size, 2018-2025
- 11.1.4 Base-Year Market Size, 2025
- 11.2 Market Forecast, 2025-2035
- 11.2.1 Revenue Forecast to 2035
- 11.2.2 Volume Forecast to 2035
- 11.2.3 CAGR and Year-on-Year Growth
- 11.2.4 Incremental Revenue Opportunity
- 11.3 Forecast Assumptions and Scenario Analysis
- 11.3.1 Base-Case Forecast
- 11.3.2 Optimistic and Conservative Scenarios
- 11.3.3 Technology, Pricing and Policy Sensitivities
- 11.4 Market Attractiveness and Growth Outlook
Chapter 12 New Zealand Natural Personal Care Market Segmentation and Outlook
- 12.1 Segmentation Summary and Market Shares, 2025
- 12.2 Largest and Fastest-Growing Segments
- 12.3 By Product Type - Market Size and Forecast, 2025-2035
- 12.3.1 Segment Definition and Scope
- 12.3.2 Historical Market Size, 2018-2025
- 12.3.3 Revenue Forecast, 2025-2035
- 12.3.4 Volume Forecast, 2025-2035
- 12.3.5 Base-Year Market Share, 2025
- 12.3.6 Segment CAGR and Growth Drivers
- 12.3.7 Subsegment Market Size and Forecast
- 12.3.7.1 Natural Skincare
- 12.3.7.2 Natural Haircare
- 12.3.7.3 Natural Bath and Body
- 12.3.7.4 Natural Oral Care and Deodorants
- 12.3.8 Subsegment Pricing and Adoption Trends
- 12.3.9 Leading Suppliers and Competition
- 12.3.10 Regional Demand and Opportunities
- 12.4 By Price Tier - Market Size and Forecast, 2025-2035
- 12.4.1 Segment Definition and Scope
- 12.4.2 Historical Market Size, 2018-2025
- 12.4.3 Revenue Forecast, 2025-2035
- 12.4.4 Volume Forecast, 2025-2035
- 12.4.5 Base-Year Market Share, 2025
- 12.4.6 Segment CAGR and Growth Drivers
- 12.4.7 Subsegment Market Size and Forecast
- 12.4.7.1 Mass Natural
- 12.4.7.2 Masstige Natural
- 12.4.7.3 Premium Natural
- 12.4.7.4 Prestige Natural
- 12.4.8 Subsegment Pricing and Adoption Trends
- 12.4.9 Leading Suppliers and Competition
- 12.4.10 Regional Demand and Opportunities
- 12.5 By Packaging Format - Market Size and Forecast, 2025-2035
- 12.5.1 Segment Definition and Scope
- 12.5.2 Historical Market Size, 2018-2025
- 12.5.3 Revenue Forecast, 2025-2035
- 12.5.4 Volume Forecast, 2025-2035
- 12.5.5 Base-Year Market Share, 2025
- 12.5.6 Segment CAGR and Growth Drivers
- 12.5.7 Subsegment Market Size and Forecast
- 12.5.7.1 Recyclable Bottles and Jars
- 12.5.7.2 Refillable Systems
- 12.5.7.3 Solid and Waterless Formats
- 12.5.7.4 Compostable and Paper-based Packs
- 12.5.8 Subsegment Pricing and Adoption Trends
- 12.5.9 Leading Suppliers and Competition
- 12.5.10 Regional Demand and Opportunities
- 12.6 Segment Growth Comparison
- 12.7 Segment Attractiveness and Priority Matrix
Chapter 13 New Zealand Natural Personal Care Geographic Market Outlook, 2025-2035
- 13.1 Domestic Market Distribution and Demand Clusters
- 13.2 State- or Province-Wise Market Size and Forecast, 2025-2035
- 13.3 City and Metropolitan Market Outlook
- 13.4 Industrial, Manufacturing and Commercial Clusters
- 13.5 Geographic Concentration of Key End Users
- 13.6 Local Pricing and Purchasing Differences
- 13.7 Domestic Production Facilities and Capacity Map
- 13.8 Local Infrastructure and Project Pipeline
- 13.9 State-Level Policy and Incentive Differences
- 13.10 Subnational Investment Hotspots and Opportunities
- 13.11 Distribution and Logistics Networks
- 13.12 Domestic Competitive Footprint
Chapter 14 New Zealand Natural Personal Care Technology, Innovation and Sustainability Outlook
- 14.1 Technology Landscape and Maturity
- 14.2 Product, Process and Service Innovation
- 14.3 AI, Automation and Digital Tools in the Industry
- 14.4 Technology Adoption and Performance Benchmarking
- 14.5 Innovation Pipeline and R&D Investment
- 14.6 Patent and Intellectual Property Trends
- 14.7 Energy Efficiency and Resource Management
- 14.8 Sustainability, Recycling and Circularity
- 14.9 Technology Roadmap, 2025-2035
- 14.10 Risks of Obsolescence and Technology Substitution
Chapter 15 New Zealand Natural Personal Care Market Key Strategic Imperatives
- 15.1 Growth and Market Entry Priorities
- 15.2 High-Return Products and Segments
- 15.3 Pricing, Profitability and Cost Optimization
- 15.4 Technology Investment and Product Differentiation
- 15.5 Supply Chain Localization and Resilience
- 15.6 Distribution and Customer Acquisition
- 15.7 Partnership, Acquisition and Capacity Strategy
- 15.8 Regional Expansion Priorities
- 15.9 Short-, Medium- and Long-Term Actions
Chapter 16 Competition Outlook
- 16.1 Industry Competition Characteristics
- 16.2 Market Structure and Concentration
- 16.3 Market Share and Competitive Positioning, 2025
- 16.4 Company-Wise Revenue and Product Benchmarking
- 16.5 Production and Service Capacity Benchmarking
- 16.6 Technology, Pricing and Differentiation
- 16.7 Regional Footprint and Distribution Strength
- 16.8 Mergers, Acquisitions and Strategic Alliances
- 16.9 New Entrants and Competitive Threats
- 16.10 Porter's Five Forces and Industry Attractiveness
- 16.11 Competitive Outlook, 2025-2035
Chapter 17 Company Profiles
- 17.1 Company Coverage and Selection Criteria
- 17.2 Trilogy Natural Products
- 17.2.1 Business Description
- 17.2.2 Company Ownership and Geographic Presence
- 17.2.3 Product and Service Portfolio
- 17.2.4 Manufacturing and Operating Footprint
- 17.2.5 Production Capacity and Expansion Plans
- 17.2.6 Financial Performance and Investment
- 17.2.7 Market Share and Competitive Position
- 17.2.8 Technology and Innovation Capabilities
- 17.2.9 Strategic Alliances or Partnerships
- 17.2.10 Recent Developments
- 17.2.11 Growth Strategy and Outlook
- 17.3 Antipodes
- 17.4 ecostore
- 17.5 Living Nature
- 17.6 Weleda New Zealand
- 17.7 Ethique
- 17.8 The Herb Farm
- 17.9 Essano
- 17.10 Aotea
- 17.11 Linden Leaves
- 17.12 Other Relevant Market Participants
Note: Every listed company is profiled on the structure shown under the first company. The company list is preliminary and may change based on research findings, market developments, data availability and client requirements.
Chapter 18 Disclaimer
- 18.1 Research and Forecast Disclaimer
- 18.2 Data Source and Estimation Limitations
Note: The depth of individual sections depends on data availability for this market. Volume, capacity, trade and other unit-based metrics are included where applicable.

