
Phones, marketplaces and retailer apps move wardrobes online
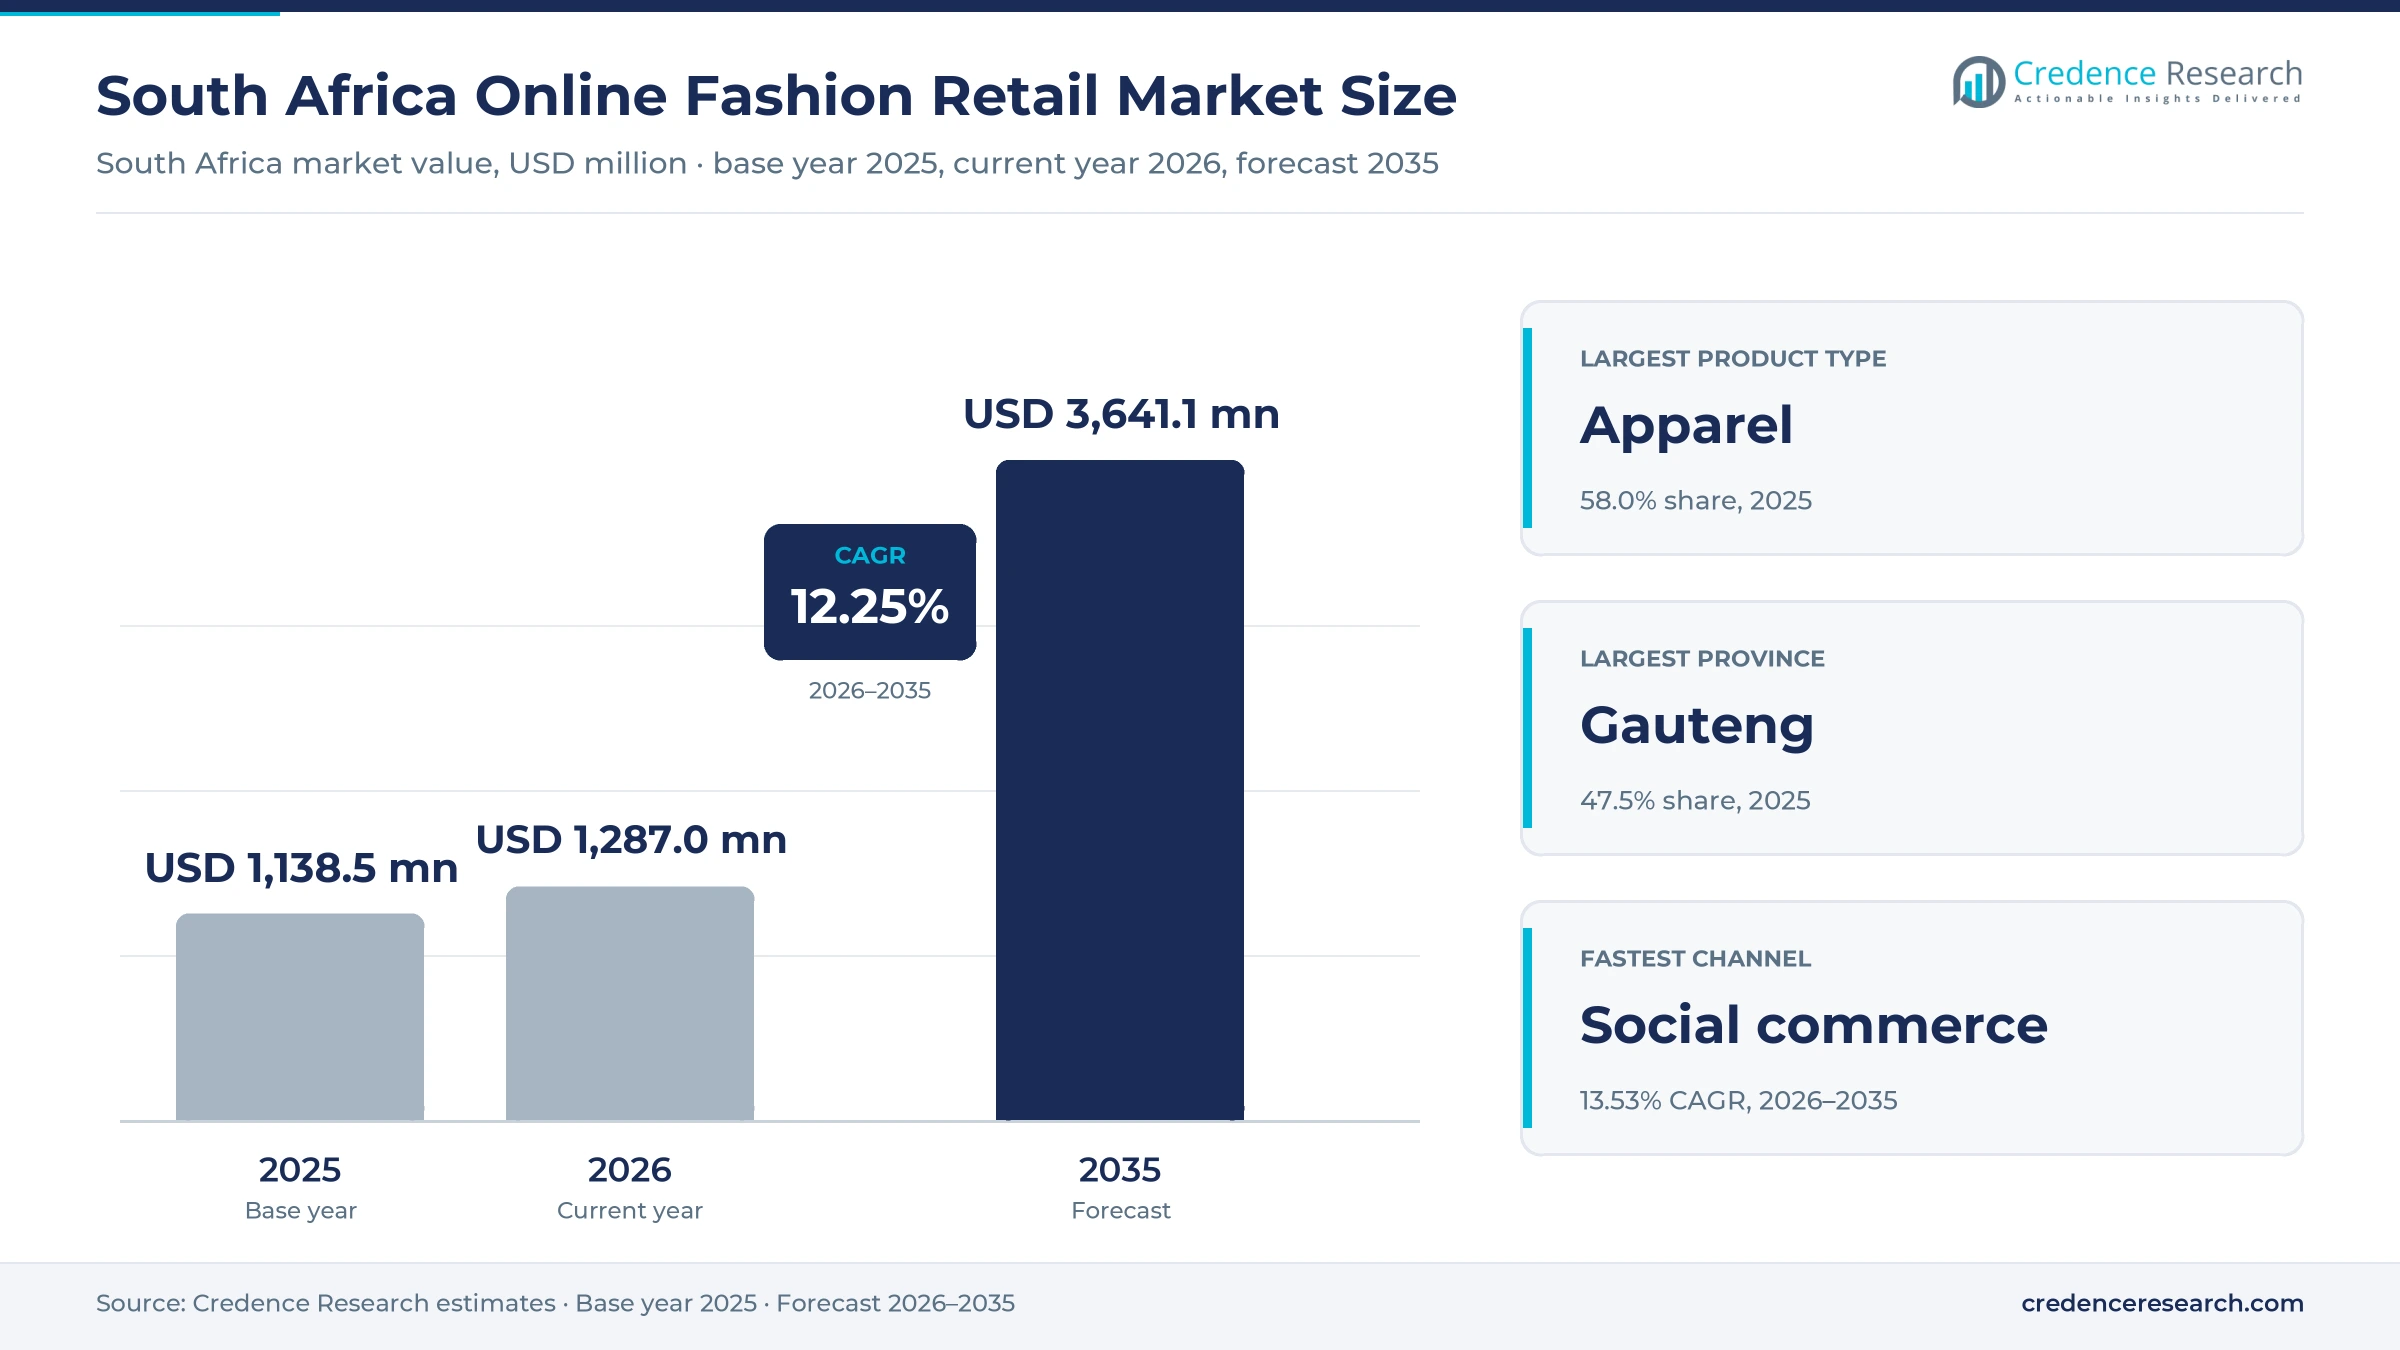
The South Africa online fashion retail market was valued at USD 1.14 billion in 2025 and is projected to increase from USD 1.29 billion in 2026 to USD 3.64 billion by 2035, registering a CAGR of 12.25% during 2026–2035. Demand comes from shoppers who buy clothing, shoes, bags and accessories through marketplaces, retailer apps, brand websites and social channels, and who increasingly compare local and imported ranges on their phones. Gauteng held the largest provincial share, 47.5% in 2025, because Johannesburg and Pretoria combine the densest pool of salaried shoppers with the fastest courier coverage. The Eastern Cape and the rest of South Africa grow fastest at 13.02% a year, as pickup points and next-day delivery reach smaller towns. In turn, SARS began charging VAT on top of the flat duty for low-value imported parcels on Sept. 1, 2024, which narrowed the cost gap between cross-border apps and local fashion retail chains.
Which online fashion purchases does the estimate cover?
The estimate measures the value of apparel, footwear, bags, accessories, jewelry and watches that South African consumers buy online, including orders placed on marketplaces, retailer apps, brand websites and social commerce channels. It counts the value paid by shoppers for goods delivered to homes, lockers or pickup points, net of returns, across value, mid-market, premium and luxury price tiers.
The estimate excludes in-store clothing sales, secondhand resale between consumers, uniforms bought by employers and textile wholesale trade. The value chain runs from local and imported manufacturers through retailers and marketplaces, then warehouses, couriers and pickup networks, to shoppers who pay by card, instant payment, account credit or cash at collection.
South Africa Online Fashion Retail Market Insights
- The South Africa online fashion retail market was valued at USD 1.14 billion in 2025 and is projected to reach USD 3.64 billion by 2035, registering a CAGR of 12.25% during 2026–2035.
- Gauteng held a 47.5% share of 2025 value, because Johannesburg and Pretoria hold the largest base of salaried online clothing shoppers.
- Apparel led with a 58.0% share of 2025 value, because tops, dresses, denim and basics are bought most often and replaced fastest.
- TFG Africa online sales grew 43.5% in the year to March 2025, lifting the online share of its sales to 5.8% from 4.2%.
- Social commerce grows fastest at 13.53% a year during 2026–2035, as shoppers discover clothing through short videos and creator posts.
Apparel leads while social selling grows fastest
Why does apparel hold the most online value?
Based on product type, the market is categorized into apparel, footwear, bags and accessories, and jewellery and watches. Apparel led with a 58.0% share of 2025 value, because shoppers replace tops, dresses, denim and basics often and size charts now reduce fit risk. Bags & Accessories grow fastest at 12.96% a year, as low-priced imported accessories are easy to ship and rarely returned.
How do price tiers split online wardrobes?
Based on price tier, the market is categorized into value, mid-market, premium and luxury. Value led with a 42.0% share of 2025 value and also grows fastest at 12.73% a year, because cross-border apps and local discount chains compete hard on entry prices. In turn, mid-market and premium ranges rely on retailer apps that offer credit accounts, quality assurance and easy store returns.
Which channels carry the most fashion orders?
Based on distribution channel, the market is categorized into pure-play marketplaces, brand-owned websites and apps, omnichannel retailer platforms and social commerce. Pure-Play Marketplaces led with a 44.0% share of 2025 value, because Takealot, SHEIN, Temu and Amazon offer very wide ranges. Social Commerce grows fastest at 13.53% a year, as creators and small labels sell directly through video posts.
Who buys the most clothing online?
Based on customer type, the market is categorized into women, men, kids and teens, and gender-neutral buyers. Women led with a 55.0% share of 2025 value, because women buy across women's apparel, footwear and accessories and respond strongly to app promotions. Gender-Neutral Buyers grow fastest at 13.23% a year, as relaxed fits, sneakers and unisex basics gain space in online ranges.
| Segment Group | Leading Sub-segment | Share, 2025 | Fastest-growing Sub-segment | CAGR, 2026–2035 |
|---|---|---|---|---|
| By Product Type | Apparel | 58.0% | Bags & Accessories | 12.96% |
| By Price Tier | Value | 42.0% | Value | 12.73% |
| By Distribution Channel | Pure-Play Marketplaces | 44.0% | Social Commerce | 13.53% |
| By Customer Type | Women | 55.0% | Gender-Neutral Buyers | 13.23% |
Request a Free Sample
Fill in your details and we'll send you a free sample report.
- Sample data tables & charts
- Research methodology
Retailer apps, mobile access and marketplaces lift orders
How is the structural shift online widening demand?
The structural expansion of online retail is widening fashion demand, because large clothing chains now push their full ranges through apps and websites. TFG Africa online sales grew 43.5% in the year to March 2025, lifting the online share of its sales to 5.8% from 4.2%, according to TFG results. Woolworths online fashion, beauty and home sales rose 22.8% in the year to June 2025, reaching 6.6% of that division, according to Woolworths Holdings. Truworths Africa online sales grew 21.5% in the 52 weeks to June 2026, reaching 8.1% of segment retail sales. Stats SA also reported 12.5% annual growth for clothing, footwear and textile retailers in May 2025. As a result, omnichannel retailer platforms hold a growing slice of national fashion retail spending.
Why does mobile-first access lift online clothing orders?
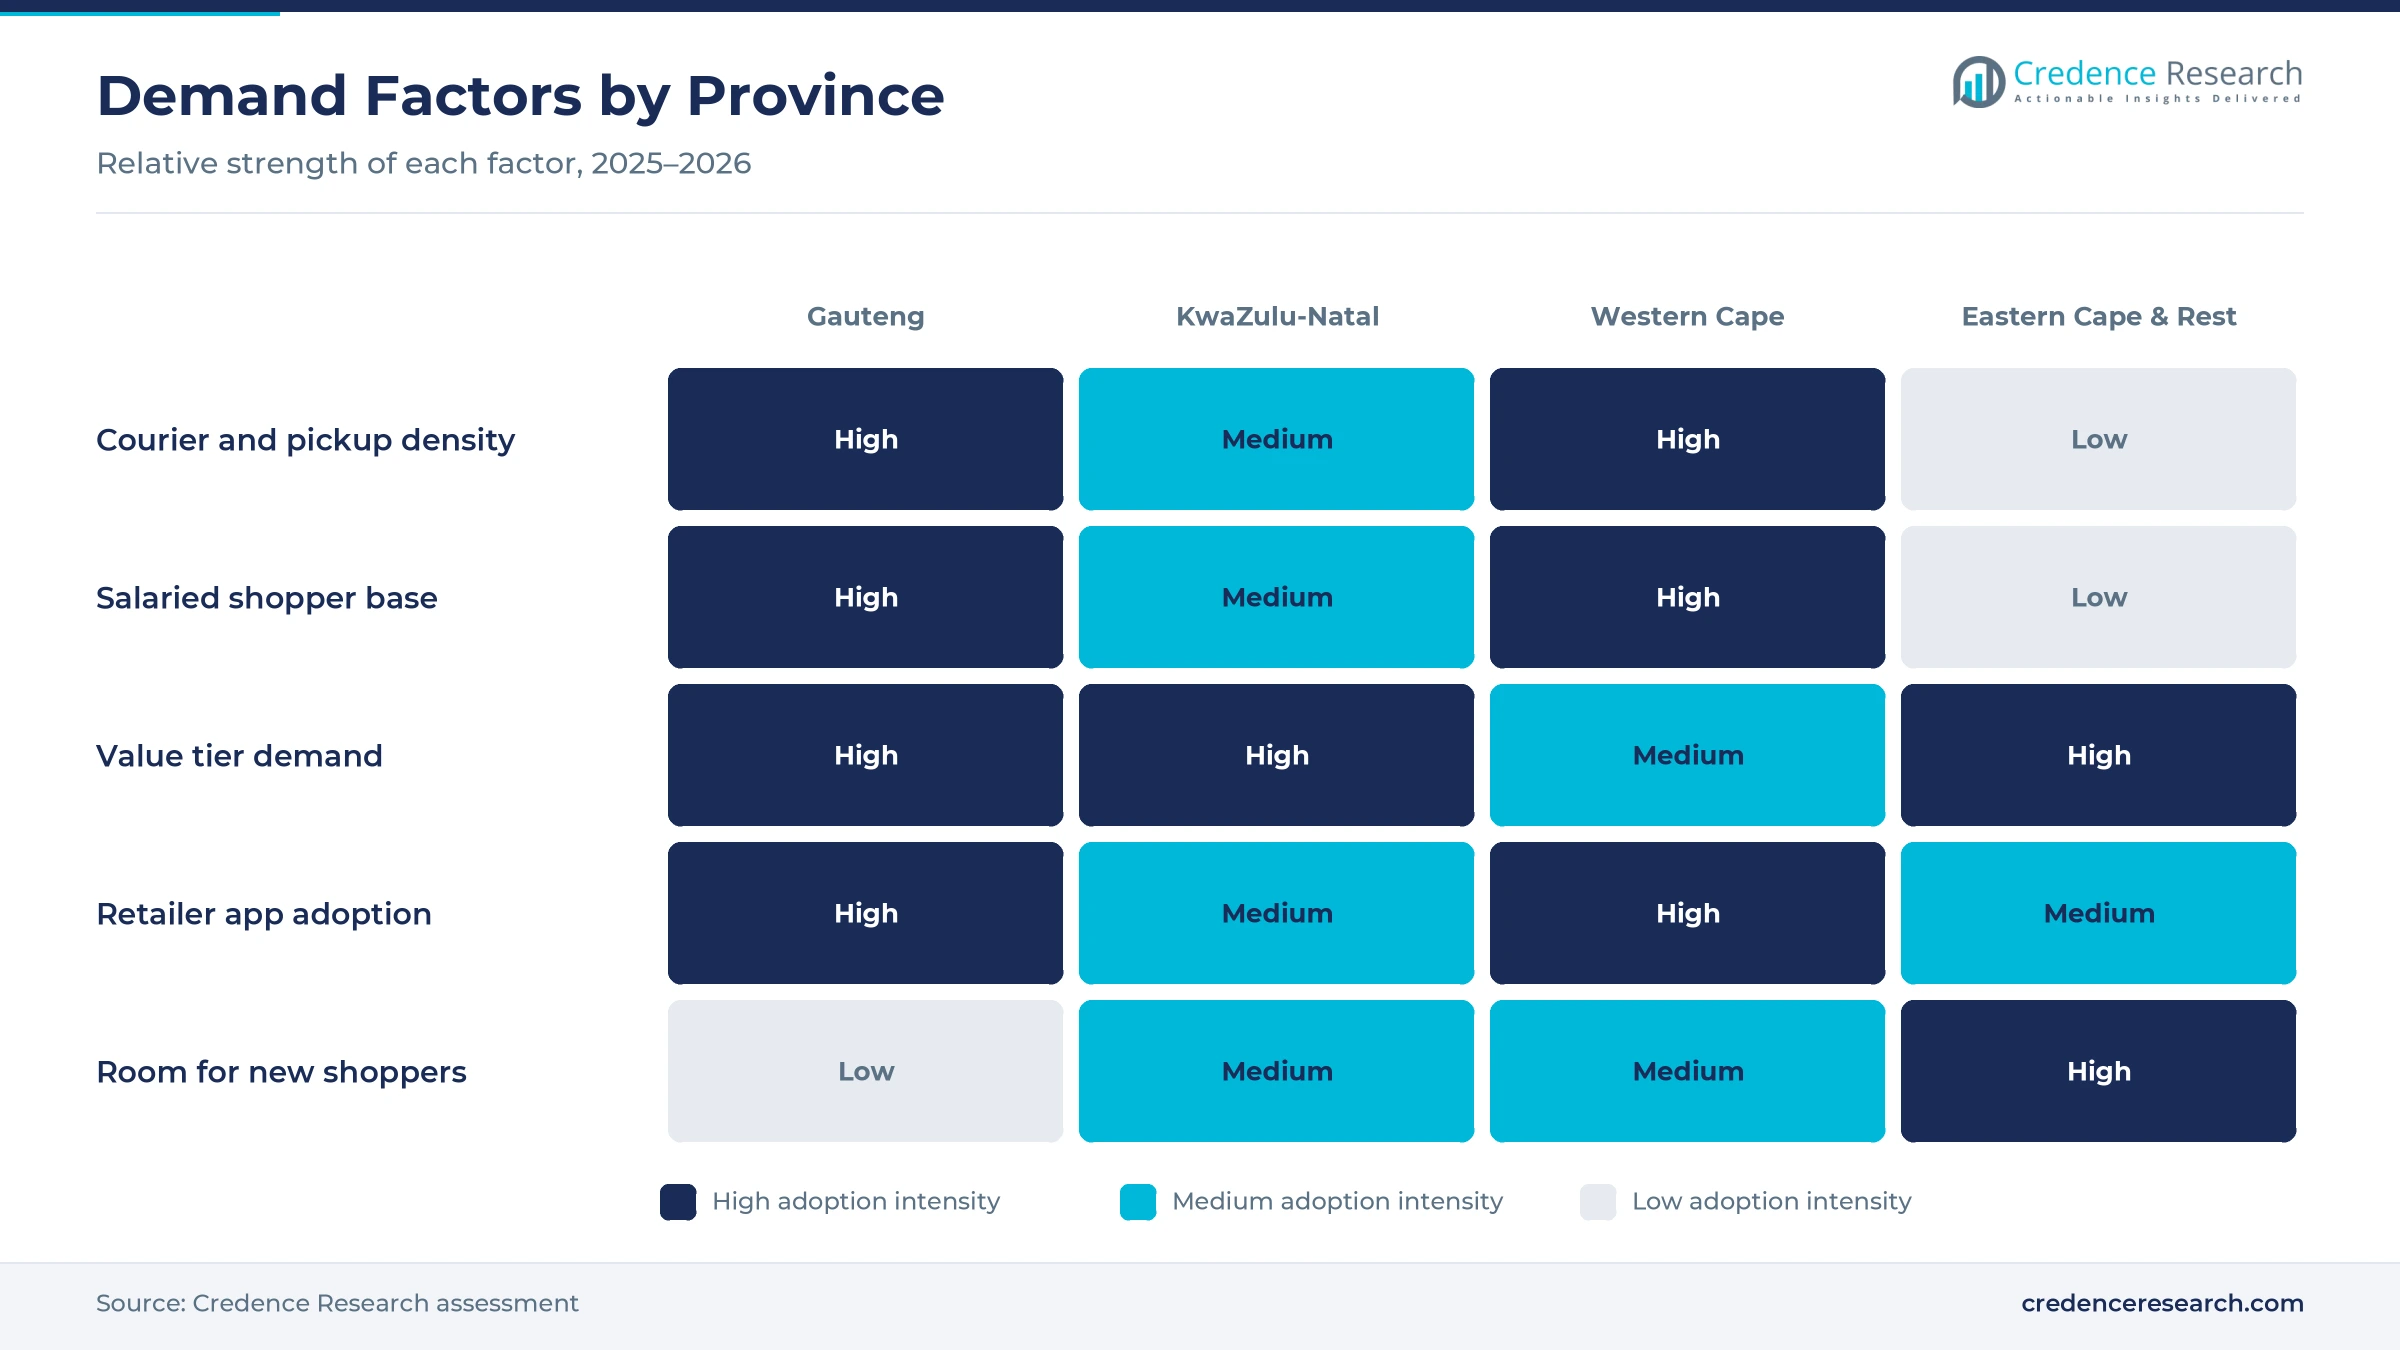
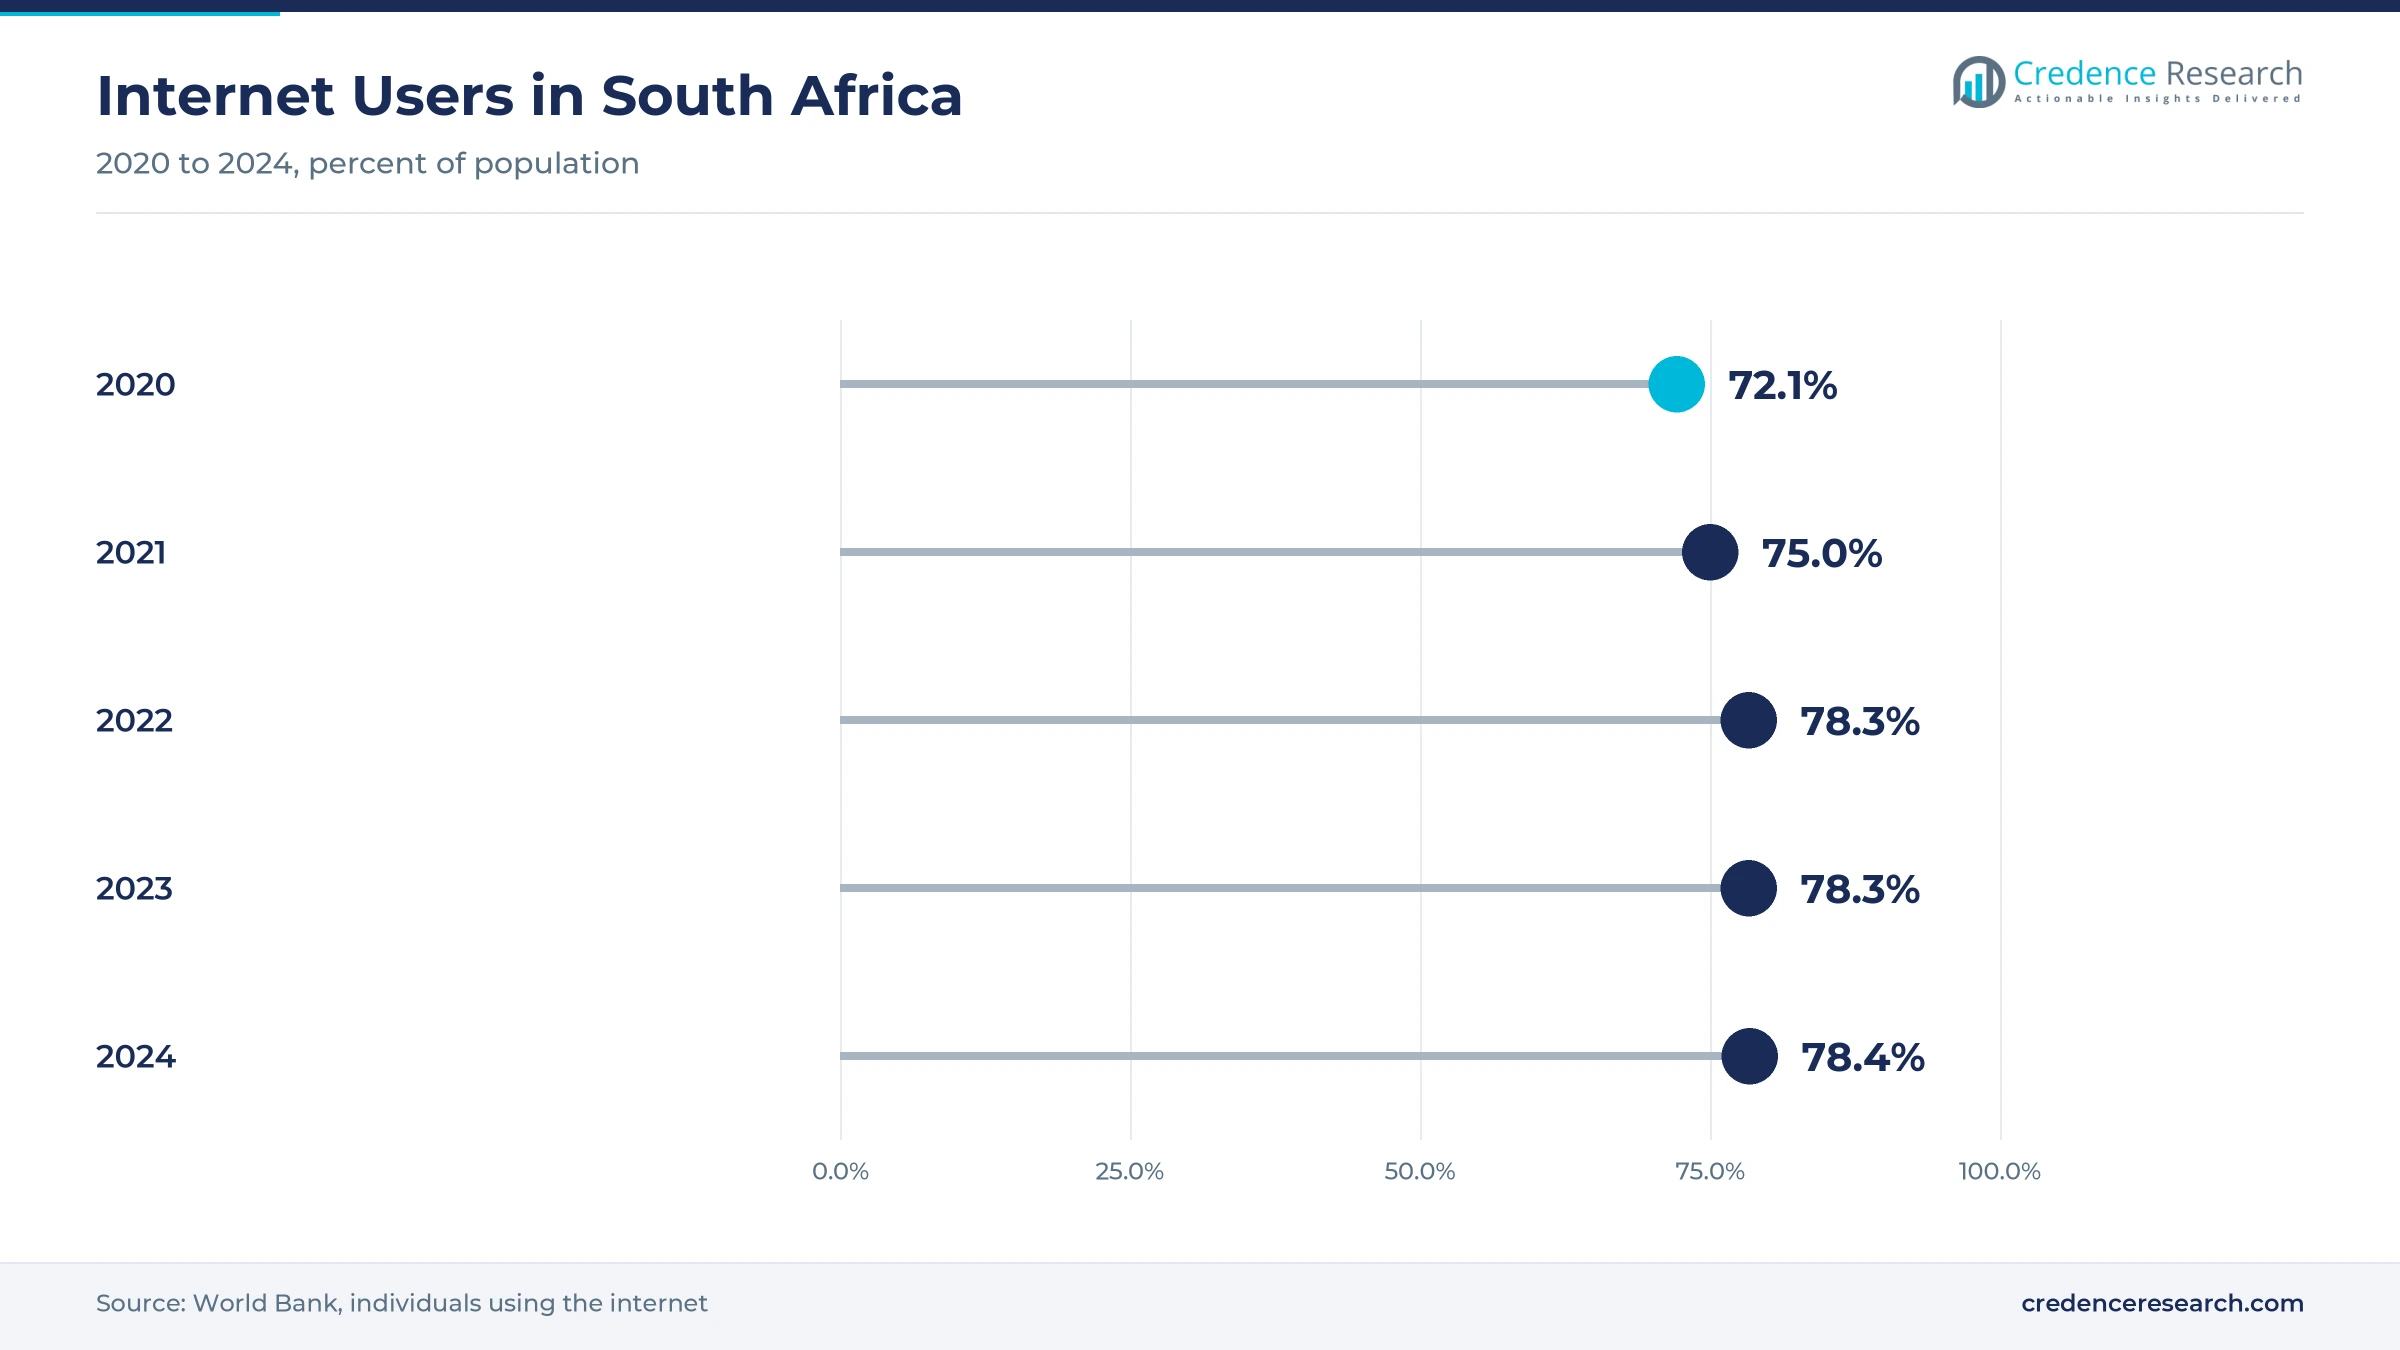
Mobile-first consumer access lifts online clothing orders, because most new shoppers browse, compare and pay for fashion inside phone apps rather than on desktop sites. Internet users reached 78.4% of the population in 2024, up from 72.1% in 2020, according to the World Bank. Census 2022 counted about 62 million residents, which gives apps a large and young customer base. TFG describes Bash as the leading South African fashion and lifestyle shopping app, and the platform reached profitability two years ahead of plan. In turn, Gauteng holds the largest provincial share of value, because its connected urban shoppers adopt app ordering first and order more often across the year.
How do marketplaces sharpen range and price competition?
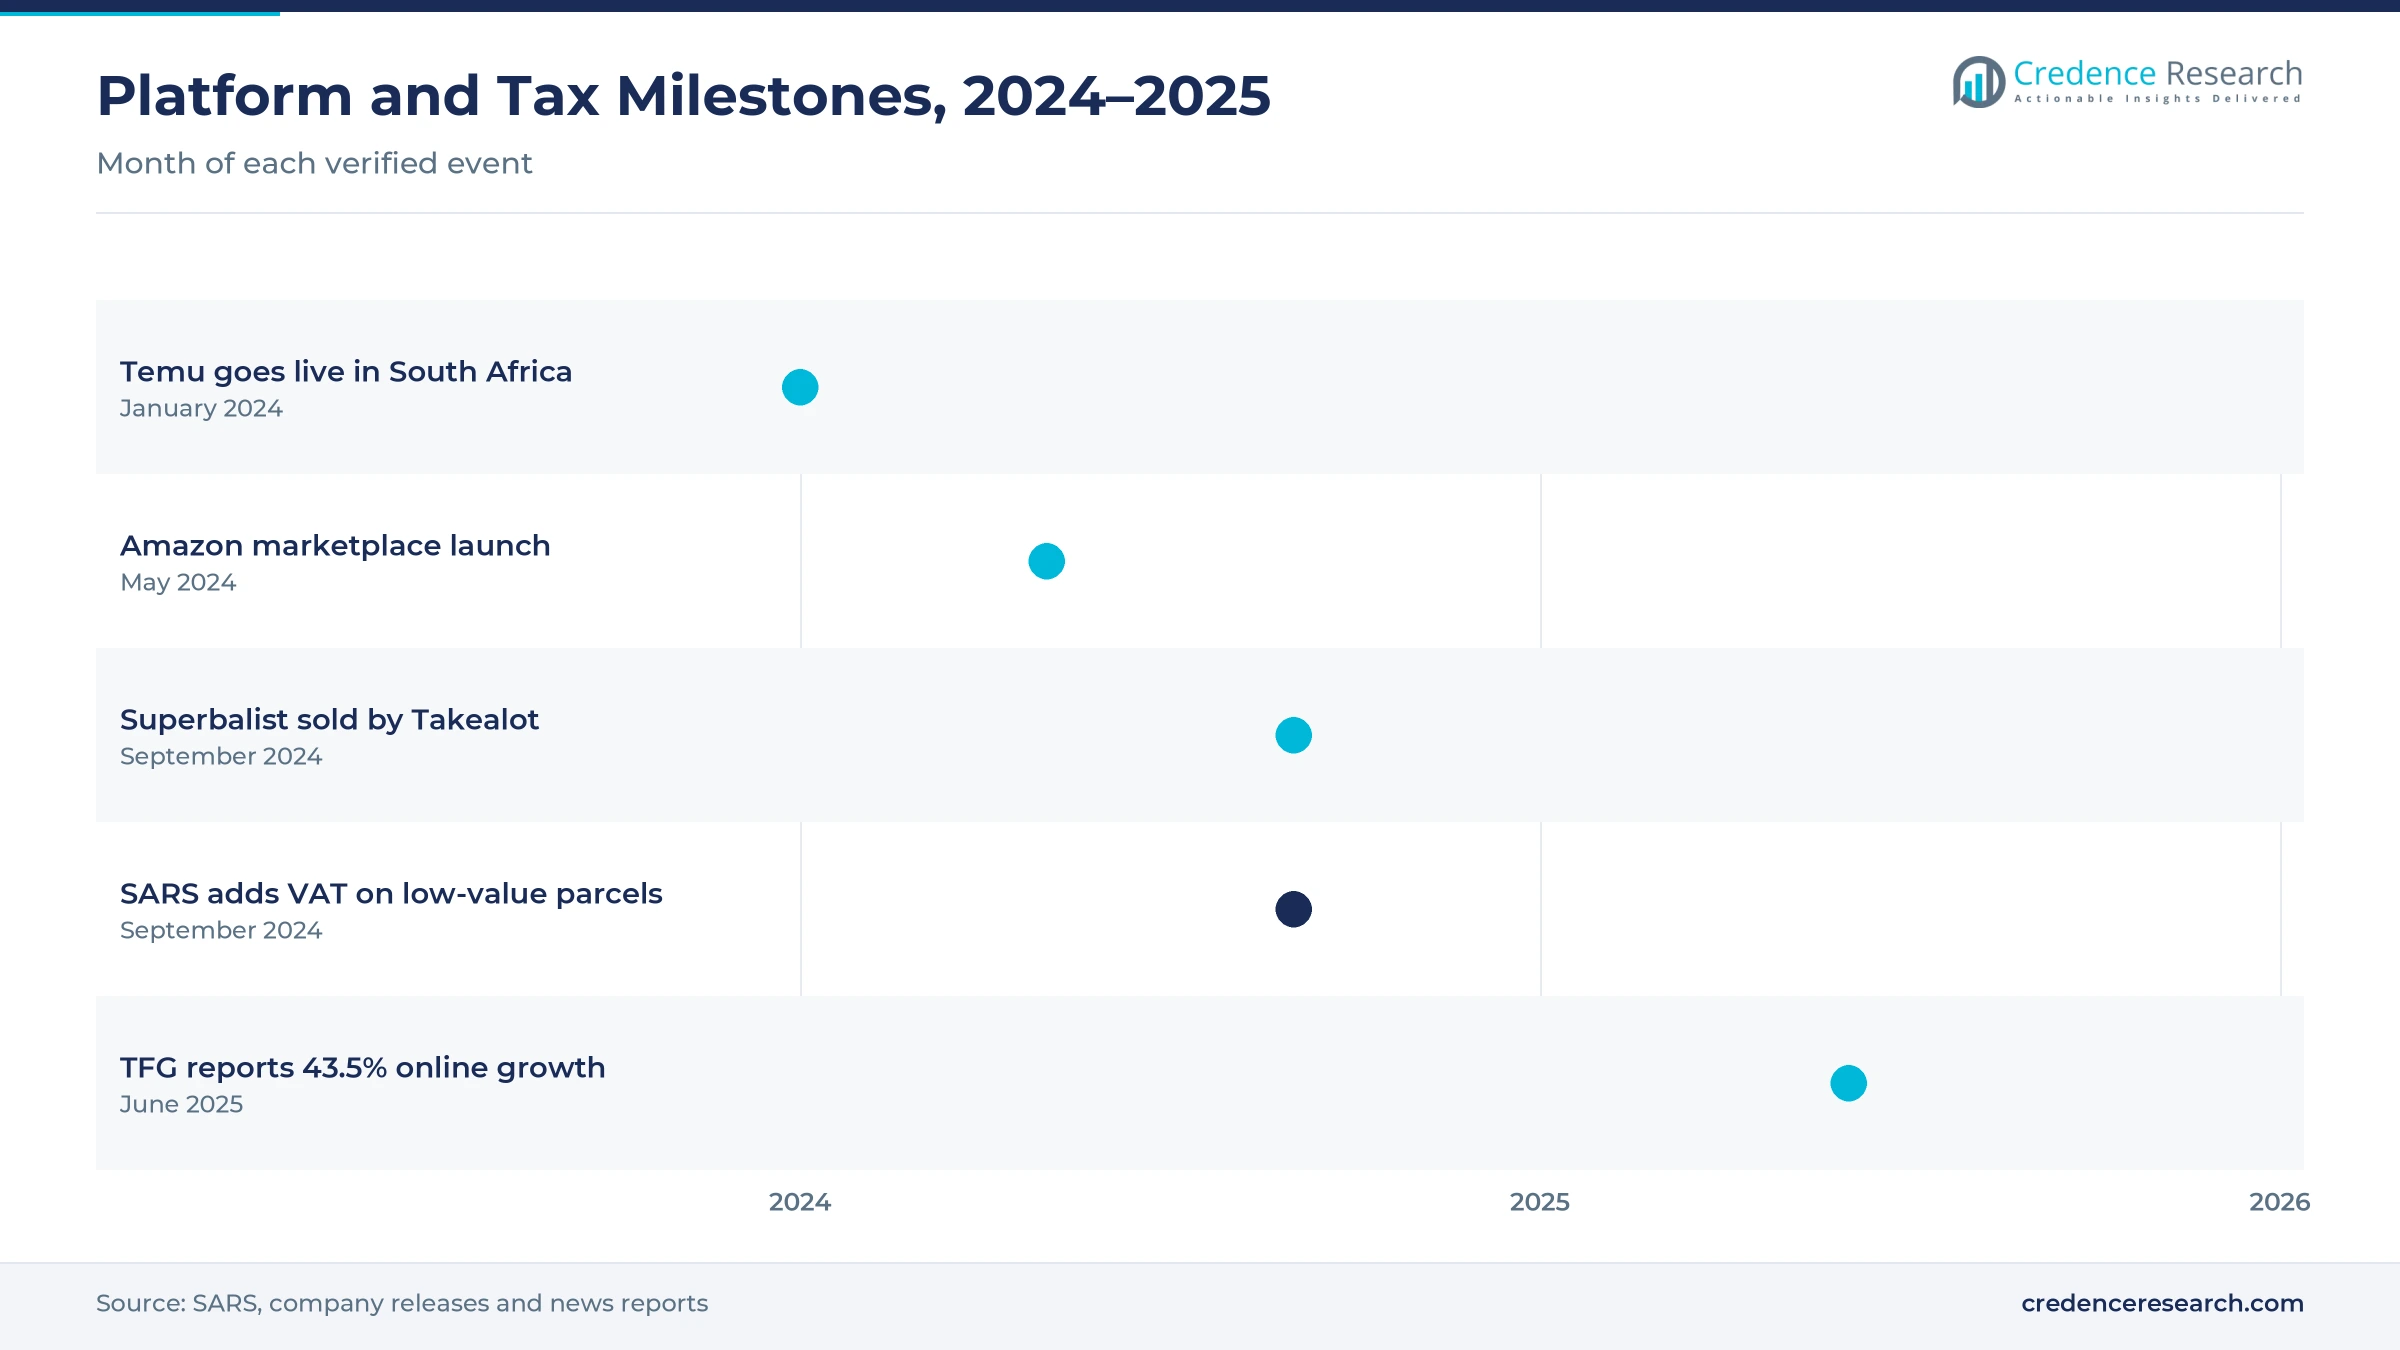
Marketplace-led assortment and price competition expands the online fashion offer, because shoppers can compare thousands of local and imported items in one place. Amazon launched its South African marketplace in May 2024 with same-day and next-day delivery, 3,000 pickup points and free delivery above R500, according to BusinessTech, which lifted service standards for apparel e-commerce. Temu went live in South Africa in January 2024, with shipping times of up to 20 days for goods made in China. Takealot orders rose 15% in its 2025 financial year, while its TakealotMore subscription drove more frequent shopping. As a result, pure-play marketplaces hold 44.0% of 2025 value, and value ranges grow fastest across the country.
Why do fairer platform rules widen seller participation?
Fairer platform rules widen seller participation, because small fashion labels list more products when marketplace terms are clear and disputes are settled quickly. The Competition Commission published its final online platforms market inquiry report in July 2023, ordering Takealot to separate its retail division from its marketplace operations. Takealot was also told to remove narrow price parity clauses and introduce a 60-day process for seller complaints about returns and stock loss. Historically disadvantaged sellers receive waived subscription fees for three months and at least R2,000 in advertising credit. In turn, brand-owned and small local labels gain a cheaper route to national shoppers, which widens the online fashion range available outside the large chains. These labels also reach social commerce, which grows at 13.53% a year.
Import tax parity and retailer apps reshape competition
How is the shift to import tax parity changing prices?
The shift to import tax parity is changing online fashion prices, because cross-border apps lose part of the cost edge they held over local chains. Low-value parcels of R500 or less had paid a flat 20% customs duty, while local retailers paid up to 45% duty plus 15% import VAT, according to IOL. From Sept. 1, 2024, SARS added VAT on top of the flat duty as a temporary measure. The authority also planned to restructure the flat rate into four categories based on World Customs Organization guidelines. As a result, value ranges still grow at 12.73% a year, although imported basics now compete on a fairer tax footing with locally stocked clothing.
Why is the rise of consolidation among pure-plays notable?
The rise of consolidation among pure-play fashion sites is notable, because general marketplaces and cross-border apps now set price expectations for online clothing. Takealot sold Superbalist on Sept. 1, 2024, to a South African consortium of retail and private equity investors led by Blank Canvas Capital. Takealot said it would focus on Takealot and Mr D, while keeping warehousing and logistics for Superbalist under a multi-year service agreement. Takealot also reported 13% growth in gross merchandise value and 81% growth in Mr D grocery value in its 2025 financial year, which shows where the group now invests. In turn, specialist fashion sites focus on curated brands, faster delivery and loyalty, while marketplaces keep the largest share of national order value.
Can retailer apps capture the next wave of shoppers?
Retailer apps offer an opening to capture the next wave of online shoppers, because they combine store returns, account credit and familiar brands. Mr Price online sales grew 7.9% in its 2025 financial year, accelerating to 11.5% in the second half. TFG Africa online sales grew 43.5% over a similar period, helped by the Bash platform that carries its many apparel and footwear brands. Woolworths Dash sales also rose 41.6% in the year to June 2025, which shows that its shoppers accept fast app delivery. As a result, omnichannel retailer platforms can win mid-market buyers who prefer local quality and easy exchanges.
Is there room to grow beyond Gauteng?
Provinces beyond Gauteng offer room to grow, because many shoppers there still buy clothing mainly in malls and town centers. Census 2022 showed that Gauteng, KwaZulu-Natal and the Western Cape together hold about 56% of the national population, leaving a large base in other provinces. Amazon offers 3,000 pickup points across the country, which lets shoppers without secure home delivery collect parcels nearby. Internet users reached 78.4% of the population in 2024, so most adults can now browse fashion apps. In turn, the Eastern Cape and rest of South Africa grow faster than every other zone, as fashion retail delivery networks deepen.
Returns, delivery costs and fraud pressure fashion margins
How do fit-related returns erode fashion margins?
Fit-related returns erode fashion margins, because shoppers often order several sizes and send back the items that do not fit. As a result, retailers pay for reverse courier trips, inspection and repackaging on low-priced orders. Operators respond with size guides, fit reviews and store return options, which cut repeat returns and recover stock faster. This pressure is strongest for footwear and formal wear, where sizing varies widely between brands and imported ranges.
Why do delivery costs limit reach in smaller towns?
Delivery costs limit reach in smaller towns, because couriers must cover long distances between customers outside the main metros. In turn, platforms charge higher fees or promise slower delivery in rural areas, which reduces order frequency. Operators respond with pickup points, lockers and partner stores, which group last-mile delivery parcels and lower cost per order. This barrier is easing as national pickup networks spread, although remote districts still wait longer for parcels.
How do fraud and parcel theft raise operating costs?
Fraud and parcel theft raise operating costs, because card fraud, fake returns and stolen parcels force retailers to absorb losses and pay for extra checks. As a result, some platforms limit cash payments or high-value orders in certain areas. Operators respond with one-time passwords, tracked delivery and secure collection points, which protect shoppers and stock. This risk remains a cost burden for smaller brands that lack advanced fraud tools.
Why does weak household income strain demand?
Weak household income strains demand, because high unemployment and debt costs leave many families with little money for discretionary clothing. In turn, shoppers trade down to value ranges and delay purchases of premium items. Retailers respond with lay-by plans, account credit and promotions around payday and holidays, which keep baskets moving. This constraint favors value marketplaces and discount chains over premium and luxury fashion sellers.
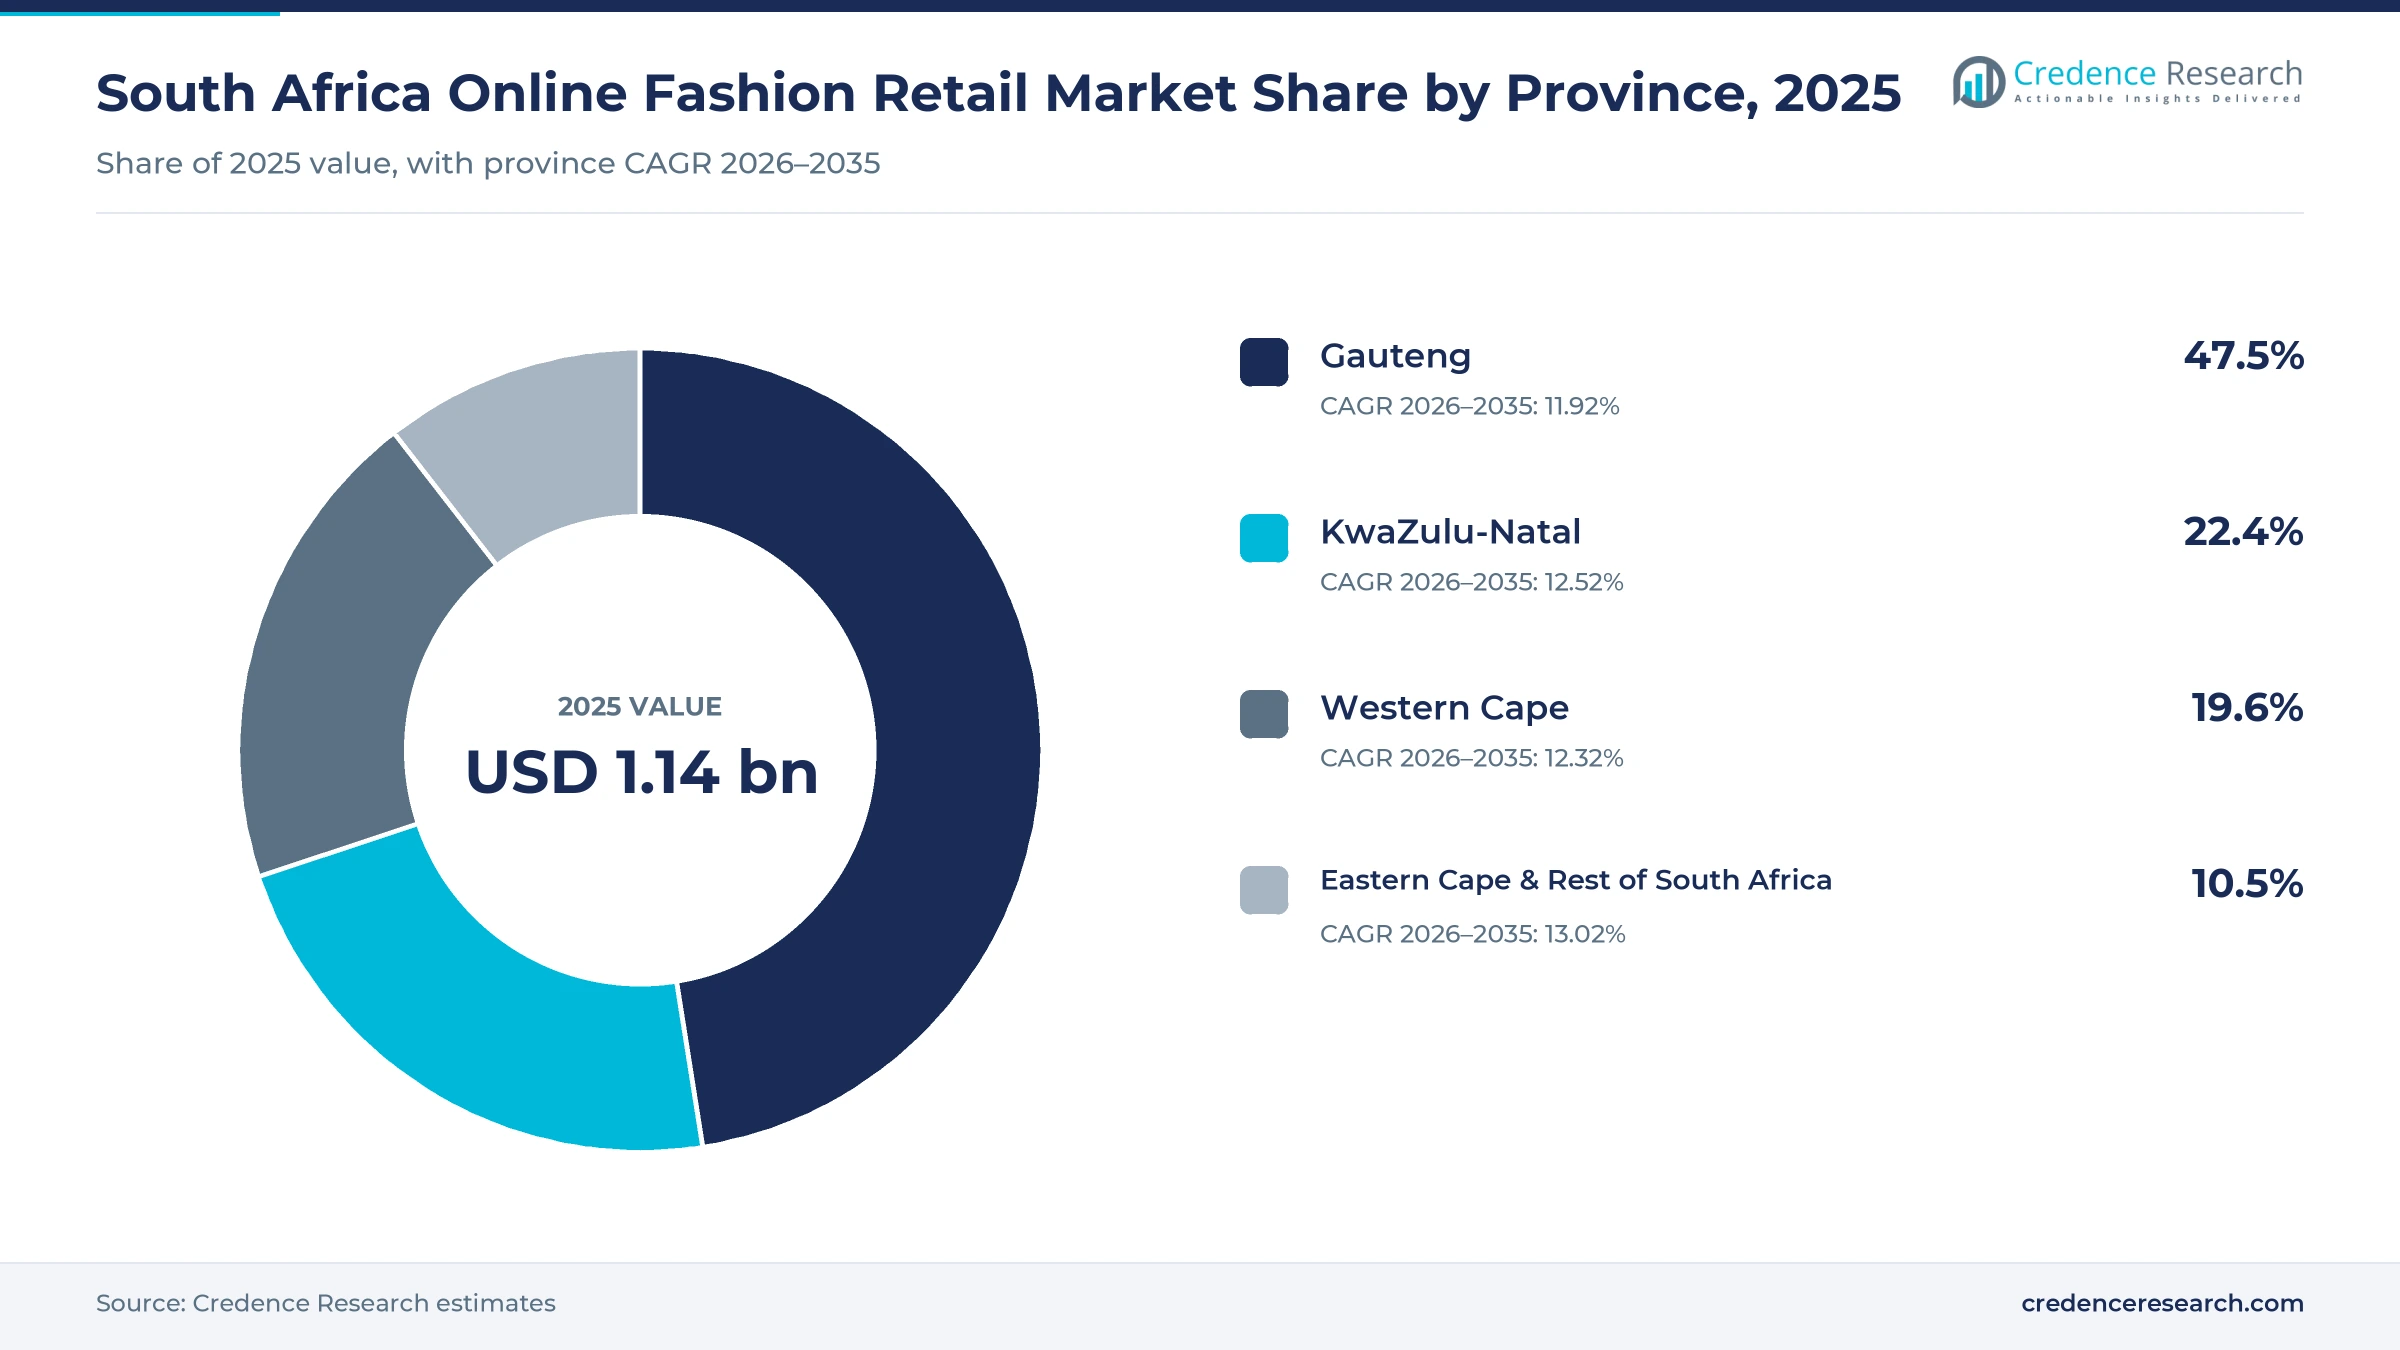
Gauteng leads while smaller provinces grow fastest
| Province | Value, 2025 (USD billion) | Share, 2025 | CAGR, 2026–2035 |
|---|---|---|---|
| Gauteng | 0.54 | 47.5% | 11.92% |
| KwaZulu-Natal | 0.26 | 22.4% | 12.52% |
| Western Cape | 0.22 | 19.6% | 12.32% |
| Eastern Cape & Rest of South Africa | 0.12 | 10.5% | 13.02% |
Why does Gauteng hold the top provincial share?
Gauteng held a 47.5% share of 2025 value and grows at 11.92% a year, because Johannesburg and Pretoria hold the largest base of salaried shoppers in the country. Census 2022 counted about 15 million residents in Gauteng, the largest provincial population. The province also has the densest courier routes and same-day delivery coverage. As a result, Gauteng remains the main testing ground for new fashion apps, delivery promises and loyalty programs.
How does KwaZulu-Natal add volume through Durban?
KwaZulu-Natal held a 22.4% share of 2025 value and grows at 12.52% a year, because Durban and Pietermaritzburg add a large urban shopper base with strong value demand. Census 2022 placed KwaZulu-Natal among the three provinces that together hold about 56% of residents. Value chains such as Mr Price, which grew online sales 7.9% in its 2025 financial year, serve this price-sensitive base. In turn, KwaZulu-Natal combines strong value demand with growing app use and pickup coverage.
Why does the Western Cape favor mid-market and premium brands?
The Western Cape held 19.6% of 2025 value and grows at 12.32% a year, because Cape Town holds many higher-income shoppers who buy mid-market and premium brands online. Census 2022 ranked the Western Cape as the third-largest province by population. Woolworths and Truworths, which sell quality-led ranges, reported online fashion growth of 22.8% and 21.5% in their latest years. As a result, the province leans toward mid-market and premium ranges with credit accounts.
How are the Eastern Cape and other provinces growing fastest?
The Eastern Cape and rest of South Africa held 10.5% of 2025 value and grow fastest at 13.02% a year, because pickup networks now reach towns far from the main metros. Amazon offers 3,000 pickup points across the country, which brings parcel collection closer to town shoppers. These provinces hold about 44% of residents, according to Census 2022. In turn, value ranges and marketplace orders grow quickly as delivery improves.
Platform launches, tax changes and ownership moves
| Development | Status and market relevance |
|---|---|
| In May 2024, Amazon launched its South African marketplace with same-day and next-day delivery and 3,000 pickup points. | Raises delivery and range expectations |
| In September 2024, SARS began adding VAT on top of the flat duty charged on low-value imported parcels. | Narrows the tax gap with local retailers |
| In June 2025, TFG reported 43.5% online sales growth in TFG Africa for its 2025 financial year, led by its Bash platform. | Confirms the scale of retailer apps in 2025 |
| In September 2025, Woolworths reported 22.8% growth in online fashion, beauty and home sales for the year to June 2025. | Lifts online to 6.6% of that division in 2025 |
| In August 2026, Truworths reported 21.5% online sales growth in Truworths Africa for the 52 weeks to June 28, 2026. | Raises online to 8.1% of segment sales in 2026 |
Apps, size tools and pickup networks shape fulfillment
- Shopping apps combine many brands, credit accounts and personalized offers, which raises repeat orders and basket size for retailer platforms.
- Size and fit tools use size charts, reviews and past orders to recommend the right fit, which reduces costly returns on apparel and footwear.
- Pickup and locker networks let shoppers collect parcels near home or work, which lowers failed deliveries and cost per order outside the metros.
- Fraud screening checks payments and returns in real time, which protects retailers from card fraud and fake refund claims.
Need a Custom Version of This Report?
Tailor the scope, geography, or segments to your exact requirements.
- Custom geography or segment scope
- Direct access to our analyst team
Global marketplaces and local retailers compete on price
Competition combines global marketplaces, local general marketplaces and the apps of large clothing chains. SHEIN and Temu compete on very low prices and huge ranges, although SARS tax changes in September 2024 narrowed part of their cost edge. Amazon competes through same-day and next-day delivery, 3,000 pickup points and free delivery above R500. Takealot competes through its national marketplace and TakealotMore subscription, which lifted order frequency. TFG competes through Bash, which carries its many apparel and footwear brands. Mr Price competes on value pricing, while Woolworths and Truworths compete on quality, credit accounts and mid-market to premium ranges. Superbalist now competes under new ownership as a curated fashion site. Rivals compete on price, range, delivery speed, returns and loyalty.
Which companies serve South African online fashion shoppers?
| Company | Type | Role in the market |
|---|---|---|
| TFG Limited | Omnichannel retailer | Runs the Bash fashion and lifestyle app |
| Takealot | General marketplace | Sells fashion with a subscription delivery service |
| Amazon South Africa | Global marketplace | Offers fast delivery and 3,000 pickup points |
| Temu | Cross-border marketplace | Ships low-priced goods from China |
| Woolworths Holdings Limited | Omnichannel retailer | Sells fashion, beauty and home online |
| Mr Price Group | Value omnichannel retailer | Sells value apparel through its online store |
| Truworths International | Omnichannel retailer | Sells mid-market and premium fashion online |
| Superbalist | Pure-play fashion site | Sells curated brands under new ownership |
Credence Research view on South African digital wardrobes
Credence Research's view is that South African online fashion retail will grow quickly because phones, marketplaces and retailer apps are moving clothing purchases away from mall visits. Value ranges and pure-play marketplaces remain the largest pools, while social commerce, accessories and smaller provinces add the fastest growth. Tax parity on imported parcels gives local chains a fairer base to compete. Retailers with strong apps, credit accounts and store return options should gain the most, while returns, delivery costs and weak household income test smaller sellers.
Census, retailer and tax records behind the model
The report uses 2025 as the base year on a calendar basis, and market values come from the Credence Research model. That model combines official population and internet statistics, retail trade data, company results releases and news reports. Segment splits and provincial growth rates are Credence Research estimates, while provincial shares follow the client-provided split. Sources used are official statistics, regulator decisions, company releases and news reports, and no interviews or surveys were used.
Value marketplaces and retailer apps carry growth to 2035
The South Africa online fashion retail market is expected to reach USD 3.64 billion by 2035, a 12.25% CAGR during 2026–2035, as shoppers move routine clothing and footwear purchases to apps. Growth should be strongest in social commerce, accessories, value ranges and smaller provinces, because these areas gain most from wider delivery and low prices. Retailer apps will defend mid-market and premium demand with credit accounts and store returns, while returns, fraud and weak household income could slow smaller sellers.
Frequently Asked Questions
How big is the South Africa online fashion retail market?
Which product type leads South African online fashion sales?
Which province leads the South African market?
How did SARS change taxes on low-value imported parcels?
Which channel is growing fastest?
How fast are retailer apps growing in South Africa?
Who are the leading companies in the South African market?
What are the main challenges for online fashion sellers?
Table of Content
Chapter 1 Market Segmentation
- 1.1 Segmentation Framework
- 1.1.1 Product and Service Classification
- 1.1.2 Application and End-Use Classification
- 1.1.3 Technology and Solution Classification
- 1.1.4 Customer and Distribution Channel Classification
- 1.1.5 Geographic Segmentation
- 1.1.6 Market Segment Definitions and Boundaries
- 1.2 By Product Type
- 1.2.1 Apparel
- 1.2.2 Footwear
- 1.2.3 Bags & Accessories
- 1.2.4 Jewellery & Watches
- 1.3 By Price Tier
- 1.3.1 Value
- 1.3.2 Mid-Market
- 1.3.3 Premium
- 1.3.4 Luxury
- 1.4 By Customer Type
- 1.4.1 Women
- 1.4.2 Men
- 1.4.3 Kids & Teens
- 1.4.4 Gender-Neutral Buyers
- 1.5 By Province
- 1.5.1 Gauteng
- 1.5.2 Western Cape
- 1.5.3 KwaZulu-Natal
- 1.5.4 Eastern Cape & Rest of South Africa
Chapter 2 Introduction
- 2.1 Report Objectives and Scope
- 2.2 Product Definition and Industry Terminology
- 2.3 Market Inclusions and Exclusions
- 2.4 Research Process
- 2.4.1 Primary Research and Expert Interviews
- 2.4.2 Secondary Research and Source Review
- 2.4.3 Top-Down and Bottom-Up Estimation
- 2.4.4 Data Triangulation and Verification
- 2.5 Market Size Measurement Basis
- 2.5.1 2025: USD 1.14 billion → 2035: USD 3.64 billion
- 2.6 Historical and Forecast Reference Periods
- 2.6.1 Historical Period: 2018-2025
- 2.6.2 Base Year: 2025
- 2.6.3 Forecast Period: 2025-2035
- 2.7 Research Assumptions and Limitations
Chapter 3 Executive Summary
- 3.1 Market Snapshot and Key Findings
- 3.2 Base-Year Market Size, 2025
- 3.3 Forecast Market Size, 2035
- 3.4 Revenue and Volume Growth Outlook
- 3.5 Key Demand and Supply Indicators
- 3.6 Leading Market Segments
- 3.7 Fastest-Growing Market Opportunities
- 3.8 Regional Performance Highlights
- 3.9 Technology and Industry Transformation
- 3.10 Competitive Landscape Summary
- 3.11 Analyst View and Strategic Implications
Chapter 4 South Africa Online Fashion Retail Market Trends and Developments
- 4.1 Historical Industry Development, 2018-2025
- 4.2 Recent Market Trends and Developments
- 4.3 Demand and Customer Behavior Trends
- 4.4 Technology and Product Innovation
- 4.5 Artificial Intelligence, Automation and Digitalization
- 4.6 Local Manufacturing and Supply Chain Realignment
- 4.7 Industry Partnerships, Mergers and Acquisitions
- 4.8 Sustainability and Circular Economy Developments
- 4.9 Government and Private Sector Investment Trends
- 4.10 Emerging Business Models and Commercialization
- 4.11 Industry Developments and Announcements
Chapter 5 South Africa Online Fashion Retail Market Production, Supply and Demand Analysis
- 5.1 Demand Trend and Consumption Analysis, 2018-2025
- 5.2 Demand Forecast, 2025-2035
- 5.3 Production and Output Trend, 2018-2025
- 5.4 Production and Output Forecast, 2025-2035
- 5.5 Installed Capacity and Capacity Utilization
- 5.6 Company-Wise Production Plants and Statistics
- 5.6.1 Installed Production Capacity
- 5.6.2 Actual Production
- 5.6.3 Planned Capacity and Expansion Targets
- 5.7 Supply Chain Structure and Procurement Trends
- 5.8 Supply-Demand Gap and Bottlenecks
- 5.9 Import Dependence and Sourcing Structure
- 5.10 Contract Manufacturing and Outsourcing
- 5.11 Regional Supply and Demand Concentration
Chapter 6 South Africa Online Fashion Retail Market Pricing Analysis
- 6.1 Pricing Structure and Measurement
- 6.2 Historical Pricing Trends, 2018-2025
- 6.3 Pricing Outlook, 2025-2035
- 6.4 Average Selling Price and Unit Economics
- 6.5 Pricing by Product and Market Segment
- 6.6 Geographic Pricing Differences
- 6.7 Key Input, Energy, Labor and Logistics Costs
- 6.8 Contract Pricing and Purchasing Models
- 6.9 Pricing Sensitivity and Competitive Positioning
- 6.10 Price, Margin and Profitability Implications
Chapter 7 South Africa Online Fashion Retail Market Dynamics
- 7.1 Market Growth Drivers
- 7.1.1 Demand-Side Drivers
- 7.1.2 Technology and Innovation Drivers
- 7.1.3 Infrastructure and Investment Drivers
- 7.1.4 Regulatory and Policy Drivers
- 7.2 Market Restraints
- 7.2.1 Cost and Affordability Constraints
- 7.2.2 Technology and Adoption Barriers
- 7.2.3 Supply Chain and Operational Constraints
- 7.3 Market Challenges
- 7.3.1 Competitive Pressure and Margin Erosion
- 7.3.2 Skills, Infrastructure and Implementation Gaps
- 7.4 Emerging Market Opportunities
- 7.5 Market Dynamics Impact and Time-Horizon Assessment
Chapter 8 South Africa Online Fashion Retail Value Chain Analysis
- 8.1 Industry Value Chain Overview
- 8.2 Upstream Suppliers and Critical Inputs
- 8.3 Technology and Component Providers
- 8.4 Manufacturing or Service Delivery
- 8.5 Distribution, Channel Partners and Integrators
- 8.6 Downstream Applications and End Users
- 8.7 Value Addition and Profit Pools
- 8.8 Vertical Integration and Outsourcing
- 8.9 Supplier Concentration and Risk
- 8.10 Supply Chain Localization and Resilience
Chapter 9 South Africa Online Fashion Retail Market Regulations and Policies
- 9.1 Relevant Laws, Standards and Compliance Frameworks
- 9.2 Product, Service, Safety and Quality Requirements
- 9.3 Government Policies, Incentives and Subsidies
- 9.4 Imports, Exports and Trade Barriers
- 9.5 Public Procurement and Local Content Requirements
- 9.6 Environmental and Sustainability Compliance
- 9.7 Upcoming Policy Changes and Market Implications
Chapter 10 South Africa Online Fashion Retail Market Hotspots and Opportunities
- 10.1 Market Opportunity Mapping and Growth Hotspots
- 10.2 High-Growth Applications and Customer Groups
- 10.3 Underserved Markets and White-Space Opportunities
- 10.4 Emerging Technology and Product Opportunities
- 10.5 New Capacity and Investment Hotspots
- 10.6 Market Entry and Expansion Opportunities
- 10.7 Distribution and Partnership Opportunities
- 10.8 Near-Term and Long-Term Commercial Potential
- 10.9 Opportunity Attractiveness and Execution Risks
Chapter 11 South Africa Online Fashion Retail Market Outlook, 2025-2035
- 11.1 Market Size and Analysis
- 11.1.1 Revenue (Market Measurement: 2025: USD 1.14 billion → 2035: USD 3.64 billion)
- 11.1.2 Market Volume and Quantity Sold
- 11.1.3 Historical Market Size, 2018-2025
- 11.1.4 Base-Year Market Size, 2025
- 11.2 Market Forecast, 2025-2035
- 11.2.1 Revenue Forecast to 2035
- 11.2.2 Volume Forecast to 2035
- 11.2.3 CAGR and Year-on-Year Growth
- 11.2.4 Incremental Revenue Opportunity
- 11.3 Forecast Assumptions and Scenario Analysis
- 11.3.1 Base-Case Forecast
- 11.3.2 Optimistic and Conservative Scenarios
- 11.3.3 Technology, Pricing and Policy Sensitivities
- 11.4 Market Attractiveness and Growth Outlook
Chapter 12 South Africa Online Fashion Retail Market Segmentation and Outlook
- 12.1 Segmentation Summary and Market Shares, 2025
- 12.2 Largest and Fastest-Growing Segments
- 12.3 By Product Type - Market Size and Forecast, 2025-2035
- 12.3.1 Segment Definition and Scope
- 12.3.2 Historical Market Size, 2018-2025
- 12.3.3 Revenue Forecast, 2025-2035
- 12.3.4 Volume Forecast, 2025-2035
- 12.3.5 Base-Year Market Share, 2025
- 12.3.6 Segment CAGR and Growth Drivers
- 12.3.7 Subsegment Market Size and Forecast
- 12.3.7.1 Apparel
- 12.3.7.2 Footwear
- 12.3.7.3 Bags & Accessories
- 12.3.7.4 Jewellery & Watches
- 12.3.8 Subsegment Pricing and Adoption Trends
- 12.3.9 Leading Suppliers and Competition
- 12.3.10 Regional Demand and Opportunities
- 12.4 By Price Tier - Market Size and Forecast, 2025-2035
- 12.4.1 Segment Definition and Scope
- 12.4.2 Historical Market Size, 2018-2025
- 12.4.3 Revenue Forecast, 2025-2035
- 12.4.4 Volume Forecast, 2025-2035
- 12.4.5 Base-Year Market Share, 2025
- 12.4.6 Segment CAGR and Growth Drivers
- 12.4.7 Subsegment Market Size and Forecast
- 12.4.7.1 Value
- 12.4.7.2 Mid-Market
- 12.4.7.3 Premium
- 12.4.7.4 Luxury
- 12.4.8 Subsegment Pricing and Adoption Trends
- 12.4.9 Leading Suppliers and Competition
- 12.4.10 Regional Demand and Opportunities
- 12.5 By Customer Type - Market Size and Forecast, 2025-2035
- 12.5.1 Segment Definition and Scope
- 12.5.2 Historical Market Size, 2018-2025
- 12.5.3 Revenue Forecast, 2025-2035
- 12.5.4 Volume Forecast, 2025-2035
- 12.5.5 Base-Year Market Share, 2025
- 12.5.6 Segment CAGR and Growth Drivers
- 12.5.7 Subsegment Market Size and Forecast
- 12.5.7.1 Women
- 12.5.7.2 Men
- 12.5.7.3 Kids & Teens
- 12.5.7.4 Gender-Neutral Buyers
- 12.5.8 Subsegment Pricing and Adoption Trends
- 12.5.9 Leading Suppliers and Competition
- 12.5.10 Regional Demand and Opportunities
- 12.6 By Province - Market Size and Forecast, 2025-2035
- 12.6.1 Segment Definition and Scope
- 12.6.2 Historical Market Size, 2018-2025
- 12.6.3 Revenue Forecast, 2025-2035
- 12.6.4 Volume Forecast, 2025-2035
- 12.6.5 Base-Year Market Share, 2025
- 12.6.6 Segment CAGR and Growth Drivers
- 12.6.7 Subsegment Market Size and Forecast
- 12.6.7.1 Gauteng
- 12.6.7.2 Western Cape
- 12.6.7.3 KwaZulu-Natal
- 12.6.7.4 Eastern Cape & Rest of South Africa
- 12.6.8 Subsegment Pricing and Adoption Trends
- 12.6.9 Leading Suppliers and Competition
- 12.6.10 Regional Demand and Opportunities
- 12.7 Segment Growth Comparison
- 12.8 Segment Attractiveness and Priority Matrix
Chapter 13 South Africa Online Fashion Retail End-Use and Application Market Outlook
- 13.1 End-Use Industry and Customer Demand Structure
- 13.2 Leading Applications and Customer Groups
- 13.3 End-Use Market Size, Share and Forecast
- 13.4 Major End-Use Industry Deep Dives
- 13.4.1 Customer Requirements and Use Cases
- 13.4.2 Demand and Replacement Cycles
- 13.4.3 Technical and Regulatory Considerations
- 13.4.4 Purchasing and Procurement Models
- 13.4.5 Leading Vendors and Distribution Channels
- 13.4.6 Forecast and Commercial Opportunities
- 13.5 Emerging Applications and Cross-Segment Demand
- 13.6 End-Use Industry Investment Priorities
Chapter 14 South Africa Online Fashion Retail Geographic Market Outlook, 2025-2035
- 14.1 Domestic Market Distribution and Demand Clusters
- 14.2 State- or Province-Wise Market Size and Forecast, 2025-2035
- 14.3 City and Metropolitan Market Outlook
- 14.4 Industrial, Manufacturing and Commercial Clusters
- 14.5 Geographic Concentration of Key End Users
- 14.6 Local Pricing and Purchasing Differences
- 14.7 Domestic Production Facilities and Capacity Map
- 14.8 Local Infrastructure and Project Pipeline
- 14.9 State-Level Policy and Incentive Differences
- 14.10 Subnational Investment Hotspots and Opportunities
- 14.11 Distribution and Logistics Networks
- 14.12 Domestic Competitive Footprint
Chapter 15 South Africa Online Fashion Retail Technology, Innovation and Sustainability Outlook
- 15.1 Technology Landscape and Maturity
- 15.2 Product, Process and Service Innovation
- 15.3 AI, Automation and Digital Tools in the Industry
- 15.4 Technology Adoption and Performance Benchmarking
- 15.5 Innovation Pipeline and R&D Investment
- 15.6 Patent and Intellectual Property Trends
- 15.7 Energy Efficiency and Resource Management
- 15.8 Sustainability, Recycling and Circularity
- 15.9 Technology Roadmap, 2025-2035
- 15.10 Risks of Obsolescence and Technology Substitution
Chapter 16 South Africa Online Fashion Retail Market Key Strategic Imperatives
- 16.1 Growth and Market Entry Priorities
- 16.2 High-Return Products and Segments
- 16.3 Pricing, Profitability and Cost Optimization
- 16.4 Technology Investment and Product Differentiation
- 16.5 Supply Chain Localization and Resilience
- 16.6 Distribution and Customer Acquisition
- 16.7 Partnership, Acquisition and Capacity Strategy
- 16.8 Regional Expansion Priorities
- 16.9 Short-, Medium- and Long-Term Actions
Chapter 17 Competition Outlook
- 17.1 Industry Competition Characteristics
- 17.2 Market Structure and Concentration
- 17.3 Market Share and Competitive Positioning, 2025
- 17.4 Company-Wise Revenue and Product Benchmarking
- 17.5 Production and Service Capacity Benchmarking
- 17.6 Technology, Pricing and Differentiation
- 17.7 Regional Footprint and Distribution Strength
- 17.8 Mergers, Acquisitions and Strategic Alliances
- 17.9 New Entrants and Competitive Threats
- 17.10 Porter's Five Forces and Industry Attractiveness
- 17.11 Competitive Outlook, 2025-2035
Chapter 18 Company Profiles
- 18.1 Company Coverage and Selection Criteria
- 18.2 SHEIN
- 18.2.1 Business Description
- 18.2.2 Company Ownership and Geographic Presence
- 18.2.3 Product and Service Portfolio
- 18.2.4 Manufacturing and Operating Footprint
- 18.2.5 Production Capacity and Expansion Plans
- 18.2.6 Financial Performance and Investment
- 18.2.7 Market Share and Competitive Position
- 18.2.8 Technology and Innovation Capabilities
- 18.2.9 Strategic Alliances or Partnerships
- 18.2.10 Recent Developments
- 18.2.11 Growth Strategy and Outlook
- 18.3 Takealot
- 18.4 Temu
- 18.5 TFG Limited
- 18.6 Mr Price Group
- 18.7 Woolworths Holdings Limited
- 18.8 Truworths International
- 18.9 Superbalist
- 18.10 Zando
- 18.11 Amazon South Africa
- 18.12 Other Relevant Market Participants
Note: Every listed company is profiled on the structure shown under the first company. The company list is preliminary and may change based on research findings, market developments, data availability and client requirements.
Chapter 19 Disclaimer
- 19.1 Research and Forecast Disclaimer
- 19.2 Data Source and Estimation Limitations
Note: The depth of individual sections depends on data availability for this market. Volume, capacity, trade and other unit-based metrics are included where applicable.

