
AI tools now sit inside club and consumer kit orders
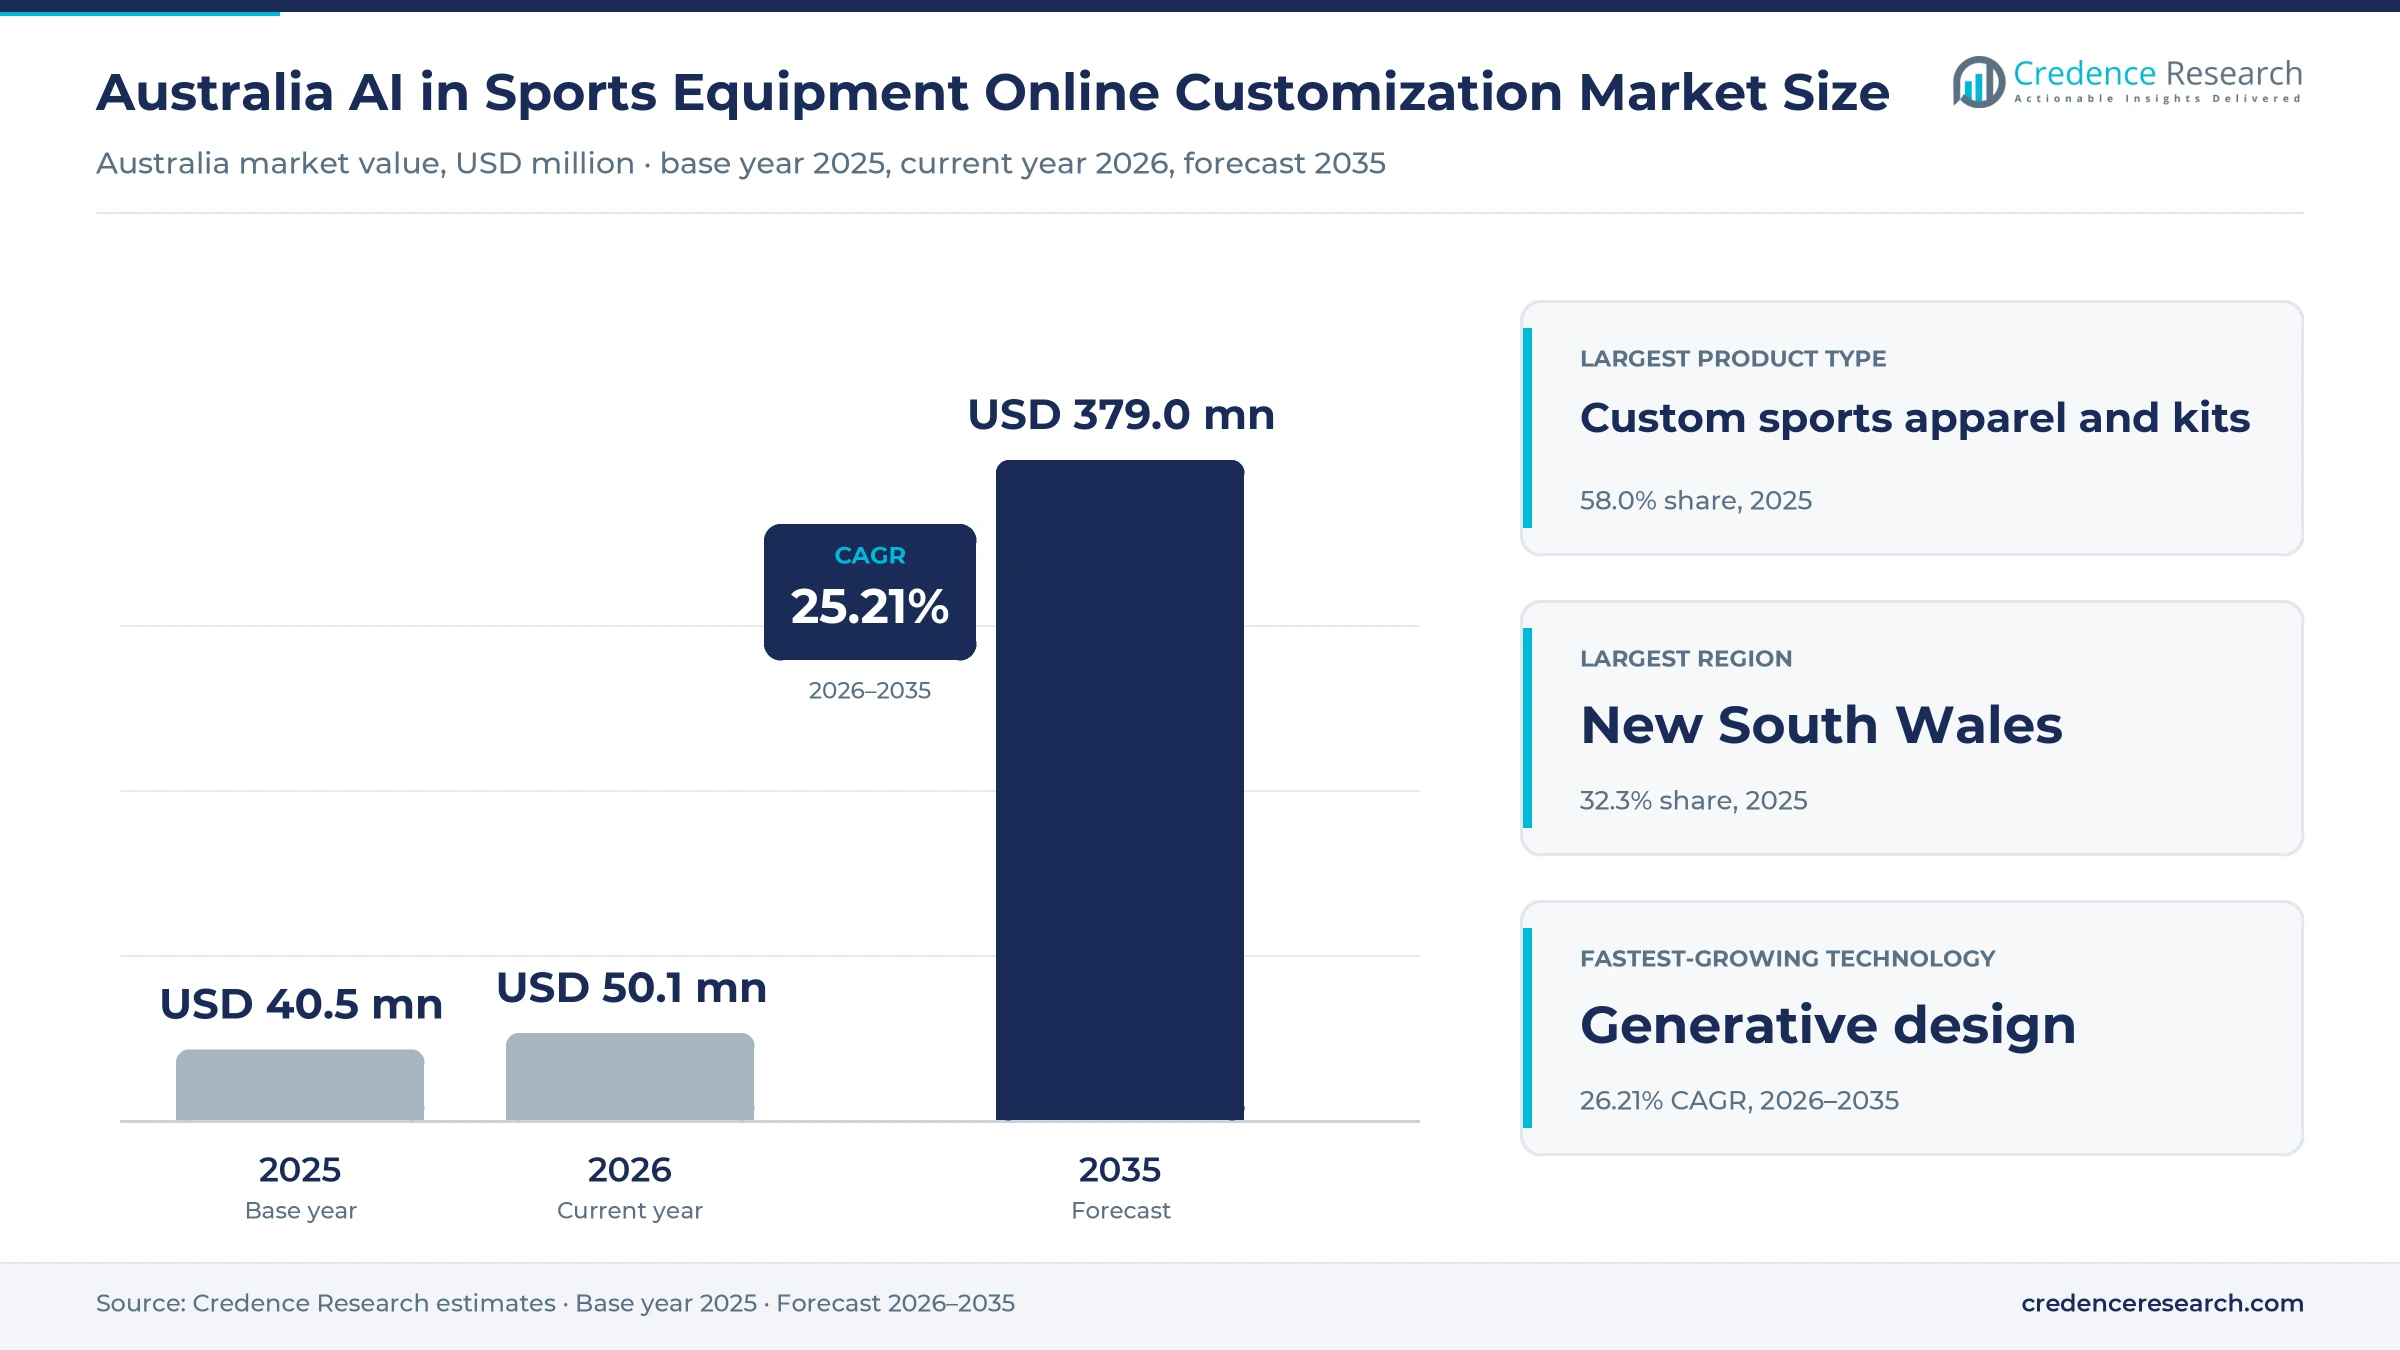
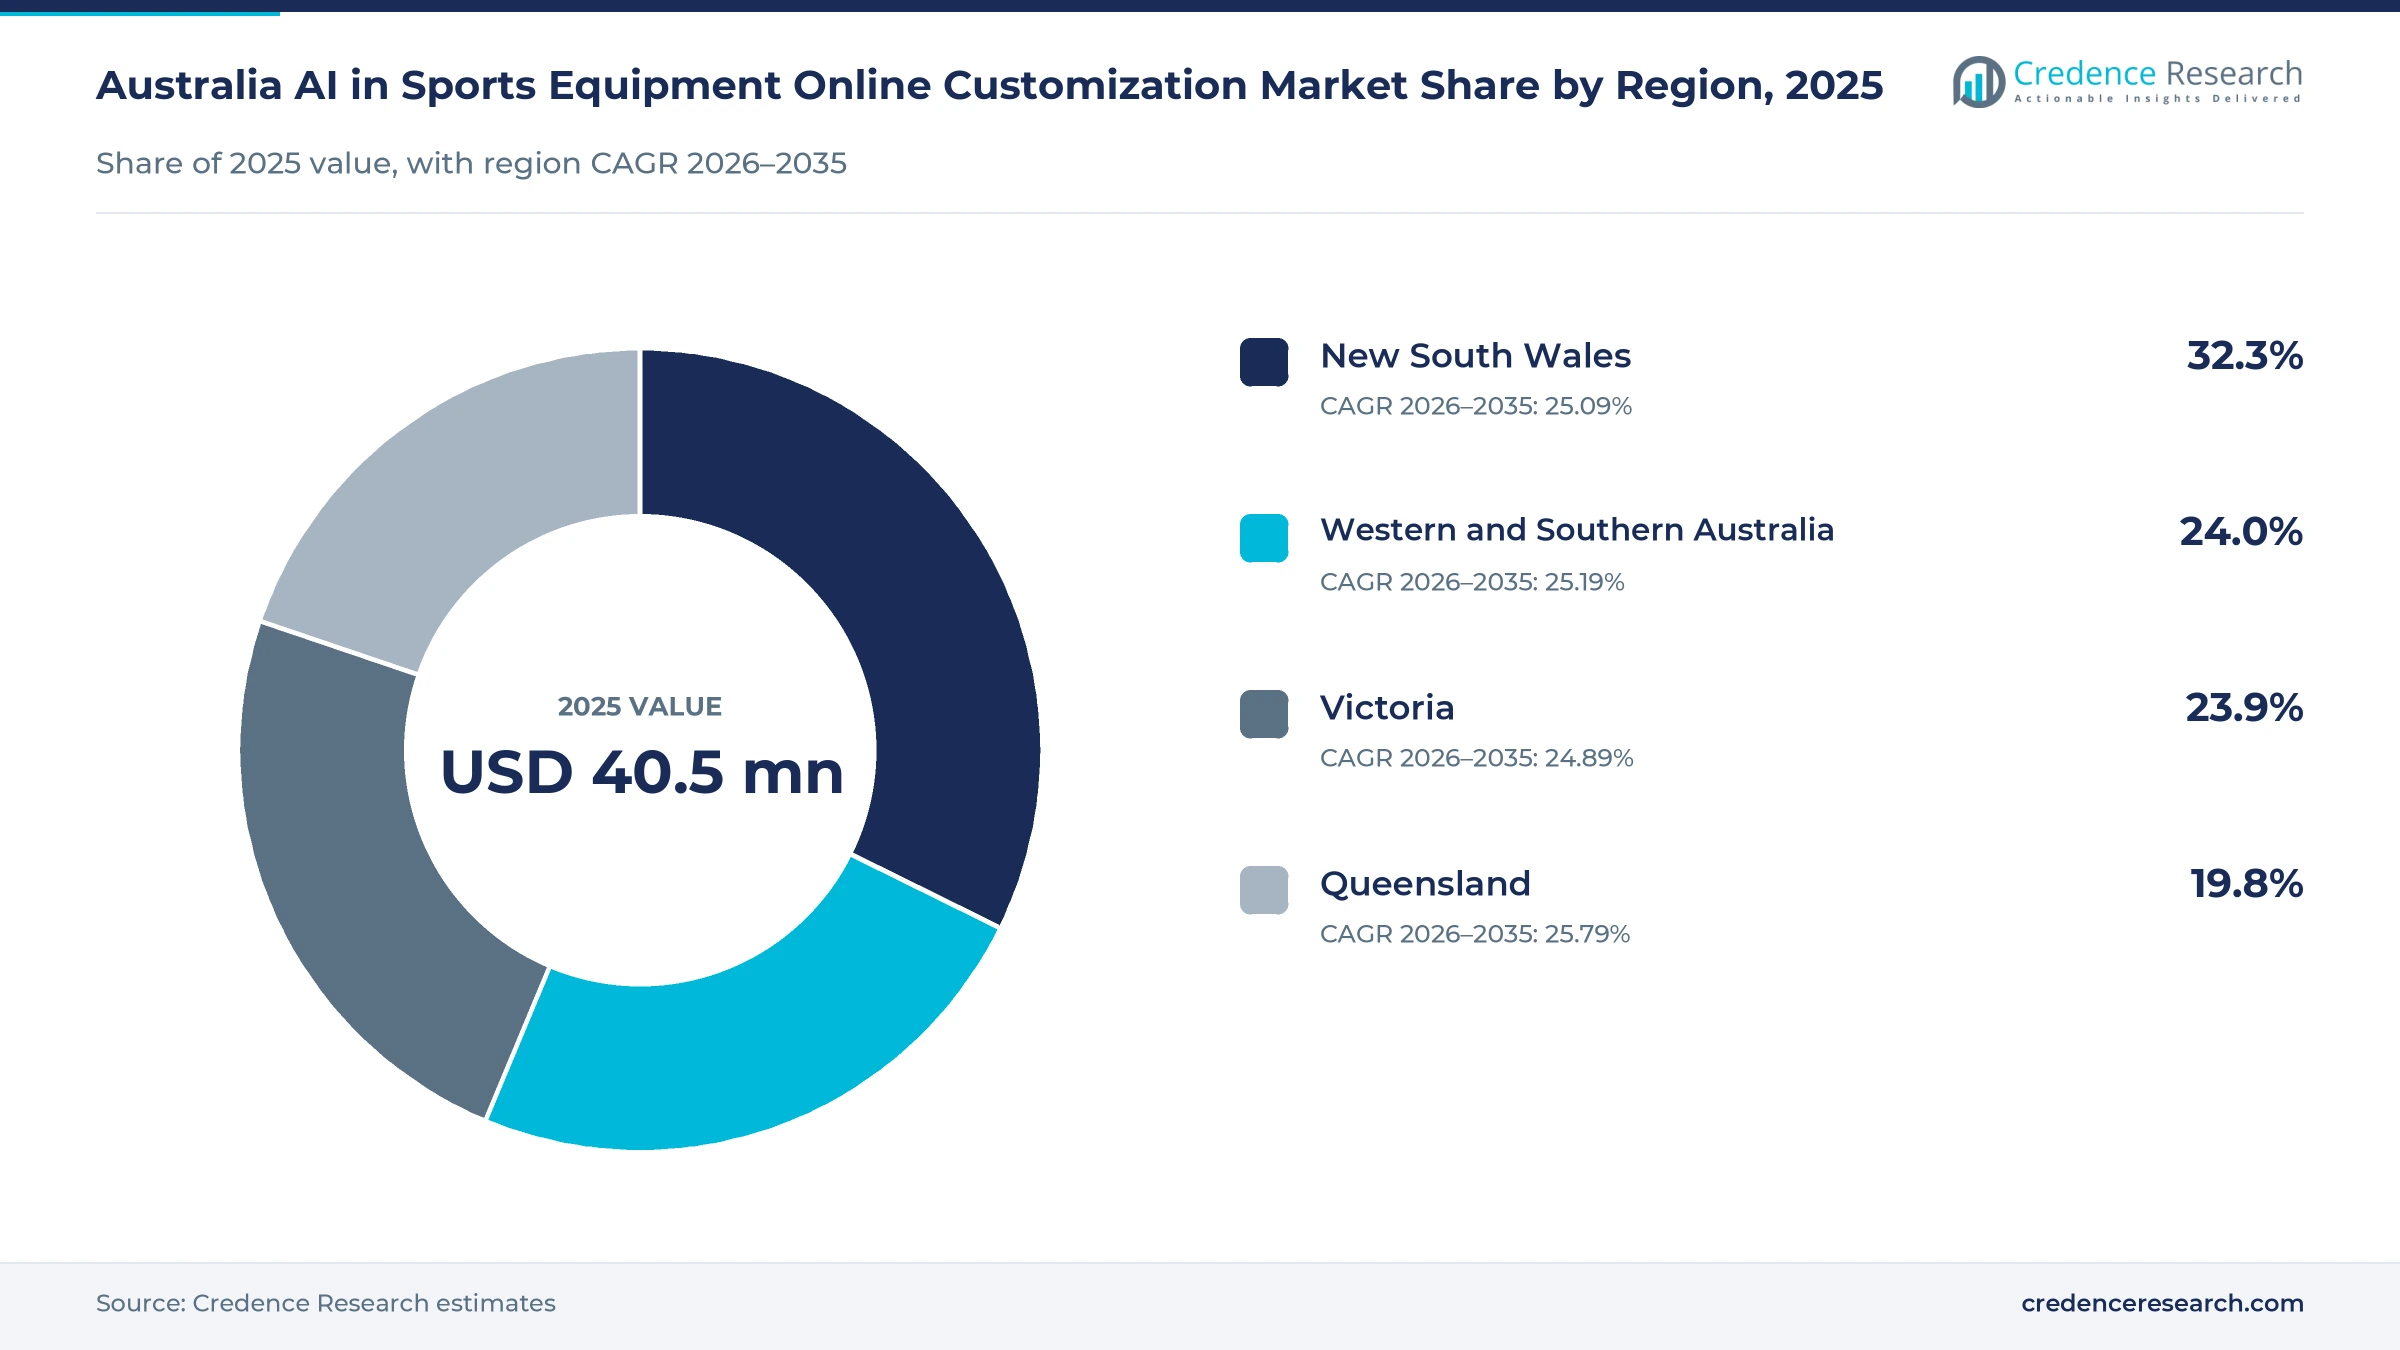
The Australia AI in sports equipment online customization market was valued at USD 40.5 million in 2025 and is projected to increase from USD 50.1 million in 2026 to USD 379.0 million by 2035, registering a CAGR of 25.21% during 2026–2035. Demand comes from community clubs that reorder numbered kits every season, from schools and event buyers that need group orders, and from individuals who design their own gear with AI tools built into ordering websites. New South Wales held the largest regional share, 32.3% in 2025, because the state leads national online spending and runs the largest school system. Queensland is the fastest-growing region at 25.79% a year, as junior and women's participation rises across the state. Nike Australia ended online ordering for Nike By You in April 2025, which moved more consumer customization toward specialist websites, club teamwear suppliers and print-on-demand platforms with built-in AI design tools.
Which online customization orders does the estimate count?
The estimate measures the value of customized sports products ordered online where AI supports design, fit or artwork, through generative design, size and fit recommendation, configuration guidance or automated artwork preparation. It counts custom apparel and kits, footwear, accessories and hard equipment ordered through brand websites, specialist customization websites, marketplace storefronts and club procurement portals.
The estimate excludes standard sports products sold without personalization, walk-in screen printing orders and licensed replica jerseys bought off the shelf. The value chain runs from AI design and configurator software through decoration and print providers to websites and club portals, where buyers approve digital proofs before production starts.
Australia AI in Sports Equipment Online Customization Market Insights
- The Australia AI in sports equipment online customization market was valued at USD 40.5 million in 2025 and is projected to reach USD 379.0 million by 2035, registering a CAGR of 25.21% during 2026–2035.
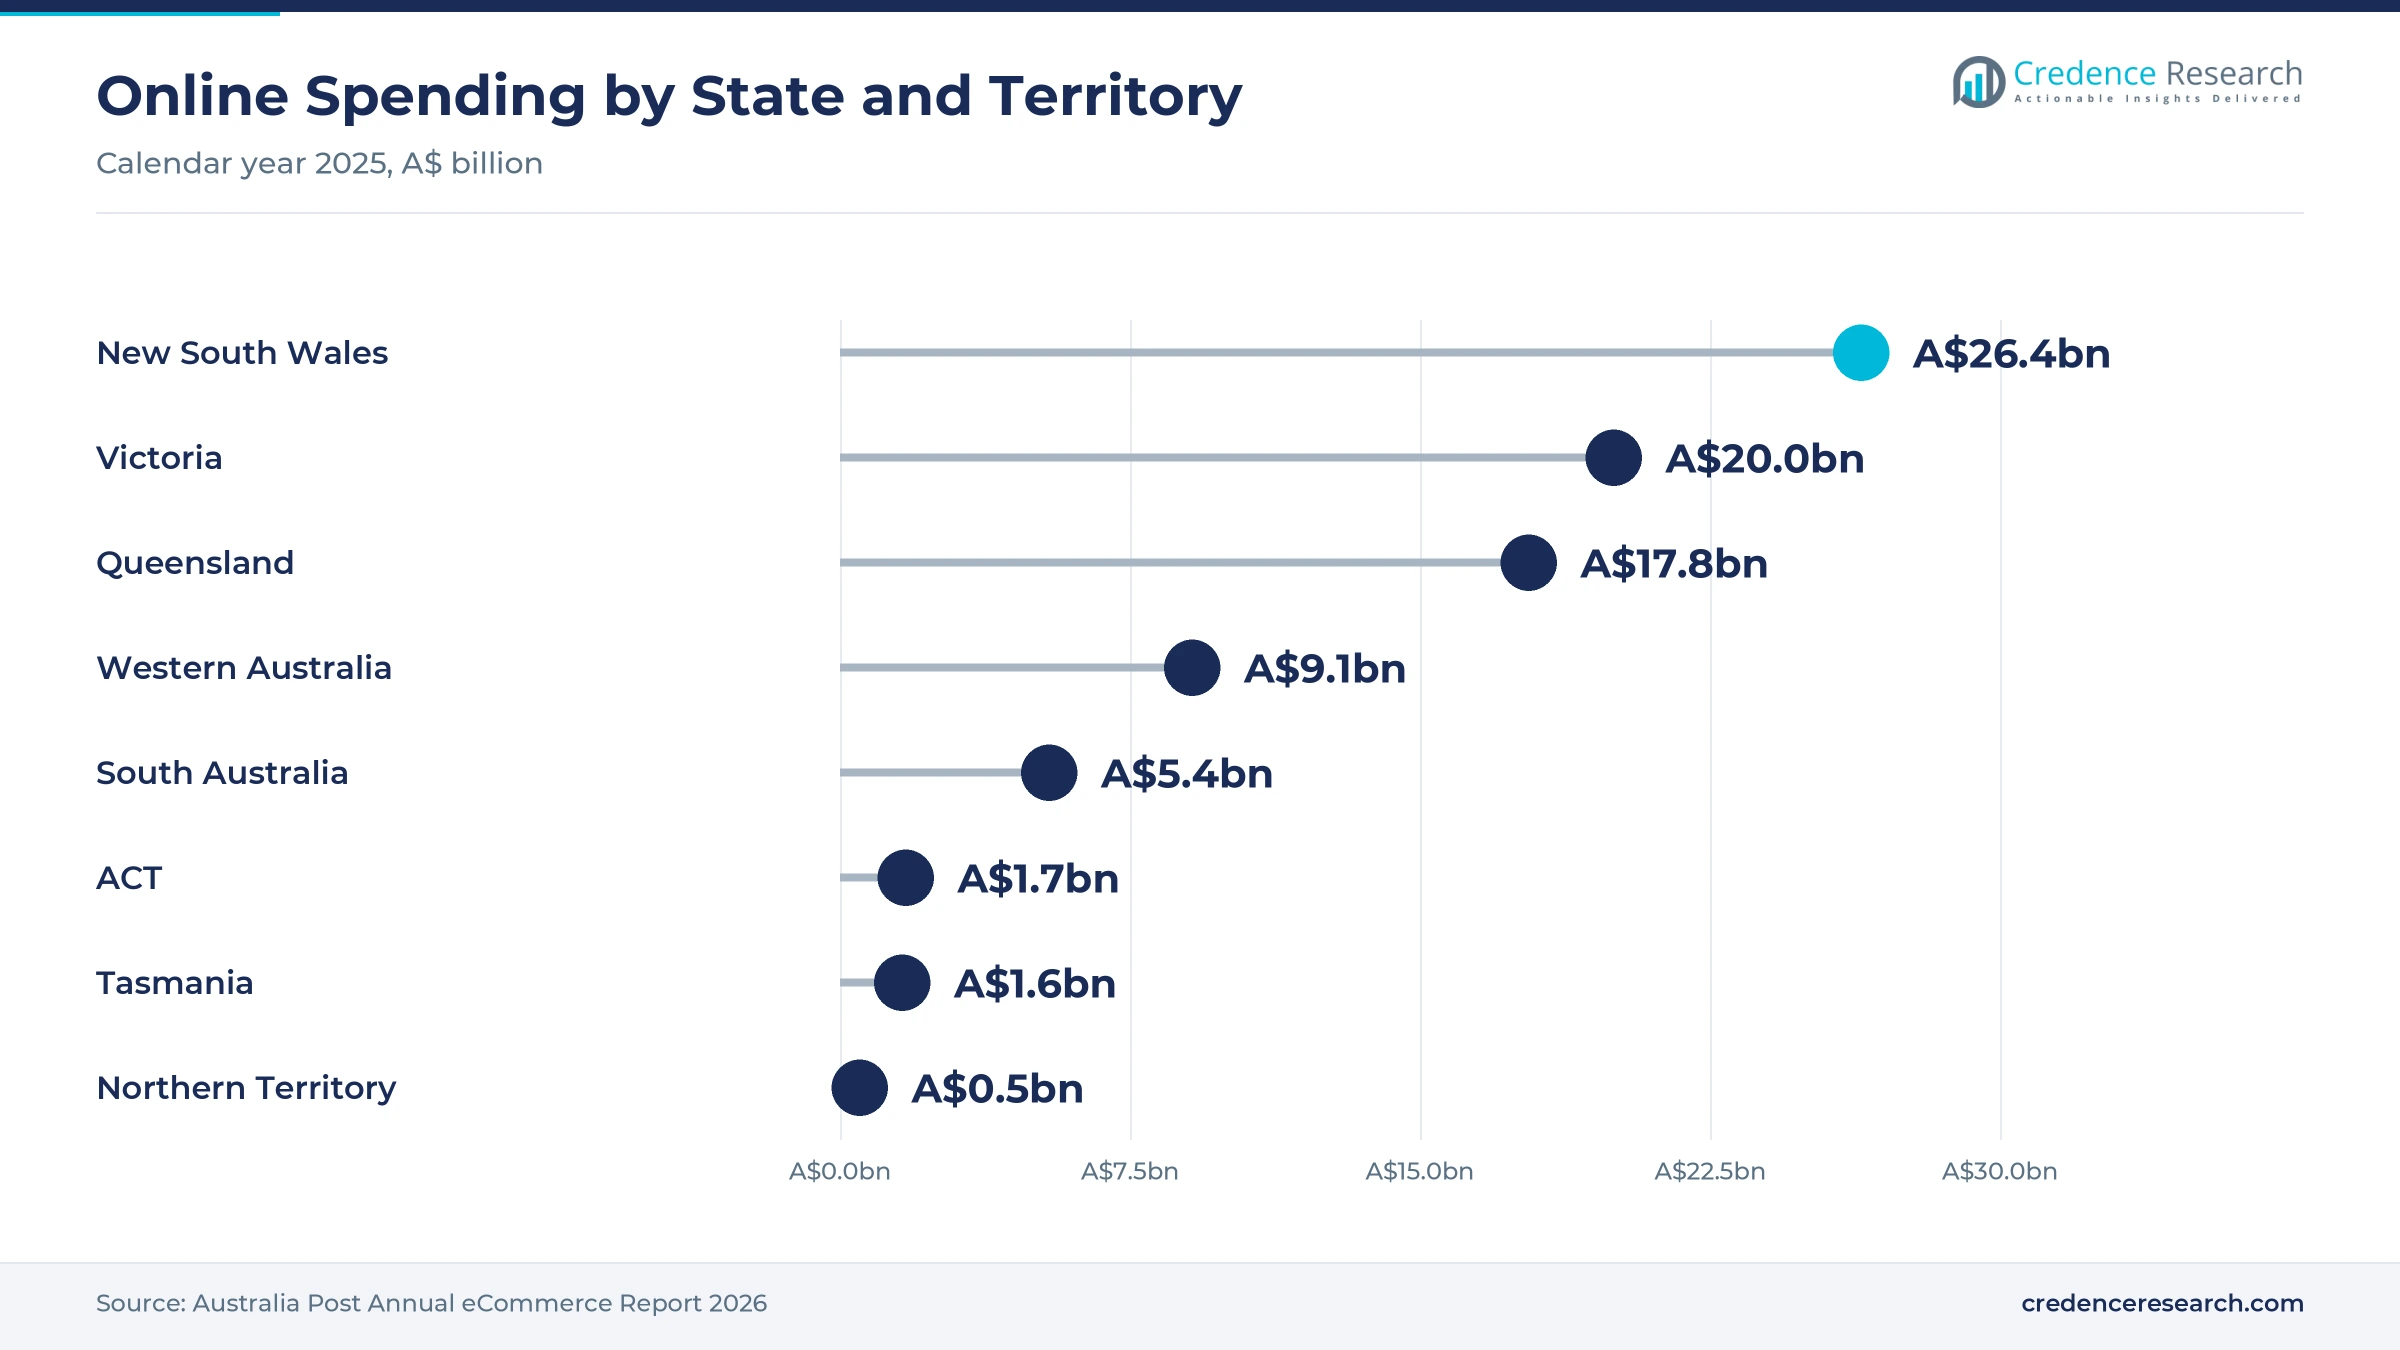
- New South Wales held a 32.3% share of 2025 value, because residents spent A$26.4 billion online in 2025 and the state has 3,139 schools.
- Custom sports apparel and kits led with a 58.0% share of 2025 value, because clubs reorder numbered playing sets, training wear and supporter merchandise every season.
- Nike Australia ended online ordering for Nike By You on April 7, 2025, which shifted consumer customization toward specialist websites and print-on-demand platforms.
- Generative design grows fastest among technologies at 26.21% a year during 2026–2035, as Printify and Printful give users 15 free AI image attempts each day.
Apparel kits, club buyers and configurators lead value
Why do apparel and kits lead customization value?
Based on product type, the market is categorized into custom sports apparel and kits, custom sports footwear, custom sports accessories and custom sports hard equipment. Custom Sports Apparel and Kits led with a 58.0% share of 2025 value, because clubs and schools reorder numbered playing sets and training wear each season. Custom Sports Accessories grow fastest at 25.87% a year, as bags, caps and bottles suit low-cost single orders with AI-generated artwork.
How do club buyers shape online ordering budgets?
Based on customer type, the market is categorized into individual consumers, sports clubs and teams, schools and universities, and event and corporate buyers. Sports Clubs and Teams led with a 39.0% share of 2025 value, because community clubs buy full kits with names, numbers and sponsor logos every year. Schools and Universities grow fastest at 26.05% a year, as schools move uniform and carnival orders onto online portals.
Which AI functions carry most of the order value?
Based on technology, the market is categorized into generative design, fit recommendation, configuration recommendation and AI artwork preparation. Configuration Recommendation led with a 38.0% share of 2025 value, because guided color, template and placement choices sit in nearly every kit ordering flow. Generative Design grows fastest at 26.21% a year, as prompt-based image tools let buyers create artwork without a designer.
Why do specialist websites lead online channels?
Based on distribution channel, the market is categorized into brand-owned websites, specialist customization websites, marketplace storefronts and club procurement portals. Specialist Customization Websites led with a 41.0% share of 2025 value, because teamwear and print specialists offer full design tools and team name panels. Club Procurement Portals grow fastest at 26.12% a year, as clubs collect sizes and payments online.
| Segment Group | Leading Sub-segment | Share, 2025 | Fastest-growing Sub-segment | CAGR, 2026–2035 |
|---|---|---|---|---|
| By Product Type | Custom Sports Apparel and Kits | 58.0% | Custom Sports Accessories | 25.87% |
| By Customer Type | Sports Clubs and Teams | 39.0% | Schools and Universities | 26.05% |
| By Technology | Configuration Recommendation | 38.0% | Generative Design | 26.21% |
| By Distribution Channel | Specialist Customization Websites | 41.0% | Club Procurement Portals | 26.12% |
Request a Free Sample
Fill in your details and we'll send you a free sample report.
- Sample data tables & charts
- Research methodology
AI tools, club reorders and online habits lift demand
How does embedded AI design access lift online orders?
AI design tools now sit inside the ordering flow, so buyers without design skills can turn a rough idea into print-ready artwork in one session. The print-on-demand platforms Printify and Printful each give registered users 15 free AI image generation attempts a day, and Printful upscales each 1,024-pixel image automatically before production. VistaPrint lists its AI Logomaker on its Australian site beside team T-shirts that carry individual names and numbers. The National AI Centre found that about 43% of Australian SMEs used AI between December 2025 and February 2026, with 54% of adopters using it for content generation, in its SME AI adoption insights. As a result, Generative Design grows fastest at 26.21% a year as clubs and small businesses create their own artwork.
Why does repeat teamwear procurement anchor demand?
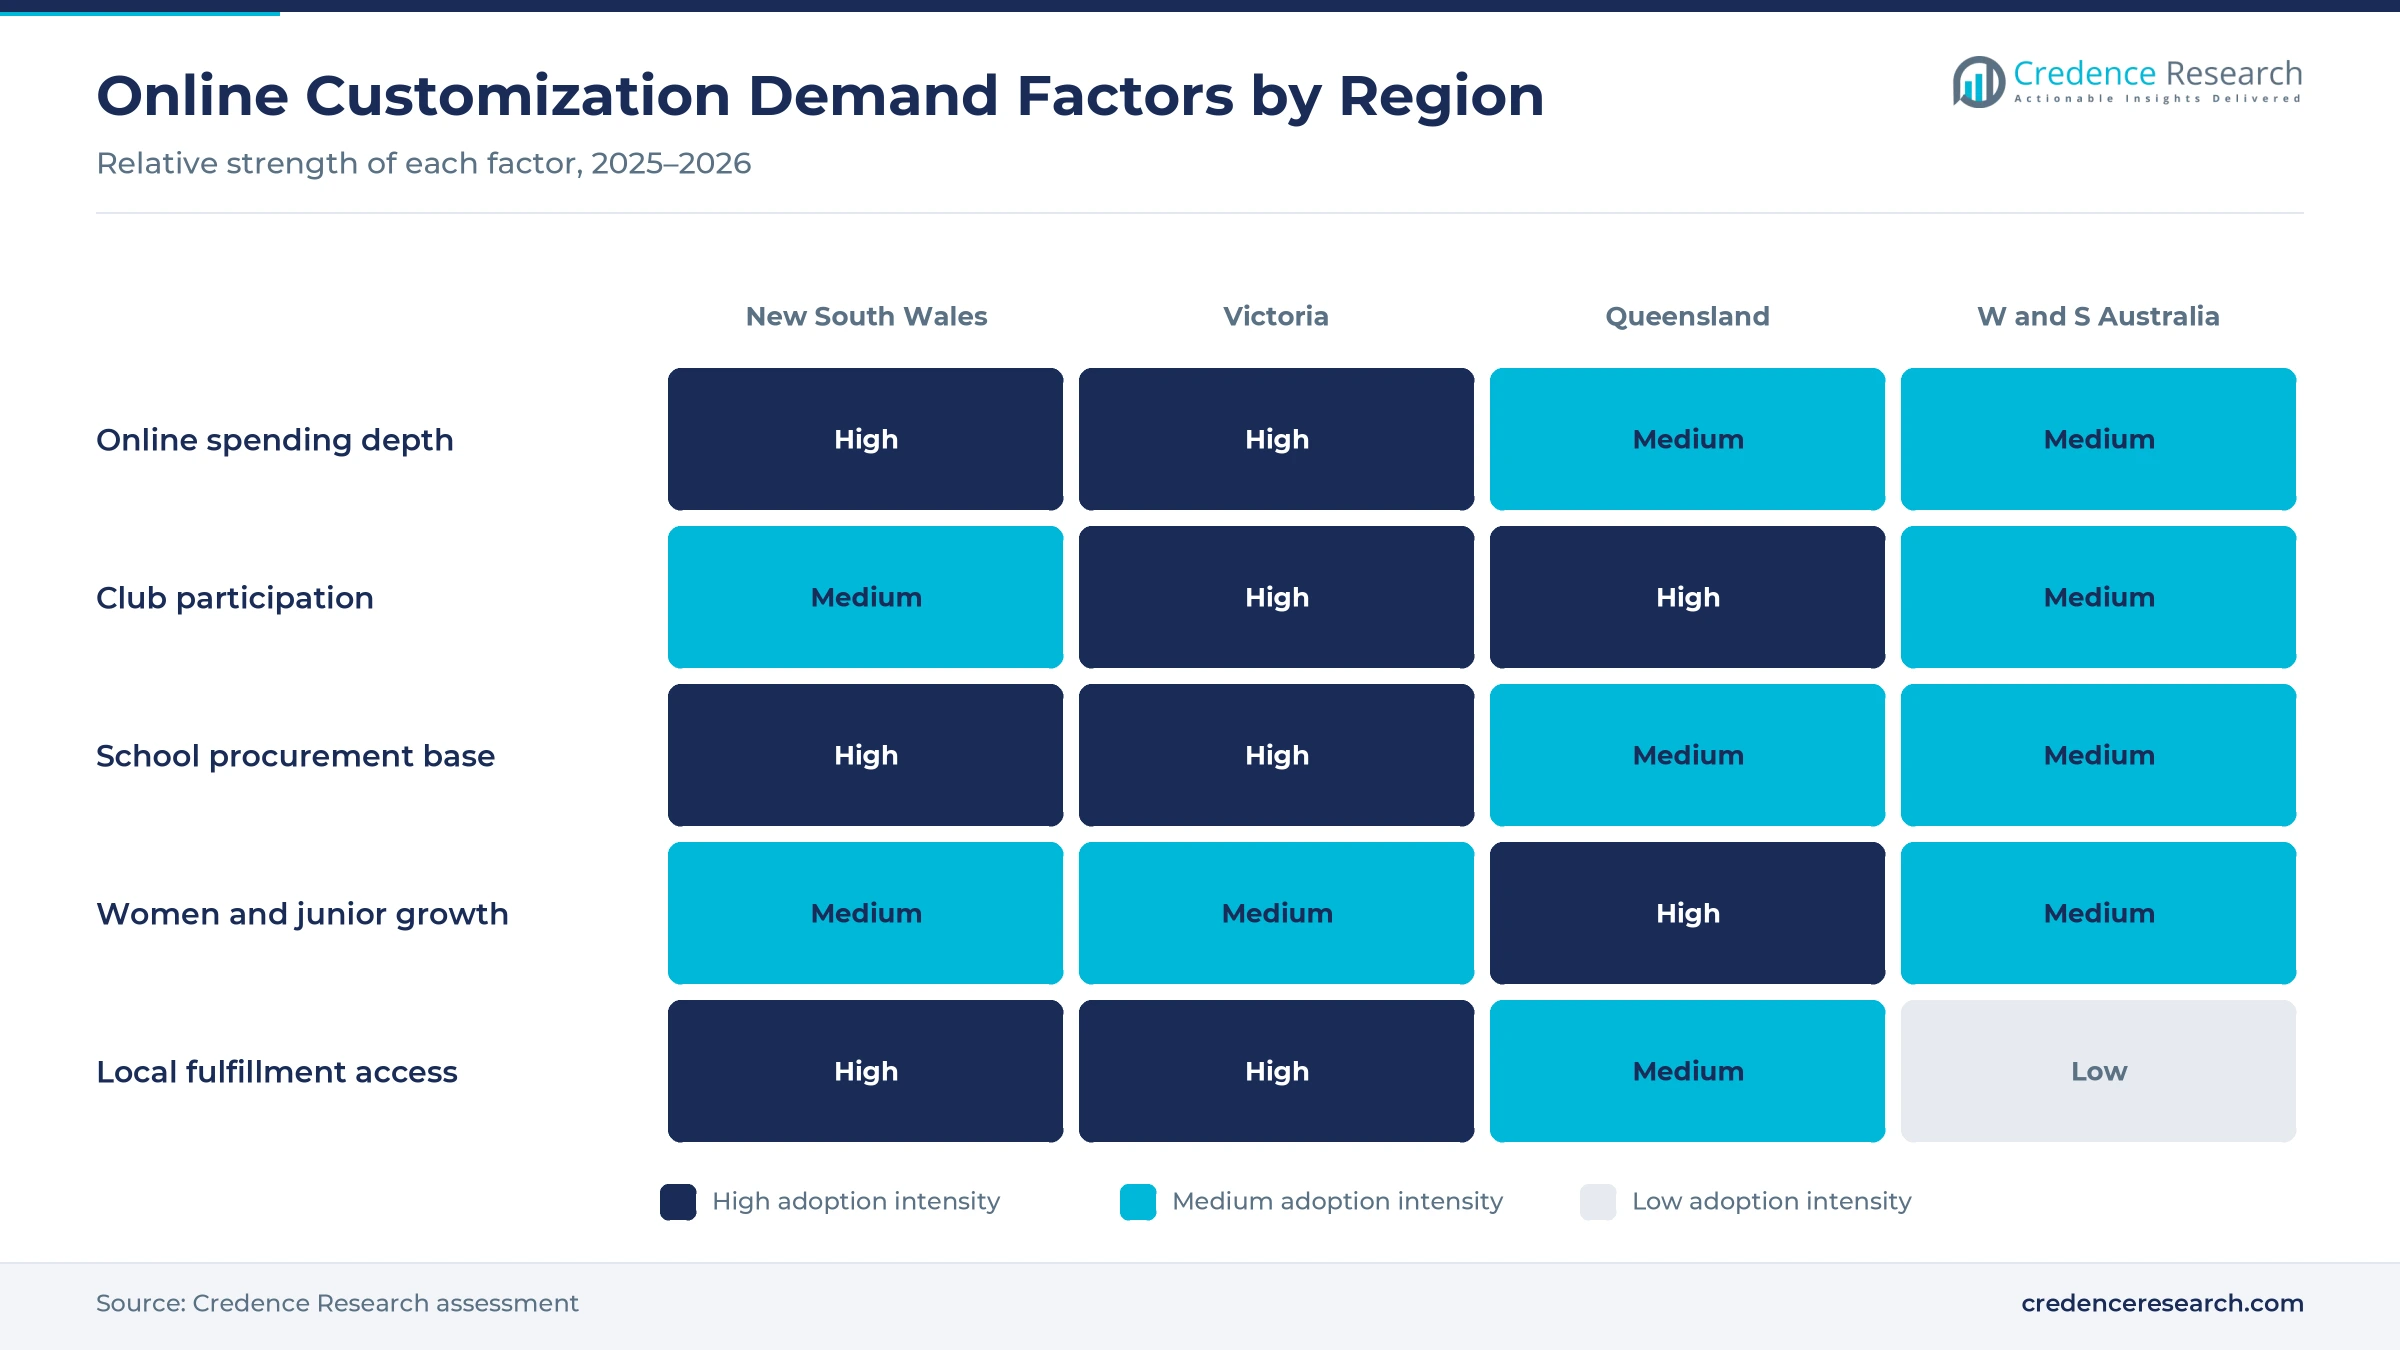
Community clubs buy new playing kits, training wear and supporter merchandise every season, which turns each club into a repeat online customer. Football Australia counted 1.93 million participants in 2025 across more than 3,300 community clubs, of which 2,219 take registrations. The AFL reported a record 625,000 participants in 2025, up 7% from 580,000 a year earlier. ISC Sport, which serves more than 2,500 amateur clubs, leagues and schools, called October 2025 its biggest month as clubs ordered ranges ahead of the 2026 pre-season. As a result, Sports Clubs and Teams led with 39.0% of 2025 value, because reorders of numbered kits and sponsor changes recur every year.
How do established digital purchasing habits widen the base?
Australians already buy clothing online at scale, so customized kit and gear fit into an established purchasing habit rather than a new behavior. Australians spent a record A$82.6 billion online in 2025, about 24% of all retail spending, and 9.8 million households, or 82% of homes, shopped online, according to Australia Post. Fashion and apparel accounted for A$11.6 billion of that online spend, according to the same annual eCommerce report. The World Bank records that 96.1% of Australians used the internet in 2024, which leaves few buyers outside online channels. In turn, specialist customization websites led channels with 41.0% of 2025 value, as buyers already trust online checkout for apparel.
Why does female participation growth add new kit buyers?
Female participation is rising faster than overall participation, and every new women's or girls' team needs fitted kits that standard men's ranges do not supply. The AFL reported that women's and girls' participation grew 14% in 2025 and now makes up nearly a quarter of all participants. Girls' Superkick participation rose more than 212% to almost 10,500, which adds junior teams that order sized playing sets. Football Australia counted 231,435 women and girls across outdoor, futsal and social formats in 2025. As a result, fit recommendation tools gain relevance, because women's cuts and junior sizes raise the risk of costly reorders for clubs.
3D configurators and specialist sites reshape ordering
How is the rise of 3D configurators changing club orders?
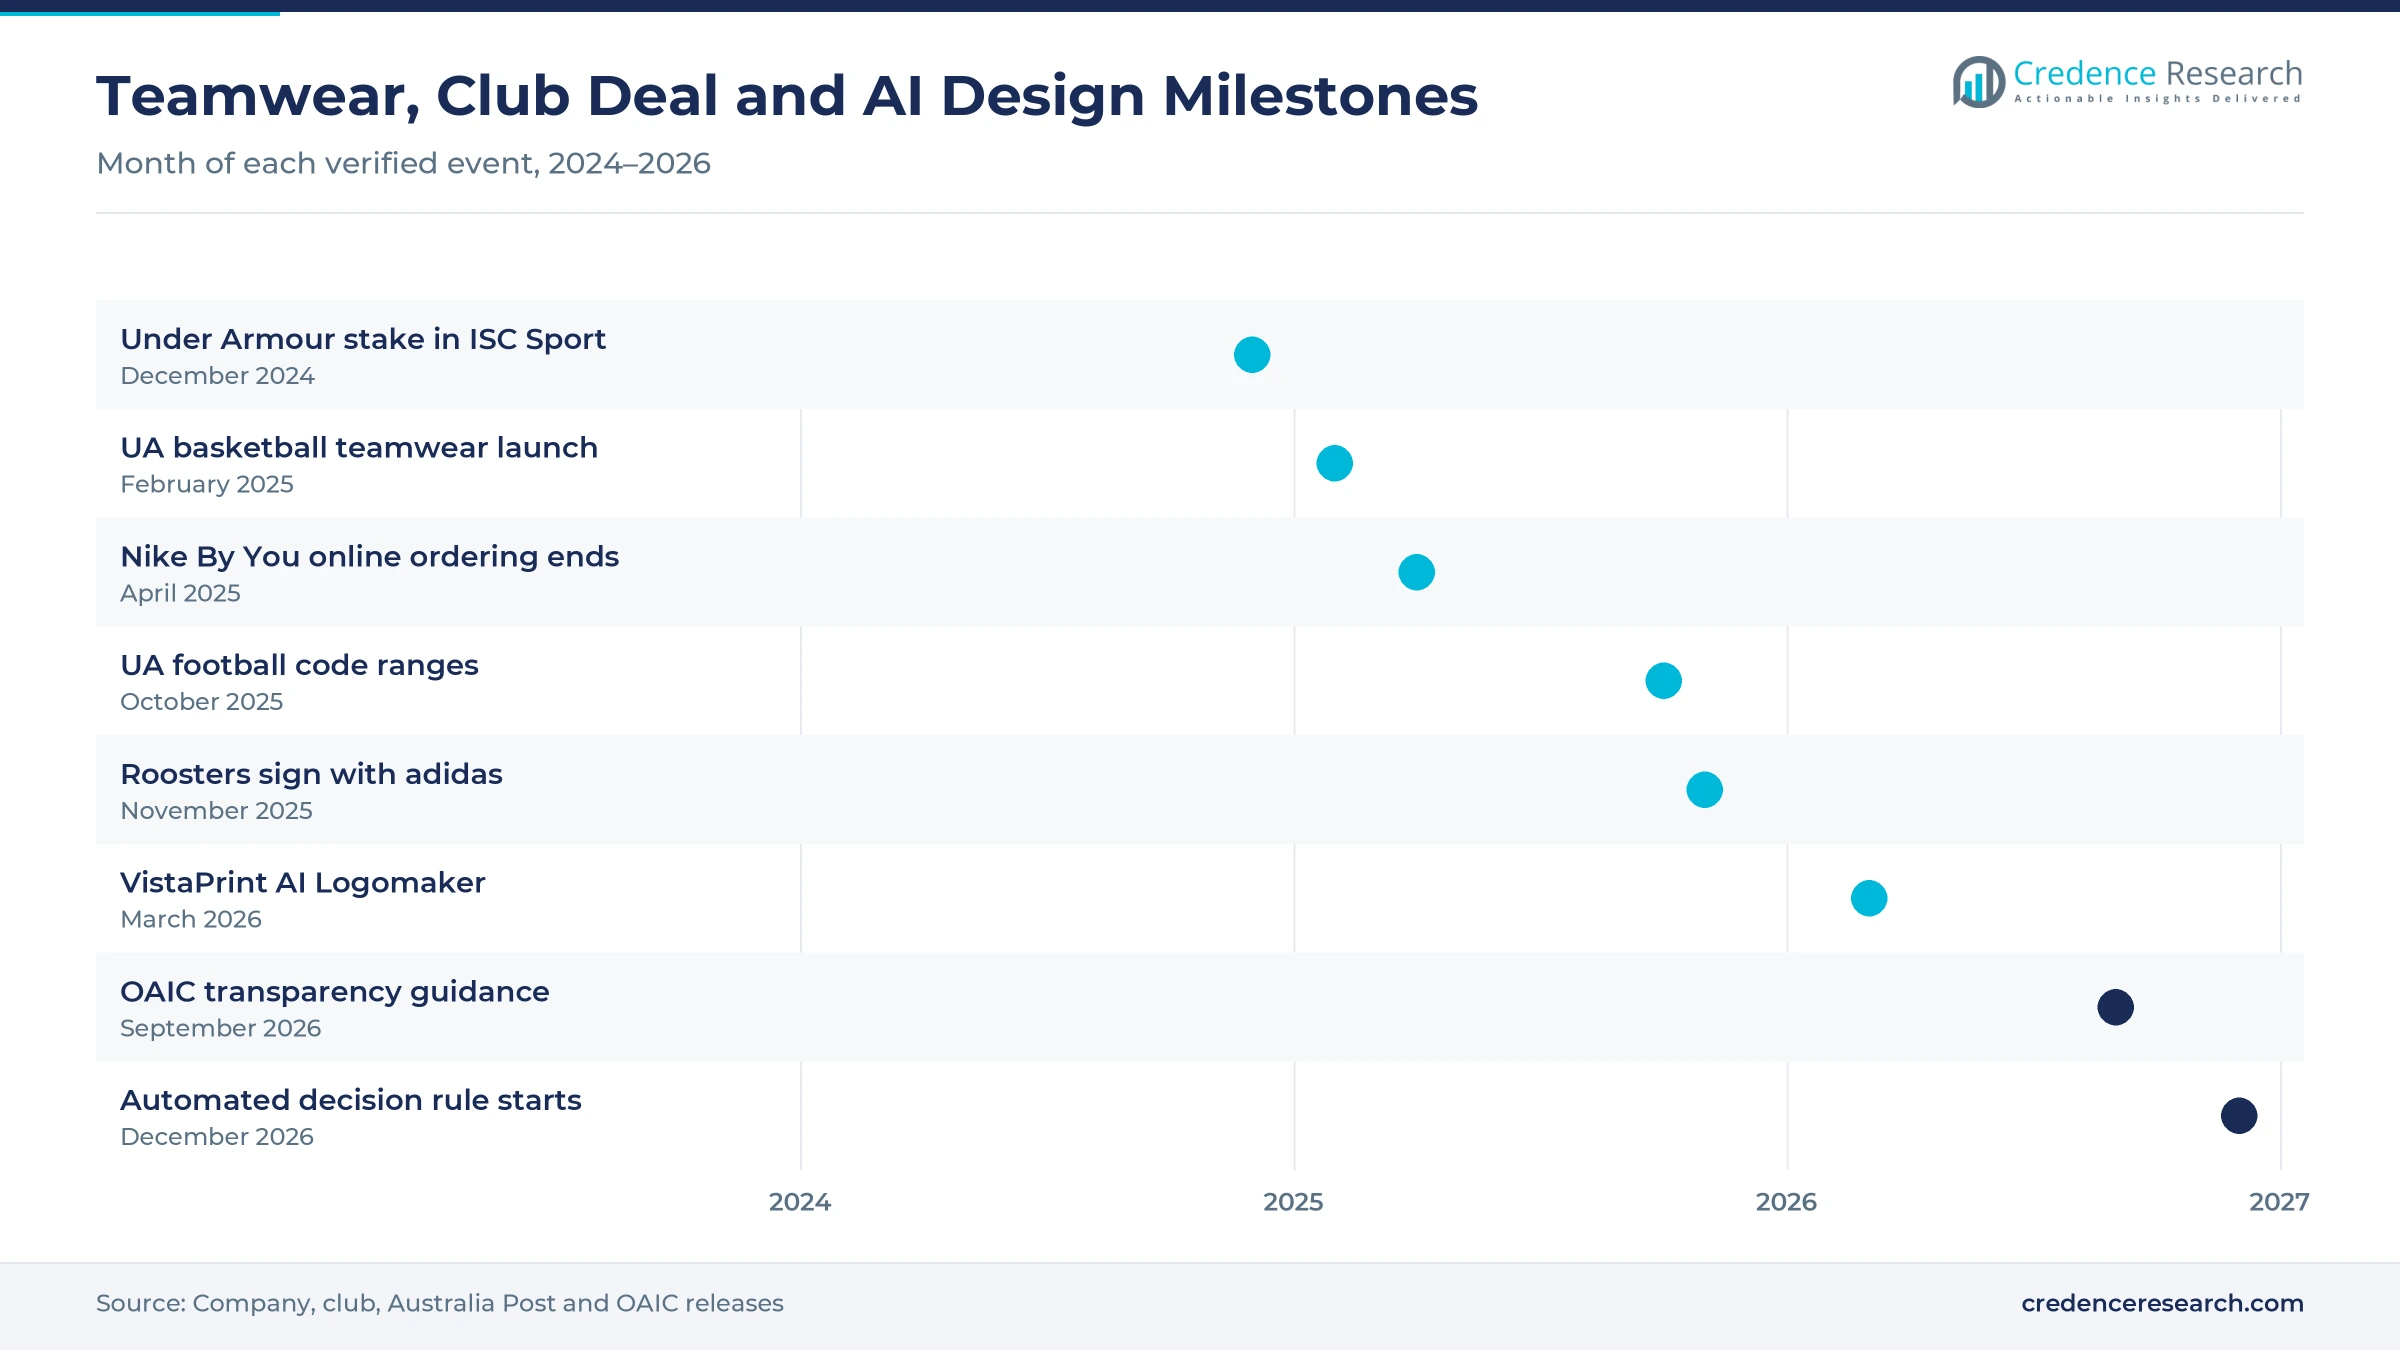
Club buyers increasingly design kits on screen in three dimensions before they commit to a production run, which shortens approval cycles between committees and suppliers. Australian buyers can customize colors, logos, text and sponsors in real time in the owayo 3D Kit Designer, and each item is produced in Germany. Under Armour took a stake in ISC Sport, which reaches more than 800,000 athletes a year, in December 2024, and the first phase included an online customizer for custom uniforms, according to Ragtrader. VistaPrint lets a buyer design one shirt and then add each player's name and number through a team panel in its design studio. In turn, configuration recommendation holds 38.0% of 2025 value as the base layer of most ordering flows.
Why is customization shifting from big brands to specialists?
Large footwear brands have narrowed consumer customization in Australia, while specialist websites and teamwear partners take a larger role. Nike Australia ended online ordering for Nike By You on April 7, 2025, according to Sneaker Freaker, closing a service that began as Nike iD in 2000 and let buyers design their own sneakers. Brands now concentrate on club supply deals, with adidas starting a four-year apparel partnership with the Sydney Roosters from the 2026 season. Under Armour also secured 2026 partnerships with the Canberra Raiders, Hawthorn and the NSW Waratahs through ISC Sport. As a result, custom sports footwear grows more slowly than other product types, while specialist websites remain the largest online channel.
Can standards-based fit tools cut costly remakes?
Fit errors are expensive in custom orders because a named and numbered garment cannot be resold, which creates an opening for fit recommendation tools. ISO 9407:2019 defines the Mondopoint system for designating footwear size from foot measurements, and the ISO standard was last reviewed and confirmed in 2026. That gives boot and shoe customizers a measurement basis for size advice rather than brand-specific size charts. Junior and women's teams add size complexity, because each new team needs cuts and sizes that standard men's ranges do not cover. In turn, vendors that link body or foot measurements to size advice can reduce remakes and win repeat club accounts.
Is there an opening in school sport procurement?
Schools buy sport uniforms, house shirts and carnival gear in recurring cycles, which creates an opening for online portals that replace paper order forms. The ABS counted 9,673 schools and 4,160,918 students in Australia in 2025, including 3,139 schools in New South Wales and 2,295 in Victoria. ISC Sport already counts schools among its more than 2,500 club, league and school customers. Club procurement portals that collect individual sizes and payments online fit this buying pattern well. As a result, Schools and Universities grow fastest at 26.05% a year, and Club Procurement Portals grow fastest at 26.12% a year.
Privacy rules, artwork rights and lead times slow uptake
How do new automated decision rules affect fit tools?
From Dec. 10, 2026, APP entities must describe in their privacy policies the personal information used by programs that make decisions that significantly affect individuals, according to the OAIC. Fit and recommendation tools that use body measurements may need review to decide whether the obligation applies. As a result, smaller customization websites face legal and documentation costs that large brands absorb more easily. Clear privacy notices and data minimization reduce the burden for most vendors.
Why does AI artwork raise club logo and rights risk?
Generative tools can produce artwork that resembles club crests, league marks or licensed designs, which exposes websites to takedown requests and infringement claims. Printify states that AI designs are available for commercial use subject to third-party AI tool terms, which leaves part of the rights review with the seller. As a result, clubs and print providers must check artwork before production starts. Vendors respond with manual artwork review, logo upload checks and licensed template libraries.
How do production lead times limit late orders?
Many custom kits are produced offshore, and seasonal deadlines leave little room for shipping delays or remakes. Because owayo produces each item in Germany, Australian clubs must plan orders around international freight. Peak demand also clusters before each season, as ISC Sport called October 2025 its biggest month. In turn, suppliers with local print partners, such as the two Australian facilities Printful added in 2020, can promise delivery in two to five days in most areas.
Why do small online baskets pressure custom margins?
Online shoppers in Australia spend modest amounts per order, which makes setup costs for custom artwork hard to recover on single items. Australia Post reported an average online basket of A$96 in 2025, down about A$10 over five years. As a result, websites that customize single shirts or accessories must automate artwork preparation to protect margins. Bundled team packs and minimum spends for embroidery help offset the fixed cost of each new design.
New South Wales leads while Queensland grows fastest
| Region | Value, 2025 (USD million) | Share, 2025 | CAGR, 2026–2035 |
|---|---|---|---|
| New South Wales | 13.1 | 32.3% | 25.09% |
| Western and Southern Australia | 9.7 | 24.0% | 25.19% |
| Victoria | 9.7 | 23.9% | 24.89% |
| Queensland | 8.0 | 19.8% | 25.79% |
Why does New South Wales hold the top share?
New South Wales held 32.3% of 2025 value and grows at 25.09% a year, because it has the largest online spend and the largest school system in the country. Residents spent A$26.4 billion online in 2025, the highest of any state, according to the Australia Post report. The ABS counted 3,139 schools and 1,257,730 students in the state in 2025. As a result, NSW buyers order across individual, club and school channels, while clubs such as the Sydney Roosters move to new apparel partners from 2026.
How does football culture shape demand in Victoria?
Victoria held 23.9% of 2025 value and grows at 24.89% a year, because Australian football participation is concentrated in the state. The AFL counted more than 250,000 participants in Victoria in 2025, the largest of any state. Victorians spent A$20 billion online in 2025, and the state had 2,295 schools. In turn, Victorian clubs generate steady reorders of guernseys, training wear and supporter merchandise, which keeps club procurement portals in regular use.
Why does Queensland grow fastest?
Queensland held 19.8% of 2025 value and grows fastest at 25.79% a year, because junior and women's participation is rising quickly across the state. The AFL reported more than 91,000 Queensland participants in 2025, second nationally, with women and girls' coaching up more than 25%. Queenslanders spent A$17.8 billion online in 2025, the third-highest total among the states in the Australia Post report. As a result, regional clubs and schools rely on online ordering where local print capacity is thin.
How do Western and Southern Australia buy custom kits?
Western and Southern Australia held 24.0% of 2025 value and grows at 25.19% a year, because strong club sport offsets smaller populations. The AFL counted about 90,000 participants in Western Australia, 70,500 in South Australia and 24,000 in Tasmania in 2025. Online spend reached A$9.1 billion in Western Australia and A$5.4 billion in South Australia. In turn, long freight distances favor suppliers with predictable e-commerce fulfillment and online proofs that avoid remakes.
Teamwear stakes, club deals and AI design launches
| Development | Status and market relevance |
|---|---|
| In December 2024, Under Armour took a stake in Australian custom teamwear provider ISC Sport. | ISC product lines move to Under Armour Teamwear |
| In April 2025, Nike Australia ended online ordering for its Nike By You customization service. | Shifts consumer customization toward specialists |
| In October 2025, ISC Sport launched Under Armour rugby league, rugby union and Aussie rules ranges. | Ranges released ahead of the 2026 pre-season |
| In November 2025, the Sydney Roosters signed a four-year apparel partnership with adidas from 2026. | Covers NRL, NRLW and pathways programs |
| In March 2026, VistaPrint launched AI Logomaker, a generative AI logo design tool for small businesses. | Listed on the VistaPrint Australia site |
Generative design, fit advice and artwork automation
- Generative design engines turn text prompts into artwork, with Printify and Printful each offering 15 free image attempts a day inside their product designers.
- Configuration engines guide color, template, logo and sponsor placement on 3D product models, as in the owayo 3D Kit Designer.
- Fit recommendation tools map body or foot measurements to size advice, which can draw on the ISO 9407 Mondopoint system for footwear.
- Artwork preparation tools upscale, clean and remove backgrounds from images, as Printful does when it upscales AI images for production.
Need a Custom Version of This Report?
Tailor the scope, geography, or segments to your exact requirements.
- Custom geography or segment scope
- Direct access to our analyst team
Brands, teamwear specialists and print platforms compete
Competition combines global sportswear brands, teamwear specialists and print platforms that also sell broader custom apparel. Under Armour reached Australian clubs through its stake in ISC Sport, which designed 2026 ranges for the Canberra Raiders, Hawthorn and the NSW Waratahs. The Sydney Roosters wear adidas apparel from 2026, and Puma supplies Essendon guernseys that fans can buy online. Nike ended online ordering for Nike By You in Australia in April 2025, which narrowed brand-led consumer customization. Super Retail Group's rebel chain runs 162 stores, and online channels made up 18% of its fiscal 2026 sales. VistaPrint sells team T-shirts and teamwear in Australia with no minimum order quantity on many items, while owayo sells German-made custom kits through a 3D designer. Printful and Printify serve Australian merchants through local print partners. Rivals compete on design tools, delivery time, fit accuracy and club service.
Which brands, teamwear specialists and platforms lead?
| Company | Type | Role in the market |
|---|---|---|
| Nike | Global brand | Ended Nike By You online ordering in Australia in April 2025 |
| Adidas | Global brand | Four-year apparel partner of the Sydney Roosters from 2026 |
| Rebel | Sports retailer | 162 stores with online channels at 18% of sales |
| VistaPrint | Specialist customization website | Team T-shirts with name and number panels |
| Under Armour | Teamwear brand | Shareholder in ISC Sport with an online customizer |
| Puma | Global brand | Official apparel partner of Essendon |
| Printful | Print-on-demand platform | Australian partner facilities and AI image generator |
| Printify | Print-on-demand platform | Local print providers including The Print Bar |
| owayo | Specialist customization website | 3D Kit Designer with German production |
Credence Research view on online kit customization
Credence Research's view is that online customization in Australia will grow quickly because clubs reorder kits every season and AI tools remove the need for a designer. Club buyers remain the core of spending, yet schools and generative design add the fastest growth as procurement moves online. The retreat of brand-led footwear customization favors specialist websites and teamwear partners with strong club service. Vendors that pair configurators with reliable fit advice, local production and clear privacy practices should gain the most share by 2035.
Public data and modeling behind the kit order figures
The report uses 2025 as the base year on a calendar basis, and market values come from the Credence Research model. That model draws on postal operator data on online spending, national statistics on schools and internet use, sport governing body participation reports, regulator guidance and company releases on teamwear, partnerships and AI design tools. Segment splits, zone shares and zone growth rates are Credence Research estimates. Sources used are official statistics, regulator releases, standards bodies, sport body reports and company releases, and no interviews or surveys were used.
Club portals and generative design shape demand to 2035
The Australia AI in sports equipment online customization market is expected to reach USD 379.0 million by 2035, a 25.21% CAGR during 2026–2035, as clubs, schools and individuals move more custom orders onto AI-assisted websites. Growth should be strongest in generative design, club procurement portals and Queensland, because these areas gain most from new teams and online ordering. Privacy obligations, artwork rights and offshore lead times could slow some sales, while local print partners and fit tools should reduce remakes for club buyers.
Frequently Asked Questions
How big is the Australia AI in sports equipment online customization market?
Which product type leads online customization value?
Which region leads the market?
How much do Australians spend online?
What happened to Nike By You in Australia?
Which AI technology grows fastest?
Who are the leading companies in Australian online sports customization?
What are the main challenges for customization websites?
Table of Content
Chapter 1 Market Segmentation
- 1.1 Segmentation Framework
- 1.1.1 Product and Service Classification
- 1.1.2 Application and End-Use Classification
- 1.1.3 Technology and Solution Classification
- 1.1.4 Customer and Distribution Channel Classification
- 1.1.5 Geographic Segmentation
- 1.1.6 Market Segment Definitions and Boundaries
- 1.2 By Product Type
- 1.2.1 Custom Sports Apparel and Kits
- 1.2.2 Custom Sports Footwear
- 1.2.3 Custom Sports Accessories
- 1.2.4 Custom Sports Hard Equipment
- 1.3 By Customer Type
- 1.3.1 Individual Consumers
- 1.3.2 Sports Clubs and Teams
- 1.3.3 Schools and Universities
- 1.3.4 Event and Corporate Buyers
- 1.4 By Technology
- 1.4.1 Generative Design
- 1.4.2 Fit Recommendation
- 1.4.3 Configuration Recommendation
- 1.4.4 AI Artwork Preparation
Chapter 2 Introduction
- 2.1 Report Objectives and Scope
- 2.2 Product Definition and Industry Terminology
- 2.3 Market Inclusions and Exclusions
- 2.4 Research Process
- 2.4.1 Primary Research and Expert Interviews
- 2.4.2 Secondary Research and Source Review
- 2.4.3 Top-Down and Bottom-Up Estimation
- 2.4.4 Data Triangulation and Verification
- 2.5 Market Size Measurement Basis
- 2.5.1 2025: USD 40.5 million → 2035: USD 379.0 million
- 2.6 Historical and Forecast Reference Periods
- 2.6.1 Historical Period: 2018-2025
- 2.6.2 Base Year: 2025
- 2.6.3 Forecast Period: 2025-2035
- 2.7 Research Assumptions and Limitations
Chapter 3 Executive Summary
- 3.1 Market Snapshot and Key Findings
- 3.2 Base-Year Market Size, 2025
- 3.3 Forecast Market Size, 2035
- 3.4 Revenue and Volume Growth Outlook
- 3.5 Key Demand and Supply Indicators
- 3.6 Leading Market Segments
- 3.7 Fastest-Growing Market Opportunities
- 3.8 Regional Performance Highlights
- 3.9 Technology and Industry Transformation
- 3.10 Competitive Landscape Summary
- 3.11 Analyst View and Strategic Implications
Chapter 4 Australia AI in Sports Equipment Online Customization Market Trends and Developments
- 4.1 Historical Industry Development, 2018-2025
- 4.2 Recent Market Trends and Developments
- 4.3 Demand and Customer Behavior Trends
- 4.4 Technology and Product Innovation
- 4.5 Artificial Intelligence, Automation and Digitalization
- 4.6 Local Manufacturing and Supply Chain Realignment
- 4.7 Industry Partnerships, Mergers and Acquisitions
- 4.8 Sustainability and Circular Economy Developments
- 4.9 Government and Private Sector Investment Trends
- 4.10 Emerging Business Models and Commercialization
- 4.11 Industry Developments and Announcements
Chapter 5 Australia AI in Sports Equipment Online Customization Market Production, Supply and Demand Analysis
- 5.1 Demand Trend and Consumption Analysis, 2018-2025
- 5.2 Demand Forecast, 2025-2035
- 5.3 Production and Output Trend, 2018-2025
- 5.4 Production and Output Forecast, 2025-2035
- 5.5 Installed Capacity and Capacity Utilization
- 5.6 Company-Wise Production Plants and Statistics
- 5.6.1 Installed Production Capacity
- 5.6.2 Actual Production
- 5.6.3 Planned Capacity and Expansion Targets
- 5.7 Supply Chain Structure and Procurement Trends
- 5.8 Supply-Demand Gap and Bottlenecks
- 5.9 Import Dependence and Sourcing Structure
- 5.10 Contract Manufacturing and Outsourcing
- 5.11 Regional Supply and Demand Concentration
Chapter 6 Australia AI in Sports Equipment Online Customization Market Pricing Analysis
- 6.1 Pricing Structure and Measurement
- 6.2 Historical Pricing Trends, 2018-2025
- 6.3 Pricing Outlook, 2025-2035
- 6.4 Average Selling Price and Unit Economics
- 6.5 Pricing by Product and Market Segment
- 6.6 Geographic Pricing Differences
- 6.7 Key Input, Energy, Labor and Logistics Costs
- 6.8 Contract Pricing and Purchasing Models
- 6.9 Pricing Sensitivity and Competitive Positioning
- 6.10 Price, Margin and Profitability Implications
Chapter 7 Australia AI in Sports Equipment Online Customization Market Dynamics
- 7.1 Market Growth Drivers
- 7.1.1 Demand-Side Drivers
- 7.1.2 Technology and Innovation Drivers
- 7.1.3 Infrastructure and Investment Drivers
- 7.1.4 Regulatory and Policy Drivers
- 7.2 Market Restraints
- 7.2.1 Cost and Affordability Constraints
- 7.2.2 Technology and Adoption Barriers
- 7.2.3 Supply Chain and Operational Constraints
- 7.3 Market Challenges
- 7.3.1 Competitive Pressure and Margin Erosion
- 7.3.2 Skills, Infrastructure and Implementation Gaps
- 7.4 Emerging Market Opportunities
- 7.5 Market Dynamics Impact and Time-Horizon Assessment
Chapter 8 Australia AI in Sports Equipment Online Customization Value Chain Analysis
- 8.1 Industry Value Chain Overview
- 8.2 Upstream Suppliers and Critical Inputs
- 8.3 Technology and Component Providers
- 8.4 Manufacturing or Service Delivery
- 8.5 Distribution, Channel Partners and Integrators
- 8.6 Downstream Applications and End Users
- 8.7 Value Addition and Profit Pools
- 8.8 Vertical Integration and Outsourcing
- 8.9 Supplier Concentration and Risk
- 8.10 Supply Chain Localization and Resilience
Chapter 9 Australia AI in Sports Equipment Online Customization Market Regulations and Policies
- 9.1 Relevant Laws, Standards and Compliance Frameworks
- 9.2 Product, Service, Safety and Quality Requirements
- 9.3 Government Policies, Incentives and Subsidies
- 9.4 Imports, Exports and Trade Barriers
- 9.5 Public Procurement and Local Content Requirements
- 9.6 Environmental and Sustainability Compliance
- 9.7 Upcoming Policy Changes and Market Implications
Chapter 10 Australia AI in Sports Equipment Online Customization Market Hotspots and Opportunities
- 10.1 Market Opportunity Mapping and Growth Hotspots
- 10.2 High-Growth Applications and Customer Groups
- 10.3 Underserved Markets and White-Space Opportunities
- 10.4 Emerging Technology and Product Opportunities
- 10.5 New Capacity and Investment Hotspots
- 10.6 Market Entry and Expansion Opportunities
- 10.7 Distribution and Partnership Opportunities
- 10.8 Near-Term and Long-Term Commercial Potential
- 10.9 Opportunity Attractiveness and Execution Risks
Chapter 11 Australia AI in Sports Equipment Online Customization Market Outlook, 2025-2035
- 11.1 Market Size and Analysis
- 11.1.1 Revenue (Market Measurement: 2025: USD 40.5 million → 2035: USD 379.0 million)
- 11.1.2 Market Volume and Quantity Sold
- 11.1.3 Historical Market Size, 2018-2025
- 11.1.4 Base-Year Market Size, 2025
- 11.2 Market Forecast, 2025-2035
- 11.2.1 Revenue Forecast to 2035
- 11.2.2 Volume Forecast to 2035
- 11.2.3 CAGR and Year-on-Year Growth
- 11.2.4 Incremental Revenue Opportunity
- 11.3 Forecast Assumptions and Scenario Analysis
- 11.3.1 Base-Case Forecast
- 11.3.2 Optimistic and Conservative Scenarios
- 11.3.3 Technology, Pricing and Policy Sensitivities
- 11.4 Market Attractiveness and Growth Outlook
Chapter 12 Australia AI in Sports Equipment Online Customization Market Segmentation and Outlook
- 12.1 Segmentation Summary and Market Shares, 2025
- 12.2 Largest and Fastest-Growing Segments
- 12.3 By Product Type - Market Size and Forecast, 2025-2035
- 12.3.1 Segment Definition and Scope
- 12.3.2 Historical Market Size, 2018-2025
- 12.3.3 Revenue Forecast, 2025-2035
- 12.3.4 Volume Forecast, 2025-2035
- 12.3.5 Base-Year Market Share, 2025
- 12.3.6 Segment CAGR and Growth Drivers
- 12.3.7 Subsegment Market Size and Forecast
- 12.3.7.1 Custom Sports Apparel and Kits
- 12.3.7.2 Custom Sports Footwear
- 12.3.7.3 Custom Sports Accessories
- 12.3.7.4 Custom Sports Hard Equipment
- 12.3.8 Subsegment Pricing and Adoption Trends
- 12.3.9 Leading Suppliers and Competition
- 12.3.10 Regional Demand and Opportunities
- 12.4 By Customer Type - Market Size and Forecast, 2025-2035
- 12.4.1 Segment Definition and Scope
- 12.4.2 Historical Market Size, 2018-2025
- 12.4.3 Revenue Forecast, 2025-2035
- 12.4.4 Volume Forecast, 2025-2035
- 12.4.5 Base-Year Market Share, 2025
- 12.4.6 Segment CAGR and Growth Drivers
- 12.4.7 Subsegment Market Size and Forecast
- 12.4.7.1 Individual Consumers
- 12.4.7.2 Sports Clubs and Teams
- 12.4.7.3 Schools and Universities
- 12.4.7.4 Event and Corporate Buyers
- 12.4.8 Subsegment Pricing and Adoption Trends
- 12.4.9 Leading Suppliers and Competition
- 12.4.10 Regional Demand and Opportunities
- 12.5 By Technology - Market Size and Forecast, 2025-2035
- 12.5.1 Segment Definition and Scope
- 12.5.2 Historical Market Size, 2018-2025
- 12.5.3 Revenue Forecast, 2025-2035
- 12.5.4 Volume Forecast, 2025-2035
- 12.5.5 Base-Year Market Share, 2025
- 12.5.6 Segment CAGR and Growth Drivers
- 12.5.7 Subsegment Market Size and Forecast
- 12.5.7.1 Generative Design
- 12.5.7.2 Fit Recommendation
- 12.5.7.3 Configuration Recommendation
- 12.5.7.4 AI Artwork Preparation
- 12.5.8 Subsegment Pricing and Adoption Trends
- 12.5.9 Leading Suppliers and Competition
- 12.5.10 Regional Demand and Opportunities
- 12.6 Segment Growth Comparison
- 12.7 Segment Attractiveness and Priority Matrix
Chapter 13 Australia AI in Sports Equipment Online Customization End-Use and Application Market Outlook
- 13.1 End-Use Industry and Customer Demand Structure
- 13.2 Leading Applications and Customer Groups
- 13.3 End-Use Market Size, Share and Forecast
- 13.4 Major End-Use Industry Deep Dives
- 13.4.1 Customer Requirements and Use Cases
- 13.4.2 Demand and Replacement Cycles
- 13.4.3 Technical and Regulatory Considerations
- 13.4.4 Purchasing and Procurement Models
- 13.4.5 Leading Vendors and Distribution Channels
- 13.4.6 Forecast and Commercial Opportunities
- 13.5 Emerging Applications and Cross-Segment Demand
- 13.6 End-Use Industry Investment Priorities
Chapter 14 Australia AI in Sports Equipment Online Customization Geographic Market Outlook, 2025-2035
- 14.1 Domestic Market Distribution and Demand Clusters
- 14.2 State- or Province-Wise Market Size and Forecast, 2025-2035
- 14.3 City and Metropolitan Market Outlook
- 14.4 Industrial, Manufacturing and Commercial Clusters
- 14.5 Geographic Concentration of Key End Users
- 14.6 Local Pricing and Purchasing Differences
- 14.7 Domestic Production Facilities and Capacity Map
- 14.8 Local Infrastructure and Project Pipeline
- 14.9 State-Level Policy and Incentive Differences
- 14.10 Subnational Investment Hotspots and Opportunities
- 14.11 Distribution and Logistics Networks
- 14.12 Domestic Competitive Footprint
Chapter 15 Australia AI in Sports Equipment Online Customization Technology, Innovation and Sustainability Outlook
- 15.1 Technology Landscape and Maturity
- 15.2 Product, Process and Service Innovation
- 15.3 AI, Automation and Digital Tools in the Industry
- 15.4 Technology Adoption and Performance Benchmarking
- 15.5 Innovation Pipeline and R&D Investment
- 15.6 Patent and Intellectual Property Trends
- 15.7 Energy Efficiency and Resource Management
- 15.8 Sustainability, Recycling and Circularity
- 15.9 Technology Roadmap, 2025-2035
- 15.10 Risks of Obsolescence and Technology Substitution
Chapter 16 Australia AI in Sports Equipment Online Customization Market Key Strategic Imperatives
- 16.1 Growth and Market Entry Priorities
- 16.2 High-Return Products and Segments
- 16.3 Pricing, Profitability and Cost Optimization
- 16.4 Technology Investment and Product Differentiation
- 16.5 Supply Chain Localization and Resilience
- 16.6 Distribution and Customer Acquisition
- 16.7 Partnership, Acquisition and Capacity Strategy
- 16.8 Regional Expansion Priorities
- 16.9 Short-, Medium- and Long-Term Actions
Chapter 17 Competition Outlook
- 17.1 Industry Competition Characteristics
- 17.2 Market Structure and Concentration
- 17.3 Market Share and Competitive Positioning, 2025
- 17.4 Company-Wise Revenue and Product Benchmarking
- 17.5 Production and Service Capacity Benchmarking
- 17.6 Technology, Pricing and Differentiation
- 17.7 Regional Footprint and Distribution Strength
- 17.8 Mergers, Acquisitions and Strategic Alliances
- 17.9 New Entrants and Competitive Threats
- 17.10 Porter's Five Forces and Industry Attractiveness
- 17.11 Competitive Outlook, 2025-2035
Chapter 18 Company Profiles
- 18.1 Company Coverage and Selection Criteria
- 18.2 Nike
- 18.2.1 Business Description
- 18.2.2 Company Ownership and Geographic Presence
- 18.2.3 Product and Service Portfolio
- 18.2.4 Manufacturing and Operating Footprint
- 18.2.5 Production Capacity and Expansion Plans
- 18.2.6 Financial Performance and Investment
- 18.2.7 Market Share and Competitive Position
- 18.2.8 Technology and Innovation Capabilities
- 18.2.9 Strategic Alliances or Partnerships
- 18.2.10 Recent Developments
- 18.2.11 Growth Strategy and Outlook
- 18.3 Adidas
- 18.4 Rebel
- 18.5 VistaPrint
- 18.6 Under Armour
- 18.7 Puma
- 18.8 Printful
- 18.9 Printify
- 18.10 owayo
- 18.11 Other Relevant Market Participants
Note: Every listed company is profiled on the structure shown under the first company. The company list is preliminary and may change based on research findings, market developments, data availability and client requirements.
Chapter 19 Disclaimer
- 19.1 Research and Forecast Disclaimer
- 19.2 Data Source and Estimation Limitations
Note: The depth of individual sections depends on data availability for this market. Volume, capacity, trade and other unit-based metrics are included where applicable.

