
Short runs and fast turnaround pull fabric print onshore
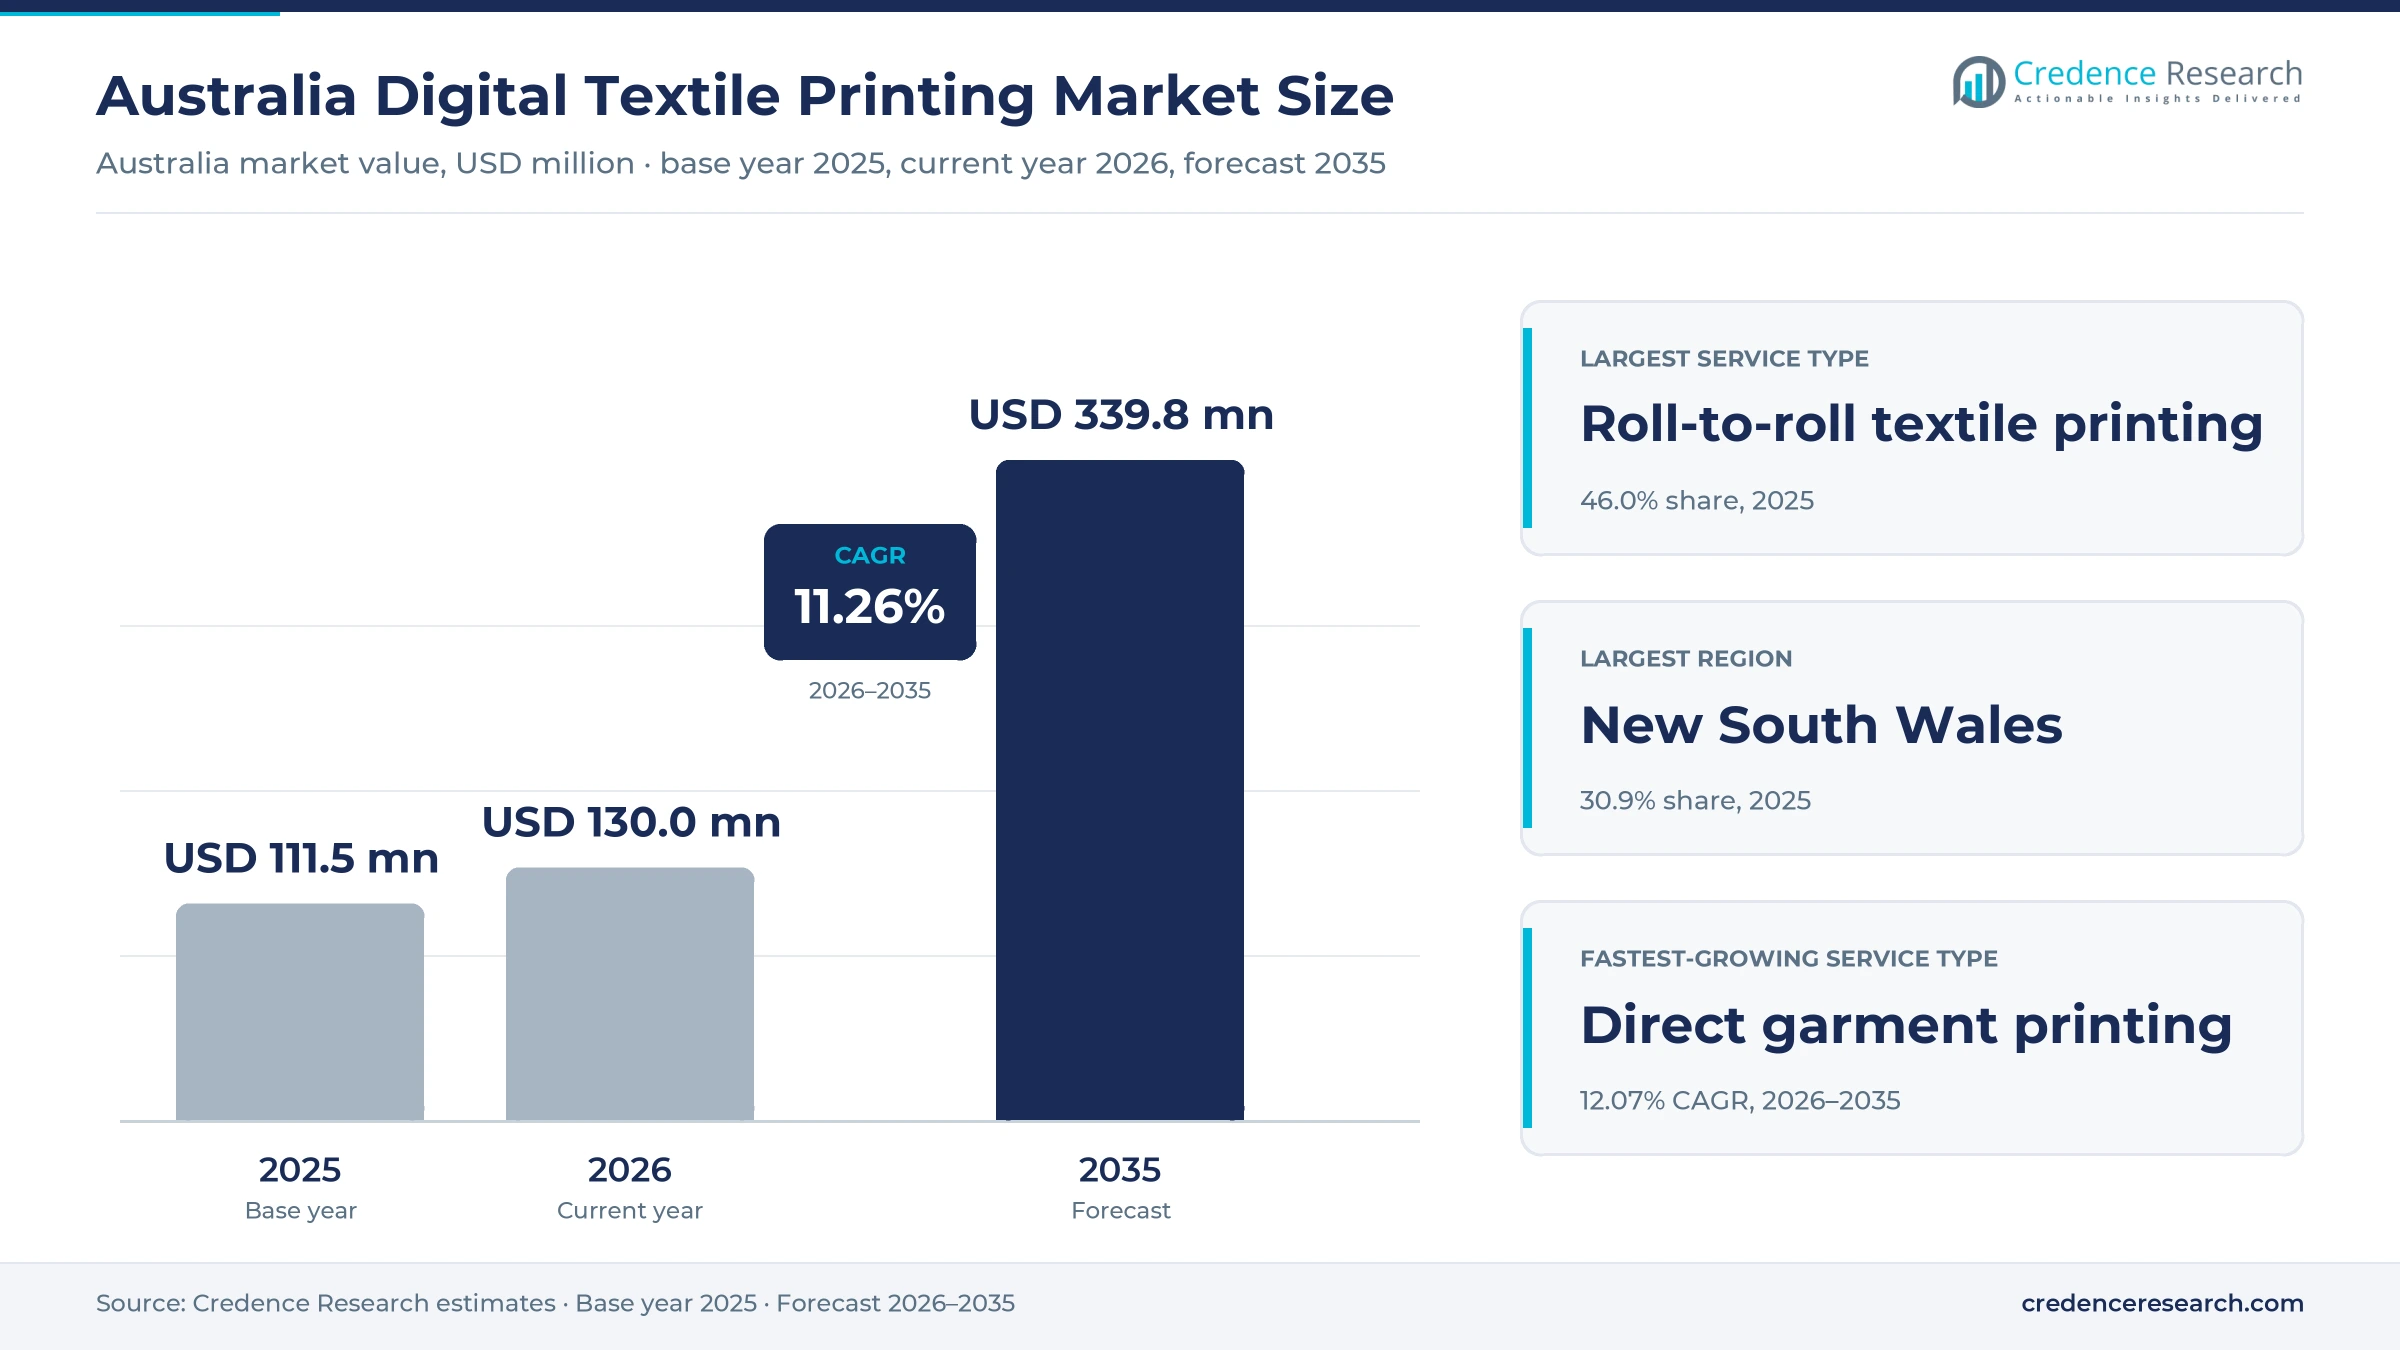
The Australia digital textile printing market was valued at USD 111.5 million in 2025 and is projected to increase from USD 130.0 million in 2026 to USD 339.8 million by 2035, registering a CAGR of 11.26% during 2026–2035. Demand comes from apparel brands and online stores that order printed garments and fabric in small batches, from retailers and event organizers that refresh fabric displays each season, and from hotel, health and education projects that specify printed drapery and acoustic panels. New South Wales held the largest regional share, 30.9% in 2025, because Sydney hosts several large fabric printers, including Materialised, Mereton Textiles and Next Printing. Queensland is the fastest-growing region at 11.84% a year, as population growth and venue building for the 2032 Games widen demand for printed graphics and team apparel. Printing methods are also changing, after a Western Sydney printer became the first in Australia to install a pigment transfer system that uses up to 90% less water in August 2025.
Which fabric print services does the estimate count?
The estimate measures the value of inkjet printing on fabric and finished garments carried out in Australia, including roll-to-roll sublimation and pigment work, direct printing onto garments, printing of cut panels before sewing and printed transfers applied with heat. It counts print and finishing fees, and the print share of integrated product orders such as flags, cushions and uniforms.
The estimate excludes screen and rotary printing, printer and ink sales, and finished goods printed overseas and imported ready to sell. The value chain runs from fabric mills and ink suppliers through local print bureaus and display producers to apparel brands, interior designers, event agencies and organizations that buy printed textiles.
Australia Digital Textile Printing Market Insights
- The Australia digital textile printing market was valued at USD 111.5 million in 2025 and is projected to reach USD 339.8 million by 2035, registering a CAGR of 11.26% during 2026–2035.
- New South Wales held a 30.9% share of 2025 value, because Sydney hosts several large fabric printers, including Materialised, Mereton Textiles and Next Printing.
- Roll-to-roll textile printing led with a 46.0% share of 2025 value, because soft signage, drapery and fashion fabric all run on wide sublimation and pigment lines.
- Mereton Textiles in Penrith became the first company in Australia to install a Mimaki pigment transfer printing system, according to an Aug. 14, 2025, trade report.
- Direct garment printing grows fastest at 12.07% a year during 2026–2035, as web stores print single shirts and hoodies to order rather than holding stock.
Roll-to-roll work leads as garment printing grows fastest
Why does roll-to-roll work lead fabric print value?
Based on service type, the market is categorized into roll-to-roll textile printing, direct garment printing, cut-panel printing and applied transfer printing. Roll-to-roll textile printing led with a 46.0% share of 2025 value, because soft signage, drapery and fashion fabric all run through wide sublimation and pigment lines. Direct garment printing grows fastest at 12.07% a year, as web stores print single garments to order.
Which uses take the most printed fabric?
Based on application, the market is categorized into fashion and apparel, brand communication, interior furnishings and functional products. Fashion and apparel led with a 38.0% share of 2025 value, because brands, schools and clubs order printed garments in many small runs. Functional products grow fastest at 12.00% a year, as acoustic panels, sportswear and technical items adopt printed surfaces.
Who buys digitally printed fabric in Australia?
Based on customer type, the market is categorized into apparel brands, interiors specifiers, branding intermediaries and direct purchasing organisations. Apparel brands led with a 34.0% share of 2025 value, because fashion, swimwear and merchandise labels buy both fabric and printed garments. Direct purchasing organisations grow fastest at 11.94% a year, as schools, clubs and firms order directly online.
How do buyers place fabric print orders?
Based on channel, the market is categorized into direct account sales, self-service web ordering and trade referral sales. Direct account sales led with a 52.0% share of 2025 value, because display, interiors and brand work needs proofing and project management. Self-service web ordering grows fastest at 12.26% a year, as printers let customers upload artwork and order single meters or garments without a set-up fee.
| Segment Group | Leading Sub-segment | Share, 2025 | Fastest-growing Sub-segment | CAGR, 2026–2035 |
|---|---|---|---|---|
| By Service Type | Roll-to-roll textile printing | 46.0% | Direct garment printing | 12.07% |
| By Application | Fashion and apparel | 38.0% | Functional products | 12.00% |
| By Customer Type | Apparel brands | 34.0% | Direct purchasing organisations | 11.94% |
| By Channel | Direct account sales | 52.0% | Self-service web ordering | 12.26% |
Request a Free Sample
Fill in your details and we'll send you a free sample report.
- Sample data tables & charts
- Research methodology
Custom apparel, soft signage and local supply lift demand
How does custom apparel ordering lift garment print work?
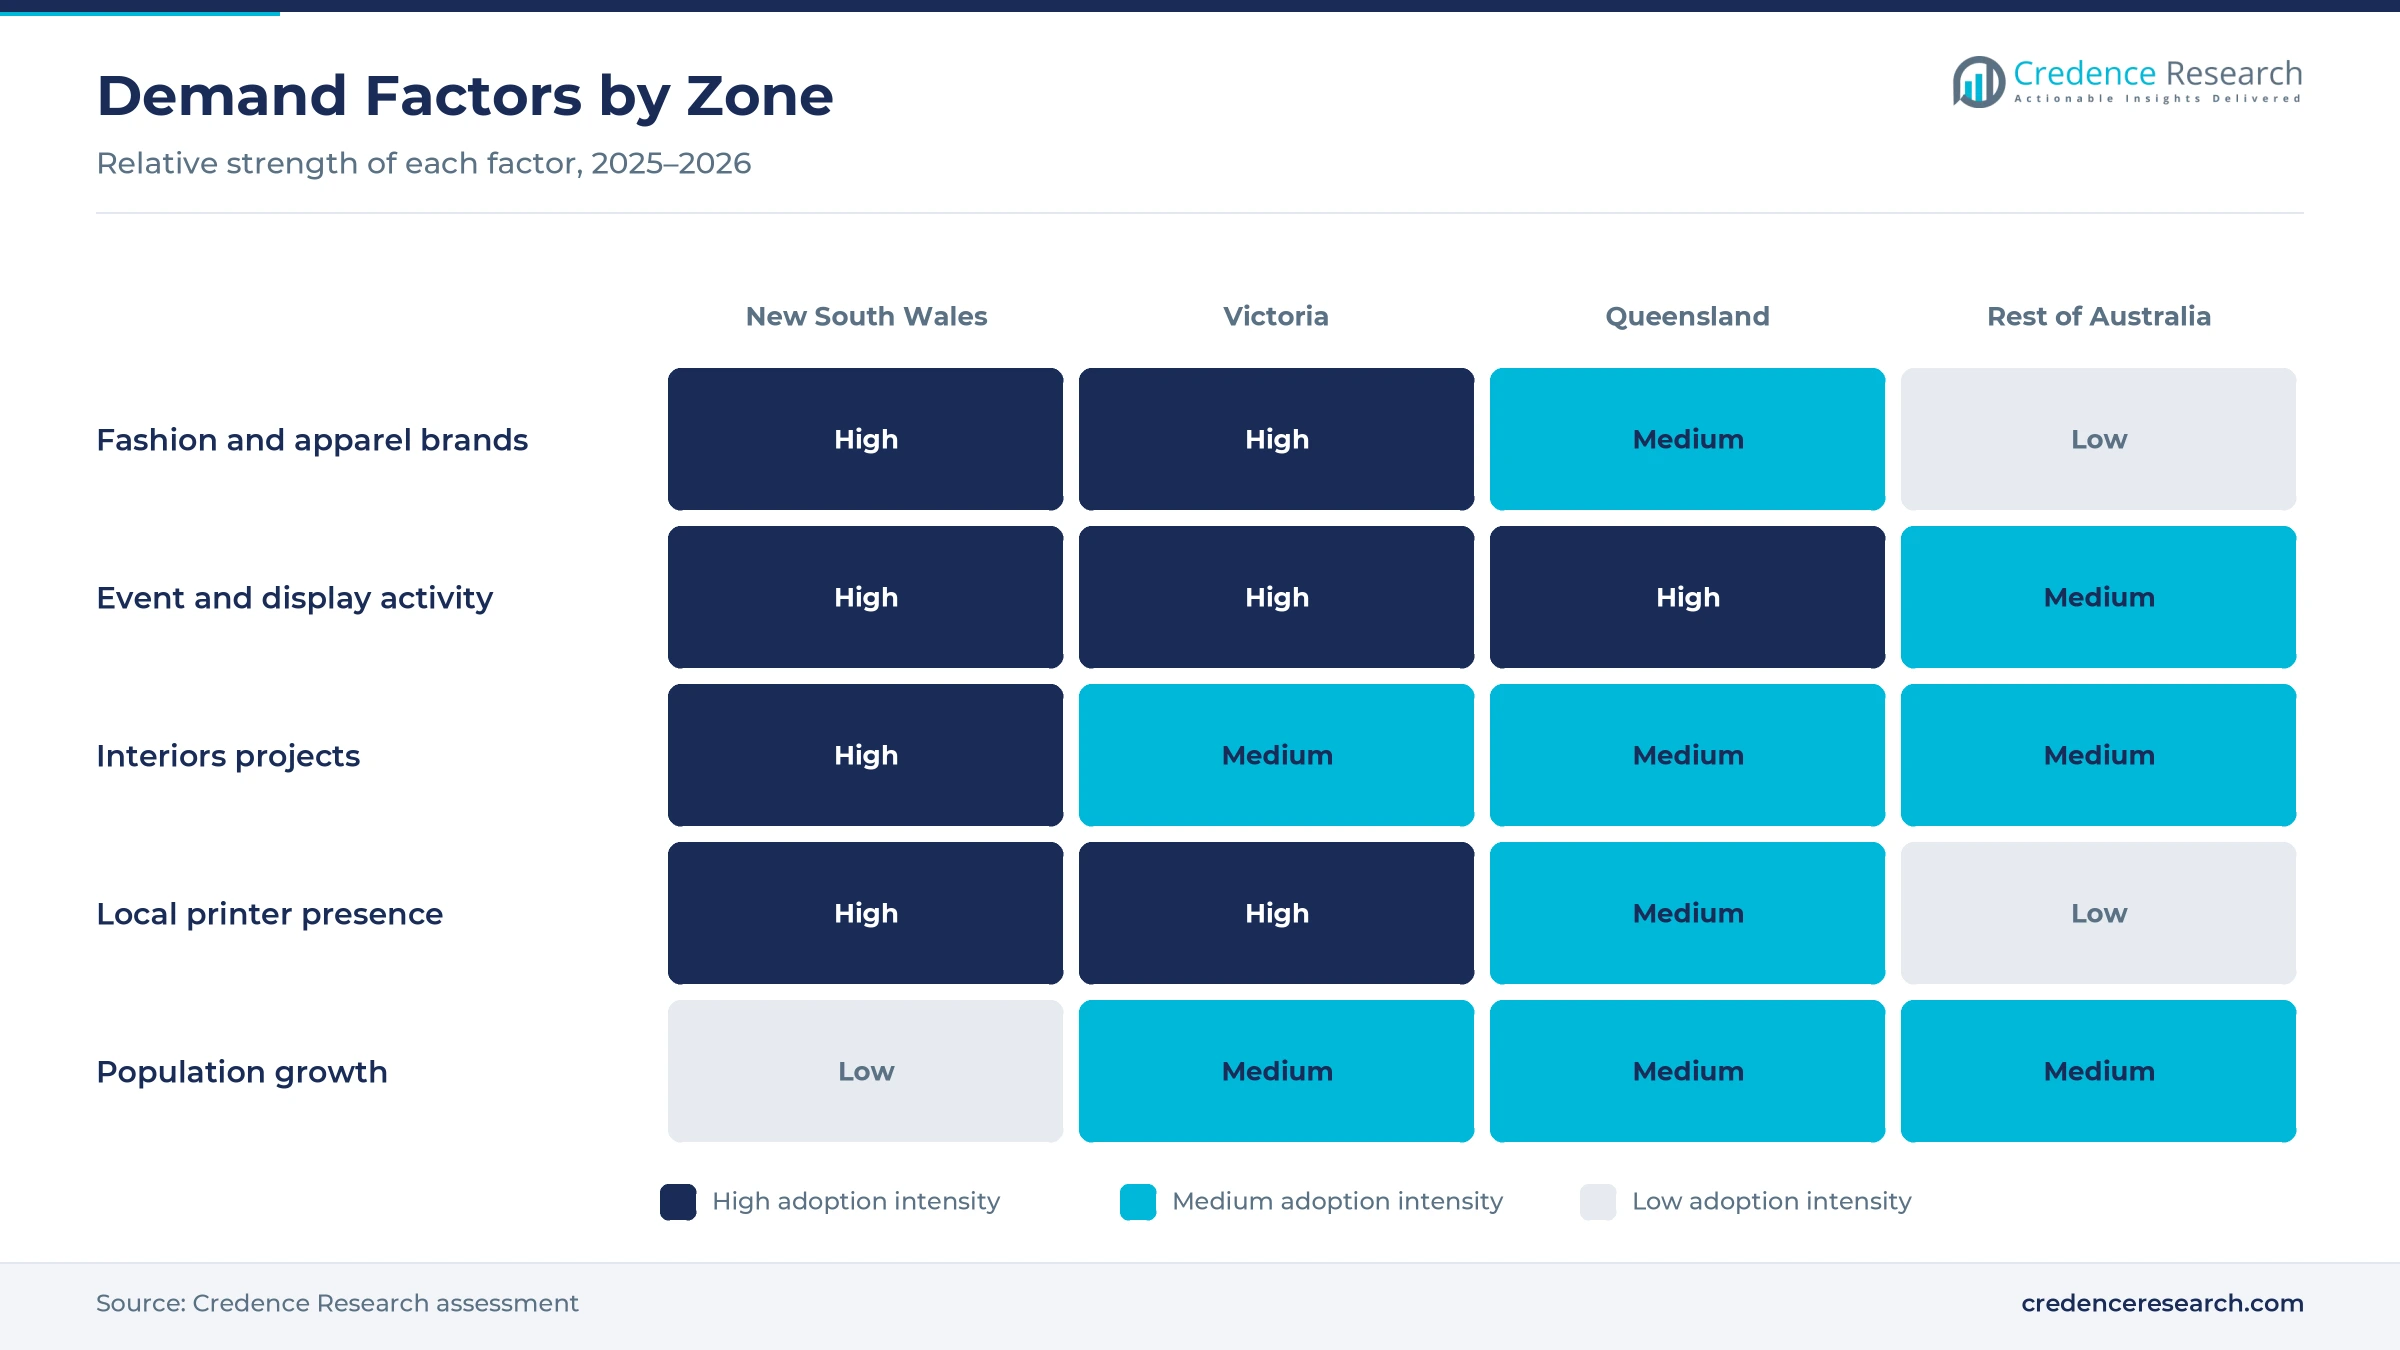
Shoppers and organizations now buy printed clothing online in small quantities, which suits digital presses far better than screen printing. Online spending on fashion and apparel rose 11.5% to A$11.6 billion in 2025, according to Ragtrader, citing the Australia Post annual eCommerce report. The same report counts 9.8 million households that shopped online during the year. PrintLocker in Alphington, Victoria, runs an on-demand custom apparel business through its own web-to-print site and produced 500 to 600 shirts a day on Kornit garment printers, according to Sprinter. As a result, direct garment printing grows fastest at 12.07% a year, and buyers who also order custom T-shirts online expect short delivery times.
Why does soft signage refresh drive roll-to-roll volumes?
Retailers, exhibitors and event agencies replace rigid signs with printed fabric, because fabric graphics are lighter to ship and can be swapped inside the same frames each season. IVE Group agreed to buy AFI Branding in October 2021, describing AFI as the largest fabric printer in Australia, according to Print21. AFI later moved into a new facility in Braeside, Victoria, in December 2022, and joined a display and activation unit serving retail, events and exhibitions. In Sydney, Next Printing installed a Durst Rhotex 322 fabric printer and reported combined capacity of almost 100,000 square meters a month, according to Sprinter. In turn, roll-to-roll textile printing holds 46.0% of 2025 value.
Why do short runs favor onshore fabric printers?
Australian buyers want short runs, fast reorders and samples they can test, which favors local digital printers over offshore mills that need large minimum orders. China supplied 57.86% of Australian textile and clothing imports by value in 2022, ahead of Bangladesh at 7.84% and India at 6.11%, according to the World Bank trade database. Materialised moved work back from rotogravure printers in Asia to digital presses in Sydney, citing one-day or two-day deadlines, according to Sprinter. Digital Fabrics in Marrickville takes orders of as little as one meter, with an express 24-hour turnaround. As a result, self-service web ordering grows fastest at 12.26% a year.
Why do hotel and health interiors specify printed fabric?
Interior designers increasingly specify custom printed drapery, upholstery and acoustic panels for hotels, hospitals and schools, because digital printing lets each project carry its own pattern. Materialised, which has supplied the contract interiors industry since 1980, prints and warehouses in Blakehurst, Sydney and states a printing capacity of more than 1 million meters a year. Its dye sublimation calenders print up to 5,000 meters a day at widths of 3.2 meters, and it supplied a custom design on its Zem base cloth for a hotel in Adelaide. In turn, demand reaches printers through interior fit-out projects, and apparel brands remain the largest customer group at 34.0%.
Waterless pigment, circular rules and web ordering advance
Why is the shift to waterless pigment printing notable?
Printers are adopting pigment methods that need no pre-treatment or washing, which cuts water use and widens the range of natural fabrics they can print. Mereton Textiles became the first company in Australia to install the Mimaki pigment transfer printing system, according to Sprinter on Aug. 14, 2025. The report cites up to 90% less water use than traditional methods, and the managing director said no pre-treatment or post-treatment is required. Mereton had moved to larger premises in Penrith in January 2025, where three Mutoh sublimation printers replaced 14 machines, according to Wide Format Image. As a result, local printers can offer natural-fiber fashion prints that once required offshore mills.
How are circular clothing rules shaping print orders?
Clothing brands face a new stewardship scheme that rewards lower waste, which supports printing to order rather than holding unsold stock. The Seamless scheme started on July 1, 2024, funded by a levy of four cents per garment paid by member brands, according to the National Retail Association. The scheme targets about 200,000 metric tons of clothing that goes to Australian landfill each year and aims for a circular industry by 2030. Its eight foundation members include Big W, Cotton On Group, David Jones and THE ICONIC. In turn, apparel brands that join the scheme have a reason to test print-on-demand ranges with local printers.
Can event graphics for the 2032 Games open new demand?
Venue building and events ahead of the Brisbane 2032 Games create an opening for printers that can supply large fabric graphics and team apparel at short notice. The Queensland government confirmed Victoria Park as the site of a new 63,000-seat stadium in March 2025, according to the Property Council of Australia. The plan also names a 20,000-seat arena at Brisbane Showgrounds and a National Aquatic Centre at Centenary Pool in Spring Hill. Game Clothing, which employs sublimators at its North Brisbane warehouse, had created 10 jobs for Queenslanders since April 2022, according to the state government. As a result, Brisbane printers with large sublimation lines stand to win stadium wraps and team kit orders.
Is there room for printed sportswear and technical products?
Sportswear, swimwear and technical items create an opening for printers that can sublimate and cut stretch fabric accurately. Sublitech Printing in Sydney runs two custom-built Mimaki printers with a print width of 3.2 meters and uses laser cutting for stretch fabric, according to a July 2, 2020, profile by Image Magazine. It prints athletic wear and swimwear for Australian brands, and also banner walls, backlit lightboxes and theater backdrops for in-store campaigns. Demand for printed compression sportswear adds further cut-panel work for local brands. As a result, functional products grow fastest at 12.00% a year, and direct garment printing benefits from team kit orders.
Import price pressure and thin fashion volumes test printers
How does import price pressure limit local fashion work?
Large fashion orders still go to offshore mills, because low unit prices outweigh lead times once runs reach thousands of meters. China supplied more than half of Australian textile and clothing imports by value in 2022, which sets the price buyers compare against. As a result, local printers win mostly sampling, short runs and urgent reorders. Printers respond by bundling cutting, sewing and dispatch, so the full delivered cost competes.
Why have fashion volumes proved hard to sustain?
Small designers order irregularly, which makes it hard to fill a full fabric line all year round. Next Printing closed The Textile Hub in Sydney in December 2018, months after its March opening, saying the numbers did not stack up and clients would not commit seasons locally, according to Wide Format Image. In turn, newer printers mix fashion with signage, interiors and merchandise work to keep presses busy.
How do skills and finishing gaps slow expansion?
Digital printing is only one step, because steaming, washing, cutting and sewing must also be done locally to deliver finished goods. A full fabric line, such as the one Next Printing ran in Sydney, needs coating, steaming, washing and drying units as well as presses, which limits how fast printers can add capacity. As a result, some jobs wait for outside sewing or coating. Printers respond by buying cutting tables and training staff in house, and by partnering with local sewing rooms.
Why do ink, fabric and freight costs squeeze margins?
Most inks, coated fabrics and spare parts are imported, so exchange rates and freight costs feed straight into print prices. Small bureaus have little power to pass these costs on to brands that compare quotes online. In turn, margins tighten on standard sublimation work for smaller bureaus. Printers respond by moving into higher-value finishes, pigment printing on natural fabrics and integrated products such as cushions and flags.
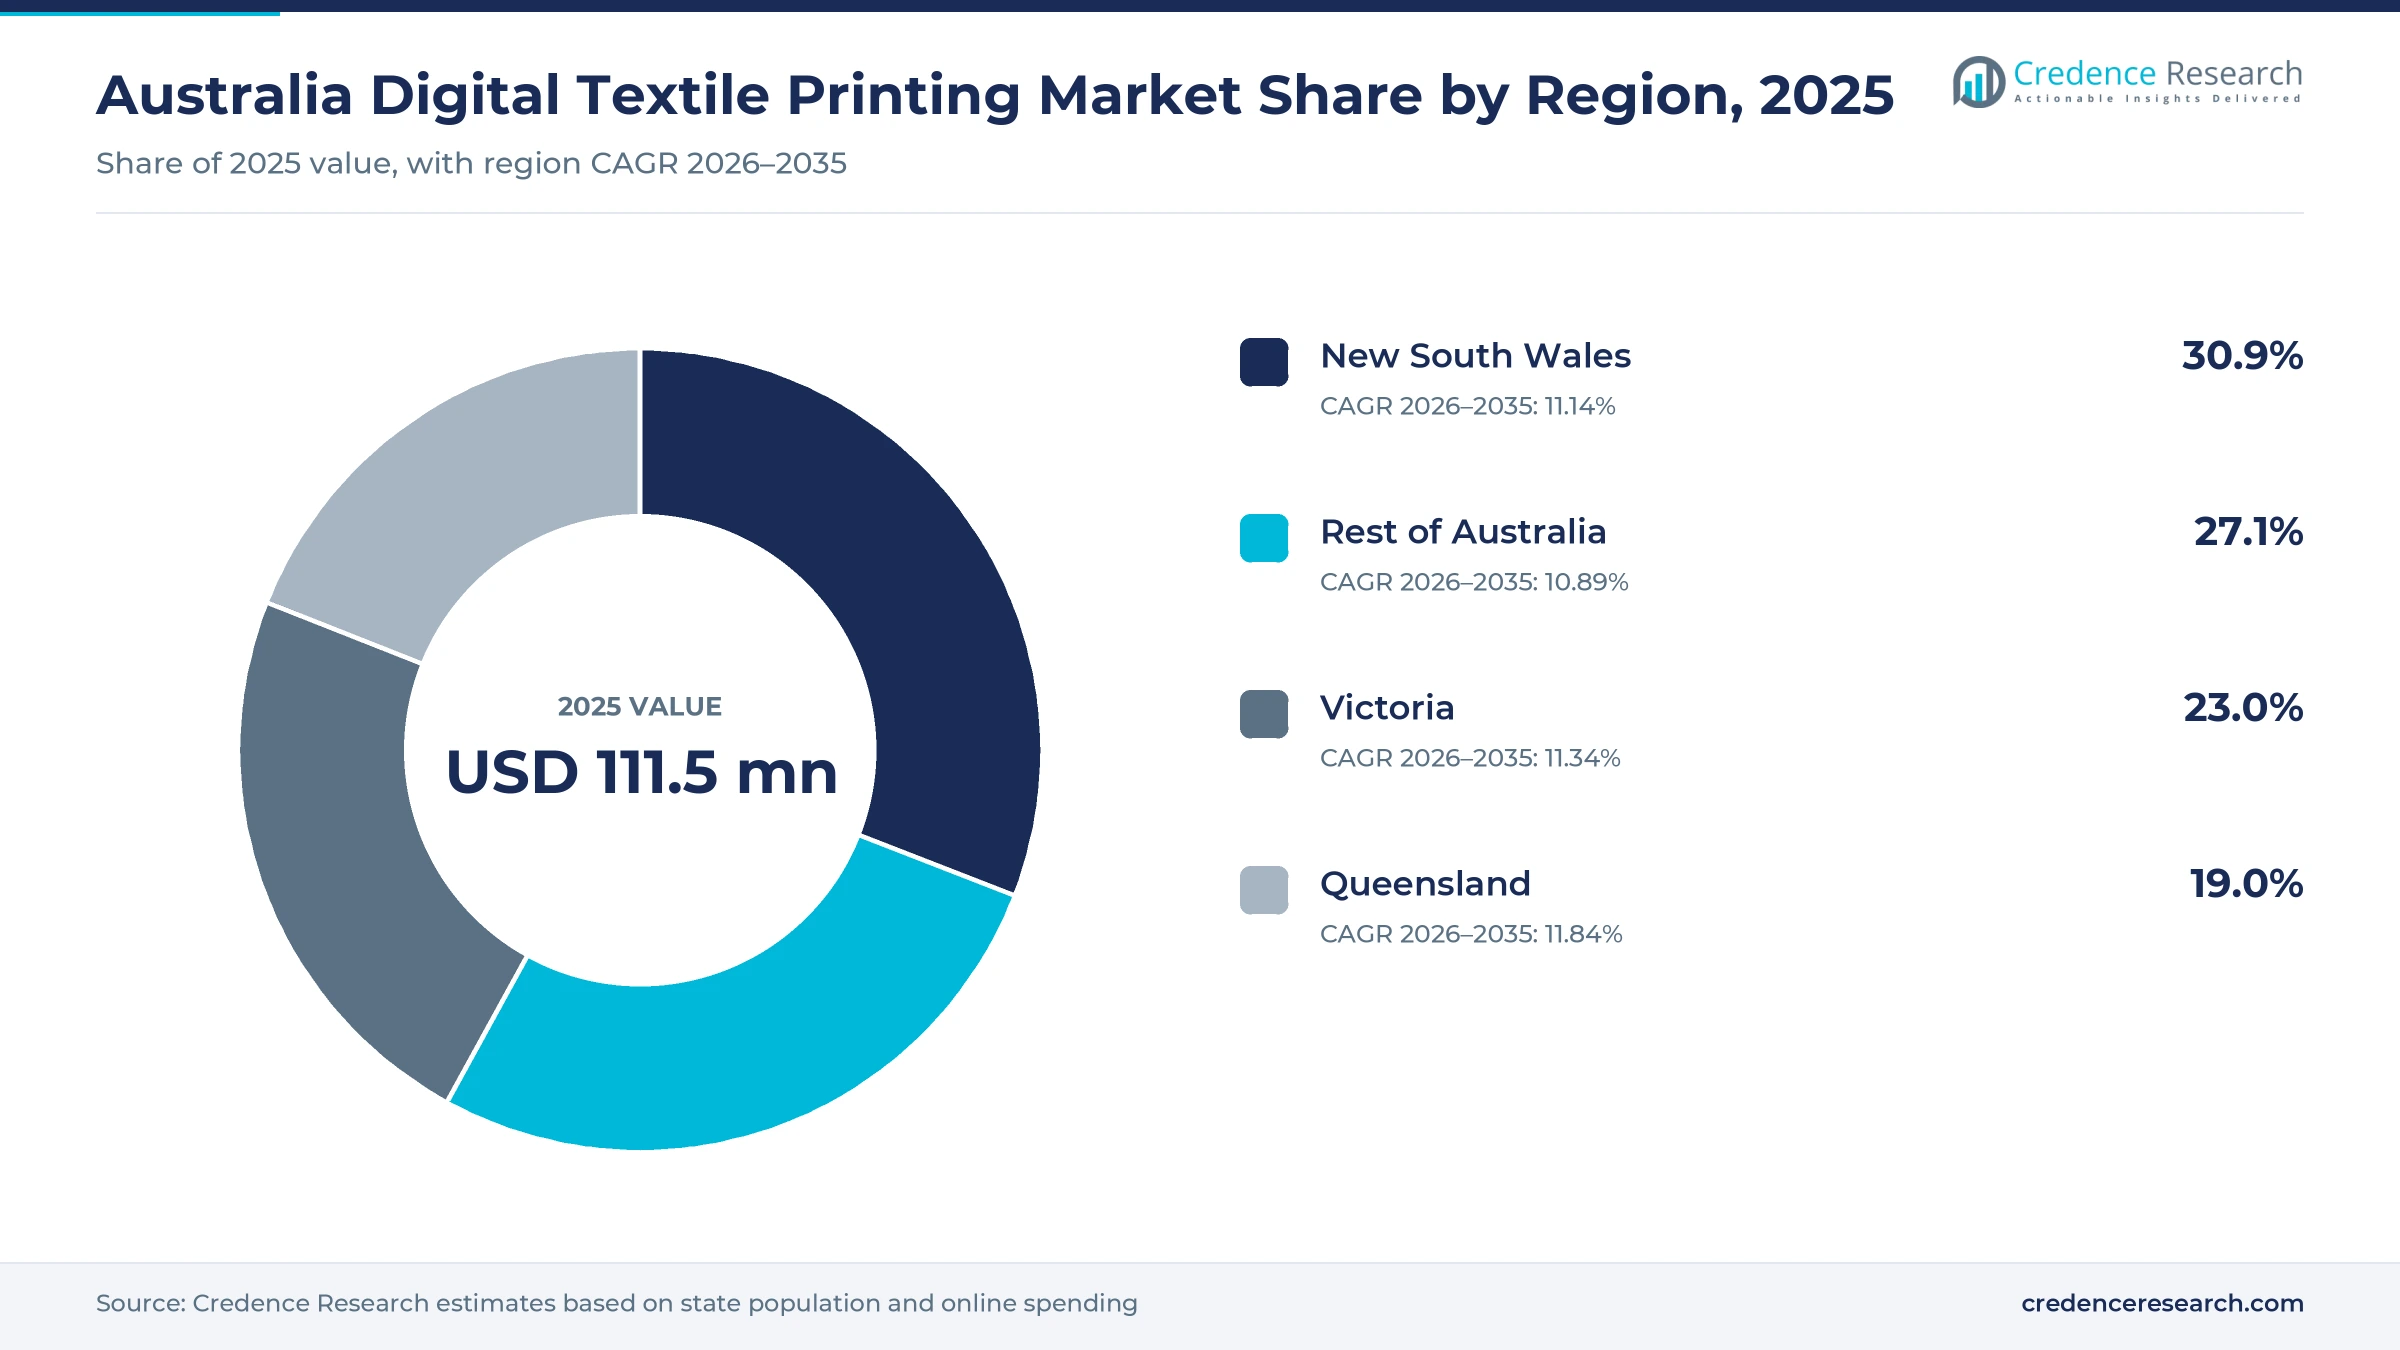
Sydney printers lead while Queensland grows fastest
| Region | Value, 2025 (USD million) | Share, 2025 | CAGR, 2026–2035 |
|---|---|---|---|
| New South Wales | 34.5 | 30.9% | 11.14% |
| Rest of Australia | 30.2 | 27.1% | 10.89% |
| Victoria | 25.6 | 23.0% | 11.34% |
| Queensland | 21.2 | 19.0% | 11.84% |
What keeps New South Wales ahead in fabric printing?
New South Wales held 30.9% of 2025 value and grows at 11.14% a year, because Sydney hosts large interiors, fashion and display printers. Materialised prints in Blakehurst, Digital Fabrics and Sublitech print in Sydney, and Mereton Textiles runs a pigment transfer line in Penrith. The state had 8,670,100 residents on March 31, 2026, according to the Australian Bureau of Statistics. As a result, New South Wales remains the largest buyer and producer of printed fabric.
How does Victoria combine garment and display print?
Victoria held a 23.0% share of 2025 value and grows at 11.34% a year, because Melbourne hosts large display and on-demand garment printers. AFI Branding moved into a facility in Braeside in December 2022, and PrintLocker runs garment printers in Alphington. Next State Print in Thornbury hosted a textile print workshop during Ethical Clothing Australia Week in October 2025. The state had 7,154,200 residents on March 31, 2026, after growth of 1.6% over the year.
Why is Queensland fabric print demand expanding fastest?
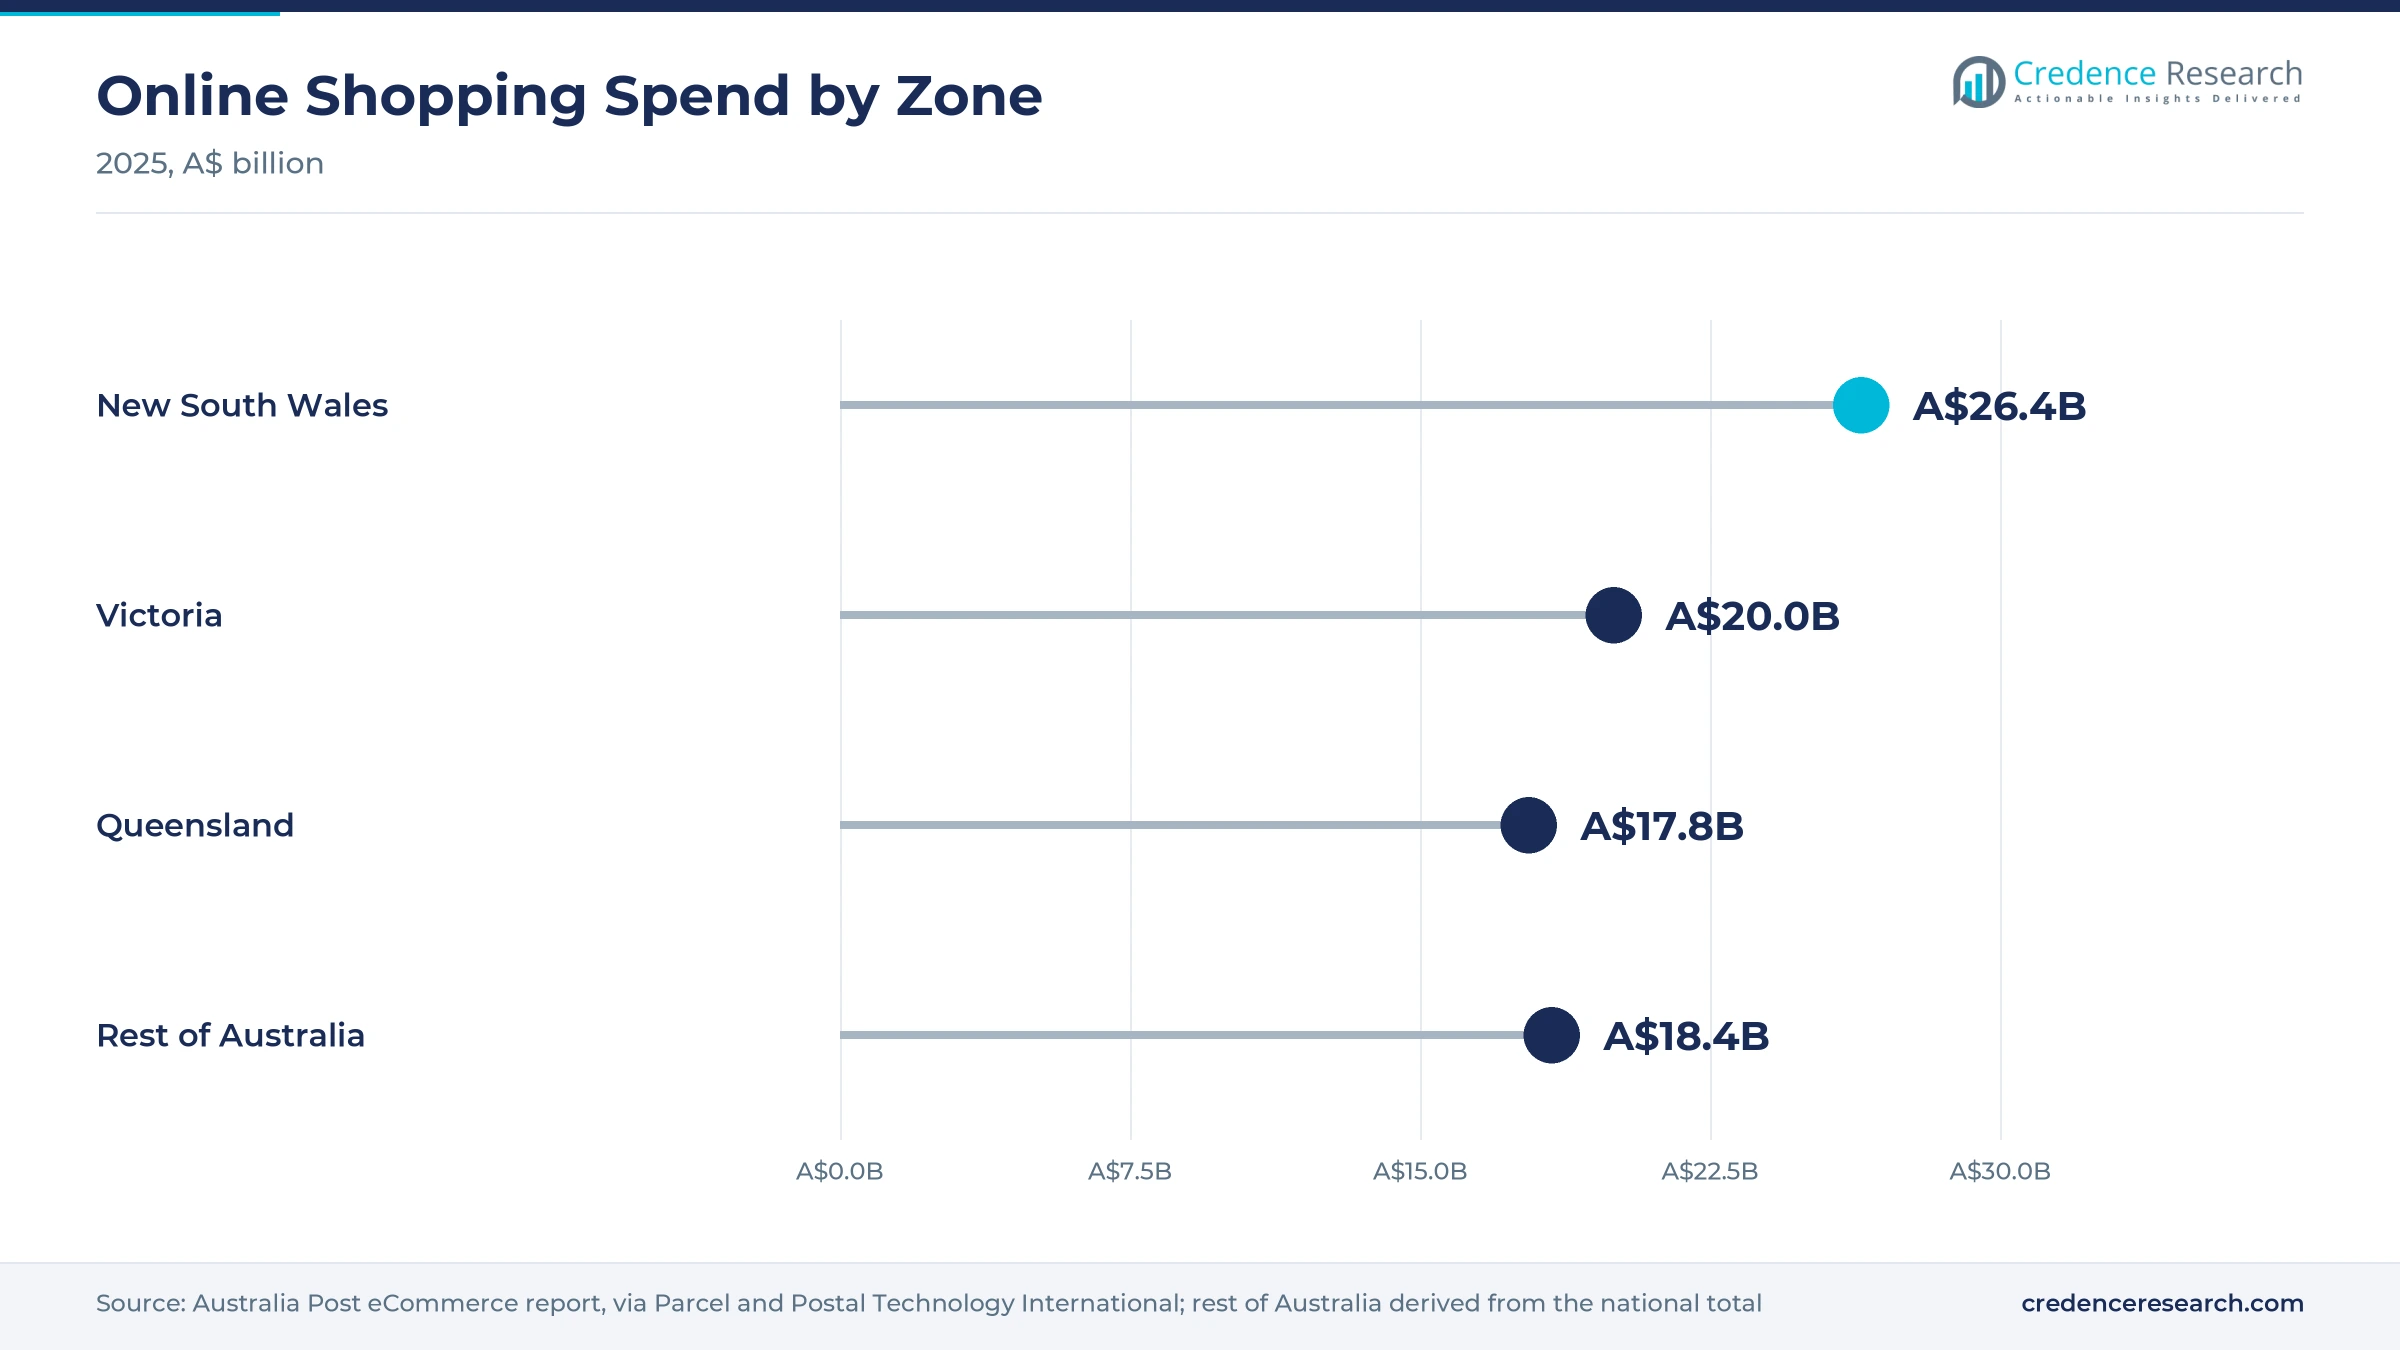
Queensland held a 19.0% share of 2025 value and grows fastest at 11.84% a year, because population growth and the Brisbane 2032 program lift demand for event graphics and team apparel. The state had 5,739,500 residents on March 31, 2026, after growth of 1.6% over the year. Online shoppers in Queensland spent A$17.8 billion in 2025, according to Australia Post data. In turn, more sportswear and display work is placed with printers near Brisbane.
Where do other states and territories buy printed fabric?
The rest of Australia held a 27.1% share of 2025 value and grows at 10.89% a year, covering Western Australia, South Australia, Tasmania and the two territories. Western Australia grew 2.1% in the year to March 2026, the fastest state rate, yet much of its fabric print work still ships from the east coast. As a result, demand here relies on web ordering and on interiors projects such as hotels in Adelaide.
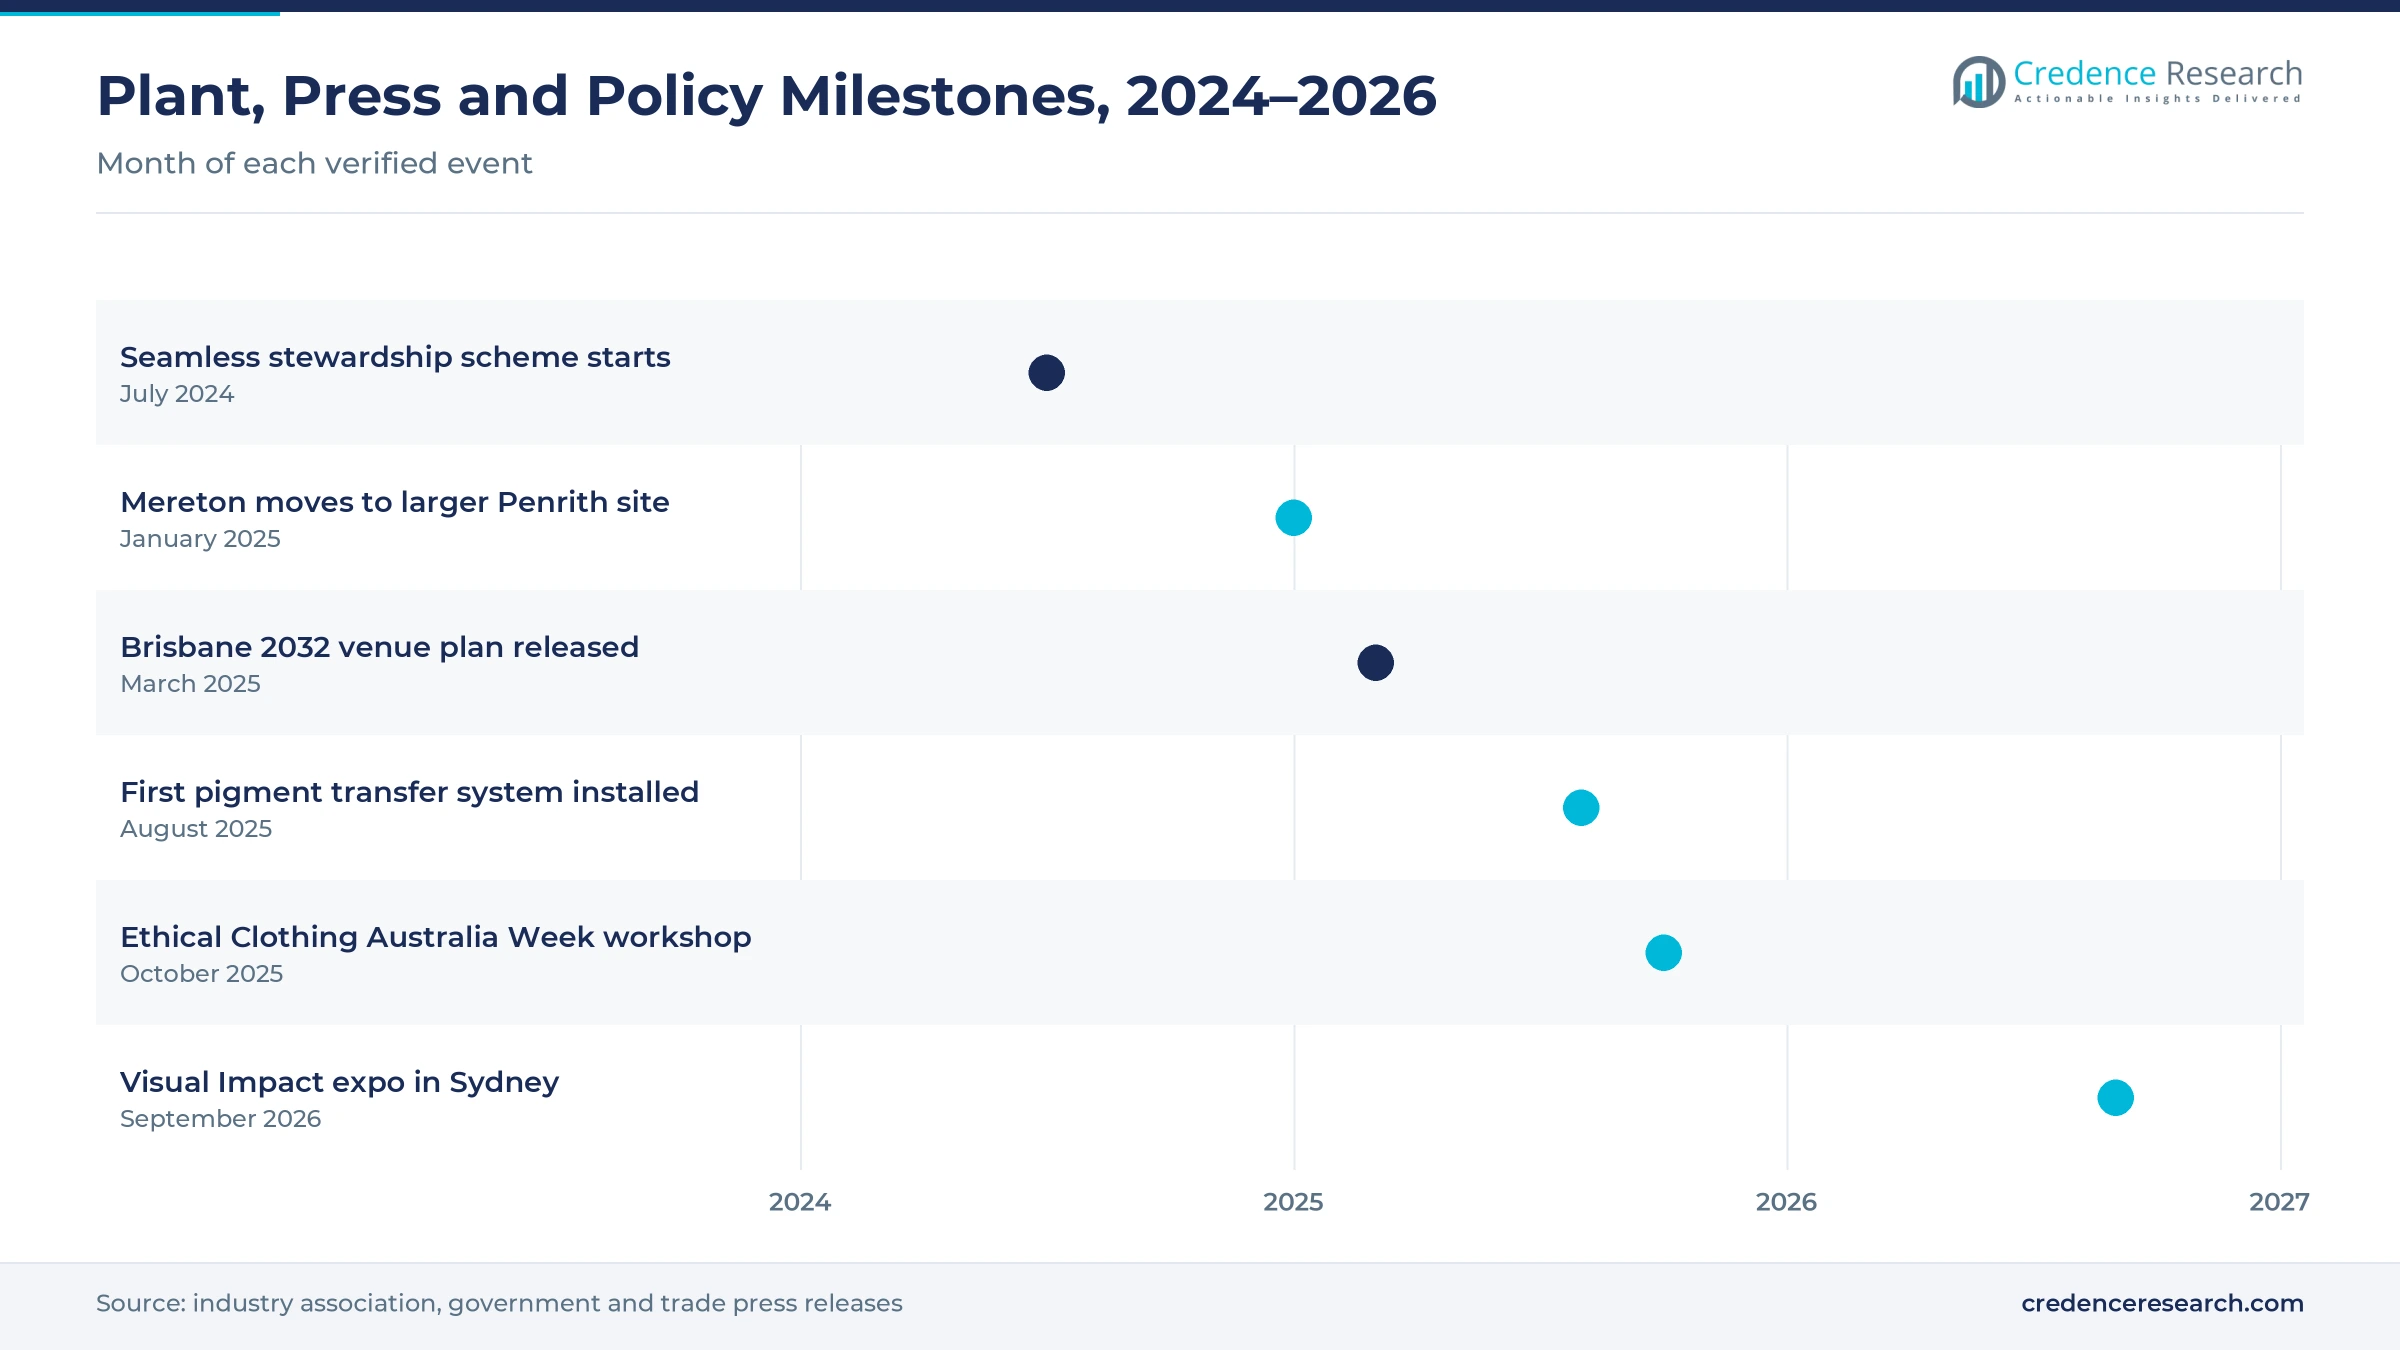
Plant moves, new presses and policy steps, 2024–2026
| Development | Status and market relevance |
|---|---|
| In July 2024, the Seamless clothing stewardship scheme began, funded by a levy of four cents per garment paid by member brands. | Supports print-to-order ranges that cut unsold stock |
| In January 2025, Mereton Textiles moved to larger premises in Penrith, where three Mutoh sublimation printers replaced 14 machines. | Raised local sublimation capacity in Western Sydney |
| In August 2025, Mereton Textiles became the first company in Australia to install the Mimaki pigment transfer printing system. | Brings near-waterless pigment printing to local fashion work |
| In October 2025, Next State Print in Thornbury hosted a textile print workshop during Ethical Clothing Australia Week. | Shows growing interest in local, accredited garment supply |
| In September 2026, Visual Impact opened at Sydney Showgrounds with about 60 exhibitors, including Epson, HP, Mimaki, Mutoh and Roland DG. | Puts wide-format and fabric print equipment in front of local buyers |
Sublimation, pigment transfer and garment presses advance
- Wide dye sublimation lines print polyester for soft signage, sportswear and drapery, and Materialised runs calenders that print up to 5,000 meters a day at 3.2 meters wide.
- Pigment transfer systems print natural fabrics without pre-treatment or washing, which Mereton Textiles reports cuts water use by up to 90%.
- Direct-to-garment presses print finished shirts and hoodies one at a time, and Kornit Storm Hexa units print up to 170 light garments an hour.
- Laser and digital cutting trims printed stretch fabric and soft signage to shape, which links printers with fabric cutting machines suppliers.
Need a Custom Version of This Report?
Tailor the scope, geography, or segments to your exact requirements.
- Custom geography or segment scope
- Direct access to our analyst team
Fabric specialists and display groups compete on speed
Competition is split between display groups that print fabric at scale and specialist bureaus that serve fashion, interiors and custom apparel. IVE Group added AFI Branding, described as the largest fabric printer in Australia, and placed it in a display and activation unit serving retail, events and exhibitions. Materialised supplies contract interiors from its Sydney print plant, while Mereton Textiles and Sublitech Printing serve fashion, swimwear and signage clients. Digital Fabrics and PrintLocker compete on web ordering, low minimums and fast turnaround, and Next Printing focuses on signage and point-of-sale fabric. Next State Print offers textile studio printing and workshops in Melbourne. Rivals compete on turnaround, color accuracy, fabric range and finishing, rather than on price alone, because offshore mills stay cheaper for large runs.
Which companies print fabric for Australian buyers?
| Company | Type | Role in the market |
|---|---|---|
| IVE Group / AFI Branding | Display and activation group | Fabric printing for retail, events and exhibitions from Braeside, Victoria |
| Materialised | Contract interiors supplier | Prints drapery, upholstery and wall coverings in Blakehurst, Sydney |
| Mereton Textiles | Fabric print bureau | Sublimation and pigment transfer printing in Penrith, Western Sydney |
| Next Printing | Sign and display producer | Soft signage and point-of-sale fabric printing in Sydney |
| Sublitech Printing | Fabric print bureau | Sportswear, swimwear and soft signage sublimation in Sydney |
| Digital Fabrics | Online fabric printer | Custom fabric and products from one meter in Marrickville |
| Next State | Print studio | Textile print studio in Thornbury, Melbourne |
| PrintLocker | On-demand apparel printer | Web-to-print custom garments from Alphington, Victoria |
Credence Research view on onshore fabric print demand
Credence Research's view is that Australian fabric printing will grow strongly because buyers value speed, low minimums and local control more than they did a decade ago. Roll-to-roll work remains the largest value pool through soft signage and interiors, while garment printing adds the fastest growth as web stores print to order. Printers that combine printing with cutting, sewing and dispatch should gain share. Offshore price pressure and irregular fashion volumes will limit growth, while ties to online order fulfillment partners can widen reach.
How the national fabric print estimate was built
The report uses 2025 as the base year on a calendar basis, and market values come from the Credence Research model. That model combines online spending data, trade statistics, state population data and company disclosures on printing capacity and services. Segment splits and regional growth rates are Credence Research estimates, while zone shares follow the client data. Sources used are official statistics, trade databases, industry association releases, trade press and company publications, and no interviews or surveys were used.
On-demand apparel and event graphics carry growth to 2035
Value across Australian fabric printing is expected to reach USD 339.8 million by 2035, an 11.26% CAGR during 2026–2035, as on-demand apparel, event graphics and custom interiors keep shifting work to local digital presses. Growth should be strongest before 2032 while Queensland builds venues and brands test print-to-order ranges. After that, pigment printing on natural fabrics and functional products will carry more of the value. Stronger stewardship rules would favor local printers, while cheaper imports would hold back fashion volumes.
Frequently Asked Questions
How big is the Australia digital textile printing market?
Which service type leads fabric print value?
Which state leads fabric printing in Australia?
How much did Australians spend on fashion online in 2025?
What is the Seamless scheme?
Which channel is growing fastest?
Which companies print fabric in Australia?
What are the main challenges for local fabric printers?
Table of Content
Chapter 1 Market Segmentation
- 1.1 Segmentation Framework
- 1.1.1 Product and Service Classification
- 1.1.2 Application and End-Use Classification
- 1.1.3 Technology and Solution Classification
- 1.1.4 Customer and Distribution Channel Classification
- 1.1.5 Geographic Segmentation
- 1.1.6 Market Segment Definitions and Boundaries
- 1.2 By Service Type
- 1.2.1 Roll-to-roll textile printing
- 1.2.2 Direct garment printing
- 1.2.3 Cut-panel printing
- 1.2.4 Applied transfer printing
- 1.3 By Application
- 1.3.1 Fashion and apparel
- 1.3.2 Brand communication
- 1.3.3 Interior furnishings
- 1.3.4 Functional products
- 1.4 By Customer Type
- 1.4.1 Apparel brands
- 1.4.2 Interiors specifiers
- 1.4.3 Branding intermediaries
- 1.4.4 Direct purchasing organisations
- 1.5 By Channel
- 1.5.1 Direct account sales
- 1.5.2 Self-service web ordering
- 1.5.3 Trade referral sales
Chapter 2 Introduction
- 2.1 Report Objectives and Scope
- 2.2 Product Definition and Industry Terminology
- 2.3 Market Inclusions and Exclusions
- 2.4 Research Process
- 2.4.1 Primary Research and Expert Interviews
- 2.4.2 Secondary Research and Source Review
- 2.4.3 Top-Down and Bottom-Up Estimation
- 2.4.4 Data Triangulation and Verification
- 2.5 Market Size Measurement Basis
- 2.5.1 2025: USD 111.5 million → 2035: USD 339.8 million
- 2.6 Historical and Forecast Reference Periods
- 2.6.1 Historical Period: 2018-2025
- 2.6.2 Base Year: 2025
- 2.6.3 Forecast Period: 2025-2035
- 2.7 Research Assumptions and Limitations
Chapter 3 Executive Summary
- 3.1 Market Snapshot and Key Findings
- 3.2 Base-Year Market Size, 2025
- 3.3 Forecast Market Size, 2035
- 3.4 Revenue and Volume Growth Outlook
- 3.5 Key Demand and Supply Indicators
- 3.6 Leading Market Segments
- 3.7 Fastest-Growing Market Opportunities
- 3.8 Regional Performance Highlights
- 3.9 Technology and Industry Transformation
- 3.10 Competitive Landscape Summary
- 3.11 Analyst View and Strategic Implications
Chapter 4 Australia Digital Textile Printing Market Trends and Developments
- 4.1 Historical Industry Development, 2018-2025
- 4.2 Recent Market Trends and Developments
- 4.3 Demand and Customer Behavior Trends
- 4.4 Technology and Product Innovation
- 4.5 Artificial Intelligence, Automation and Digitalization
- 4.6 Local Manufacturing and Supply Chain Realignment
- 4.7 Industry Partnerships, Mergers and Acquisitions
- 4.8 Sustainability and Circular Economy Developments
- 4.9 Government and Private Sector Investment Trends
- 4.10 Emerging Business Models and Commercialization
- 4.11 Industry Developments and Announcements
Chapter 5 Australia Digital Textile Printing Market Production, Supply and Demand Analysis
- 5.1 Demand Trend and Consumption Analysis, 2018-2025
- 5.2 Demand Forecast, 2025-2035
- 5.3 Production and Output Trend, 2018-2025
- 5.4 Production and Output Forecast, 2025-2035
- 5.5 Installed Capacity and Capacity Utilization
- 5.6 Company-Wise Production Plants and Statistics
- 5.6.1 Installed Production Capacity
- 5.6.2 Actual Production
- 5.6.3 Planned Capacity and Expansion Targets
- 5.7 Supply Chain Structure and Procurement Trends
- 5.8 Supply-Demand Gap and Bottlenecks
- 5.9 Import Dependence and Sourcing Structure
- 5.10 Contract Manufacturing and Outsourcing
- 5.11 Regional Supply and Demand Concentration
Chapter 6 Australia Digital Textile Printing Market Pricing Analysis
- 6.1 Pricing Structure and Measurement
- 6.2 Historical Pricing Trends, 2018-2025
- 6.3 Pricing Outlook, 2025-2035
- 6.4 Average Selling Price and Unit Economics
- 6.5 Pricing by Product and Market Segment
- 6.6 Geographic Pricing Differences
- 6.7 Key Input, Energy, Labor and Logistics Costs
- 6.8 Contract Pricing and Purchasing Models
- 6.9 Pricing Sensitivity and Competitive Positioning
- 6.10 Price, Margin and Profitability Implications
Chapter 7 Australia Digital Textile Printing Market Dynamics
- 7.1 Market Growth Drivers
- 7.1.1 Demand-Side Drivers
- 7.1.2 Technology and Innovation Drivers
- 7.1.3 Infrastructure and Investment Drivers
- 7.1.4 Regulatory and Policy Drivers
- 7.2 Market Restraints
- 7.2.1 Cost and Affordability Constraints
- 7.2.2 Technology and Adoption Barriers
- 7.2.3 Supply Chain and Operational Constraints
- 7.3 Market Challenges
- 7.3.1 Competitive Pressure and Margin Erosion
- 7.3.2 Skills, Infrastructure and Implementation Gaps
- 7.4 Emerging Market Opportunities
- 7.5 Market Dynamics Impact and Time-Horizon Assessment
Chapter 8 Australia Digital Textile Printing Value Chain Analysis
- 8.1 Industry Value Chain Overview
- 8.2 Upstream Suppliers and Critical Inputs
- 8.3 Technology and Component Providers
- 8.4 Manufacturing or Service Delivery
- 8.5 Distribution, Channel Partners and Integrators
- 8.6 Downstream Applications and End Users
- 8.7 Value Addition and Profit Pools
- 8.8 Vertical Integration and Outsourcing
- 8.9 Supplier Concentration and Risk
- 8.10 Supply Chain Localization and Resilience
Chapter 9 Australia Digital Textile Printing Market Regulations and Policies
- 9.1 Relevant Laws, Standards and Compliance Frameworks
- 9.2 Product, Service, Safety and Quality Requirements
- 9.3 Government Policies, Incentives and Subsidies
- 9.4 Imports, Exports and Trade Barriers
- 9.5 Public Procurement and Local Content Requirements
- 9.6 Environmental and Sustainability Compliance
- 9.7 Upcoming Policy Changes and Market Implications
Chapter 10 Australia Digital Textile Printing Market Hotspots and Opportunities
- 10.1 Market Opportunity Mapping and Growth Hotspots
- 10.2 High-Growth Applications and Customer Groups
- 10.3 Underserved Markets and White-Space Opportunities
- 10.4 Emerging Technology and Product Opportunities
- 10.5 New Capacity and Investment Hotspots
- 10.6 Market Entry and Expansion Opportunities
- 10.7 Distribution and Partnership Opportunities
- 10.8 Near-Term and Long-Term Commercial Potential
- 10.9 Opportunity Attractiveness and Execution Risks
Chapter 11 Australia Digital Textile Printing Market Outlook, 2025-2035
- 11.1 Market Size and Analysis
- 11.1.1 Revenue (Market Measurement: 2025: USD 111.5 million → 2035: USD 339.8 million)
- 11.1.2 Market Volume and Quantity Sold
- 11.1.3 Historical Market Size, 2018-2025
- 11.1.4 Base-Year Market Size, 2025
- 11.2 Market Forecast, 2025-2035
- 11.2.1 Revenue Forecast to 2035
- 11.2.2 Volume Forecast to 2035
- 11.2.3 CAGR and Year-on-Year Growth
- 11.2.4 Incremental Revenue Opportunity
- 11.3 Forecast Assumptions and Scenario Analysis
- 11.3.1 Base-Case Forecast
- 11.3.2 Optimistic and Conservative Scenarios
- 11.3.3 Technology, Pricing and Policy Sensitivities
- 11.4 Market Attractiveness and Growth Outlook
Chapter 12 Australia Digital Textile Printing Market Segmentation and Outlook
- 12.1 Segmentation Summary and Market Shares, 2025
- 12.2 Largest and Fastest-Growing Segments
- 12.3 By Service Type - Market Size and Forecast, 2025-2035
- 12.3.1 Segment Definition and Scope
- 12.3.2 Historical Market Size, 2018-2025
- 12.3.3 Revenue Forecast, 2025-2035
- 12.3.4 Volume Forecast, 2025-2035
- 12.3.5 Base-Year Market Share, 2025
- 12.3.6 Segment CAGR and Growth Drivers
- 12.3.7 Subsegment Market Size and Forecast
- 12.3.7.1 Roll-to-roll textile printing
- 12.3.7.2 Direct garment printing
- 12.3.7.3 Cut-panel printing
- 12.3.7.4 Applied transfer printing
- 12.3.8 Subsegment Pricing and Adoption Trends
- 12.3.9 Leading Suppliers and Competition
- 12.3.10 Regional Demand and Opportunities
- 12.4 By Application - Market Size and Forecast, 2025-2035
- 12.4.1 Segment Definition and Scope
- 12.4.2 Historical Market Size, 2018-2025
- 12.4.3 Revenue Forecast, 2025-2035
- 12.4.4 Volume Forecast, 2025-2035
- 12.4.5 Base-Year Market Share, 2025
- 12.4.6 Segment CAGR and Growth Drivers
- 12.4.7 Subsegment Market Size and Forecast
- 12.4.7.1 Fashion and apparel
- 12.4.7.2 Brand communication
- 12.4.7.3 Interior furnishings
- 12.4.7.4 Functional products
- 12.4.8 Subsegment Pricing and Adoption Trends
- 12.4.9 Leading Suppliers and Competition
- 12.4.10 Regional Demand and Opportunities
- 12.5 By Customer Type - Market Size and Forecast, 2025-2035
- 12.5.1 Segment Definition and Scope
- 12.5.2 Historical Market Size, 2018-2025
- 12.5.3 Revenue Forecast, 2025-2035
- 12.5.4 Volume Forecast, 2025-2035
- 12.5.5 Base-Year Market Share, 2025
- 12.5.6 Segment CAGR and Growth Drivers
- 12.5.7 Subsegment Market Size and Forecast
- 12.5.7.1 Apparel brands
- 12.5.7.2 Interiors specifiers
- 12.5.7.3 Branding intermediaries
- 12.5.7.4 Direct purchasing organisations
- 12.5.8 Subsegment Pricing and Adoption Trends
- 12.5.9 Leading Suppliers and Competition
- 12.5.10 Regional Demand and Opportunities
- 12.6 By Channel - Market Size and Forecast, 2025-2035
- 12.6.1 Segment Definition and Scope
- 12.6.2 Historical Market Size, 2018-2025
- 12.6.3 Revenue Forecast, 2025-2035
- 12.6.4 Volume Forecast, 2025-2035
- 12.6.5 Base-Year Market Share, 2025
- 12.6.6 Segment CAGR and Growth Drivers
- 12.6.7 Subsegment Market Size and Forecast
- 12.6.7.1 Direct account sales
- 12.6.7.2 Self-service web ordering
- 12.6.7.3 Trade referral sales
- 12.6.8 Subsegment Pricing and Adoption Trends
- 12.6.9 Leading Suppliers and Competition
- 12.6.10 Regional Demand and Opportunities
- 12.7 Segment Growth Comparison
- 12.8 Segment Attractiveness and Priority Matrix
Chapter 13 Australia Digital Textile Printing End-Use and Application Market Outlook
- 13.1 End-Use Industry and Customer Demand Structure
- 13.2 Leading Applications and Customer Groups
- 13.3 End-Use Market Size, Share and Forecast
- 13.4 Major End-Use Industry Deep Dives
- 13.4.1 Customer Requirements and Use Cases
- 13.4.2 Demand and Replacement Cycles
- 13.4.3 Technical and Regulatory Considerations
- 13.4.4 Purchasing and Procurement Models
- 13.4.5 Leading Vendors and Distribution Channels
- 13.4.6 Forecast and Commercial Opportunities
- 13.5 Emerging Applications and Cross-Segment Demand
- 13.6 End-Use Industry Investment Priorities
Chapter 14 Australia Digital Textile Printing Geographic Market Outlook, 2025-2035
- 14.1 Domestic Market Distribution and Demand Clusters
- 14.2 State- or Province-Wise Market Size and Forecast, 2025-2035
- 14.3 City and Metropolitan Market Outlook
- 14.4 Industrial, Manufacturing and Commercial Clusters
- 14.5 Geographic Concentration of Key End Users
- 14.6 Local Pricing and Purchasing Differences
- 14.7 Domestic Production Facilities and Capacity Map
- 14.8 Local Infrastructure and Project Pipeline
- 14.9 State-Level Policy and Incentive Differences
- 14.10 Subnational Investment Hotspots and Opportunities
- 14.11 Distribution and Logistics Networks
- 14.12 Domestic Competitive Footprint
Chapter 15 Australia Digital Textile Printing Technology, Innovation and Sustainability Outlook
- 15.1 Technology Landscape and Maturity
- 15.2 Product, Process and Service Innovation
- 15.3 AI, Automation and Digital Tools in the Industry
- 15.4 Technology Adoption and Performance Benchmarking
- 15.5 Innovation Pipeline and R&D Investment
- 15.6 Patent and Intellectual Property Trends
- 15.7 Energy Efficiency and Resource Management
- 15.8 Sustainability, Recycling and Circularity
- 15.9 Technology Roadmap, 2025-2035
- 15.10 Risks of Obsolescence and Technology Substitution
Chapter 16 Australia Digital Textile Printing Market Key Strategic Imperatives
- 16.1 Growth and Market Entry Priorities
- 16.2 High-Return Products and Segments
- 16.3 Pricing, Profitability and Cost Optimization
- 16.4 Technology Investment and Product Differentiation
- 16.5 Supply Chain Localization and Resilience
- 16.6 Distribution and Customer Acquisition
- 16.7 Partnership, Acquisition and Capacity Strategy
- 16.8 Regional Expansion Priorities
- 16.9 Short-, Medium- and Long-Term Actions
Chapter 17 Competition Outlook
- 17.1 Industry Competition Characteristics
- 17.2 Market Structure and Concentration
- 17.3 Market Share and Competitive Positioning, 2025
- 17.4 Company-Wise Revenue and Product Benchmarking
- 17.5 Production and Service Capacity Benchmarking
- 17.6 Technology, Pricing and Differentiation
- 17.7 Regional Footprint and Distribution Strength
- 17.8 Mergers, Acquisitions and Strategic Alliances
- 17.9 New Entrants and Competitive Threats
- 17.10 Porter's Five Forces and Industry Attractiveness
- 17.11 Competitive Outlook, 2025-2035
Chapter 18 Company Profiles
- 18.1 Company Coverage and Selection Criteria
- 18.2 IVE Group / AFI Branding
- 18.2.1 Business Description
- 18.2.2 Company Ownership and Geographic Presence
- 18.2.3 Product and Service Portfolio
- 18.2.4 Manufacturing and Operating Footprint
- 18.2.5 Production Capacity and Expansion Plans
- 18.2.6 Financial Performance and Investment
- 18.2.7 Market Share and Competitive Position
- 18.2.8 Technology and Innovation Capabilities
- 18.2.9 Strategic Alliances or Partnerships
- 18.2.10 Recent Developments
- 18.2.11 Growth Strategy and Outlook
- 18.3 Materialised
- 18.4 Mereton Textiles
- 18.5 Selby's
- 18.6 FABframe
- 18.7 Next Printing
- 18.8 Sublitech Printing
- 18.9 Digital Fabrics
- 18.10 Next State
- 18.11 PrintLocker
- 18.12 Other Relevant Market Participants
Note: Every listed company is profiled on the structure shown under the first company. The company list is preliminary and may change based on research findings, market developments, data availability and client requirements.
Chapter 19 Disclaimer
- 19.1 Research and Forecast Disclaimer
- 19.2 Data Source and Estimation Limitations
Note: The depth of individual sections depends on data availability for this market. Volume, capacity, trade and other unit-based metrics are included where applicable.

