
Efficiency per terahash now decides which rigs get bought
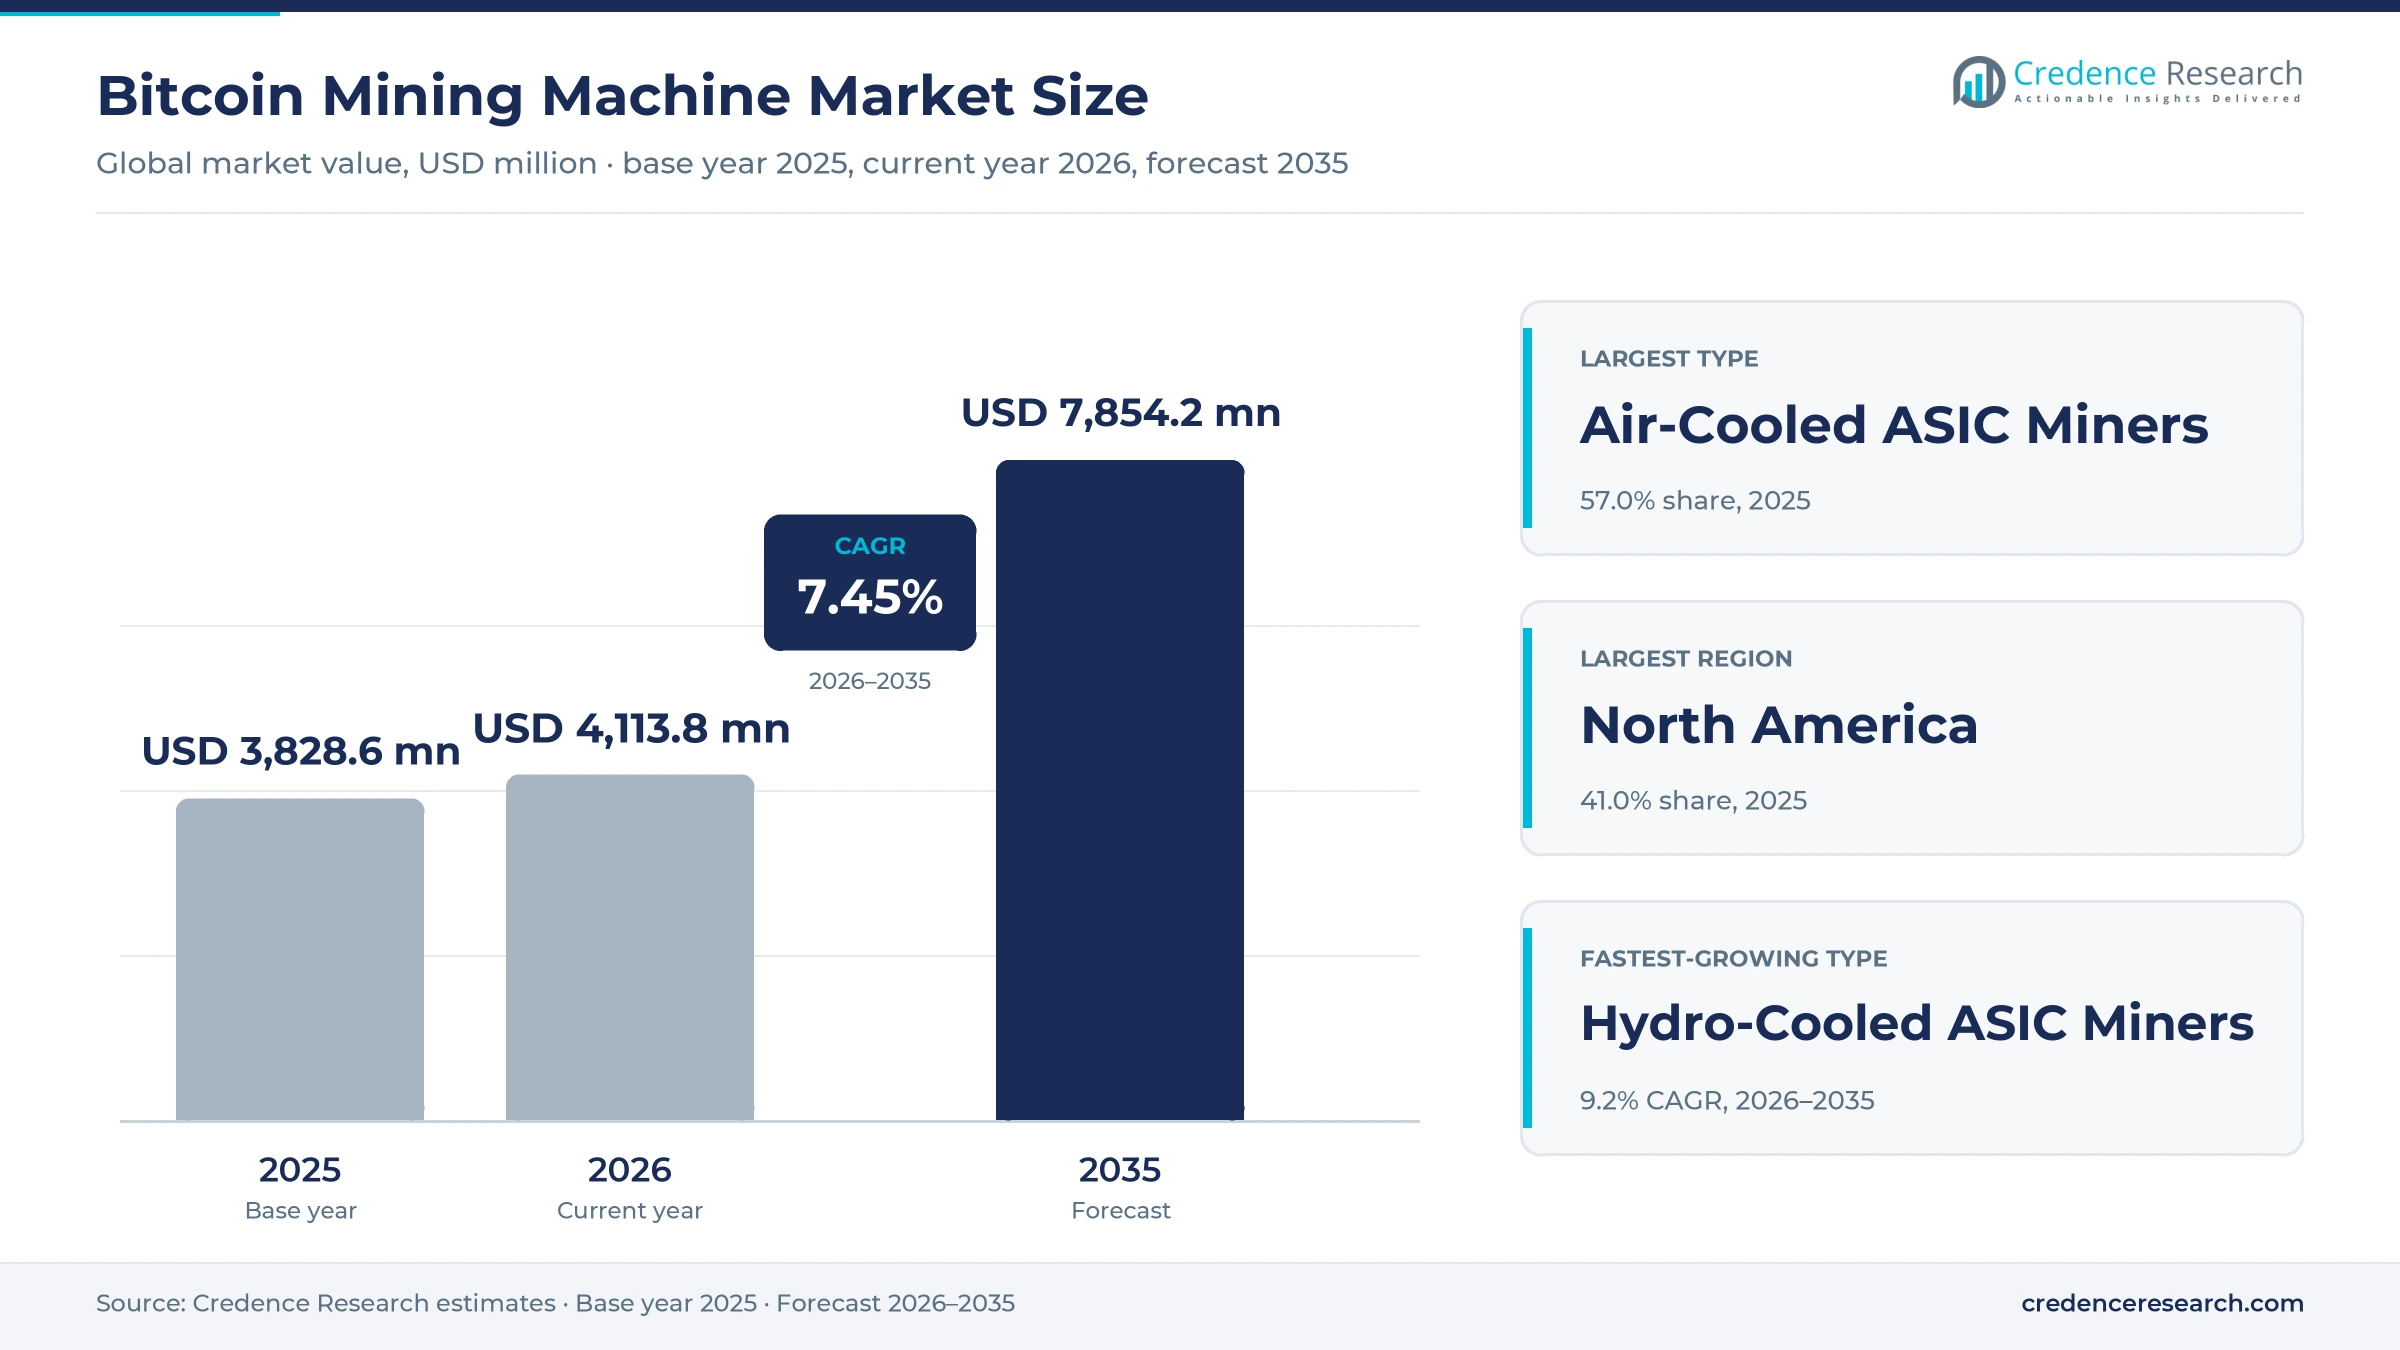
The global Bitcoin mining machine market was valued at USD 3.83 billion in 2025 and is projected to increase from USD 4.11 billion in 2026 to USD 7.85 billion by 2035, registering a CAGR of 7.45% during 2026–2035. Demand comes from listed and private mining companies, hosting providers and a small group of home miners that buy application-specific machines to secure the network and earn block rewards. North America held the largest regional share, 41.0% in 2025, because the United States hosts the largest fleets and the largest listed operators. Latin America is the fastest-growing region at 8.9% a year, as surplus hydropower in Paraguay and curtailed renewable output in Brazil draw new sites. The commercial change that matters most is the move to hydro-cooled machines rated below 10 joules per terahash, which are shipping from 2026 and make older fleets uneconomic at the low hashprice of late 2025.
Which rigs count, and why are GPU and FPGA miners gone?
The estimate covers new SHA-256 application-specific machines, often called mining rigs or mining servers, sold to operators for mining bitcoin. It includes air-cooled, hydro-cooled and immersion-ready units and small home units, valued at the first sale price paid to the manufacturer or its authorized channel.
Used machines resold between operators, hosting fees, cloud mining contracts, pool services and separately sold containers or tanks sit outside the estimate. Graphics cards and programmable chips are no longer competitive for bitcoin mining, so they are excluded even where they still mine other coins. Operators buy mostly by the terahash, under supply agreements or spot orders, which ties spending closely to mining margins.
Bitcoin Mining Machine Market Insights
- The market is valued at USD 3.83 billion in 2025 and is projected to reach USD 7.85 billion by 2035, growing at a 7.45% CAGR as fleets replace older machines.
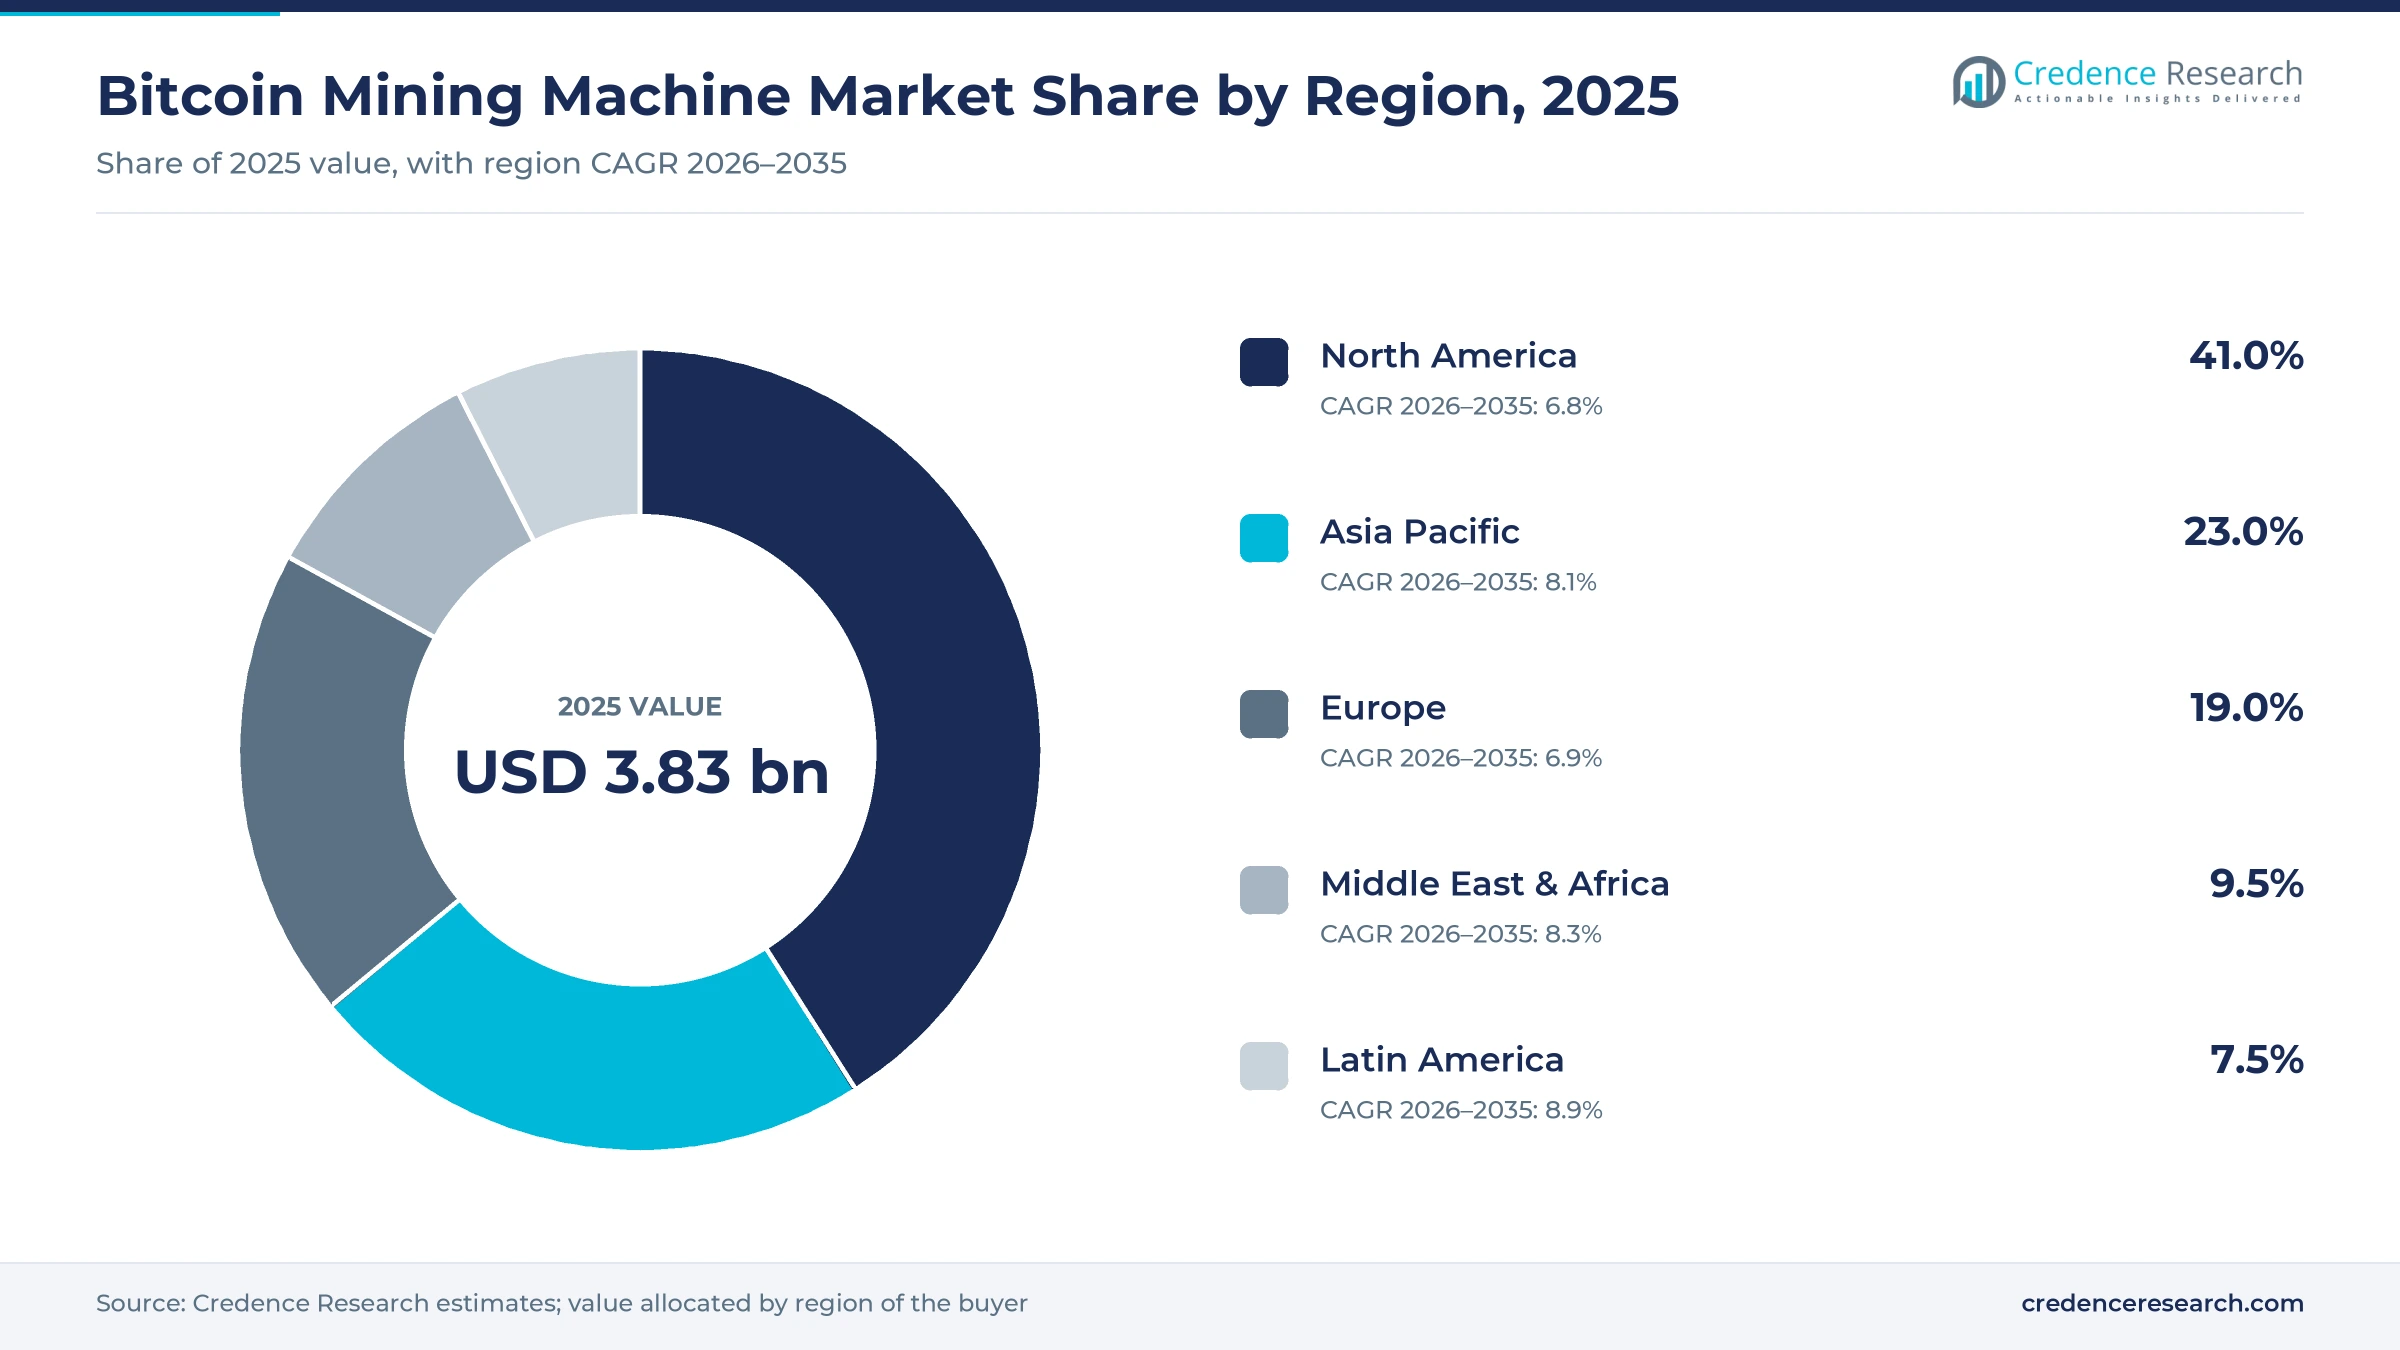
- North America led with 41.0% of 2025 value, because the largest listed mining fleets operate in Texas, Georgia and other U.S. states.
- Air-Cooled ASIC Miners held 57.0% of 2025 value, while Hydro-Cooled ASIC Miners grow fastest at 9.2% a year.
- Network hashrate crossed 1,000 EH/s on Oct. 11, 2026, while USD hashprice averaged USD 37.97 per PH/s a day that month.
- Bitmain built 82% of the world's bitcoin mining machines in the Cambridge survey of April 2025, which leaves buyers with few alternatives.
Air-cooled rigs lead while hydro units grow fastest
Why do air-cooled rigs lead while hydro units grow fastest?
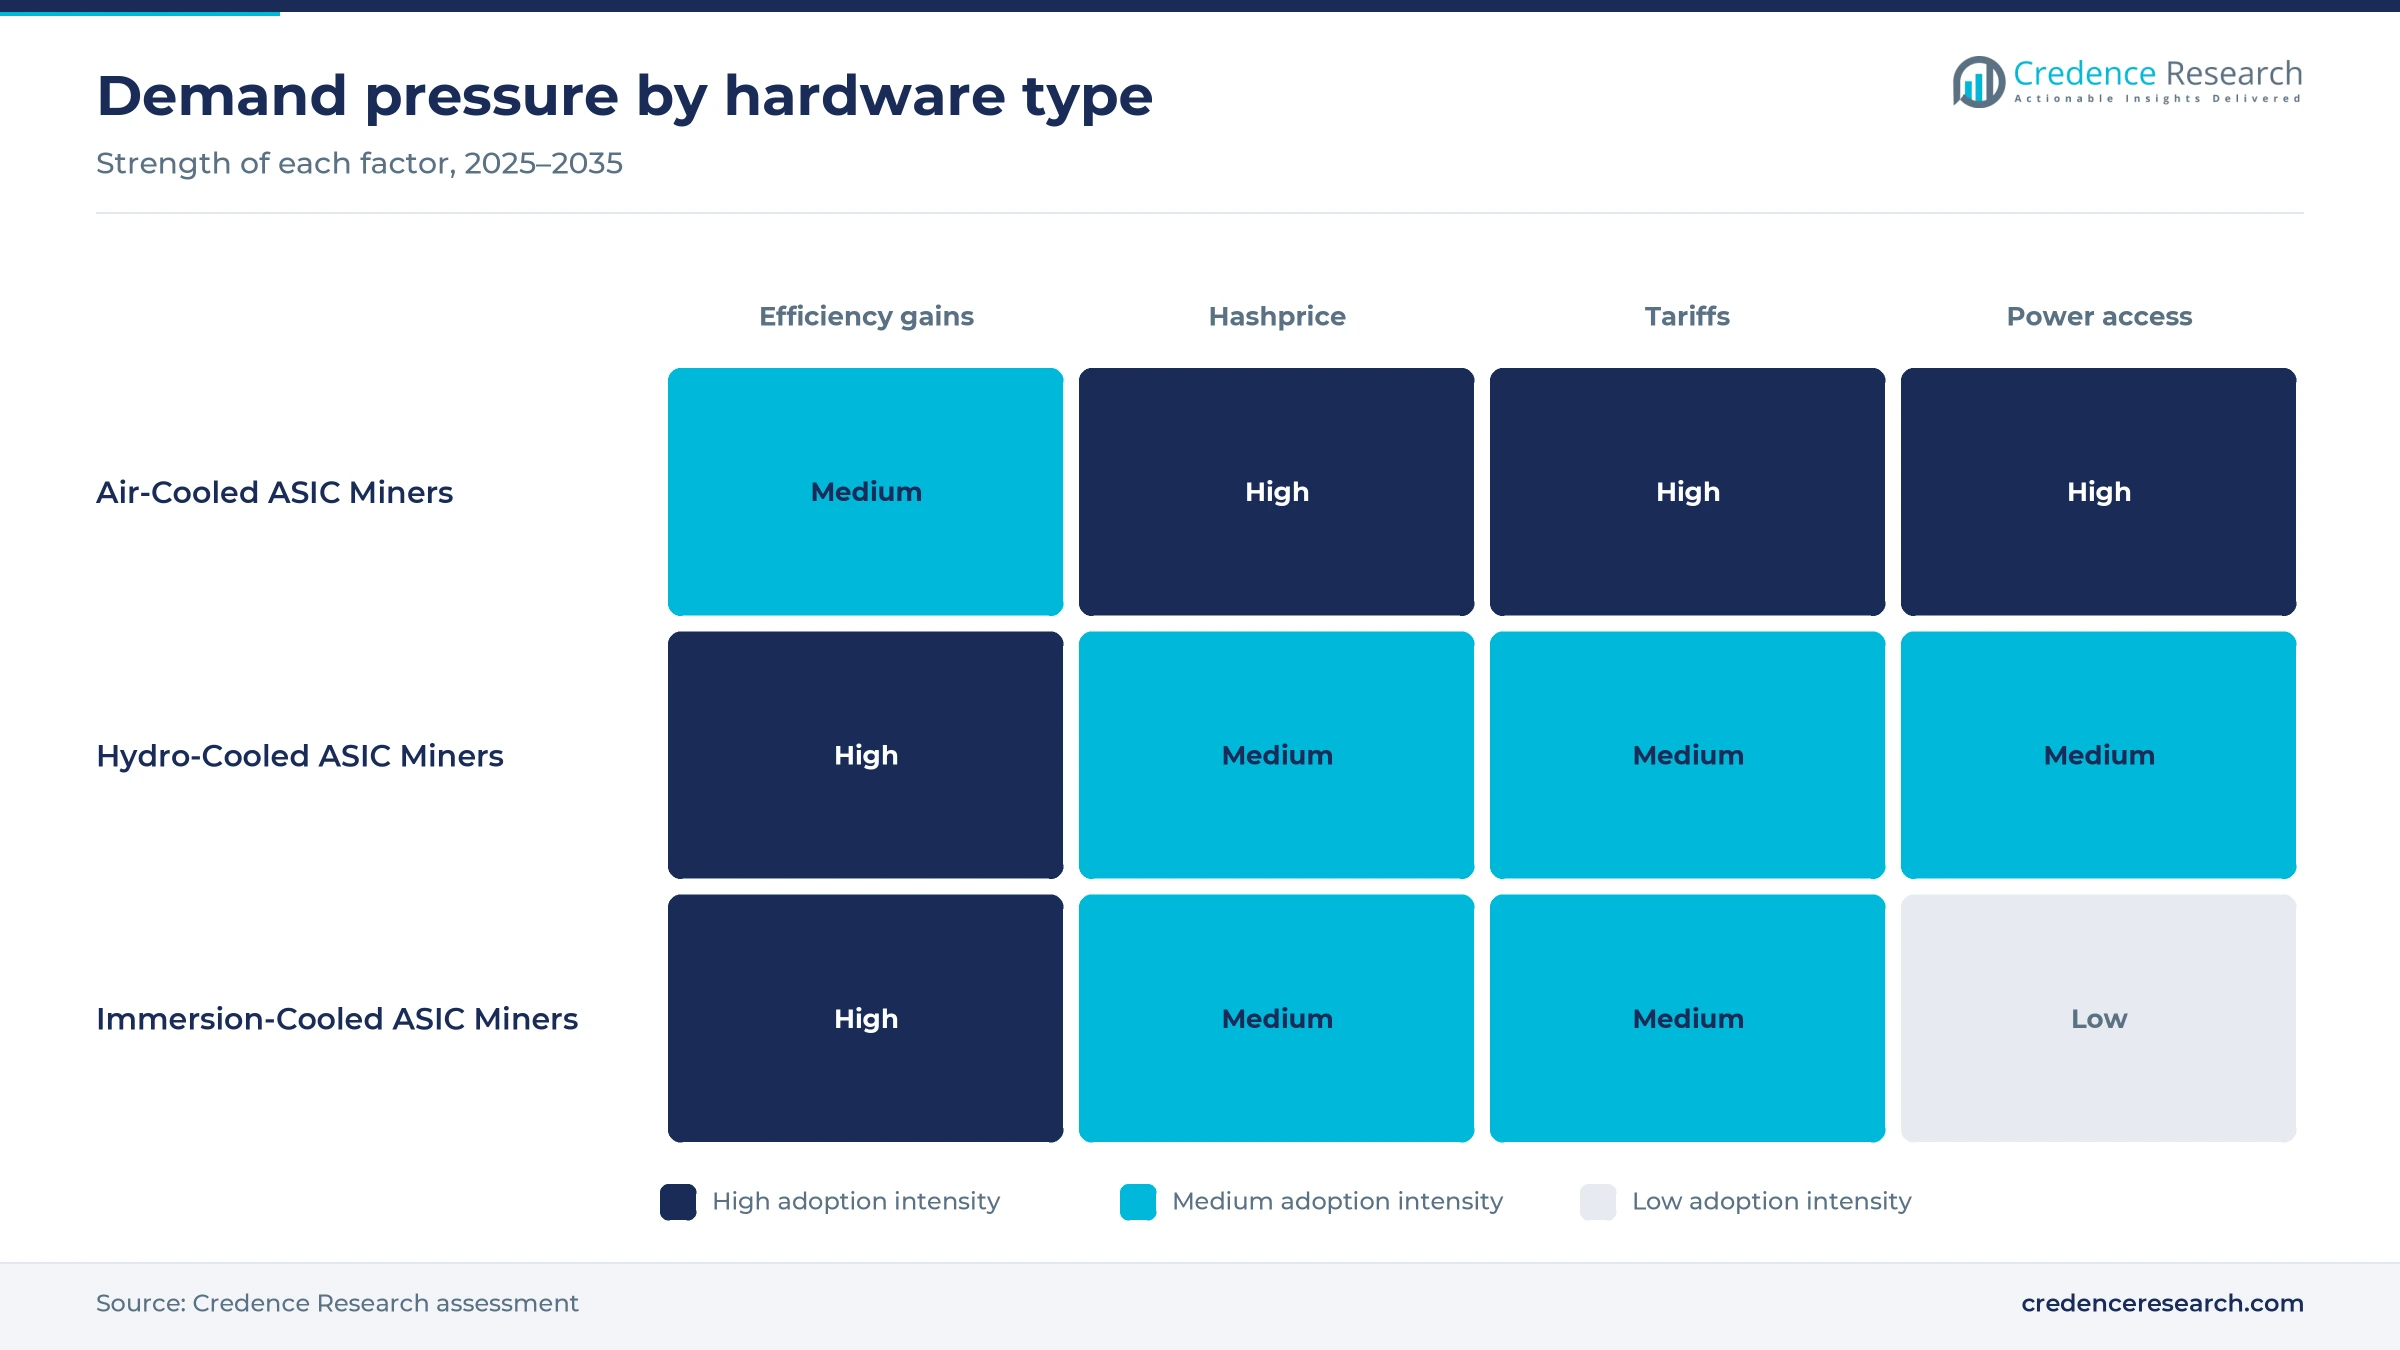
Based on hardware type, the market is categorized into air-cooled ASIC miners, hydro-cooled ASIC miners and immersion-cooled ASIC miners. Air-Cooled ASIC Miners led with 57.0% of 2025 value because they need no water loops and suit fast builds on cheap grid power. Phoenix Group equipped its 30 MW Addis Ababa phase with about 5,300 air-cooled units in November 2025. Hydro-Cooled ASIC Miners grow fastest at 9.2% a year as flagship models shift to liquid. Bitmain rated its Antminer S23 Hydro at 580 TH/s and 9.5 J/TH in May 2025, with first shipments planned for early 2026.
Why do enterprise fleets dominate rig purchases?
Based on application, the market is categorized into enterprise mining and individual mining. Enterprise Mining led with 94.0% of 2025 value because industrial operators buy machines by the exahash under multi-year power contracts. Canaan reported a deal for 50,000 Avalon A15 Pro machines with a North American client in its fourth-quarter 2025 results. Individual Mining grows fastest at 8.6% a year from a small base, as makers sell compact units to households. Canaan priced its 6 TH/s Avalon Nano 3S at USD 249 at CES in January 2025, which brings solo mining within reach of hobby buyers.
Why do direct sales lead and keep gaining ground?
Based on distribution channel, the market is categorized into direct manufacturer sales and resellers and online stores. Direct Manufacturer Sales led with 76.0% of 2025 value because large fleets negotiate price, delivery slots and warranty terms with the factory. Bitdeer had sold 7.9 EH/s of its SEALMINER A2 machines to outside operators by December 2025. The same channel also grows fastest at 7.6% a year, since makers such as Bitmain now clear older stock through their own online auctions, according to TheMinerMag, a channel that bypasses resellers. Resellers keep a role with smaller buyers outside the main mining hubs.
| Segment Group | Leading Sub-segment | Share, 2025 | Fastest-growing Sub-segment | CAGR, 2026–2035 |
|---|---|---|---|---|
| By Hardware Type | Air-Cooled ASIC Miners | 57.0% | Hydro-Cooled ASIC Miners | 9.2% |
| By Application | Enterprise Mining | 94.0% | Individual Mining | 8.6% |
| By Distribution Channel | Direct Manufacturer Sales | 76.0% | Direct Manufacturer Sales | 7.6% |
Rig prices fell to between USD 3 and USD 30 per terahash
Machines are priced per terahash of rated output, and that price follows hashprice, the daily revenue a unit of hashrate earns. Efficient models hold a premium because they stay profitable longer as difficulty rises. When hashprice sank near USD 35 per PH/s a day in late 2025, Bitmain cut prices on older S19 units to clear stock, as the table shows. U.S. buyers also pay the import tariffs described under the challenges, which widens the gap between U.S. and offshore landed costs. Makers protect margins by preselling new generations, while operators with spare power can buy discounted older units for short payback periods.
| Machine or price point | Typical price or fee | Basis |
|---|---|---|
| Antminer S23 Hydro preorder | USD 30 per TH, USD 25.5 with coupons | TheMinerMag, May 2025 |
| Antminer S21+ Hydro | About USD 8 per TH before coupons | TheMinerMag, December 2025 |
| Antminer S19k Pro auction | USD 5.5 per TH starting bid | TheMinerMag, December 2025 |
| S19e XP Hydro and 3U S19 XP Hydro | As low as USD 3 per TH | TheMinerMag, December 2025 |
| Canaan machines sold, fourth quarter 2025 | About USD 8.1 per TH realized | Credence Research estimate from Canaan quarterly disclosures |
Request a Free Sample
Fill in your details and we'll send you a free sample report.
- Sample data tables & charts
- Research methodology
Hashrate growth and thin margins force fleet upgrades
Network hashrate growth keeps fleets expanding
Each rise in network hashrate lifts mining difficulty, so operators must add machines just to keep their share of block rewards. Network hashrate rose from 778 EH/s in December 2024 to about 1,048 EH/s in December 2025, roughly 34% in one year, TheMinerMag reported. The 7-day average crossed 1,000 EH/s again on Oct. 11, 2026, and reached 1,067 EH/s by Oct. 31, according to Hashrate Index. CoinShares projected in March 2026 that hashrate could reach 1.8 zettahash by the end of 2026. Makers with spare wafer allocation gain from this race, because every operator must buy hashrate to stand still.
Thin margins force replacement of older rigs
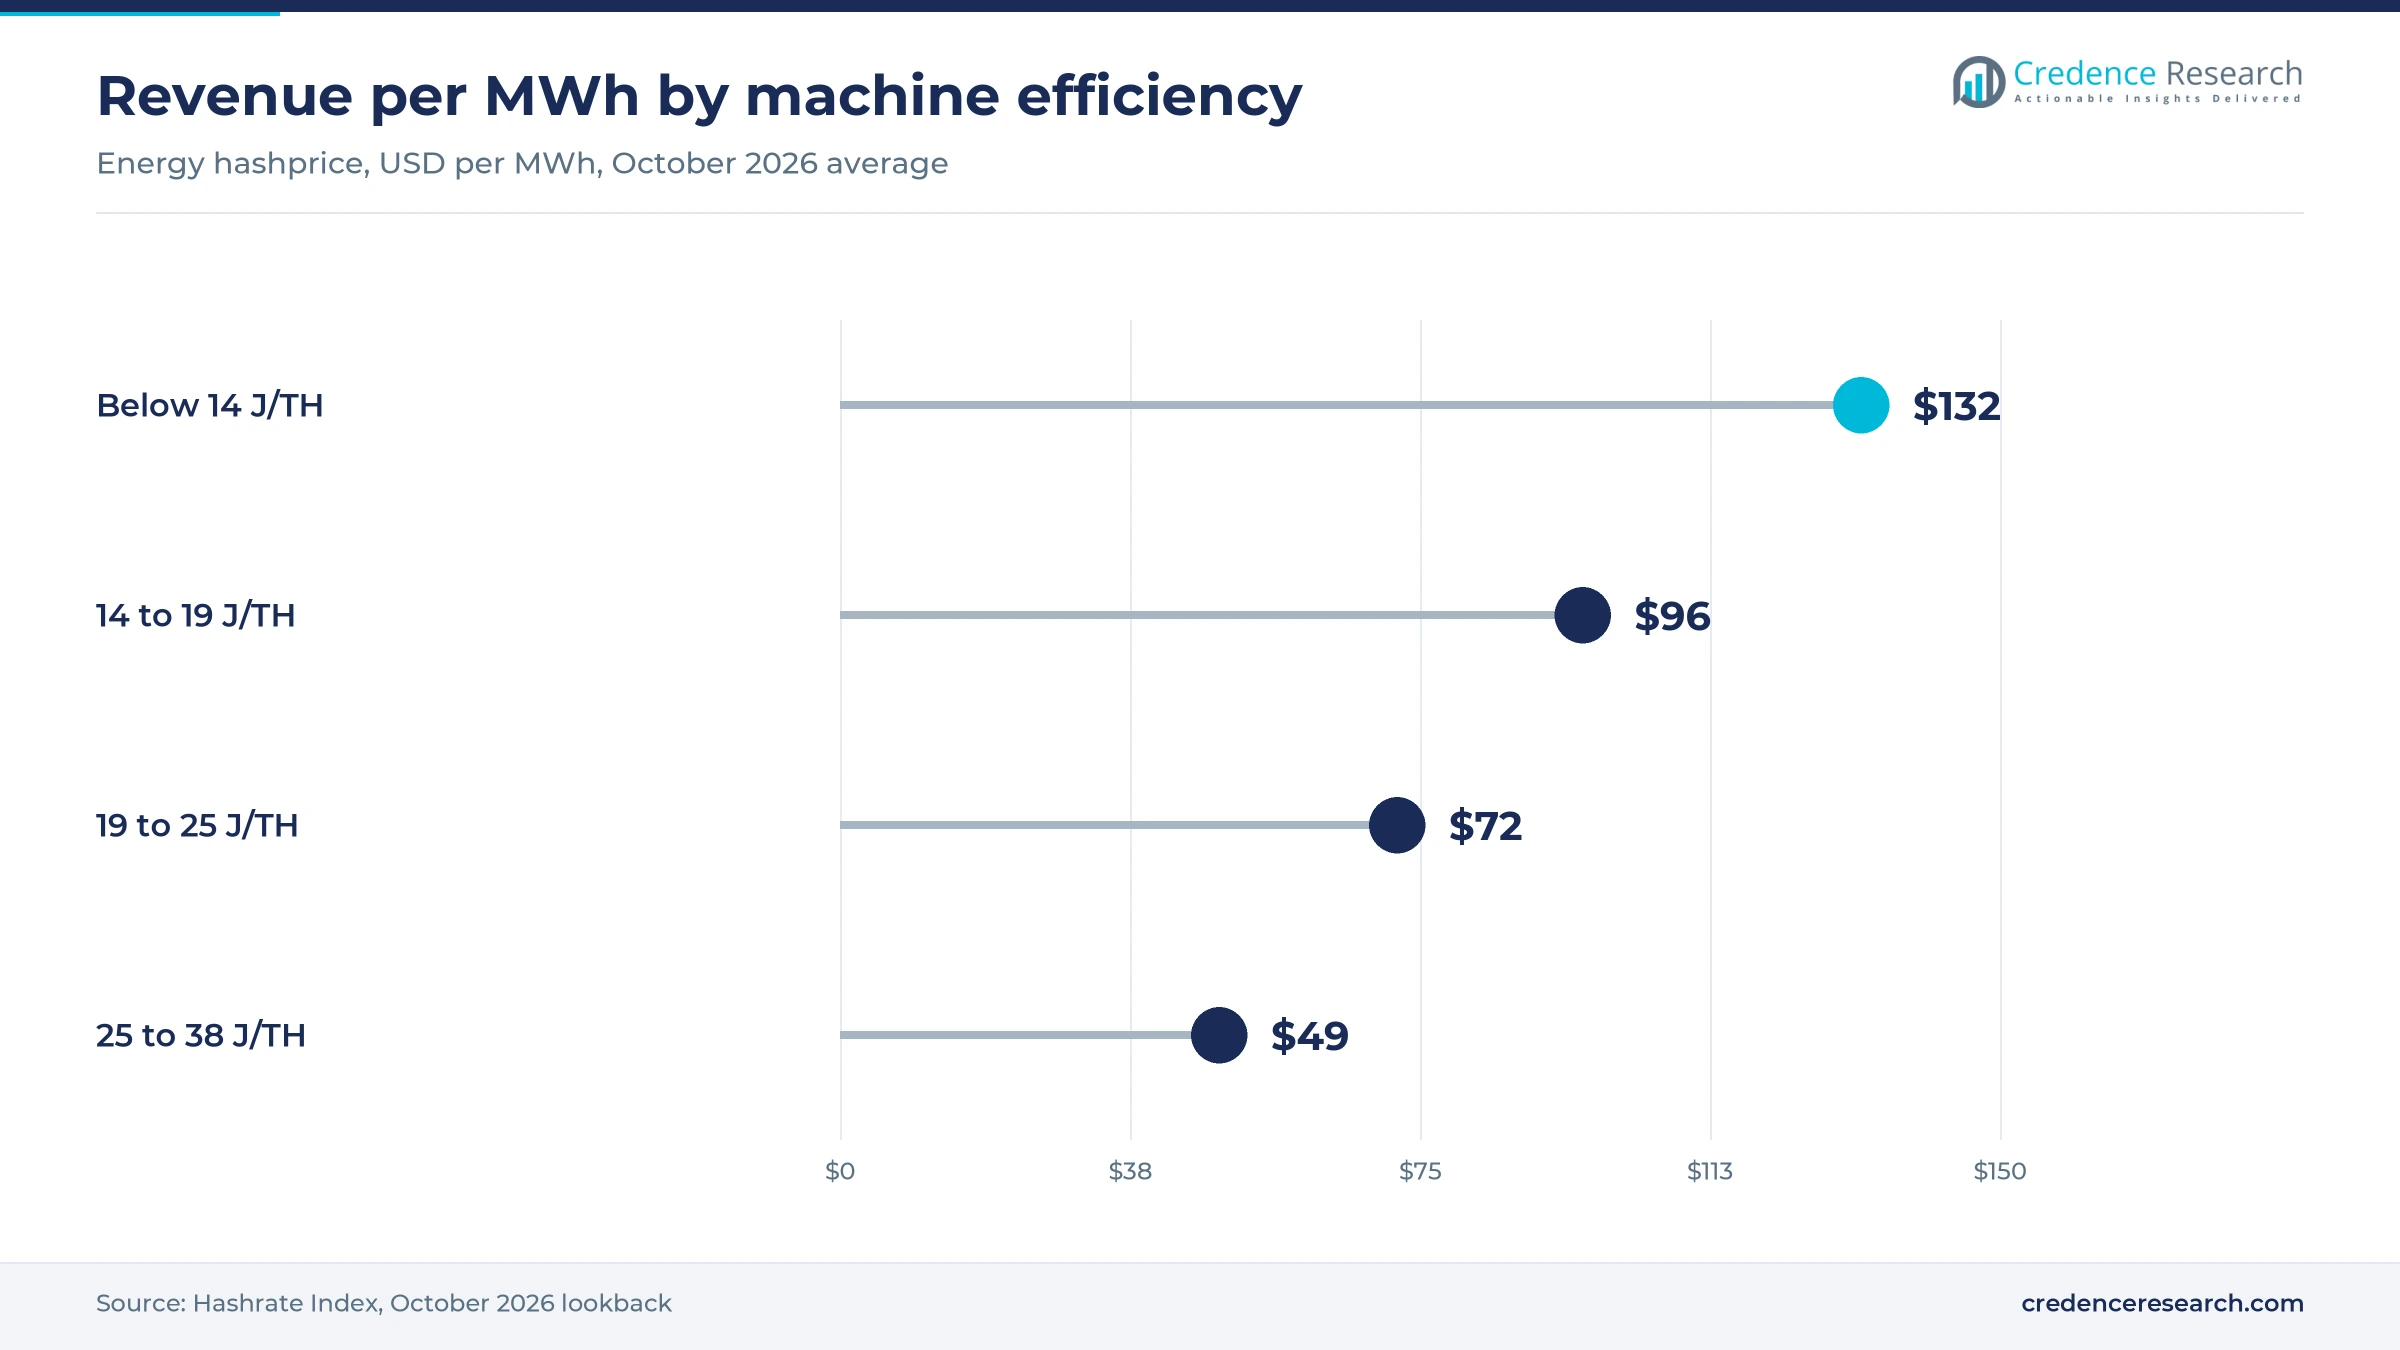
Low hashprice makes the efficiency of a machine the main test of whether it can run, which pushes operators to retire older units early. CoinShares put the weighted cash cost of listed miners at about USD 79,995 per bitcoin in the fourth quarter of 2025, close to the market price at the time. In October 2026, Hashrate Index estimated that machines below 14 J/TH earned about USD 132 per MWh of power, against USD 49 for 25 to 38 J/TH units. Average industrial power cost USD 48 per MWh in the same month. Older fleets therefore barely cover power, and the replacement cycle shortens.
Stranded and surplus power opens new sites
Miners move to places where power is cheap or would otherwise be wasted, and each new site needs a full set of machines. Kazakhstan approved Resolution No. 638 on July 18, 2026, giving miners regulated power quotas if they run machines of at least 150 TH/s, Cointelegraph reported. Brazil curtailed 1,445 renewable plants in 2024, and YPF runs a flared-gas mining pilot at Vaca Muerta in Argentina, according to Hashrate Index. Luxor's Ethan Vera named Canada, Northern Europe, Ethiopia, Brazil, Argentina, Chile and Paraguay as likely destinations for new machines in 2025. Sellers that can ship to these sites gain buyers outside the United States.
Large operators place exahash-scale orders
Industrial operators buy machines in exahash blocks to fill new power capacity, which gives makers large, concentrated orders. Canaan agreed to supply Cipher Mining with about 6,840 Avalon A15Pro units, roughly 1.5 EH/s, for delivery to its Texas site in the third quarter of 2025. Bitdeer raised its self-mining hashrate to 55.2 EH/s in December 2025, from 8.5 EH/s a year earlier, mostly with its own SEALMINER machines. Phoenix Group reported 4.34 EH/s of self-mining hashrate in November 2025 and planned further expansion in Ethiopia and North America. These buyers secure delivery slots and volume discounts first, while smaller operators wait for later batches or turn to resellers.
Liquid cooling and U.S. assembly reshape rig supply
Flagship rigs are shifting toward liquid cooling
Makers are shifting their top models to hydro and immersion cooling to pack more hashrate into each rack and run chips harder in hot climates. MicroBT launched its Whatsminer M70 series in Abu Dhabi on Dec. 8, 2025, with liquid-cooled models and a rack-mounted M79S above 1 PH/s per unit. Hashrate Index expects hydro-cooled deployments to increase across large sites during 2026. Phoenix Group used hydro cooling for the second phase of its Ethiopian site in 2025. Suppliers of immersion cooling tanks and dry coolers gain, while operators with air-cooled halls face retrofit costs before they can run the newest models.
Rig makers are shifting assembly into the United States
Chinese makers are moving final assembly into the United States to cut tariff exposure and delivery times for their largest customers. Bitmain started U.S. production in December 2024 and planned full-scale manufacturing with 250 local workers by the end of 2026, Bloomberg reported in July 2025. Canaan ran a pilot U.S. line, and MicroBT said it was implementing a localization strategy, Reuters reported on June 18, 2025. Auradine said its Teraflux miners were built and engineered in the United States in November 2025. U.S. buyers gain shorter repair cycles and lower duty bills, but chips and boards still come from Asian foundry and assembly supply, so a full local supply chain is still years away.
Modular, repairable rigs open a long-life fleet market
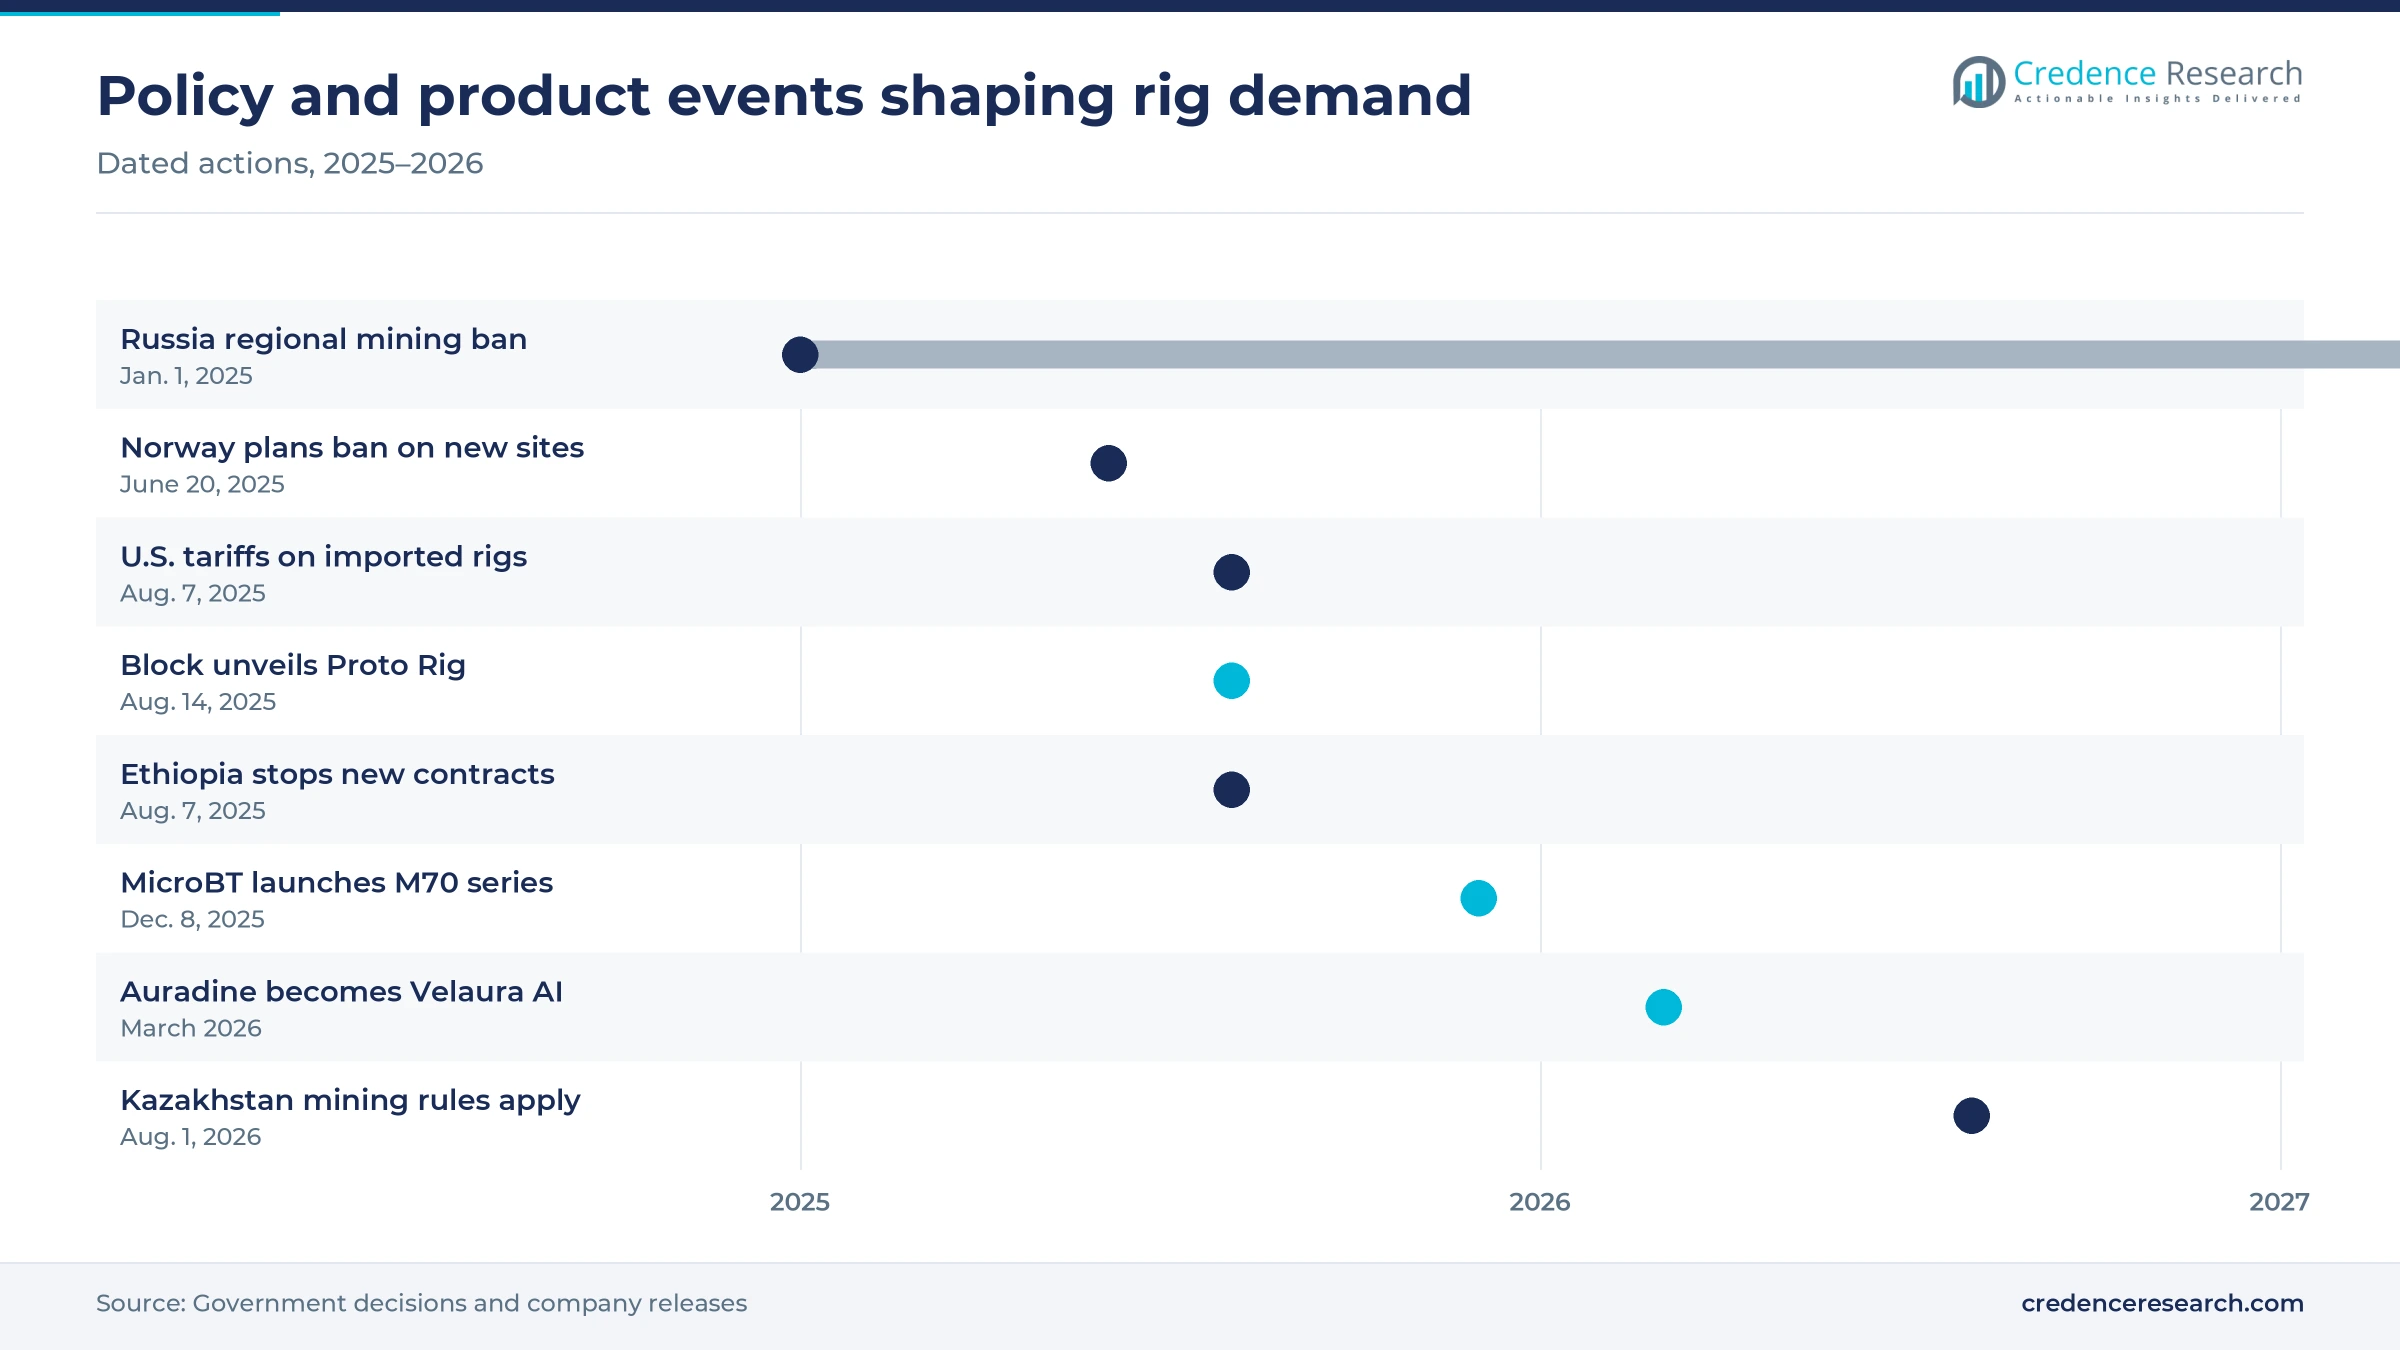
Operators that want to stop scrapping whole machines every three to five years have an opening in modular designs. Block unveiled the Proto Rig on Aug. 14, 2025 at Core Scientific's Dalton, Georgia, site, with swappable hashboards and a claimed 10-year life. Block said each upgrade cycle cuts costs by 15% to 20%, and it released its Proto Fleet management software as open source. Hashrate Index expects new hardware near 7 J/TH in 2026, so boards that can be upgraded in place protect capital. Large fleets with in-house technicians stand to gain the most, because they can swap boards without shipping units back to the factory.
Home heat-recovery units open a consumer niche
Households in cold climates can turn mining heat into space heating, which opens a small but distinct consumer market for quiet units. Canaan launched the Avalon Mini 3 at CES in January 2025, a 37.5 TH/s miner sold as a heater for USD 899 on preorder. Canaan also said in its fourth-quarter 2025 results that it was piloting heat recovery projects. Individual Mining grows at 8.6% a year, faster than enterprise demand. Makers that offer app control, low noise and retail warranties can sell at higher prices per terahash than fleet units, although the niche stays small next to industrial demand.
Tariffs, security probes and power rules raise risk
U.S. tariffs raise the landed cost of rigs
Import duties raise the cost of every machine shipped into the largest buyer market. Under the rates in force from Aug. 7, 2025, machines from China faced a combined 57.6% tariff, and units from Malaysia, Thailand and Indonesia faced 21.6%, a 19% reciprocal rate on top of the 2.6% standard duty. U.S. operators without local supply are most exposed, while buyers in Canada and Russia gain cheaper machines. U.S. assembly lines cut part of that burden, but chips and hashboards still arrive from Asia and carry duty.
A security probe clouds supply from the leading maker
Dependence on a single supplier turns a regulatory inquiry into a supply risk for U.S. fleets. Bloomberg reported on Nov. 21, 2025, that a Homeland Security investigation called Operation Red Sunset examined whether Bitmain machines could be controlled remotely, including inspections at U.S. ports. Bitmain called the claims unequivocally false and denied any security risk. Operators that run mostly Antminer fleets face detention and compliance risk, while MicroBT, Canaan and U.S. designers can position themselves as alternatives.
Regional power rules close sites to new fleets
Governments that need power for homes and industry are closing regions to mining, which removes buyers. Russia banned mining in 10 regions from Jan. 1, 2025, to March 15, 2031, and added winter limits in parts of Irkutsk, Buryatia and Zabaikalsky, Cointelegraph reported. Makers of older, cheaper units lose one of their largest markets as a result. The bans respond to winter grid shortages, so the Cambridge Centre for Alternative Finance finding of April 2025 that sustainable sources supplied 52.4% of mining energy does little to ease them.
AI hosting draws power away from mining fleets
Listed miners are redirecting power and capital from mining toward AI hosting, which slows their machine purchases. IREN signed a USD 9.7 billion, five-year AI cloud contract with Microsoft on Nov. 3, 2025, at its 750 MW Childress, Texas, campus. CoinShares counted more than USD 70 billion of AI and HPC contracts across public miners by March 2026. Makers lose some of their most creditworthy buyers, while operators that build GPU cloud capacity earn steadier returns.
North America buys most rigs as Latin America grows fastest
| Region | Value, 2025 (USD billion) | Share, 2025 | CAGR, 2026–2035 |
|---|---|---|---|
| North America | 1.57 | 41.0% | 6.8% |
| Asia Pacific | 0.88 | 23.0% | 8.1% |
| Europe | 0.73 | 19.0% | 6.9% |
| Middle East & Africa | 0.36 | 9.5% | 8.3% |
| Latin America | 0.29 | 7.5% | 8.9% |
North America leads on the largest listed fleets
North America held 41.0% of 2025 value and grows at 6.8% a year, slower than the global rate because of tariffs and the AI shift. The U.S. Energy Information Administration estimated in February 2024 that mining used 0.6% to 2.3% of U.S. electricity, across 137 identified facilities. Foundry USA, MARA Pool and Luxor mined more than 40% of blocks at the start of 2025 but about 35% by December, TheMinerMag reported, a sign that hashrate outside U.S.-based pools grew faster, although these pools also serve foreign miners.
Asia Pacific gains as China mining returns
Asia Pacific held 23.0% of 2025 value and grows at 8.1% a year, the second-fastest rate, with Central Asia counted in the region. China regained about 14% of global hashrate by October 2025 despite its 2021 ban, Reuters reported, citing Hashrate Index data. Cheap power in Xinjiang and other inland provinces is drawing those fleets back, and makers based in the region ship to them without U.S. tariff costs.
Europe is held back by bans in Norway and Russia
Europe, including Russia, held 19.0% of 2025 value and grows at 6.9% a year, below the global rate. Norway's government announced plans on June 20, 2025, for a temporary ban on new mining data centers, so that power goes to other industries. Russia's regional bans, noted above, push Russian fleets toward Siberian and northern grids. Russian miners can still buy machines more cheaply than U.S. buyers because they face no U.S. tariffs, which keeps the region a large market for discounted units.
Latin America grows fastest on Paraguayan hydropower
Latin America held 7.5% of 2025 value and grows at 8.9% a year, the fastest of any region. Paraguay held about 4.3% of global hashrate in the second quarter of 2026, about 43 EH/s and up 54% in a year, according to Hashrate Index. The state utility ANDE charges an energy rate of about USD 0.037 per kWh to large high-voltage users. Brazil reached 3.5 EH/s, up 133%, but treaty and tariff changes could alter the pricing of surplus power.
Middle East & Africa depends on Ethiopian grid access
Middle East & Africa held 9.5% of 2025 value and grows at 8.3% a year, led by Ethiopian and Gulf operators. Ethiopian Electric Power said on Aug. 7, 2025, that it would sign no further mining contracts, after 21 operators had already secured power supply agreements. Phoenix Group still raised its Ethiopian portfolio to 132 MW in 2025. New rig demand therefore depends on contracts already signed and on Gulf sites.
Rig launches and fleet orders defined late 2025 and 2026
| Development | Status and market relevance |
|---|---|
| In August 2025, Block unveiled its Proto Rig and open-source Proto Fleet software, with rigs already mining at Core Scientific in Georgia. | Launched; rigs already mining in a partner fleet |
| In December 2025, MicroBT launched the Whatsminer M70 series in Abu Dhabi, with efficiency classes of 12.5, 13.5 and 14.5 J/TH. | Announced; shipping dates not disclosed |
| In February 2026, Canaan reported a deal for 50,000 Avalon A15 Pro machines with a North American client in its fourth-quarter results. | Order; largest disclosed Canaan contract |
| In March 2026, Auradine rebranded as Velaura AI and said remaining Teraflux machines would move to its own mining operations. | Completed; a U.S. designer leaves external rig sales |
| In July 2026, Kazakhstan approved rules for strategic digital mining that require units of at least 150 TH/s, effective Aug. 1, 2026. | Approved; sets a hardware floor for state power quotas |
Sub-10 J/TH chips and liquid cooling change the product
- Sub-10 J/TH chips cut the power needed per terahash, and Bitdeer said its SEAL04-1 chip reached about 6 to 7 J/TH at chip level in a power-saving mode, with mass production targeted for early 2026.
- Hydro cooling moves heat through water plates in the machine, which allows higher clock speeds and denser racks than fans.
- Modular hashboards let operators replace or upgrade boards without scrapping the chassis, power supply and control unit.
- Curtailment firmware lets machines throttle or stop when power prices spike, and Luxor said its LuxOS firmware cut curtailment intervals by about 18% in 2025.
Need a Custom Version of This Report?
Tailor the scope, geography, or segments to your exact requirements.
- Custom geography or segment scope
- Direct access to our analyst team
Three Chinese makers face new U.S. and in-house rivals
Competition turns on three factors that operators weigh before committing capital to a fleet. The first is efficiency per terahash, where Bitmain, MicroBT and Bitdeer release new generations roughly every year and price them against the current hashprice. The second is delivery and service, which now includes U.S. assembly, local repair centers and firmware support, since tariffs and customs checks lengthen import times. The third is financing, because large buyers expect volume discounts, payment in bitcoin or staged delivery. Canaan competes on price and on home units, while Block sells modular rigs that promise a longer life for each chassis. Bitdeer uses its own fleet as a test bed before selling surplus output to outside operators.
How concentrated is the supply of mining rigs?
Supply is among the most concentrated of any hardware market, because few firms can fund new chip designs on leading-edge wafers every year. The Cambridge Digital Mining Industry Report of April 2025 found that Bitmain built 82% of machines, MicroBT 15% and Canaan 2%, Cointelegraph reported. Bitdeer and Block now design their own chips, but both use much of their output in their own or partner fleets. Margins sit with the chip designers, since operators compete on power cost and buy a near-commodity product. Barriers include wafer access, firmware and the after-sales repair network.
Companies profiled and their roles in this market
| Company | Type | Role in the market |
|---|---|---|
| Bitmain Technologies Ltd. | Chip designer and rig maker | Antminer S21 and S23 series in air, hydro and immersion versions |
| MicroBT (Whatsminer) | Chip designer and rig maker | Whatsminer M70 series and rack-mounted hydro units |
| Canaan Inc. | Chip designer and rig maker | Avalon A15 series fleet units and Avalon Mini and Nano home units |
| Bitdeer Technologies Group | Chip designer, rig maker and miner | SEALMINER A2 and A3 machines for its own fleet and outside buyers |
| Block, Inc. (Proto) | Chip designer and rig maker | Modular Proto Rig and open-source Proto Fleet software |
Hashprice, not bitcoin price alone, sets rig demand
Credence Research's view is that hashprice, more than the bitcoin price alone, will set demand for mining rigs through 2028. With cash costs close to the market price, operators buy only machines that pay back within one or two years, so efficiency below 10 J/TH becomes the entry ticket. Bitmain's share gives it pricing power, but tariffs and security checks give U.S. buyers a reason to qualify a second supplier. Investors should track hashprice, U.S. assembly output and the share of miner power moving to AI hosting.
Old estimate rolled forward and checked against hashrate
The report uses 2025 as the base year and 2035 as the forecast horizon, with values in current U.S. dollars. The 2025 value carries forward the earlier Credence Research estimate at its stated growth rate and was checked against network hashrate growth, realized prices per terahash and the hardware spending implied by miner revenue. Regional, segment and scenario splits are Credence Research estimates built from hashrate distribution data, company production updates and product launch data. Inputs include company filings and press releases, U.S. Energy Information Administration data, the Cambridge Centre for Alternative Finance survey, Hashrate Index data and reputable trade press. No interviews or proprietary surveys were used to build these estimates.
Replacement demand carries growth through two halvings
Growth to 2035 depends on replacement demand more than on new operators. Each new generation of chips makes older fleets uneconomic, and the 2028 and 2032 halvings will cut rewards and force further upgrades. Hydro-cooled and modular machines will take a larger share of value, while home units remain a small niche. Latin America and Asia will add sites faster than the United States, where tariffs and AI hosting compete for capital. On the base case, the market reaches USD 7.85 billion by 2035.
Hashprice and power access set the range of outcomes
The range of outcomes rests on two questions that buyers and makers cannot control. The first is whether hashprice recovers from the lows of late 2025 and 2026, which depends on the bitcoin price and fees after the 2028 halving. The second is how much power listed miners shift to AI hosting. A weak price and a fast AI shift would drag growth below the base case, while a strong price would lift it above.
| Scenario | CAGR, 2026–2035 | Value, 2035 | What has to hold |
|---|---|---|---|
| Downside | 5.5% | USD 6.63 billion | Hashprice stays near USD 35 per PH/s a day and miners move more power to AI |
| Base | 7.45% | USD 7.85 billion | Hashprice recovers slowly and fleets replace older rigs on a normal cycle |
| Upside | 9.4% | USD 9.27 billion | A higher bitcoin price restores margins and new sites open in Latin America and Asia |
Frequently Asked Questions
How big is the Bitcoin mining hardware market?
How much does a Bitcoin mining machine cost?
What does it cost to mine one bitcoin?
How much does a Bitcoin miner earn per terahash?
Who makes Bitcoin mining machines?
What share of Bitcoin mining uses renewable energy?
Which hardware type grows fastest in the cryptocurrency mining equipment market?
Which region leads the Bitcoin mining machine market?
Table of Content
Chapter 1 Market Segmentation
- 1.1 Segmentation Framework
- 1.1.1 Product and Service Classification
- 1.1.2 Application and End-Use Classification
- 1.1.3 Technology and Solution Classification
- 1.1.4 Customer and Distribution Channel Classification
- 1.1.5 Geographic Segmentation
- 1.1.6 Market Segment Definitions and Boundaries
- 1.2 By Hardware Type
- 1.2.1 Air-Cooled ASIC Miners
- 1.2.2 Hydro-Cooled ASIC Miners
- 1.2.3 Immersion-Cooled ASIC Miners
- 1.3 By Application
- 1.3.1 Enterprise Mining
- 1.3.2 Individual Mining
Chapter 2 Introduction
- 2.1 Report Objectives and Scope
- 2.2 Product Definition and Industry Terminology
- 2.3 Market Inclusions and Exclusions
- 2.4 Research Process
- 2.4.1 Primary Research and Expert Interviews
- 2.4.2 Secondary Research and Source Review
- 2.4.3 Top-Down and Bottom-Up Estimation
- 2.4.4 Data Triangulation and Verification
- 2.5 Market Size Measurement Basis
- 2.5.1 2025: USD 3.83 billion → 2035: USD 7.85 billion
- 2.6 Historical and Forecast Reference Periods
- 2.6.1 Historical Period: 2018-2025
- 2.6.2 Base Year: 2025
- 2.6.3 Forecast Period: 2025-2035
- 2.7 Research Assumptions and Limitations
Chapter 3 Executive Summary
- 3.1 Market Snapshot and Key Findings
- 3.2 Base-Year Market Size, 2025
- 3.3 Forecast Market Size, 2035
- 3.4 Revenue and Volume Growth Outlook
- 3.5 Key Demand and Supply Indicators
- 3.6 Leading Market Segments
- 3.7 Fastest-Growing Market Opportunities
- 3.8 Regional Performance Highlights
- 3.9 Technology and Industry Transformation
- 3.10 Competitive Landscape Summary
- 3.11 Analyst View and Strategic Implications
Chapter 4 Global Bitcoin Mining Machine Market Trends and Developments
- 4.1 Historical Industry Development, 2018-2025
- 4.2 Recent Market Trends and Developments
- 4.3 Demand and Customer Behavior Trends
- 4.4 Technology and Product Innovation
- 4.5 Artificial Intelligence, Automation and Digitalization
- 4.6 Local Manufacturing and Supply Chain Realignment
- 4.7 Industry Partnerships, Mergers and Acquisitions
- 4.8 Sustainability and Circular Economy Developments
- 4.9 Government and Private Sector Investment Trends
- 4.10 Emerging Business Models and Commercialization
- 4.11 Industry Developments and Announcements
Chapter 5 Global Bitcoin Mining Machine Market Production, Supply and Demand Analysis
- 5.1 Demand Trend and Consumption Analysis, 2018-2025
- 5.2 Demand Forecast, 2025-2035
- 5.3 Production and Output Trend, 2018-2025
- 5.4 Production and Output Forecast, 2025-2035
- 5.5 Installed Capacity and Capacity Utilization
- 5.6 Company-Wise Production Plants and Statistics
- 5.6.1 Installed Production Capacity
- 5.6.2 Actual Production
- 5.6.3 Planned Capacity and Expansion Targets
- 5.7 Supply Chain Structure and Procurement Trends
- 5.8 Supply-Demand Gap and Bottlenecks
- 5.9 Import Dependence and Sourcing Structure
- 5.10 Contract Manufacturing and Outsourcing
- 5.11 Regional Supply and Demand Concentration
Chapter 6 Global Bitcoin Mining Machine Market Pricing Analysis
- 6.1 Pricing Structure and Measurement
- 6.2 Historical Pricing Trends, 2018-2025
- 6.3 Pricing Outlook, 2025-2035
- 6.4 Average Selling Price and Unit Economics
- 6.5 Pricing by Product and Market Segment
- 6.6 Geographic Pricing Differences
- 6.7 Key Input, Energy, Labor and Logistics Costs
- 6.8 Contract Pricing and Purchasing Models
- 6.9 Pricing Sensitivity and Competitive Positioning
- 6.10 Price, Margin and Profitability Implications
Chapter 7 Global Bitcoin Mining Machine Market Dynamics
- 7.1 Market Growth Drivers
- 7.1.1 Demand-Side Drivers
- 7.1.2 Technology and Innovation Drivers
- 7.1.3 Infrastructure and Investment Drivers
- 7.1.4 Regulatory and Policy Drivers
- 7.2 Market Restraints
- 7.2.1 Cost and Affordability Constraints
- 7.2.2 Technology and Adoption Barriers
- 7.2.3 Supply Chain and Operational Constraints
- 7.3 Market Challenges
- 7.3.1 Competitive Pressure and Margin Erosion
- 7.3.2 Skills, Infrastructure and Implementation Gaps
- 7.4 Emerging Market Opportunities
- 7.5 Market Dynamics Impact and Time-Horizon Assessment
Chapter 8 Global Bitcoin Mining Machine Value Chain Analysis
- 8.1 Industry Value Chain Overview
- 8.2 Upstream Suppliers and Critical Inputs
- 8.3 Technology and Component Providers
- 8.4 Manufacturing or Service Delivery
- 8.5 Distribution, Channel Partners and Integrators
- 8.6 Downstream Applications and End Users
- 8.7 Value Addition and Profit Pools
- 8.8 Vertical Integration and Outsourcing
- 8.9 Supplier Concentration and Risk
- 8.10 Supply Chain Localization and Resilience
Chapter 9 Global Bitcoin Mining Machine Market Regulations and Policies
- 9.1 Relevant Laws, Standards and Compliance Frameworks
- 9.2 Product, Service, Safety and Quality Requirements
- 9.3 Government Policies, Incentives and Subsidies
- 9.4 Imports, Exports and Trade Barriers
- 9.5 Public Procurement and Local Content Requirements
- 9.6 Environmental and Sustainability Compliance
- 9.7 Upcoming Policy Changes and Market Implications
Chapter 10 Global Bitcoin Mining Machine Market Hotspots and Opportunities
- 10.1 Market Opportunity Mapping and Growth Hotspots
- 10.2 High-Growth Applications and Customer Groups
- 10.3 Underserved Markets and White-Space Opportunities
- 10.4 Emerging Technology and Product Opportunities
- 10.5 New Capacity and Investment Hotspots
- 10.6 Market Entry and Expansion Opportunities
- 10.7 Distribution and Partnership Opportunities
- 10.8 Near-Term and Long-Term Commercial Potential
- 10.9 Opportunity Attractiveness and Execution Risks
Chapter 11 Global Bitcoin Mining Machine Market Outlook, 2025-2035
- 11.1 Market Size and Analysis
- 11.1.1 Revenue (Market Measurement: 2025: USD 3.83 billion → 2035: USD 7.85 billion)
- 11.1.2 Market Volume and Quantity Sold
- 11.1.3 Historical Market Size, 2018-2025
- 11.1.4 Base-Year Market Size, 2025
- 11.2 Market Forecast, 2025-2035
- 11.2.1 Revenue Forecast to 2035
- 11.2.2 Volume Forecast to 2035
- 11.2.3 CAGR and Year-on-Year Growth
- 11.2.4 Incremental Revenue Opportunity
- 11.3 Forecast Assumptions and Scenario Analysis
- 11.3.1 Base-Case Forecast
- 11.3.2 Optimistic and Conservative Scenarios
- 11.3.3 Technology, Pricing and Policy Sensitivities
- 11.4 Market Attractiveness and Growth Outlook
Chapter 12 Global Bitcoin Mining Machine Market Segmentation and Outlook
- 12.1 Segmentation Summary and Market Shares, 2025
- 12.2 Largest and Fastest-Growing Segments
- 12.3 By Hardware Type - Market Size and Forecast, 2025-2035
- 12.3.1 Segment Definition and Scope
- 12.3.2 Historical Market Size, 2018-2025
- 12.3.3 Revenue Forecast, 2025-2035
- 12.3.4 Volume Forecast, 2025-2035
- 12.3.5 Base-Year Market Share, 2025
- 12.3.6 Segment CAGR and Growth Drivers
- 12.3.7 Subsegment Market Size and Forecast
- 12.3.7.1 Air-Cooled ASIC Miners
- 12.3.7.2 Hydro-Cooled ASIC Miners
- 12.3.7.3 Immersion-Cooled ASIC Miners
- 12.3.8 Subsegment Pricing and Adoption Trends
- 12.3.9 Leading Suppliers and Competition
- 12.3.10 Regional Demand and Opportunities
- 12.4 By Application - Market Size and Forecast, 2025-2035
- 12.4.1 Segment Definition and Scope
- 12.4.2 Historical Market Size, 2018-2025
- 12.4.3 Revenue Forecast, 2025-2035
- 12.4.4 Volume Forecast, 2025-2035
- 12.4.5 Base-Year Market Share, 2025
- 12.4.6 Segment CAGR and Growth Drivers
- 12.4.7 Subsegment Market Size and Forecast
- 12.4.7.1 Enterprise Mining
- 12.4.7.2 Individual Mining
- 12.4.8 Subsegment Pricing and Adoption Trends
- 12.4.9 Leading Suppliers and Competition
- 12.4.10 Regional Demand and Opportunities
- 12.5 Segment Growth Comparison
- 12.6 Segment Attractiveness and Priority Matrix
Chapter 13 Global Bitcoin Mining Machine End-Use and Application Market Outlook
- 13.1 End-Use Industry and Customer Demand Structure
- 13.2 Leading Applications and Customer Groups
- 13.3 End-Use Market Size, Share and Forecast
- 13.4 Major End-Use Industry Deep Dives
- 13.4.1 Customer Requirements and Use Cases
- 13.4.2 Demand and Replacement Cycles
- 13.4.3 Technical and Regulatory Considerations
- 13.4.4 Purchasing and Procurement Models
- 13.4.5 Leading Vendors and Distribution Channels
- 13.4.6 Forecast and Commercial Opportunities
- 13.5 Emerging Applications and Cross-Segment Demand
- 13.6 End-Use Industry Investment Priorities
Chapter 14 Global Bitcoin Mining Machine Geographic Market Outlook, 2025-2035
- 14.1 Regional Market Size and Share, 2025
- 14.2 Regional Market Forecast, 2025-2035
- 14.3 Regional Pricing, Production and Demand Differences
- 14.4 North America
- 14.4.1 United States
- 14.4.2 Canada
- 14.4.3 Mexico
- 14.5 Europe
- 14.5.1 Germany
- 14.5.2 France
- 14.5.3 Italy
- 14.5.4 United Kingdom
- 14.5.5 Spain
- 14.5.6 Poland
- 14.5.7 Russia
- 14.5.8 Netherlands
- 14.5.9 Belgium
- 14.5.10 Sweden
- 14.5.11 Denmark
- 14.5.12 Norway
- 14.5.13 Rest of Europe
- 14.6 Asia Pacific
- 14.6.1 China
- 14.6.2 India
- 14.6.3 Japan
- 14.6.4 South Korea
- 14.6.5 Thailand
- 14.6.6 Indonesia
- 14.6.7 Vietnam
- 14.6.8 Malaysia
- 14.6.9 Australia
- 14.6.10 Rest of Asia Pacific
- 14.7 Latin America
- 14.7.1 Brazil
- 14.7.2 Argentina
- 14.7.3 Colombia
- 14.7.4 Chile
- 14.7.5 Rest of Latin America
- 14.8 Middle East
- 14.8.1 Saudi Arabia
- 14.8.2 United Arab Emirates
- 14.8.3 Turkey
- 14.8.4 Israel
- 14.8.5 Iran
- 14.8.6 Rest of the Middle East
- 14.9 Africa
- 14.9.1 South Africa
- 14.9.2 Egypt
- 14.9.3 Nigeria
- 14.9.4 Morocco
- 14.9.5 Rest of Africa
- 14.10 Regional Investment, Policy and Supply Chain Differences
- 14.11 Regional Competitive Landscape
- 14.12 Geographic Growth Hotspots
Chapter 15 Global Bitcoin Mining Machine Technology, Innovation and Sustainability Outlook
- 15.1 Technology Landscape and Maturity
- 15.2 Product, Process and Service Innovation
- 15.3 AI, Automation and Digital Tools in the Industry
- 15.4 Technology Adoption and Performance Benchmarking
- 15.5 Innovation Pipeline and R&D Investment
- 15.6 Patent and Intellectual Property Trends
- 15.7 Energy Efficiency and Resource Management
- 15.8 Sustainability, Recycling and Circularity
- 15.9 Technology Roadmap, 2025-2035
- 15.10 Risks of Obsolescence and Technology Substitution
Chapter 16 Global Bitcoin Mining Machine Market Key Strategic Imperatives
- 16.1 Growth and Market Entry Priorities
- 16.2 High-Return Products and Segments
- 16.3 Pricing, Profitability and Cost Optimization
- 16.4 Technology Investment and Product Differentiation
- 16.5 Supply Chain Localization and Resilience
- 16.6 Distribution and Customer Acquisition
- 16.7 Partnership, Acquisition and Capacity Strategy
- 16.8 Regional Expansion Priorities
- 16.9 Short-, Medium- and Long-Term Actions
Chapter 17 Competition Outlook
- 17.1 Industry Competition Characteristics
- 17.2 Market Structure and Concentration
- 17.3 Market Share and Competitive Positioning, 2025
- 17.4 Company-Wise Revenue and Product Benchmarking
- 17.5 Production and Service Capacity Benchmarking
- 17.6 Technology, Pricing and Differentiation
- 17.7 Regional Footprint and Distribution Strength
- 17.8 Mergers, Acquisitions and Strategic Alliances
- 17.9 New Entrants and Competitive Threats
- 17.10 Porter's Five Forces and Industry Attractiveness
- 17.11 Competitive Outlook, 2025-2035
Chapter 18 Company Profiles
- 18.1 Company Coverage and Selection Criteria
- 18.2 Bitmain Technologies Ltd.
- 18.2.1 Business Description
- 18.2.2 Company Ownership and Geographic Presence
- 18.2.3 Product and Service Portfolio
- 18.2.4 Manufacturing and Operating Footprint
- 18.2.5 Production Capacity and Expansion Plans
- 18.2.6 Financial Performance and Investment
- 18.2.7 Market Share and Competitive Position
- 18.2.8 Technology and Innovation Capabilities
- 18.2.9 Strategic Alliances or Partnerships
- 18.2.10 Recent Developments
- 18.2.11 Growth Strategy and Outlook
- 18.3 MicroBT (Whatsminer)
- 18.4 Canaan Inc.
- 18.5 Bitdeer Technologies Group
- 18.6 Block, Inc. (Proto)
- 18.7 Other Relevant Market Participants
Note: Every listed company is profiled on the structure shown under the first company. The company list is preliminary and may change based on research findings, market developments, data availability and client requirements.
Chapter 19 Disclaimer
- 19.1 Research and Forecast Disclaimer
- 19.2 Data Source and Estimation Limitations
Note: The depth of individual sections depends on data availability for this market. Volume, capacity, trade and other unit-based metrics are included where applicable.

