Labor cost and online orders push pallet moves to AGVs
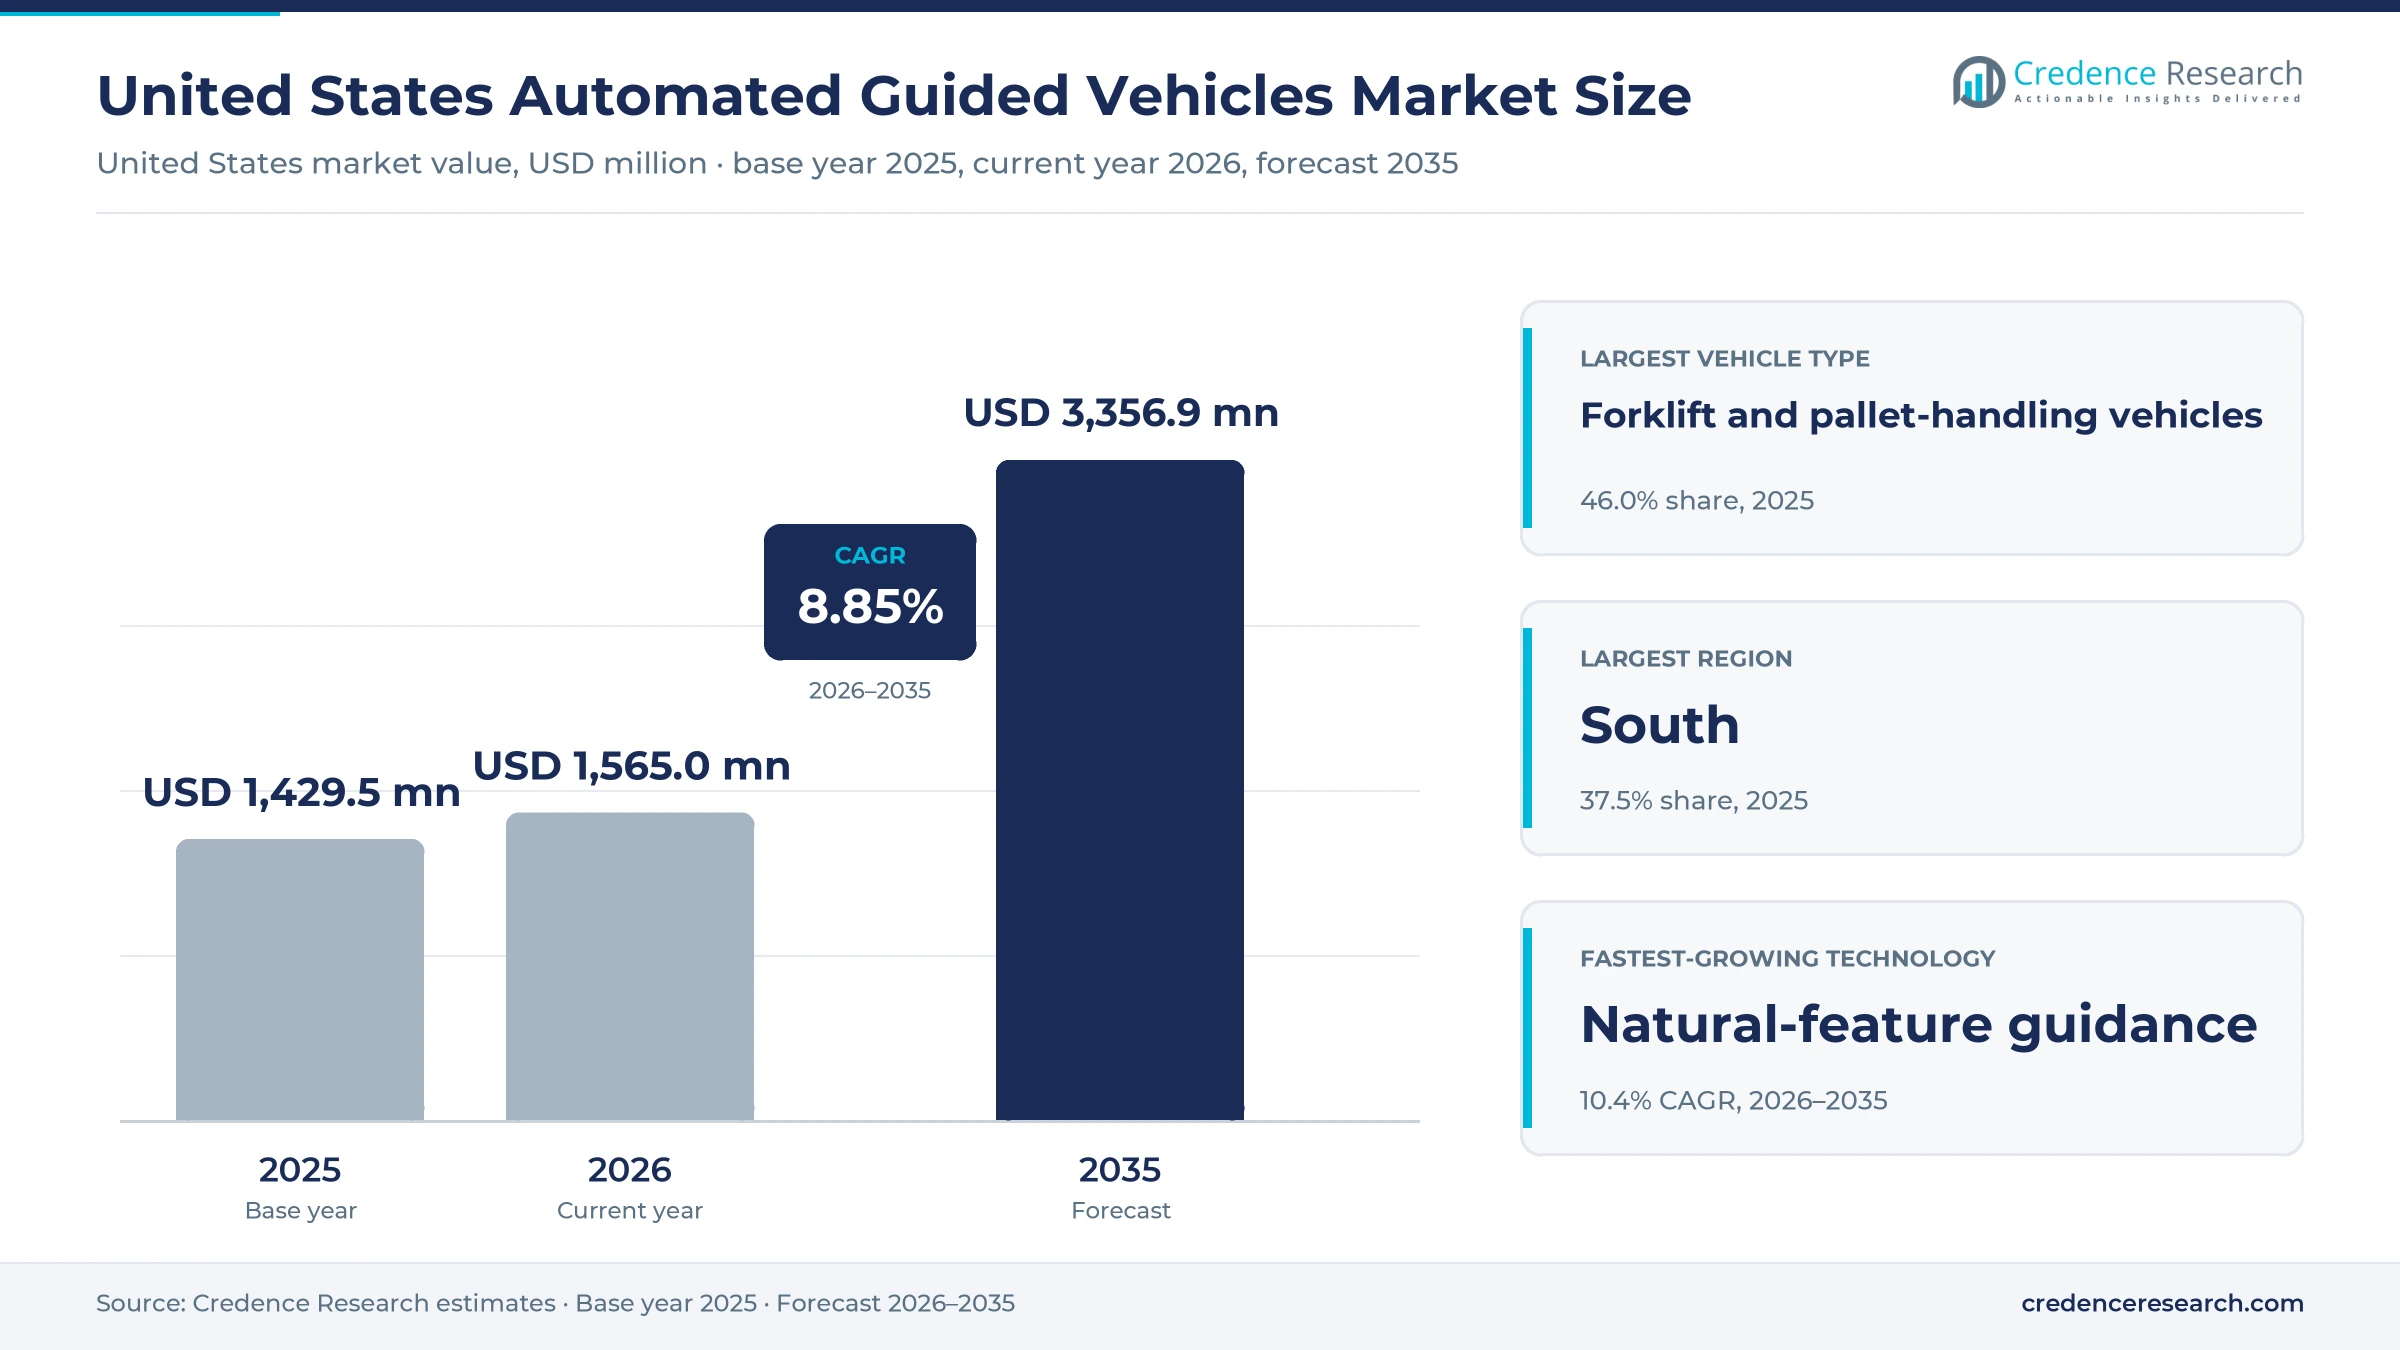
The United States automated guided vehicles market was valued at USD 1.43 billion in 2025 and is projected to increase from USD 1.57 billion in 2026 to USD 3.36 billion by 2035, registering a CAGR of 8.85% during 2026–2035. Demand comes from distribution centers that run two or three shifts, from automotive and other plants that feed assembly lines on a fixed rhythm, and from hospitals that move carts between floors. The South held the largest regional share, 37.5% in 2025, and it is also the fastest-growing region at 9.2% a year because new distribution hubs and vehicle plants keep opening across Texas, Georgia and the Carolinas. Forklift-type vehicles take most of the value, since each unit replaces a staffed truck on every shift. The most important supply change is consolidation, with truck makers and integrators combining their mobile automation units to offer one contract from layout to service.
Driverless forklifts, tuggers and carriers bought as full systems
The market counts automated guided vehicles sold for use in the United States, including driverless forklifts and pallet trucks, towing tractors, unit-load carriers and special-purpose vehicles, together with the navigation hardware, fleet software, integration and lifecycle service sold with them. Buyers are warehouse operators, retailers, third-party logistics firms, manufacturers and hospitals, and they usually buy a complete system under a project contract rather than single vehicles.
Free-roaming mobile robots sold without a guided path or fleet controller, manual lift trucks, conveyors, shuttles and storage systems are outside the scope. The value chain runs from vehicle makers and navigation suppliers through system integrators and dealers to the end user, who often signs a multi-year service and software agreement after commissioning.
United States Automated Guided Vehicles Market Insights
- The United States automated guided vehicles market grows from USD 1.43 billion in 2025 to USD 3.36 billion by 2035 at an 8.85% CAGR as distribution centers and plants automate pallet and line-feed moves.
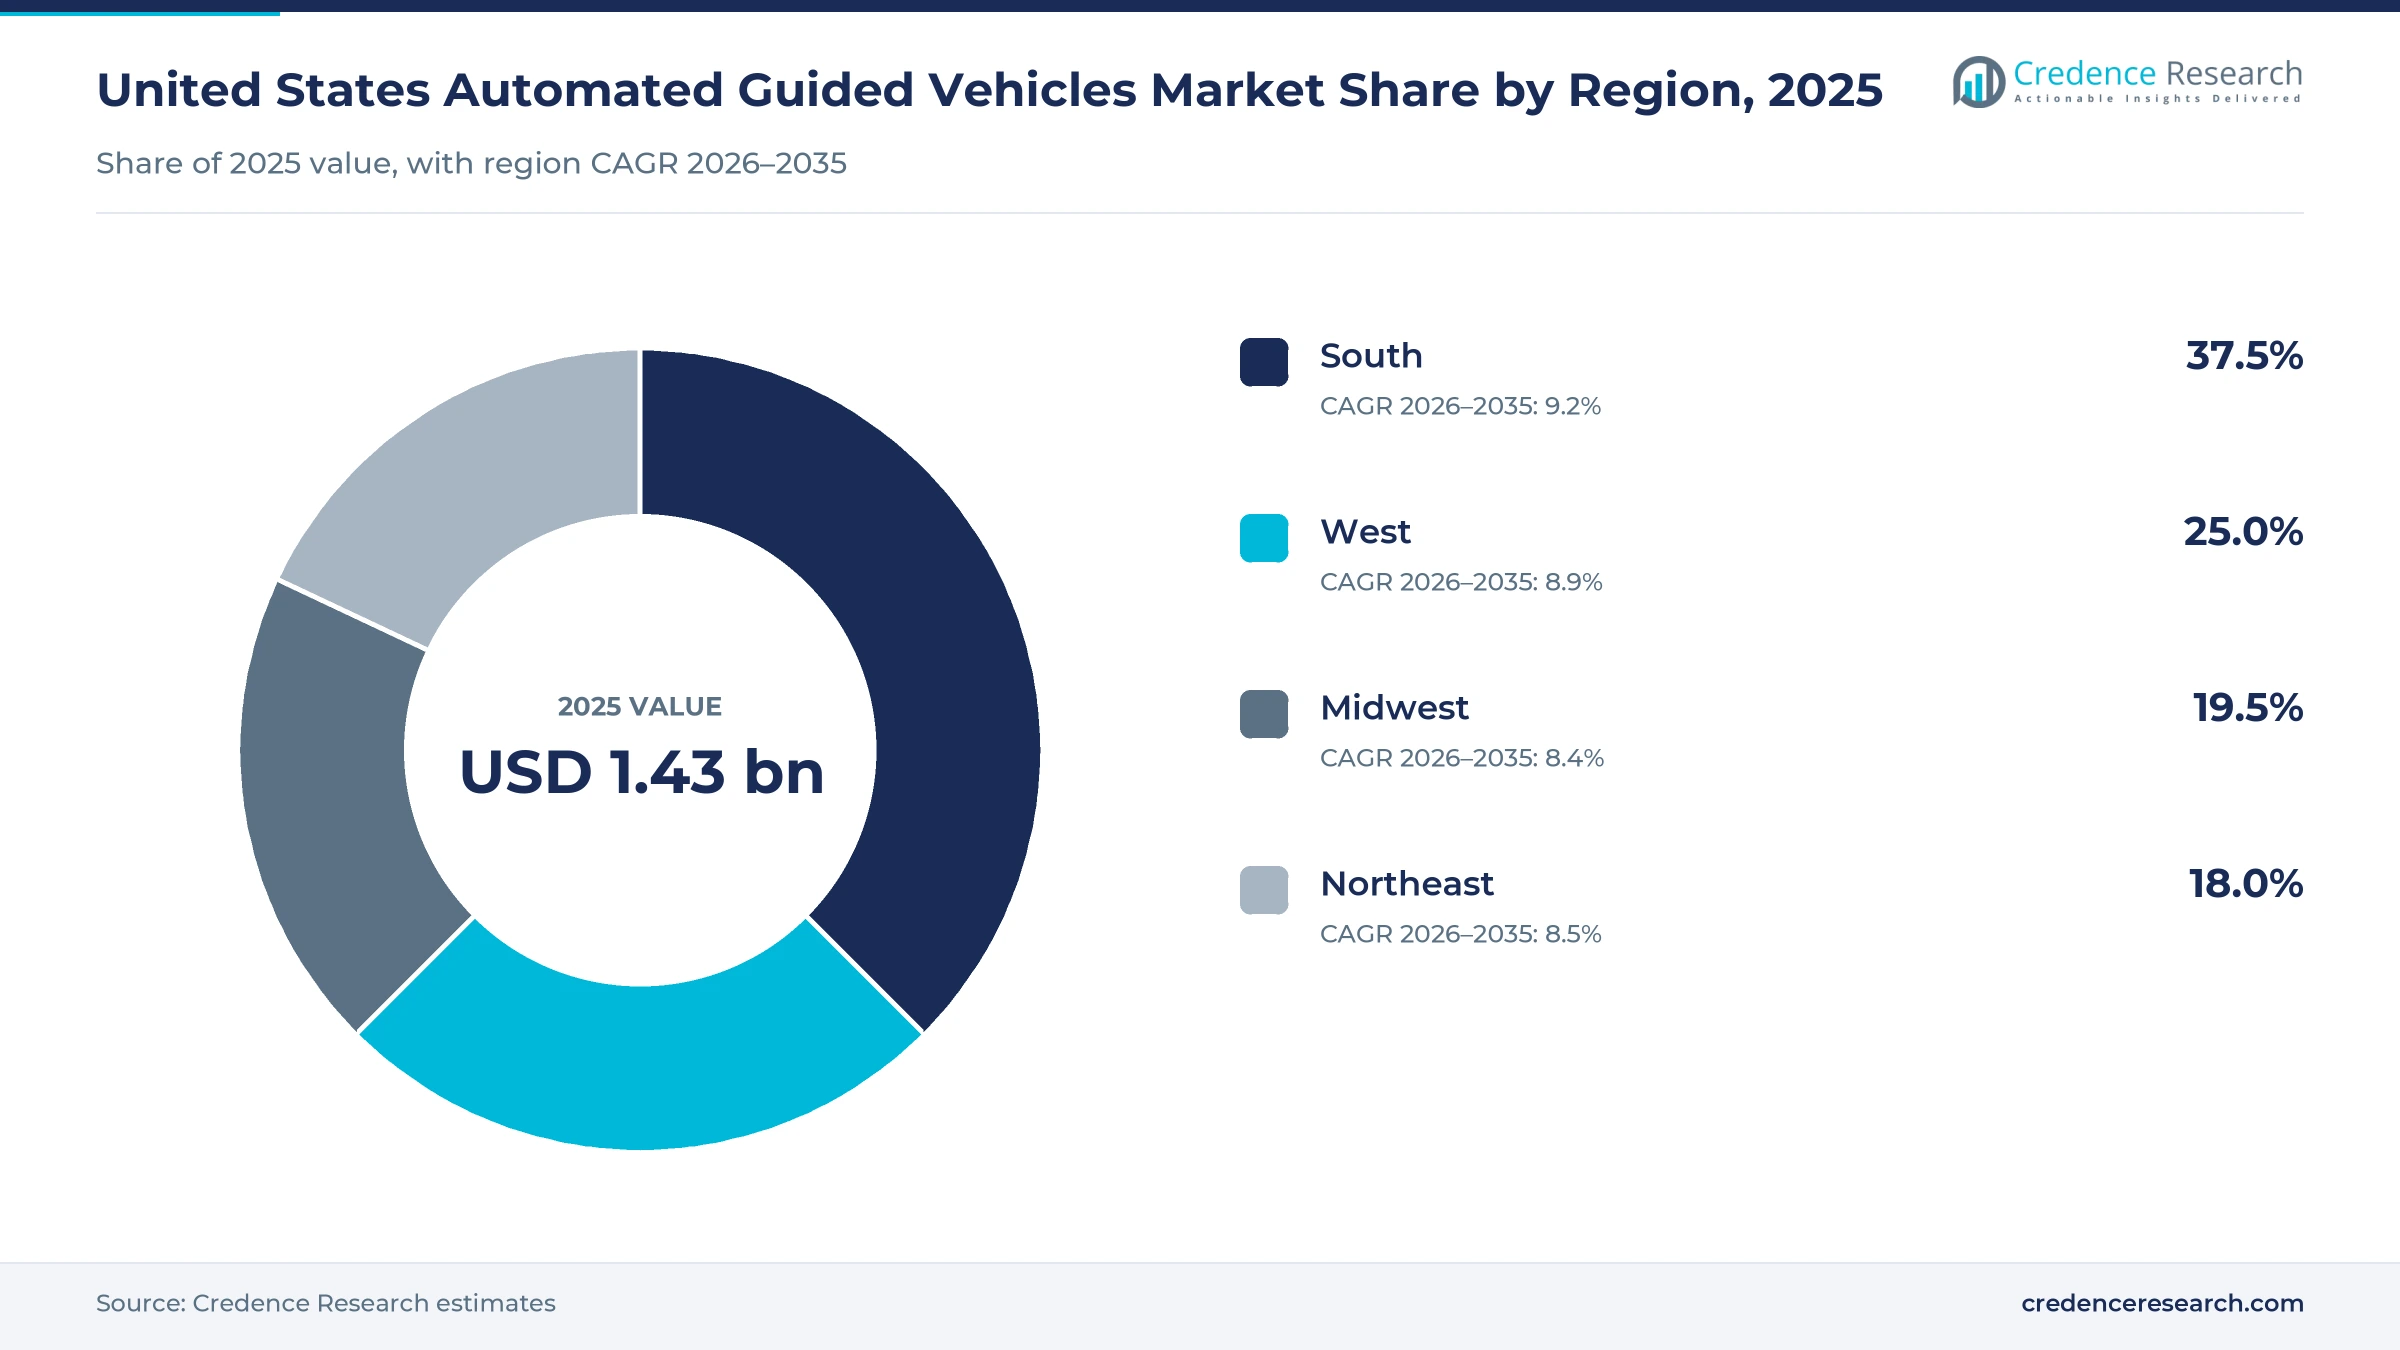
- The South held the largest regional share at 37.5% in 2025 and grows fastest at 9.2% a year, helped by Texas and Georgia distribution and new vehicle plants.
- Forklift and pallet-handling vehicles led with 46.0% of 2025 value, because each unit replaces a staffed lift truck across two or three shifts.
- U.S. online retail sales reached USD 340.2 billion in the second quarter of 2026, or 17.1% of all retail sales, according to the Census Bureau.
- Supply is consolidating, as Toyota Industries planned to combine Bastian Solutions with Vanderlande's U.S. warehouse business from April 2026.
Forklift vehicles lead while natural-feature guidance grows
Forklift vehicles lead as unit-load carriers grow fastest
Based on vehicle type, the market is categorized into forklift and pallet-handling vehicles, towing vehicles, unit-load carriers and special-purpose vehicles. Forklift and pallet-handling vehicles led with 46.0% of 2025 value because they lift, stack and store pallets as well as move them, and FlexQube lists forklift AGVs at USD 75,000 to USD 200,000 each, the highest ticket in the category. Unit-load carriers grow fastest at 9.4% a year as modular designs cut entry cost, and Transbotics unveiled its NexBot modular vehicle at ProMat in Chicago on March 17, 2025. Lower-cost carriers let mid-sized plants start with a few vehicles and add more later.
Warehousing leads as healthcare grows fastest
Based on end-use industry, the market is categorized into automotive manufacturing, warehousing and distribution, process and discrete manufacturing, and healthcare and life sciences. Warehousing and distribution led with 41.0% of 2025 value because the workforce it must staff keeps growing, and the Bureau of Labor Statistics counted 1,839,200 warehousing and storage jobs in October 2026, seasonally adjusted. Healthcare and life sciences grows fastest at 9.8% a year as hospitals automate supply runs, and Swisslog Healthcare formed a U.S. delivery alliance with Diligent Robotics in September 2025. Hospitals buy for staff time, so a working pilot quickly leads to wider orders.
Laser-reflector guidance leads as natural-feature guidance grows
Based on technology, the market is categorized into laser-reflector guidance, natural-feature guidance and installed-path guidance. Laser-reflector guidance led with 52.0% of 2025 value because high-bay pallet systems need millimeter accuracy, and E80 Group says it has installed 7,000 laser-guided vehicle systems since 2016. Natural-feature guidance grows fastest at 10.4% a year as buyers want routes they can change without mounting targets, and Fox Robotics released its third-generation FoxBot Mk3 autonomous forklift on March 12, 2025, with an enhanced vision system that handles more pallet types, according to RoboticsTomorrow. Brownfield sites gain most, since retrofits avoid shutting aisles for reflector work.
Pallet transport leads as dispatch grows fastest
Based on application, the market is categorized into pallet transport and storage, production line feeding and dispatch and internal distribution. Pallet transport and storage led with 47.0% of 2025 value because inbound pallets must be moved to racks or storage systems on every shift, and Walmart added 19 Fox Robotics autonomous forklifts in April 2024 to unload trailers and feed storage at four distribution centers. Dispatch and internal distribution grows fastest at 9.3% a year as order volumes rise, with online sales up 12.2% year on year in the second quarter of 2026, according to the Census Bureau. Outbound staging and dock loading are the next areas that most U.S. sites plan to automate.
| Segment Group | Leading Sub-segment | Share, 2025 | Fastest-growing Sub-segment | CAGR, 2026–2035 |
|---|---|---|---|---|
| By Vehicle Type | Forklift and pallet-handling vehicles | 46.0% | Unit-load carriers | 9.4% |
| By End-Use Industry | Warehousing and distribution | 41.0% | Healthcare and life sciences | 9.8% |
| By Technology | Laser-reflector guidance | 52.0% | Natural-feature guidance | 10.4% |
| By Application | Pallet transport and storage | 47.0% | Dispatch and internal distribution | 9.3% |
Forklift AGVs list from USD 75,000 to USD 200,000 a unit
U.S. buyers rarely pay for vehicles alone, since most contracts bundle the fleet with layout design, navigation setup, software licenses and commissioning. Vehicle prices rise with lift height, load capacity, safety scanners and the guidance method, while integration cost rises with the number of interfaces to warehouse management systems, doors, conveyors and wrappers. The forklift band sets the value of most projects, so a ten-vehicle pallet system can cost more in integration than in tuggers. Suppliers earn their steadiest margins on software and service renewals, which is why buyers now compare five-year ownership cost rather than the vehicle list price.
| Offer or vehicle type | Typical price or fee | Basis |
|---|---|---|
| Forklift AGVs | USD 75,000 to USD 200,000 per vehicle | FlexQube list ranges, updated Sept. 2025 |
| Towing and tugger vehicles | USD 50,000 to USD 85,000 per vehicle | FlexQube list ranges, updated Sept. 2025 |
| Unit-load carriers | About USD 40,000 per vehicle | FlexQube list ranges, updated Sept. 2025 |
| Integration and commissioning | About 30% to 40% of vehicle spend per project | Credence Research estimate from project scopes |
| Software and lifecycle service | About 8% to 12% of fleet value a year | Credence Research estimate from service contract terms |
Request a Free Sample
Fill in your details and we'll send you a free sample report.
- Sample data tables & charts
- Research methodology
Online orders, shift costs and local service build demand
E-commerce volumes keep distribution centers busy
Online orders are the largest source of new AGV projects, because each order adds pallet moves, replenishment trips and outbound staging inside a distribution center. U.S. e-commerce sales reached USD 340.2 billion in the second quarter of 2026, equal to 17.1% of total retail sales, according to the Census Bureau. In September 2025, Total Warehouse, a logistics provider in the western United States, reported 10% more business customers after launching an AGV service built with Dematic. Warehousing and distribution holds 41.0% of 2025 demand in the Credence Research model. Operators that add volume without adding floor space need vehicles that keep pallets moving at night as well as by day.
Multi-shift labor costs favor driverless pallet moves
The cost case for an AGV is strongest where a lift truck runs two or three shifts, since one vehicle replaces several operator hours each day. The Bureau of Labor Statistics put average hourly earnings in warehousing and storage at USD 26.87 in September 2026, before benefits and overtime. Safety adds weight, as the powered industrial trucks standard ranked seventh among the most cited rules in fiscal 2026, according to OSHA. Walmart used autonomous forklifts at four distribution centers in Florida, Texas, New York and Alabama, turning operators into supervisors of the unloading work. Night and weekend shifts pay back fastest, so buyers usually start there before adding day-shift routes.
Local integration and service capacity lowers project risk
Buyers commit to fleets only when a supplier can install, tune and repair them close to the site, and that local capacity has grown. Dematic moved final assembly of its AGVs to its Grand Rapids, Michigan headquarters in 2021 and runs a large test area there. E80 Group opened an innovation hub in downtown Chicago on Sept. 30, 2024, and named it its U.S. headquarters. Rocrich AGV Solutions, based in Houston with operations in Marengo, Illinois, sells through more than 570 Logisnext dealer locations in North America. Daifuku Airport America designs and builds AGVs for factories and warehouses in Novi, Michigan. Shorter service response times cut downtime risk, which helps first-time buyers approve larger fleets.
New vehicle and battery plants buy line-feed fleets
Automotive and battery plants specify AGVs at the design stage, because line-side delivery must match the takt time of the assembly line. Hyundai Motor Group opened its Metaplant America in Ellabell, Georgia on March 26, 2025, with capacity for up to 500,000 vehicles a year and automated guided vehicles in its logistics flow. North American robot orders rose 6.6% to 36,766 units in 2025, and orders from automotive makers improved meaningfully, according to A3. SK AX completed unmanned forklift automation at a U.S. auto parts plant in November 2025, according to ForkliftAction. Each new plant locks in a fleet for many years, with later spend on spares and software.
Reflector-free guidance and supplier mergers reshape supply
Shift toward reflector-free navigation in brownfield sites
Navigation is moving from mounted reflectors and floor wires toward vehicles that read walls, racks and columns, because buyers want routes they can change during a weekend. AGV Solutions in Charlotte offers laser, vision, contour, wire, magnet and tape guidance on one platform, letting a site mix methods by aisle. Transbotics' NexBot, shown in March 2025, uses Navitec software that tracks its path from a map of natural features and reflectors, according to ForkliftAction. Seegrid, a Pittsburgh maker of vision-guided forklifts, said on May 29, 2025, that its RS1 and CS1 trucks generate and adjust their own paths and carry custom loads up to 96 by 96 inches. Older plants gain most from this shift, since they avoid installing targets across crowded aisles.
Supplier mergers create single-contract automation groups
Consolidation is rising among U.S. suppliers, as truck makers and integrators combine vehicles, storage and software under one contract. Toyota Industries planned to combine Bastian Solutions with Vanderlande's U.S. warehouse business in a Toyota Automated Logistics structure from April 2026, according to DC Velocity. Jungheinrich's Storage Solutions bought Atlanta integrator Invar, which has about 50 staff, on Nov. 4, 2025. Scott Technology owns Charlotte-based Transbotics, active in the field since 1982. Buyers of warehouse automation gain one accountable supplier, though fewer independent integrators may narrow price competition on large projects. Mid-sized buyers may need to run wider tenders to keep pricing honest.
Hospitals open a new market for cart transport
Hospital logistics is an opening for suppliers that can move linen, meals and pharmacy carts without adding porters. Swisslog Healthcare and Diligent Robotics formed an alliance in September 2025 to offer last-mile delivery robots to U.S. hospitals, alongside Swisslog's TransLogic tube systems. Diligent's Moxi robot is in more than 25 U.S. hospitals and has completed over one million deliveries, according to Swisslog. The partners expect the service robotics market to grow 15% to 18% a year over the next three to five years, according to The Robot Report. Guided carts for heavy loads and autonomous mobile robots for light items will often share the same corridors, so fleet software that manages both wins contracts.
Dual-mode retrofits open the installed truck base
Dual-mode trucks that run manually or driverless open a large retrofit opportunity, because sites can automate without retiring a working fleet. Crown Equipment and JBT announced a collaboration on March 26, 2019, and an early result, the DualMode T tow tractor, switches between manual and automated operation and is sold through Crown's network of more than 500 retail locations in over 80 countries. The ANSI/ITSDF B56.5-2024 standard covers vehicles built for manual use and later modified to run unmanned. Makers of forklift trucks can therefore sell automation kits through existing dealer and service channels, and buyers keep the same parts and technicians they already use.
High upfront cost and slower plant building limit orders
High upfront cost delays first projects
Capital cost is the first barrier for mid-sized operators, because the forklift list prices shown in the pricing table come before integration, software and training. A ten-vehicle pallet system with software and commissioning can pass USD 2 million on Credence Research estimates, which needs board approval at most firms. Smaller sites and single-shift plants struggle to reach a payback under three years. Suppliers respond with leasing, phased rollouts and robotics-as-a-service contracts that spread the cost over several years.
Slower factory construction trims new plant orders
New factory projects, which specify AGV fleets at the design stage, have slowed sharply. Private manufacturing construction spending fell from USD 249.1 billion at an annual rate in September 2024 to USD 167.2 billion in September 2026, according to the Census Bureau. Fewer greenfield plants mean fewer large line-feed tenders for automotive and battery projects. Suppliers shift sales effort toward retrofits and distribution centers to fill the gap.
Trade probes add cost risk for imported systems
Trade policy adds uncertainty, since many U.S. fleets use vehicles, drives or scanners built in Europe or Asia. The Commerce Department opened a Section 232 investigation into imports of robotics and industrial machinery on Sept. 2, 2025, according to Manufacturing Dive. Any tariff that follows would raise landed costs for imported vehicles and parts. Buyers face price changes between quote and delivery, so suppliers with U.S. assembly gain an edge in bids.
Safety standards raise compliance work for fleets
Safety compliance adds cost and time to each project, because users and suppliers share duties under the ANSI/ITSDF B56.5-2024 standard. The 2024 edition revised training requirements, drawbar pull tests and serial number rules, according to ANSI. Sites must train staff who work near vehicles and document changes to routes and zones. Mixed traffic with manual trucks and pedestrians lengthens commissioning, which delays payback for first-time buyers.
The South leads on distribution hubs and new auto plants
| Region | Value, 2025 (USD billion) | Share, 2025 | CAGR, 2026–2035 |
|---|---|---|---|
| South | 0.54 | 37.5% | 9.2% |
| West | 0.36 | 25.0% | 8.9% |
| Midwest | 0.28 | 19.5% | 8.4% |
| Northeast | 0.26 | 18.0% | 8.5% |
South leads on distribution hubs and new auto plants
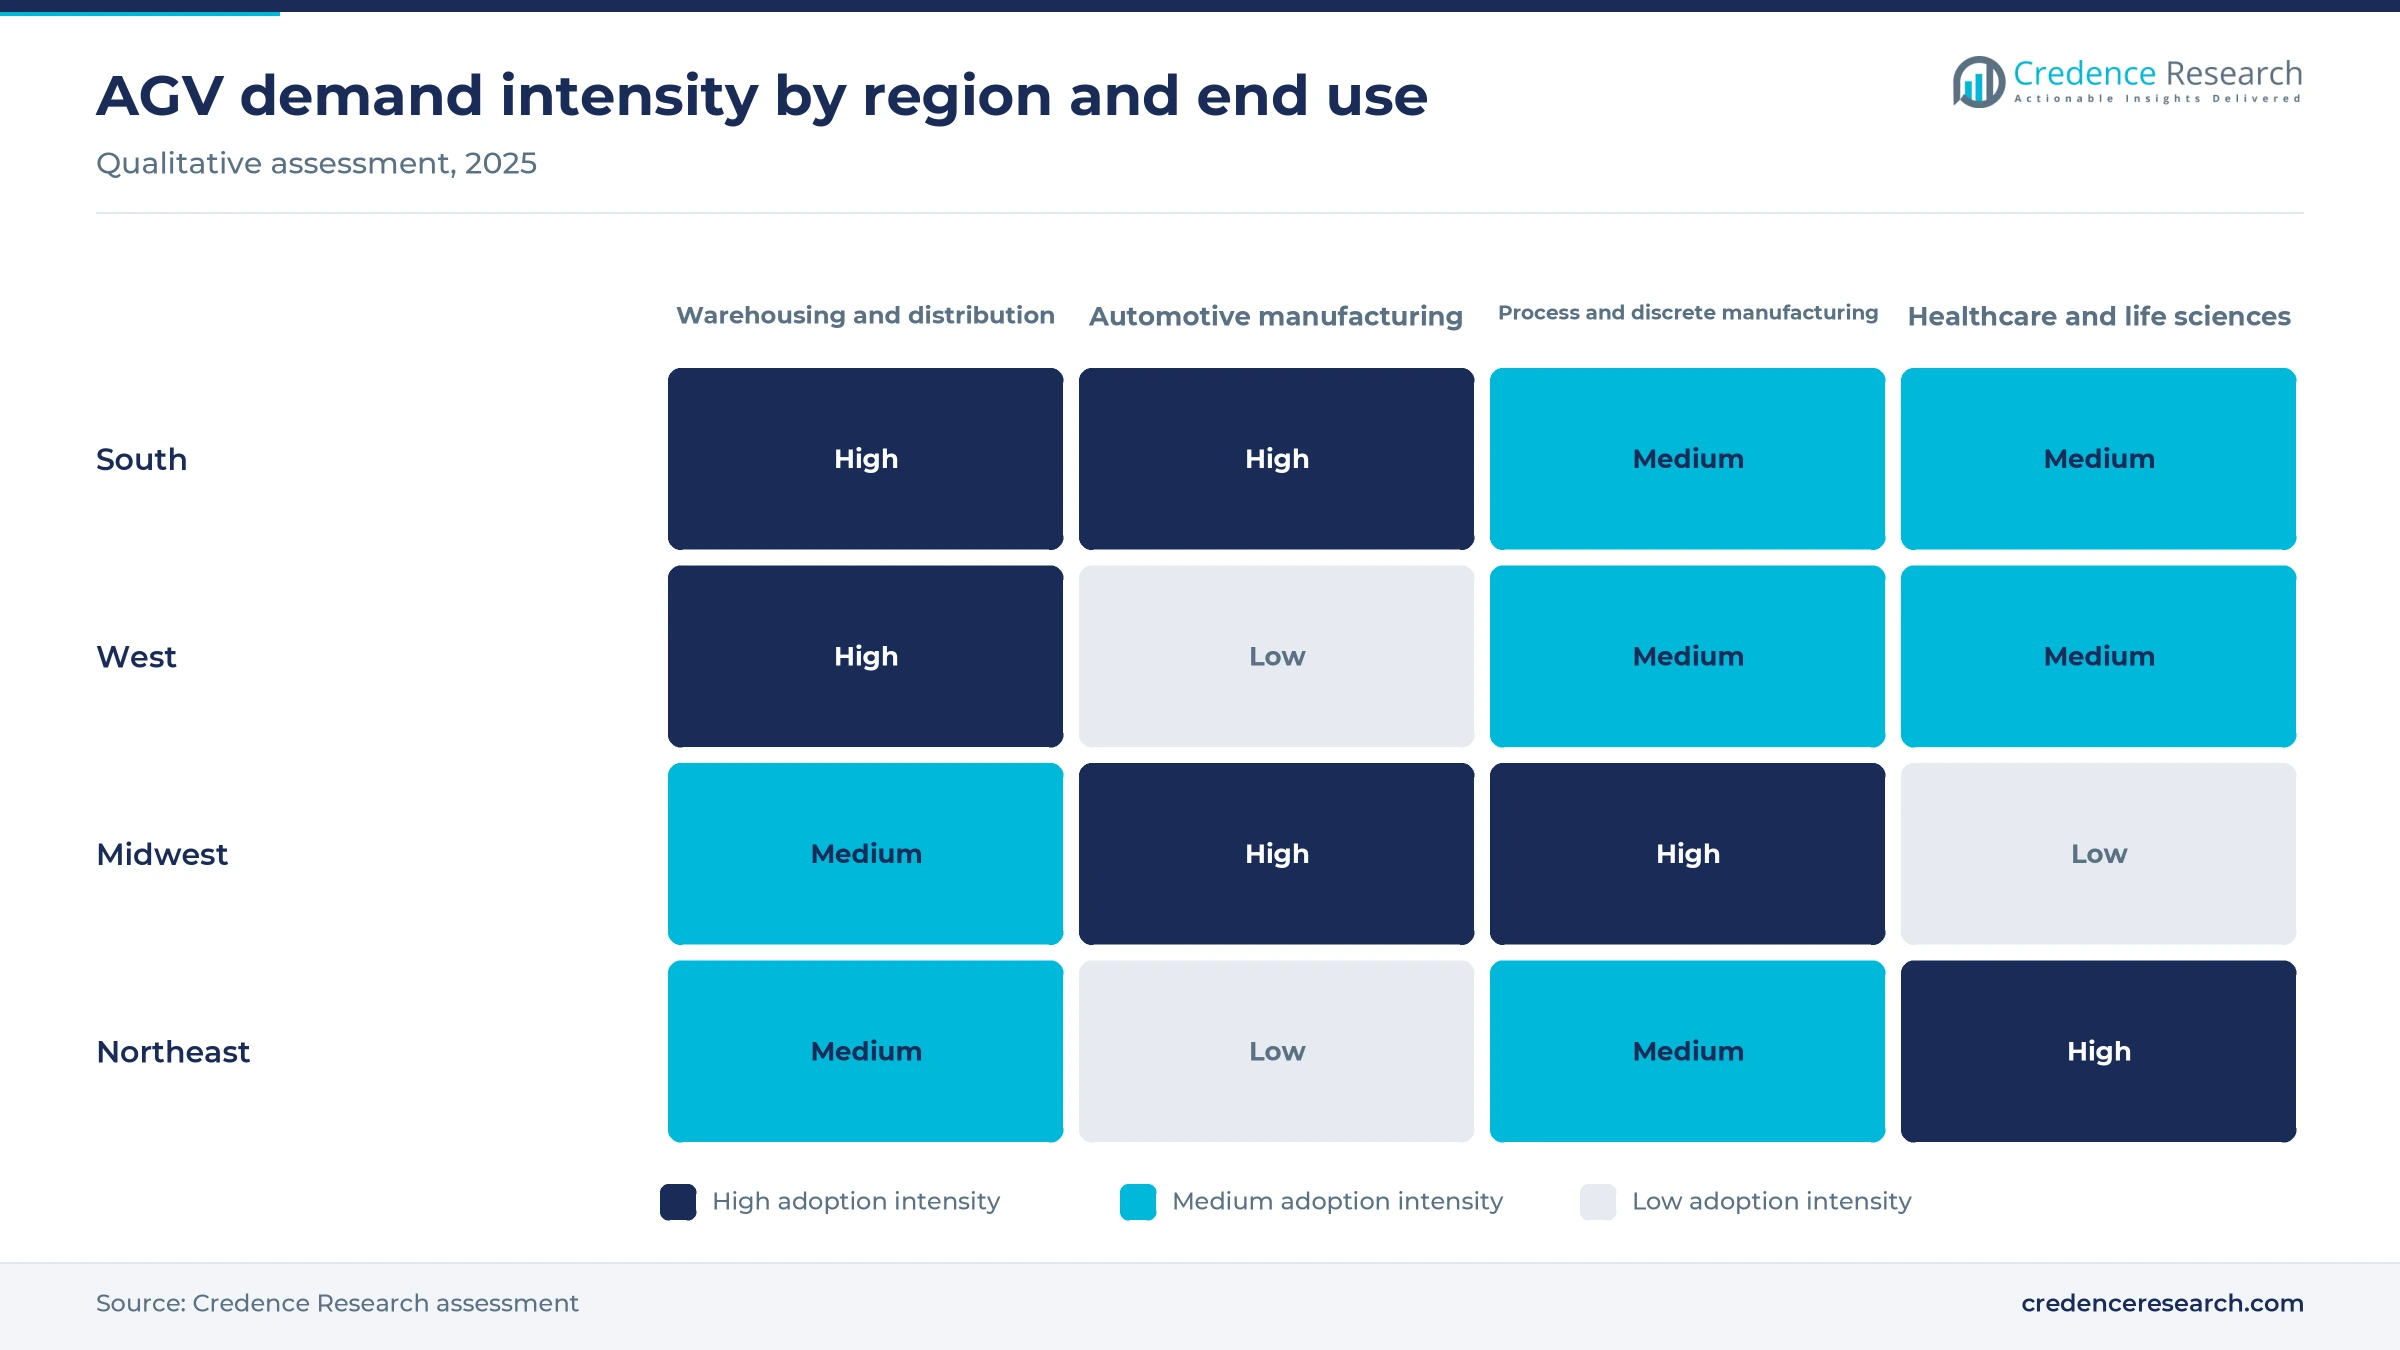
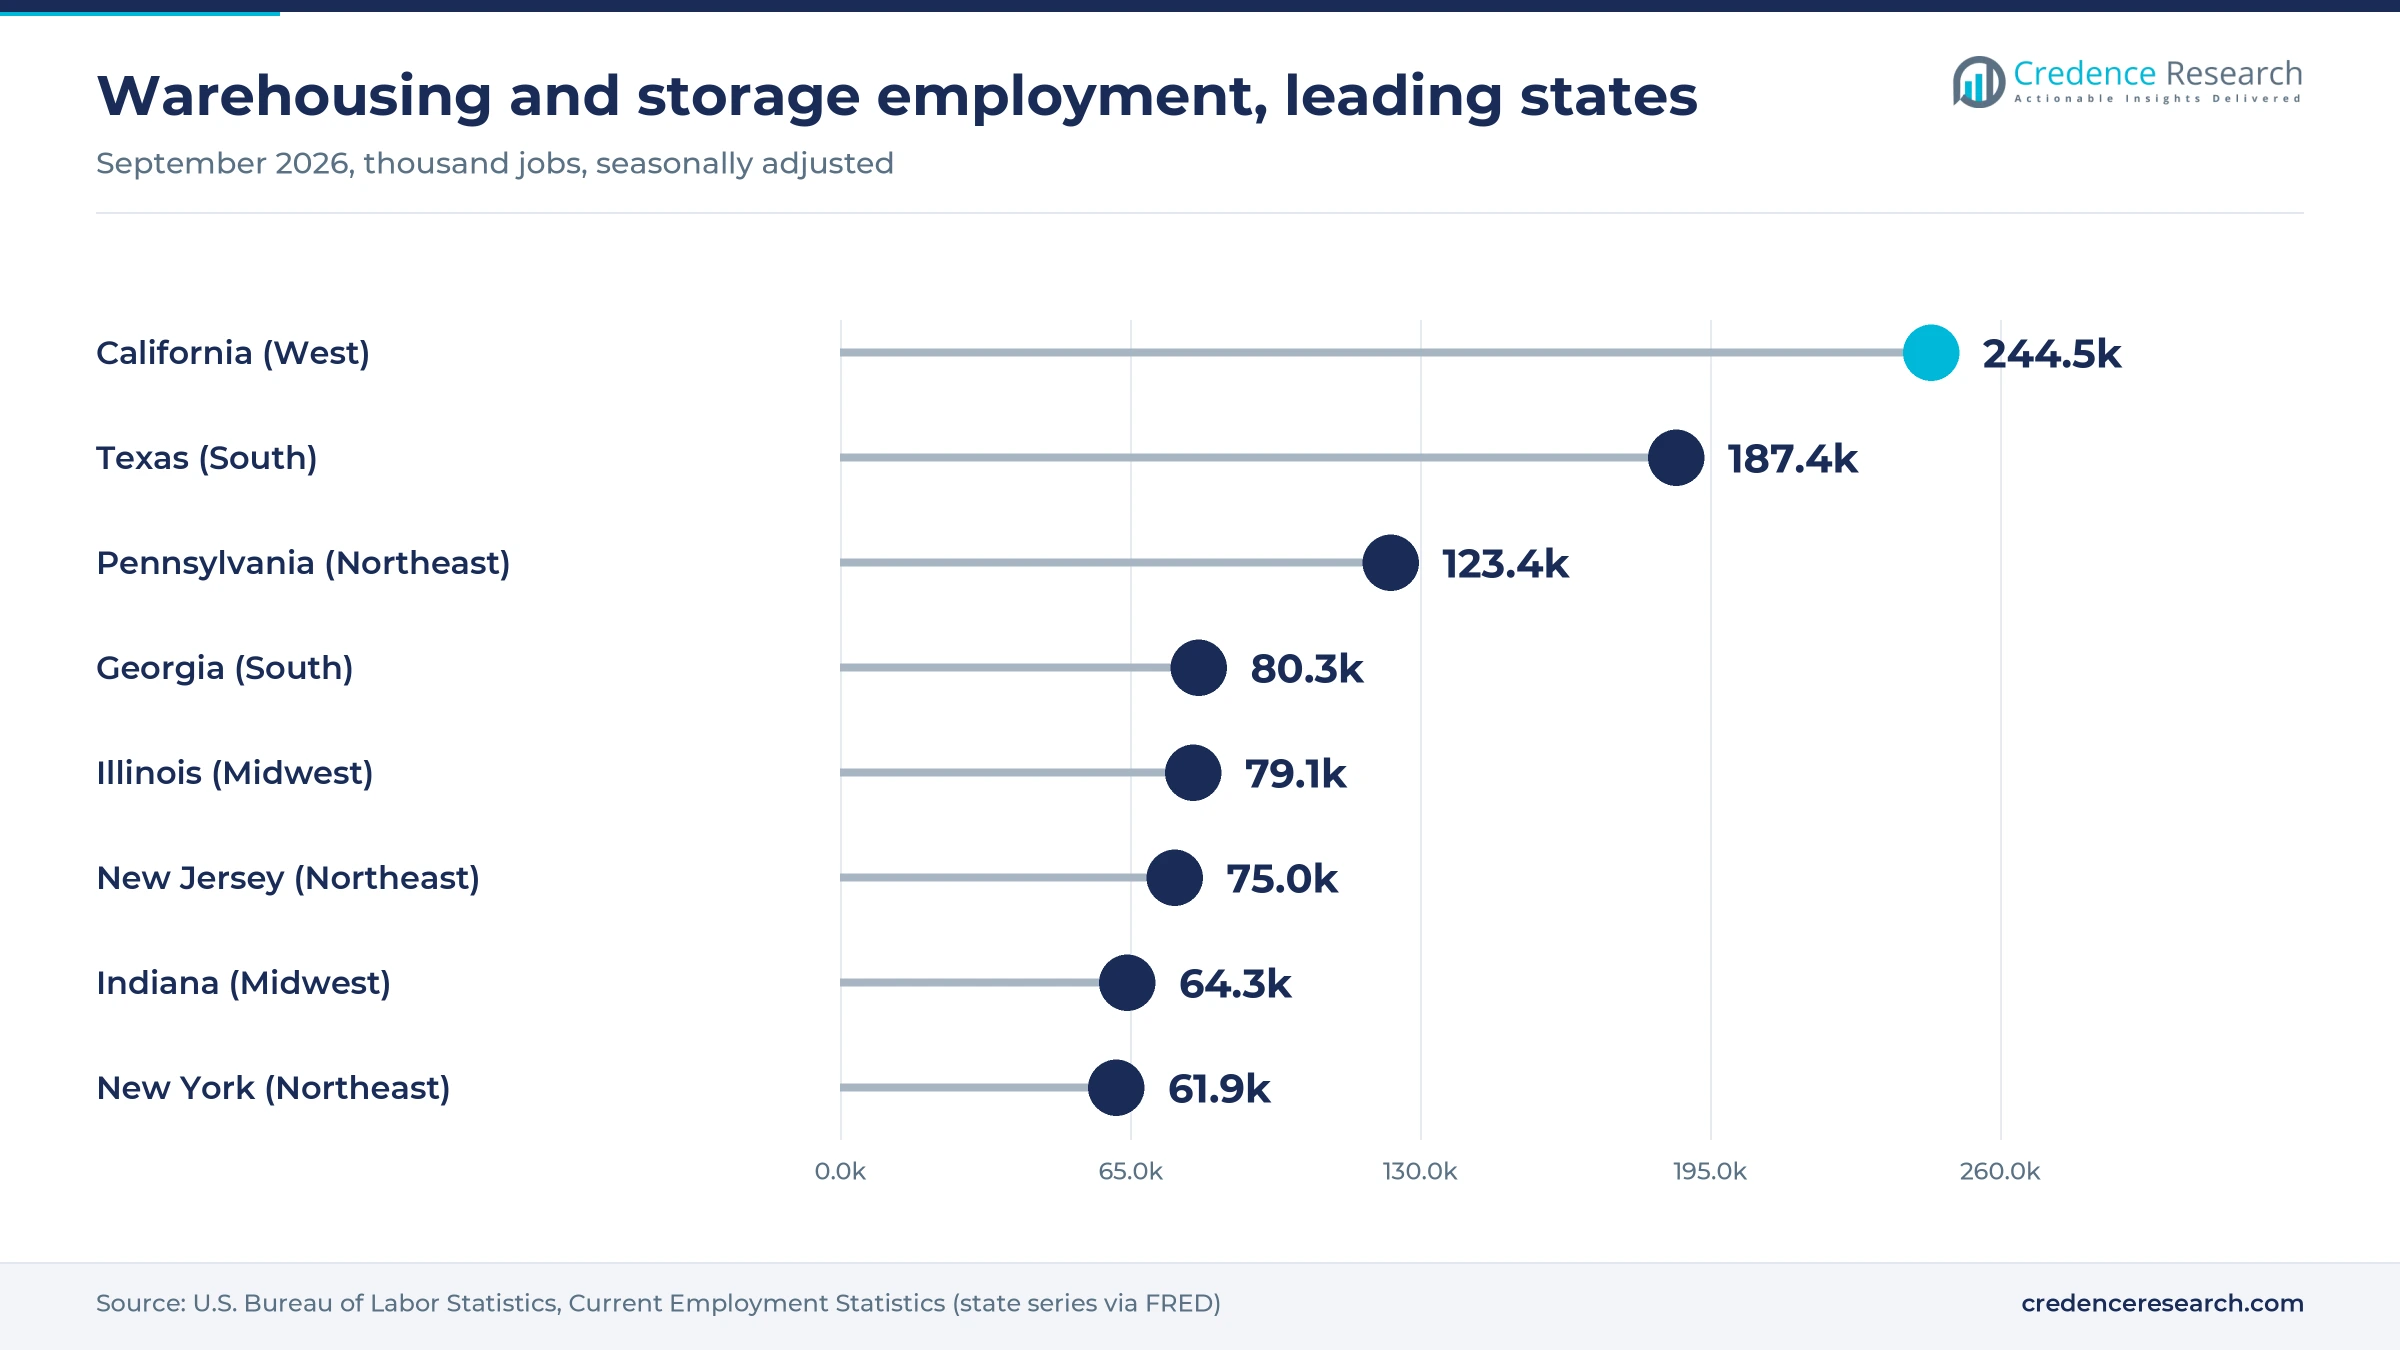
The South held 37.5% of 2025 value and grows fastest at 9.2% a year. Texas counted about 187,400 warehousing and storage jobs and Georgia about 80,300 in September 2026, according to BLS state data, and both states keep adding large regional hubs. Rocrich serves the region from Houston, and Murata Machinery USA in Charlotte took over North American sales of AGVE Group vehicles in March 2022, with payloads up to 65 tons. Long shifts in grocery and retail distribution make the cost case strongest here, which keeps the South ahead through 2035.
West grows on california distribution and 3PL fleets
The West held 25.0% of 2025 value and grows at 8.9% a year. California had about 244,500 warehousing and storage jobs in September 2026, the most of any state, serving import flows and the largest consumer base. Third-party logistics providers such as Total Warehouse buy fleets to serve many clients from one site. High wages and tight land make driverless pallet moves attractive, though seismic and building rules add design work.
Midwest relies on auto plants and supplier bases
The Midwest held 19.5% of 2025 value and grows at 8.4% a year. It hosts the largest concentration of automotive assembly and parts plants, and suppliers such as Dematic in Grand Rapids and Daifuku Airport America in Novi build vehicles there. Illinois counted about 79,100 warehousing jobs and Indiana about 64,300 in September 2026. Slower factory construction and soft automotive parts orders keep growth below the national pace.
Northeast stays smaller with dense urban distribution
The Northeast held 18.0% of 2025 value and grows at 8.5% a year. Pennsylvania counted about 123,400 warehousing jobs in September 2026, New Jersey about 75,000 and New York about 61,900, serving dense urban demand. Older, multi-story buildings limit fleet size per site, though retrofits with natural-feature guidance fit these layouts well.
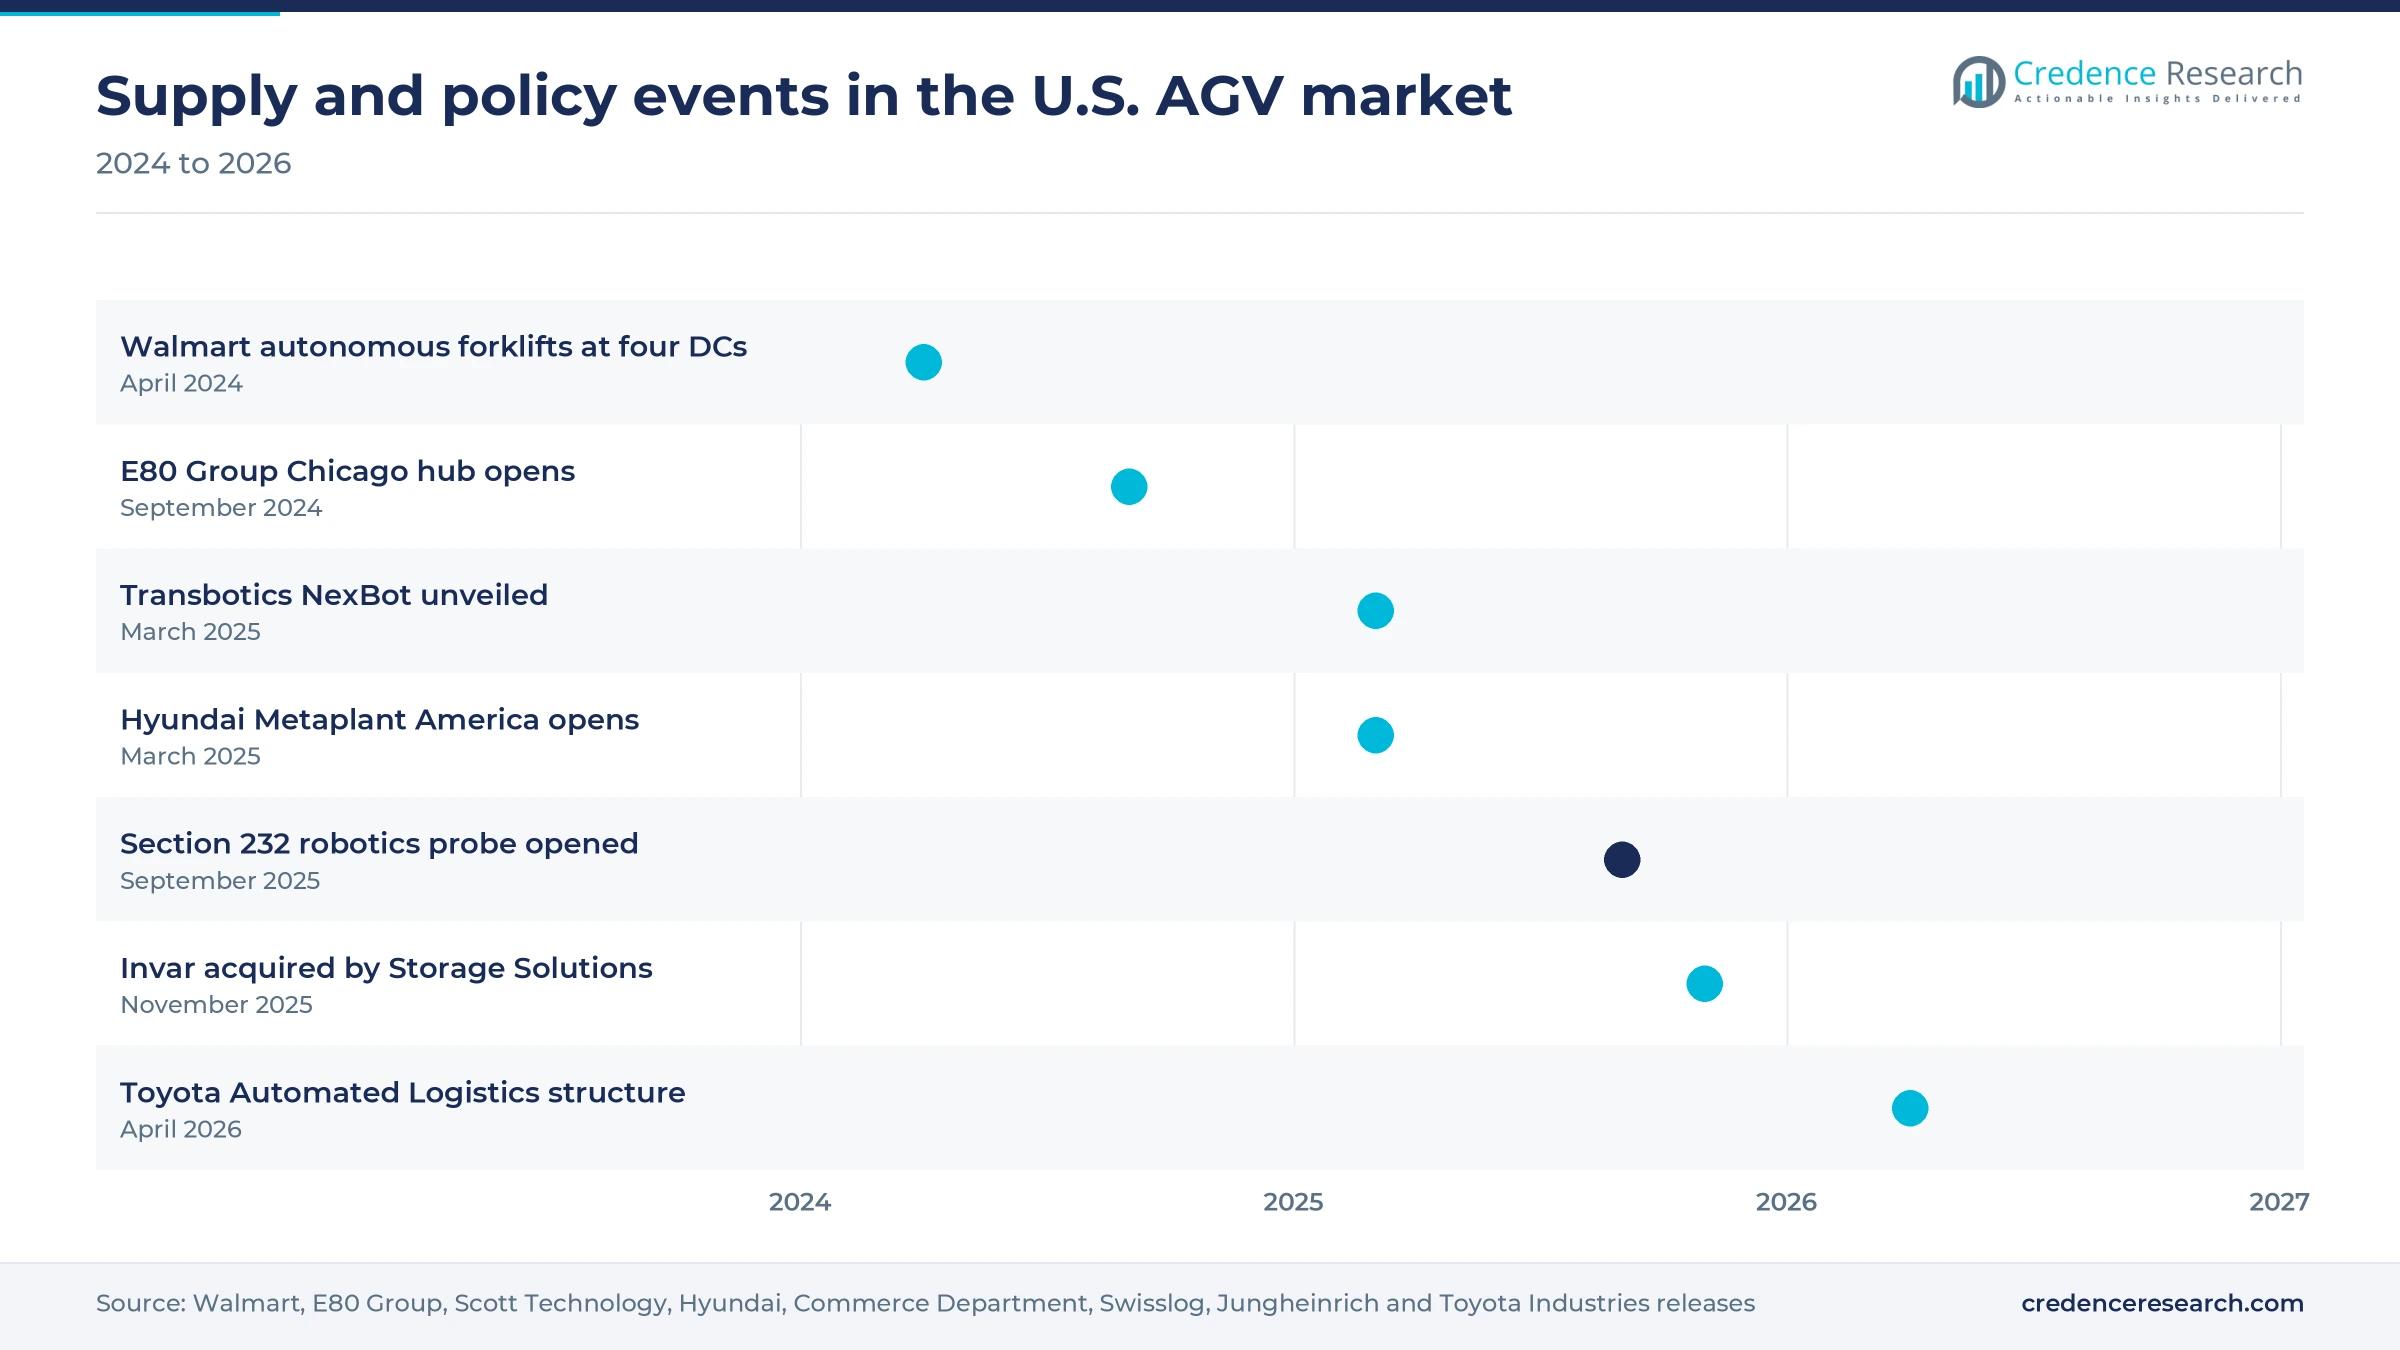
Hubs, launches and mergers marked 2024 to 2026
| Development | Status and market relevance |
|---|---|
| In September 2024, E80 Group opened its InnovE80 Hub in downtown Chicago as its U.S. headquarters for designing automated intralogistics systems. | Adds local design and customer service capacity for laser-guided fleets |
| In March 2025, Hyundai Motor Group opened its Metaplant America in Ellabell, Georgia, with automated guided vehicles in its logistics flow and capacity for up to 500,000 vehicles a year. | Adds a large line-feed fleet buyer in the South |
| In November 2025, Storage Solutions, a Jungheinrich company, acquired Atlanta-based integrator Invar to expand its North American automation business. | Adds integration and warehouse execution software capacity in the South |
| In April 2026, Toyota Industries aimed to start its Toyota Automated Logistics structure, announced in November 2025, which groups Vanderlande, Bastian Solutions and viastore and may combine Bastian with Vanderlande's U.S. warehouse automation business. | Creates a larger single-contract supplier for U.S. buyers |
Navigation, fleet software and mixed traffic define fleets
- Natural-feature navigation lets vehicles locate themselves from racks and walls, so routes can change over a weekend without mounting reflectors or cutting floor wires.
- Fleet management software assigns tasks, manages traffic and links vehicles to warehouse management systems, and it often decides supplier choice in multi-vendor sites.
- Dual-mode controls allow one truck to run manually or driverless, which eases adoption at sites with mixed traffic and lets one operator take over during peaks.
- Lithium-ion batteries with opportunity charging keep vehicles working across shifts, since short top-ups during idle minutes replace battery swaps and charging rooms.
Need a Custom Version of This Report?
Tailor the scope, geography, or segments to your exact requirements.
- Custom geography or segment scope
- Direct access to our analyst team
Integrators and truck makers compete for multi-year fleets
Competition in the United States centers on project delivery and service rather than on vehicle price alone. Dematic offers AGVs within wider storage and software projects from its Grand Rapids base, while E80 Group focuses on laser-guided vehicles for food, beverage and consumer goods plants. Rocrich AGV Solutions and truck-maker partnerships reach mid-sized buyers through dealer networks, and Daifuku Airport America builds vehicles for manufacturing, warehousing and airport uses. Transbotics and AGVE Group, through Murata Machinery USA, compete on custom and heavy-load designs. Swisslog targets hospitals and storage-linked fleets through its healthcare unit in Colorado. Buyers often compare AGV fleets with conveyors and other material handling systems in the same tender, so suppliers that can quote both hold an advantage. Long reference lists and fast service response decide most awards.
How is the U.S. AGV supply side organized?
Supply is split between global intralogistics groups, lift-truck makers with automation units and specialist vehicle builders. Dematic and Swisslog sell AGVs inside larger storage and software projects, while Rocrich and truck-maker partnerships use dealer networks to reach mid-sized sites. Specialists such as E80 Group, Transbotics and AGVE Group win custom and heavy-load work. Entry barriers are high, since buyers demand safety certification, reference sites and local service teams. Margins sit mostly in software, spares and service contracts rather than in vehicle hardware.
Key players in the United States AGV market
| Company | Type | Role in the market |
|---|---|---|
| Dematic | Intralogistics group, KION unit | AGV final assembly and North American headquarters in Grand Rapids, Michigan |
| E80 Group | Laser-guided vehicle specialist | U.S. headquarters and InnovE80 Hub in Chicago since September 2024 |
| Rocrich AGV Solutions | Jungheinrich and Mitsubishi Logisnext Americas joint venture | Automated forklifts sold through Logisnext dealers from Houston and Marengo, Illinois |
| Daifuku Airport America | Daifuku unit | AGVs and mobile robots for manufacturing, warehousing and airports from Novi, Michigan |
| Transbotics | Specialist builder, Scott Technology unit | Custom AGVs and NexBot modular vehicle from Charlotte, North Carolina |
| AGVE Group | Swedish builder, sold by Murata Machinery USA | Forklift, unit-load and heavy-load AGVs with payloads up to 65 tons |
| Swisslog | Automation group | Hospital delivery and transport systems through Swisslog Healthcare in Broomfield, Colorado |
Service depth, not vehicle price, decides the winners
Credence Research's view is that U.S. AGV demand will be decided by service depth and software rather than by vehicle price. Distribution operators paying warehouse wages of about USD 26.87 an hour will keep adding fleets for night and weekend shifts, while new factory demand slows until plant construction recovers. The winners will be suppliers with U.S. assembly, dealer or integrator service coverage and fleet software that can manage mixed traffic. Dual-mode retrofits and hospital fleets offer the clearest new demand, since both use buildings and staff that already exist.
Deployment pace and list prices anchor the estimate
The report uses 2025 as the base year and forecasts values for 2026 to 2035. Market values come from the Credence Research model, which combines estimated annual vehicle deployments with list prices by vehicle type and typical integration and service shares. Regional, segment and application splits are Credence Research estimates built from Bureau of Labor Statistics employment by state, Census Bureau retail and construction data and company product releases. Sources include federal statistics, standards bodies, company releases and trade press. No interviews or surveys were used to build this estimate.
Steady fleet growth led by distribution and retrofits
The United States automated guided vehicles market is expected to reach USD 3.36 billion by 2035, growing at an 8.85% CAGR over 2026–2035. Forklift and pallet-handling vehicles will keep the largest share because pallet moves dominate warehouse work. Unit-load carriers, growing at 9.4% a year, and natural-feature guidance will gain share as retrofits and modular designs lower entry cost for mid-sized U.S. sites. The South will stay the largest region, helped by distribution hubs and new vehicle plants in Texas and Georgia. Capital budgets, trade policy and the recovery of factory construction remain the factors most likely to move growth away from the base path.
Capital budgets and trade policy set the range
The outcome to 2035 depends mainly on capital budgets at distribution operators, the pace of new plant building and trade costs on imported vehicles and parts. Lasting tariffs and weak factory construction would delay large tenders and push buyers toward smaller pilots. The base case assumes steady distribution investment and moderate price increases. Faster adoption of dual-mode retrofits and hospital fleets would lift growth above the base path.
| Scenario | CAGR, 2026–2035 | Value, 2035 | What has to hold |
|---|---|---|---|
| Downside | 7.3% | USD 2.96 billion | Tariffs on imported machinery persist and factory construction keeps falling through 2028 |
| Base | 8.85% | USD 3.36 billion | Distribution investment holds steady and plants add fleets at a moderate pace |
| Upside | 10.3% | USD 3.80 billion | Dual-mode retrofits spread through dealer channels and hospitals scale cart fleets |
Frequently Asked Questions
How big is the United States automated guided vehicles market?
Which vehicle type leads U.S. AGV demand?
Which region leads the United States AGV market?
Why do U.S. warehouses buy automated guided vehicles?
What does an automated guided vehicle cost in the United States?
Which guidance technology grows fastest?
Who are the leading AGV suppliers in the United States?
Which safety standard applies to AGVs in the United States?
Table of Content
Chapter 1 Market Segmentation
- 1.1 Segmentation Framework
- 1.1.1 Product and Service Classification
- 1.1.2 Application and End-Use Classification
- 1.1.3 Technology and Solution Classification
- 1.1.4 Customer and Distribution Channel Classification
- 1.1.5 Geographic Segmentation
- 1.1.6 Market Segment Definitions and Boundaries
- 1.2 By Vehicle Type
- 1.2.1 Forklift and pallet-handling vehicles
- 1.2.2 Towing vehicles
- 1.2.3 Unit-load carriers
- 1.2.4 Special-purpose vehicles
- 1.3 By End-Use Industry
- 1.3.1 Automotive manufacturing
- 1.3.2 Warehousing and distribution
- 1.3.3 Process and discrete manufacturing
- 1.3.4 Healthcare and life sciences
- 1.4 By Technology
- 1.4.1 Laser-reflector guidance
- 1.4.2 Natural-feature guidance
- 1.4.3 Installed-path guidance
- 1.5 By Application
- 1.5.1 Pallet transport and storage
- 1.5.2 Production line feeding
- 1.5.3 Dispatch and internal distribution
Chapter 2 Introduction
- 2.1 Report Objectives and Scope
- 2.2 Product Definition and Industry Terminology
- 2.3 Market Inclusions and Exclusions
- 2.4 Research Process
- 2.4.1 Primary Research and Expert Interviews
- 2.4.2 Secondary Research and Source Review
- 2.4.3 Top-Down and Bottom-Up Estimation
- 2.4.4 Data Triangulation and Verification
- 2.5 Market Size Measurement Basis
- 2.5.1 2025: USD 1.43 billion → 2035: USD 3.36 billion
- 2.6 Historical and Forecast Reference Periods
- 2.6.1 Historical Period: 2018-2025
- 2.6.2 Base Year: 2025
- 2.6.3 Forecast Period: 2025-2035
- 2.7 Research Assumptions and Limitations
Chapter 3 Executive Summary
- 3.1 Market Snapshot and Key Findings
- 3.2 Base-Year Market Size, 2025
- 3.3 Forecast Market Size, 2035
- 3.4 Revenue and Volume Growth Outlook
- 3.5 Key Demand and Supply Indicators
- 3.6 Leading Market Segments
- 3.7 Fastest-Growing Market Opportunities
- 3.8 Regional Performance Highlights
- 3.9 Technology and Industry Transformation
- 3.10 Competitive Landscape Summary
- 3.11 Analyst View and Strategic Implications
Chapter 4 United States Automated Guided Vehicles Market Trends and Developments
- 4.1 Historical Industry Development, 2018-2025
- 4.2 Recent Market Trends and Developments
- 4.3 Demand and Customer Behavior Trends
- 4.4 Technology and Product Innovation
- 4.5 Artificial Intelligence, Automation and Digitalization
- 4.6 Local Manufacturing and Supply Chain Realignment
- 4.7 Industry Partnerships, Mergers and Acquisitions
- 4.8 Sustainability and Circular Economy Developments
- 4.9 Government and Private Sector Investment Trends
- 4.10 Emerging Business Models and Commercialization
- 4.11 Industry Developments and Announcements
Chapter 5 United States Automated Guided Vehicles Market Production, Supply and Demand Analysis
- 5.1 Demand Trend and Consumption Analysis, 2018-2025
- 5.2 Demand Forecast, 2025-2035
- 5.3 Production and Output Trend, 2018-2025
- 5.4 Production and Output Forecast, 2025-2035
- 5.5 Installed Capacity and Capacity Utilization
- 5.6 Company-Wise Production Plants and Statistics
- 5.6.1 Installed Production Capacity
- 5.6.2 Actual Production
- 5.6.3 Planned Capacity and Expansion Targets
- 5.7 Supply Chain Structure and Procurement Trends
- 5.8 Supply-Demand Gap and Bottlenecks
- 5.9 Import Dependence and Sourcing Structure
- 5.10 Contract Manufacturing and Outsourcing
- 5.11 Regional Supply and Demand Concentration
Chapter 6 United States Automated Guided Vehicles Market Pricing Analysis
- 6.1 Pricing Structure and Measurement
- 6.2 Historical Pricing Trends, 2018-2025
- 6.3 Pricing Outlook, 2025-2035
- 6.4 Average Selling Price and Unit Economics
- 6.5 Pricing by Product and Market Segment
- 6.6 Geographic Pricing Differences
- 6.7 Key Input, Energy, Labor and Logistics Costs
- 6.8 Contract Pricing and Purchasing Models
- 6.9 Pricing Sensitivity and Competitive Positioning
- 6.10 Price, Margin and Profitability Implications
Chapter 7 United States Automated Guided Vehicles Market Dynamics
- 7.1 Market Growth Drivers
- 7.1.1 Demand-Side Drivers
- 7.1.2 Technology and Innovation Drivers
- 7.1.3 Infrastructure and Investment Drivers
- 7.1.4 Regulatory and Policy Drivers
- 7.2 Market Restraints
- 7.2.1 Cost and Affordability Constraints
- 7.2.2 Technology and Adoption Barriers
- 7.2.3 Supply Chain and Operational Constraints
- 7.3 Market Challenges
- 7.3.1 Competitive Pressure and Margin Erosion
- 7.3.2 Skills, Infrastructure and Implementation Gaps
- 7.4 Emerging Market Opportunities
- 7.5 Market Dynamics Impact and Time-Horizon Assessment
Chapter 8 United States Automated Guided Vehicles Value Chain Analysis
- 8.1 Industry Value Chain Overview
- 8.2 Upstream Suppliers and Critical Inputs
- 8.3 Technology and Component Providers
- 8.4 Manufacturing or Service Delivery
- 8.5 Distribution, Channel Partners and Integrators
- 8.6 Downstream Applications and End Users
- 8.7 Value Addition and Profit Pools
- 8.8 Vertical Integration and Outsourcing
- 8.9 Supplier Concentration and Risk
- 8.10 Supply Chain Localization and Resilience
Chapter 9 United States Automated Guided Vehicles Market Regulations and Policies
- 9.1 Relevant Laws, Standards and Compliance Frameworks
- 9.2 Product, Service, Safety and Quality Requirements
- 9.3 Government Policies, Incentives and Subsidies
- 9.4 Imports, Exports and Trade Barriers
- 9.5 Public Procurement and Local Content Requirements
- 9.6 Environmental and Sustainability Compliance
- 9.7 Upcoming Policy Changes and Market Implications
Chapter 10 United States Automated Guided Vehicles Market Hotspots and Opportunities
- 10.1 Market Opportunity Mapping and Growth Hotspots
- 10.2 High-Growth Applications and Customer Groups
- 10.3 Underserved Markets and White-Space Opportunities
- 10.4 Emerging Technology and Product Opportunities
- 10.5 New Capacity and Investment Hotspots
- 10.6 Market Entry and Expansion Opportunities
- 10.7 Distribution and Partnership Opportunities
- 10.8 Near-Term and Long-Term Commercial Potential
- 10.9 Opportunity Attractiveness and Execution Risks
Chapter 11 United States Automated Guided Vehicles Market Outlook, 2025-2035
- 11.1 Market Size and Analysis
- 11.1.1 Revenue (Market Measurement: 2025: USD 1.43 billion → 2035: USD 3.36 billion)
- 11.1.2 Market Volume and Quantity Sold
- 11.1.3 Historical Market Size, 2018-2025
- 11.1.4 Base-Year Market Size, 2025
- 11.2 Market Forecast, 2025-2035
- 11.2.1 Revenue Forecast to 2035
- 11.2.2 Volume Forecast to 2035
- 11.2.3 CAGR and Year-on-Year Growth
- 11.2.4 Incremental Revenue Opportunity
- 11.3 Forecast Assumptions and Scenario Analysis
- 11.3.1 Base-Case Forecast
- 11.3.2 Optimistic and Conservative Scenarios
- 11.3.3 Technology, Pricing and Policy Sensitivities
- 11.4 Market Attractiveness and Growth Outlook
Chapter 12 United States Automated Guided Vehicles Market Segmentation and Outlook
- 12.1 Segmentation Summary and Market Shares, 2025
- 12.2 Largest and Fastest-Growing Segments
- 12.3 By Vehicle Type - Market Size and Forecast, 2025-2035
- 12.3.1 Segment Definition and Scope
- 12.3.2 Historical Market Size, 2018-2025
- 12.3.3 Revenue Forecast, 2025-2035
- 12.3.4 Volume Forecast, 2025-2035
- 12.3.5 Base-Year Market Share, 2025
- 12.3.6 Segment CAGR and Growth Drivers
- 12.3.7 Subsegment Market Size and Forecast
- 12.3.7.1 Forklift and pallet-handling vehicles
- 12.3.7.2 Towing vehicles
- 12.3.7.3 Unit-load carriers
- 12.3.7.4 Special-purpose vehicles
- 12.3.8 Subsegment Pricing and Adoption Trends
- 12.3.9 Leading Suppliers and Competition
- 12.3.10 Regional Demand and Opportunities
- 12.4 By End-Use Industry - Market Size and Forecast, 2025-2035
- 12.4.1 Segment Definition and Scope
- 12.4.2 Historical Market Size, 2018-2025
- 12.4.3 Revenue Forecast, 2025-2035
- 12.4.4 Volume Forecast, 2025-2035
- 12.4.5 Base-Year Market Share, 2025
- 12.4.6 Segment CAGR and Growth Drivers
- 12.4.7 Subsegment Market Size and Forecast
- 12.4.7.1 Automotive manufacturing
- 12.4.7.2 Warehousing and distribution
- 12.4.7.3 Process and discrete manufacturing
- 12.4.7.4 Healthcare and life sciences
- 12.4.8 Subsegment Pricing and Adoption Trends
- 12.4.9 Leading Suppliers and Competition
- 12.4.10 Regional Demand and Opportunities
- 12.5 By Technology - Market Size and Forecast, 2025-2035
- 12.5.1 Segment Definition and Scope
- 12.5.2 Historical Market Size, 2018-2025
- 12.5.3 Revenue Forecast, 2025-2035
- 12.5.4 Volume Forecast, 2025-2035
- 12.5.5 Base-Year Market Share, 2025
- 12.5.6 Segment CAGR and Growth Drivers
- 12.5.7 Subsegment Market Size and Forecast
- 12.5.7.1 Laser-reflector guidance
- 12.5.7.2 Natural-feature guidance
- 12.5.7.3 Installed-path guidance
- 12.5.8 Subsegment Pricing and Adoption Trends
- 12.5.9 Leading Suppliers and Competition
- 12.5.10 Regional Demand and Opportunities
- 12.6 By Application - Market Size and Forecast, 2025-2035
- 12.6.1 Segment Definition and Scope
- 12.6.2 Historical Market Size, 2018-2025
- 12.6.3 Revenue Forecast, 2025-2035
- 12.6.4 Volume Forecast, 2025-2035
- 12.6.5 Base-Year Market Share, 2025
- 12.6.6 Segment CAGR and Growth Drivers
- 12.6.7 Subsegment Market Size and Forecast
- 12.6.7.1 Pallet transport and storage
- 12.6.7.2 Production line feeding
- 12.6.7.3 Dispatch and internal distribution
- 12.6.8 Subsegment Pricing and Adoption Trends
- 12.6.9 Leading Suppliers and Competition
- 12.6.10 Regional Demand and Opportunities
- 12.7 Segment Growth Comparison
- 12.8 Segment Attractiveness and Priority Matrix
Chapter 13 United States Automated Guided Vehicles End-Use and Application Market Outlook
- 13.1 End-Use Industry and Customer Demand Structure
- 13.2 Leading Applications and Customer Groups
- 13.3 End-Use Market Size, Share and Forecast
- 13.4 Major End-Use Industry Deep Dives
- 13.4.1 Customer Requirements and Use Cases
- 13.4.2 Demand and Replacement Cycles
- 13.4.3 Technical and Regulatory Considerations
- 13.4.4 Purchasing and Procurement Models
- 13.4.5 Leading Vendors and Distribution Channels
- 13.4.6 Forecast and Commercial Opportunities
- 13.5 Emerging Applications and Cross-Segment Demand
- 13.6 End-Use Industry Investment Priorities
Chapter 14 United States Automated Guided Vehicles Geographic Market Outlook, 2025-2035
- 14.1 Domestic Market Distribution and Demand Clusters
- 14.2 State- or Province-Wise Market Size and Forecast, 2025-2035
- 14.3 City and Metropolitan Market Outlook
- 14.4 Industrial, Manufacturing and Commercial Clusters
- 14.5 Geographic Concentration of Key End Users
- 14.6 Local Pricing and Purchasing Differences
- 14.7 Domestic Production Facilities and Capacity Map
- 14.8 Local Infrastructure and Project Pipeline
- 14.9 State-Level Policy and Incentive Differences
- 14.10 Subnational Investment Hotspots and Opportunities
- 14.11 Distribution and Logistics Networks
- 14.12 Domestic Competitive Footprint
Chapter 15 United States Automated Guided Vehicles Technology, Innovation and Sustainability Outlook
- 15.1 Technology Landscape and Maturity
- 15.2 Product, Process and Service Innovation
- 15.3 AI, Automation and Digital Tools in the Industry
- 15.4 Technology Adoption and Performance Benchmarking
- 15.5 Innovation Pipeline and R&D Investment
- 15.6 Patent and Intellectual Property Trends
- 15.7 Energy Efficiency and Resource Management
- 15.8 Sustainability, Recycling and Circularity
- 15.9 Technology Roadmap, 2025-2035
- 15.10 Risks of Obsolescence and Technology Substitution
Chapter 16 United States Automated Guided Vehicles Market Key Strategic Imperatives
- 16.1 Growth and Market Entry Priorities
- 16.2 High-Return Products and Segments
- 16.3 Pricing, Profitability and Cost Optimization
- 16.4 Technology Investment and Product Differentiation
- 16.5 Supply Chain Localization and Resilience
- 16.6 Distribution and Customer Acquisition
- 16.7 Partnership, Acquisition and Capacity Strategy
- 16.8 Regional Expansion Priorities
- 16.9 Short-, Medium- and Long-Term Actions
Chapter 17 Competition Outlook
- 17.1 Industry Competition Characteristics
- 17.2 Market Structure and Concentration
- 17.3 Market Share and Competitive Positioning, 2025
- 17.4 Company-Wise Revenue and Product Benchmarking
- 17.5 Production and Service Capacity Benchmarking
- 17.6 Technology, Pricing and Differentiation
- 17.7 Regional Footprint and Distribution Strength
- 17.8 Mergers, Acquisitions and Strategic Alliances
- 17.9 New Entrants and Competitive Threats
- 17.10 Porter's Five Forces and Industry Attractiveness
- 17.11 Competitive Outlook, 2025-2035
Chapter 18 Company Profiles
- 18.1 Company Coverage and Selection Criteria
- 18.2 Dematic
- 18.2.1 Business Description
- 18.2.2 Company Ownership and Geographic Presence
- 18.2.3 Product and Service Portfolio
- 18.2.4 Manufacturing and Operating Footprint
- 18.2.5 Production Capacity and Expansion Plans
- 18.2.6 Financial Performance and Investment
- 18.2.7 Market Share and Competitive Position
- 18.2.8 Technology and Innovation Capabilities
- 18.2.9 Strategic Alliances or Partnerships
- 18.2.10 Recent Developments
- 18.2.11 Growth Strategy and Outlook
- 18.3 Daifuku Airport America
- 18.4 JBT Automated Systems
- 18.5 E80 Group
- 18.6 Rocrich AGV Solutions
- 18.7 SSI SCHAEFER
- 18.8 Swisslog
- 18.9 Transbotics
- 18.10 America in Motion
- 18.11 AGVE Group
- 18.12 Other Relevant Market Participants
Note: Every listed company is profiled on the structure shown under the first company. The company list is preliminary and may change based on research findings, market developments, data availability and client requirements.
Chapter 19 Disclaimer
- 19.1 Research and Forecast Disclaimer
- 19.2 Data Source and Estimation Limitations
Note: The depth of individual sections depends on data availability for this market. Volume, capacity, trade and other unit-based metrics are included where applicable.