
Eye tracking turns 3D screens into single-user desk tools
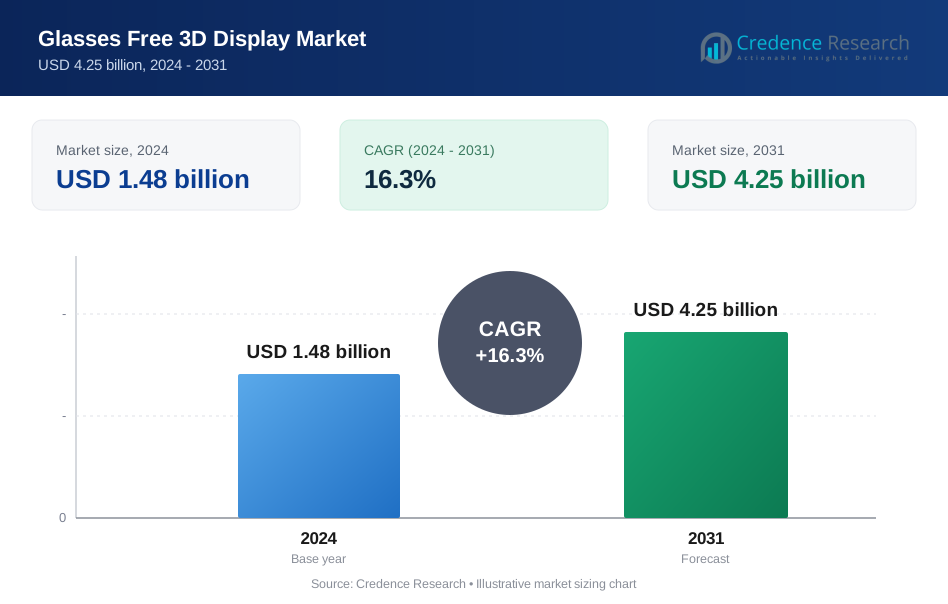
The global glasses-free 3D display market was valued at USD 1.72 billion in 2025 and is projected to increase from USD 2.00 billion in 2026 to USD 7.79 billion by 2035, registering a CAGR of 16.30% during 2026–2035. Demand comes from gamers and designers who want depth on a desk monitor, enterprises that pay for life-size remote meetings, clinicians who review CT and MR data in 3D, and brands that use large screens to stop pedestrians. Asia Pacific held the largest regional share, 38.0% in 2025, because Chinese, Korean, Taiwanese and Japanese firms make most of the panels and launch most consumer devices, and it is also the fastest-growing region at 17.1% a year. The main commercial change is eye tracking, which lets one lenticular panel aim a stereo pair at a single viewer and has moved prices from professional to consumer levels, while light field systems serve groups at much higher cost.
Single-viewer monitors and group-view systems form two markets
The market counts displays that show depth without glasses or headsets, including eye-tracked monitors, laptops and tablets, multi-view and light field screens, holographic signage, medical 3D displays, telepresence systems and automotive 3D clusters. Consumers buy through retail channels, while hospitals, enterprises and advertisers buy through integrators that bundle content tools, installation and support.
LED screens sold for forced-perspective 3D campaigns are counted within retail and advertising. Stereoscopic screens that need glasses, virtual reality headsets and content services sold on their own are excluded. Value sits with the companies that own the optical stack, the tracking and the rendering software, because base LCD, OLED and LED panels are bought from the same suppliers that serve the 2D display trade.
Glasses Free 3D Display Market Insights
- The global glasses-free 3D display market was valued at USD 1.72 billion in 2025 and is projected to reach USD 7.79 billion by 2035, growing at a 16.30% CAGR during 2026–2035.
- Asia Pacific held 38.0% of 2025 value, because regional panel makers and device brands launch most eye-tracked 3D products.
- Autostereoscopic displays held 52.0% of 2025 value, as eye-tracked lenticular monitors and laptops from Samsung, Acer and ASUS reached consumer price points.
- HP began selling its Google Beam light field system in Japan in October 2026, adding an Asian market to the enterprise rollout of 3D meeting rooms.
- Leia supplies its 3D optics and software to more than 10 customers, including Samsung, Acer and Barco, so know-how is concentrated in a few licensors.
Eye-tracked lenticular screens lead, holographic units gain
Single-viewer screens lead on consumer monitor launches
Based on product type, the market is categorized into autostereoscopic displays, holographic displays and multi-view displays. Autostereoscopic Displays led with 52.0% of 2025 value because eye tracking lets a single panel serve one seated user at full depth, and Samsung opened early orders for its 27-inch 4K Odyssey 3D on April 1, 2025, pairing a lenticular lens with eye tracking. Holographic Displays grow fastest at 18.5% a year as Looking Glass said on Sept. 16, 2025, that its hololuminescent display is under one inch thick and serves groups with no eye tracking, which suits store windows and lobbies.
Lenticular sheets lead while light field systems grow fastest
Based on technology, the market is categorized into lenticular lens technology, parallax barrier technology and light field technology. Lenticular Lens Technology led with 58.0% of 2025 value because a lens sheet bonded to an OLED or LCD panel keeps more brightness than a barrier, and ASUS says its Spatial Vision laptops combine such a sheet with a switchable liquid crystal layer and dual tracking cameras. Light Field Technology grows fastest at 17.9% a year as Google announced Beam on May 20, 2025, a system that uses six cameras and a custom light field panel, TechCrunch reported.
Gaming leads while clinical 3D review grows fastest
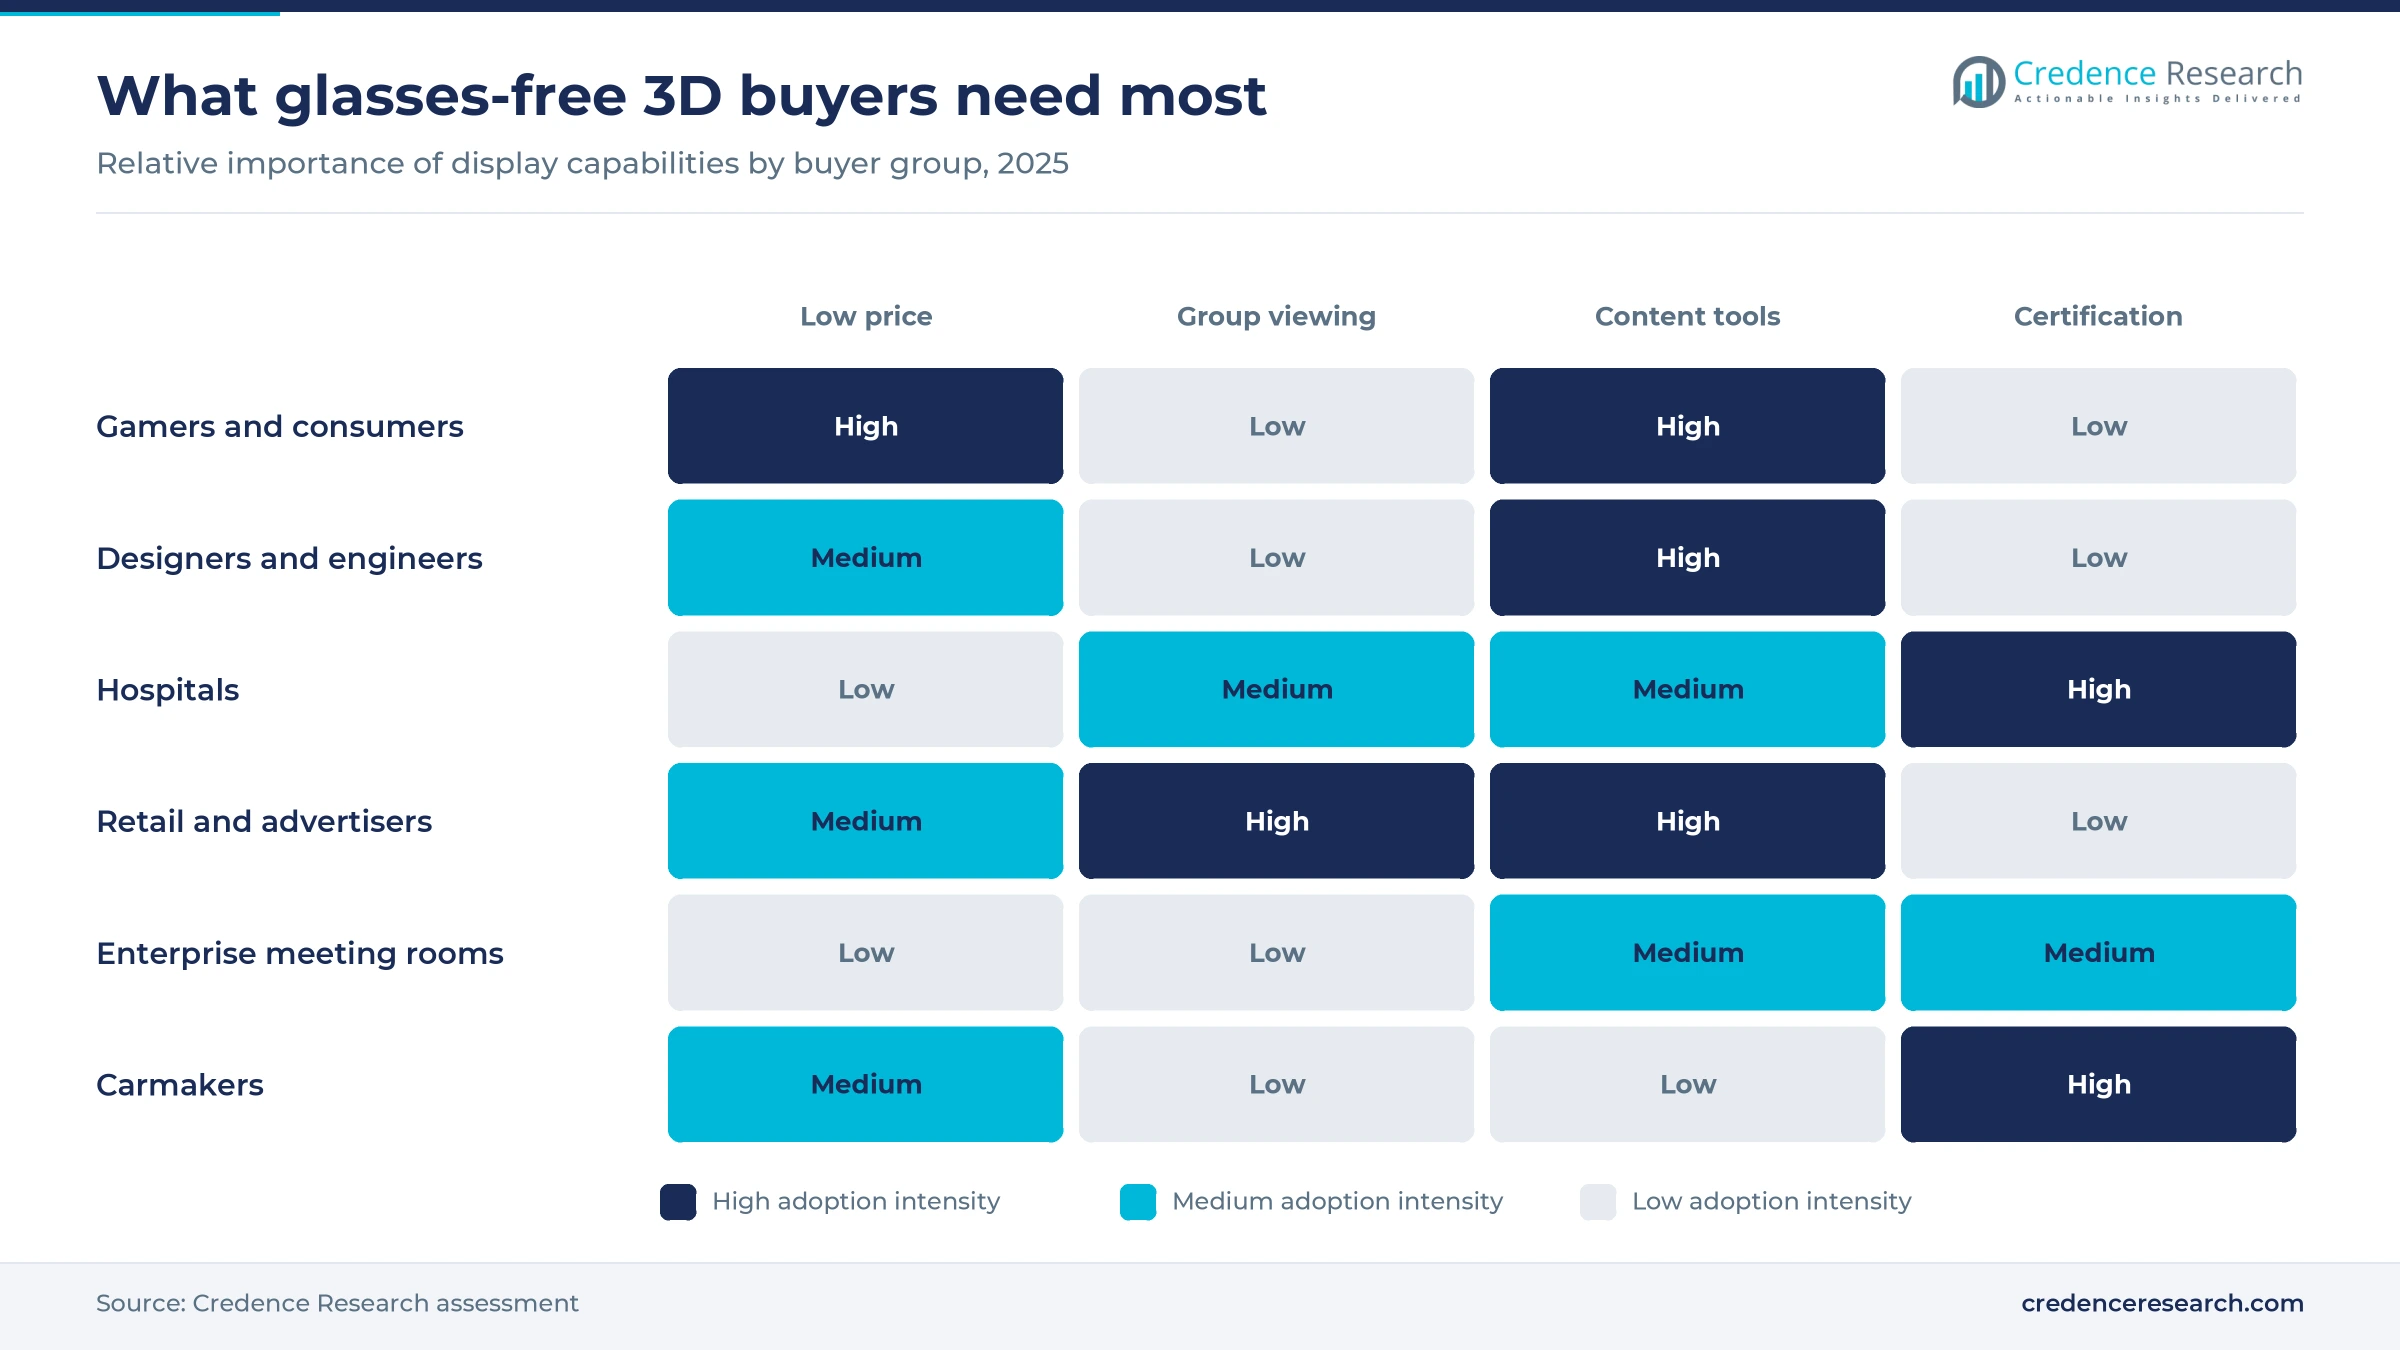
Based on end-user, the market is categorized into entertainment and gaming, healthcare, education, retail and advertising, and others. Entertainment and Gaming led with 34.0% of 2025 value because gaming monitors are the highest-volume product, and Samsung worked with Nexon and Neowiz to ship titles such as Lies of P in 3D. Healthcare grows fastest at 18.6% a year as Barco and Avatar Medical launched Eonis Vision on Nov. 20, 2025, a glasses-free 3D medical display built on Leia technology, with early assessments underway in U.S. and European hospitals.
| Segment Group | Leading Sub-segment | Share, 2025 | Fastest-growing Sub-segment | CAGR, 2026–2035 |
|---|---|---|---|---|
| By Product Type | Autostereoscopic Displays | 52.0% | Holographic Displays | 18.5% |
| By Technology | Lenticular Lens Technology | 58.0% | Light Field Technology | 17.9% |
| By End-User | Entertainment and Gaming | 34.0% | Healthcare | 18.6% |
List prices span USD 1,400 laptops to USD 25,000 rooms
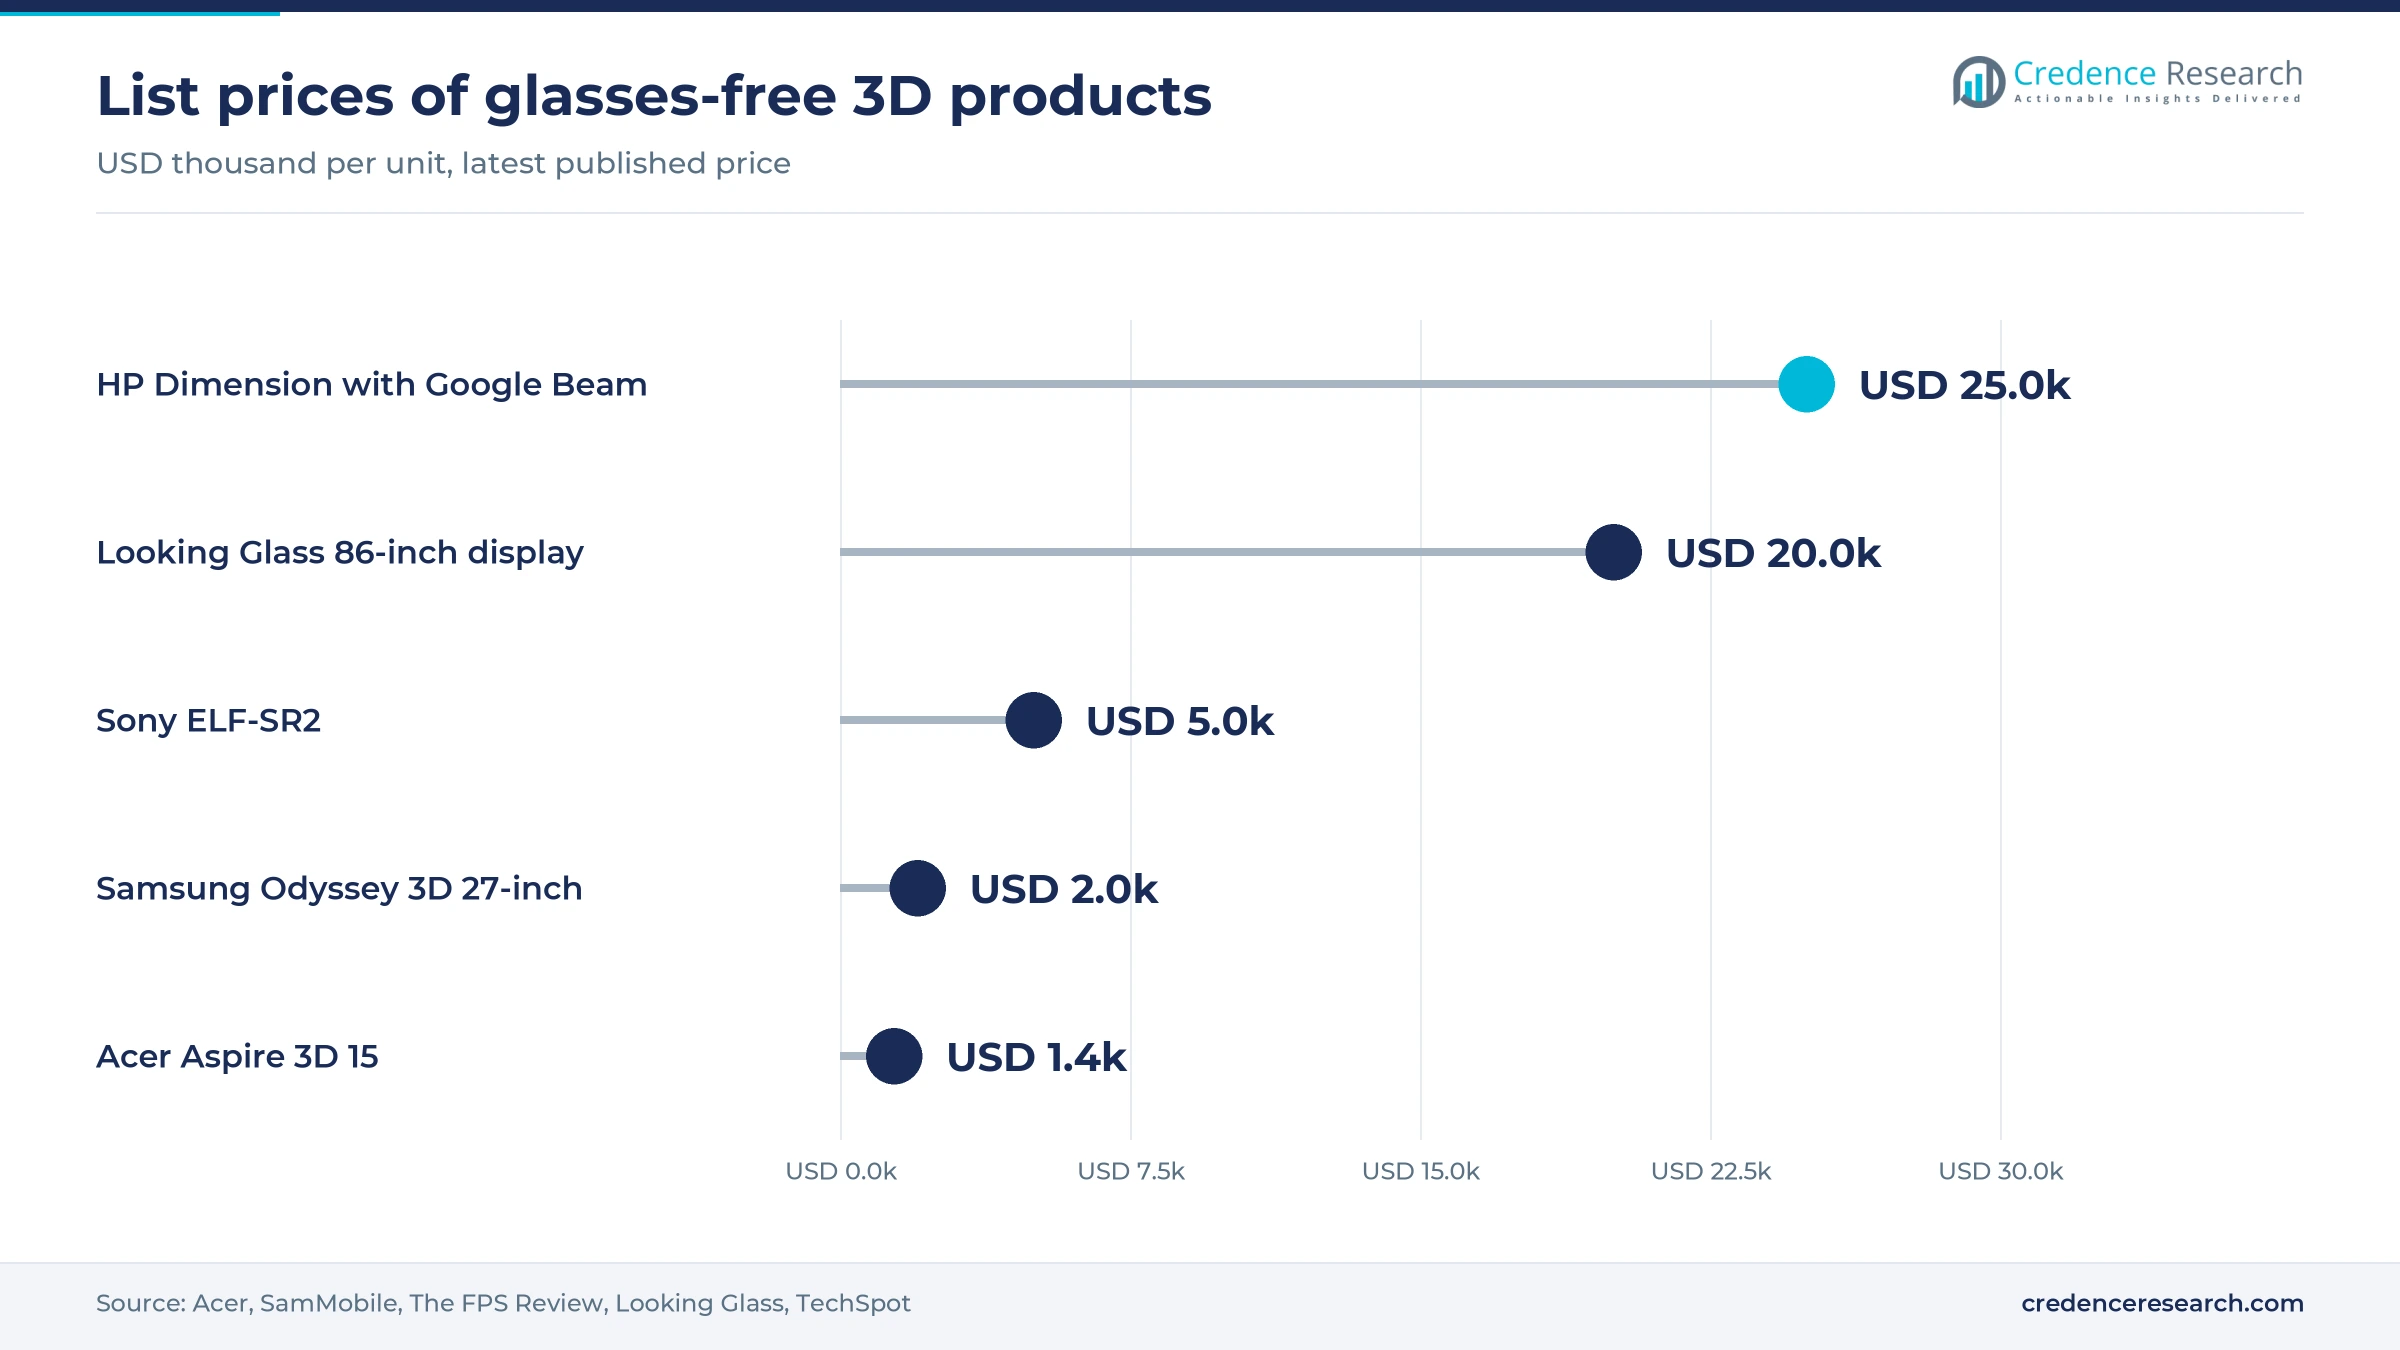
Pricing follows the number of viewers that a single display serves at once. Single-viewer eye-tracked monitors and laptops sell near the price of premium 2D gaming hardware, because they reuse standard panels and add a lens sheet, cameras and software. Group-view systems cost far more, since they need many views, high-resolution light field panels or thick optics, plus installation. Volume, graphics-card requirements and content libraries move consumer prices, while license and service fees decide total cost for enterprise rooms. Licensors take a share of each device, so brand margins are thinner than the list prices suggest.
| Product or offer | Typical price or fee | Basis |
|---|---|---|
| Acer Aspire 3D 15 SpatialLabs Edition laptop | From USD 1,399.99 | Acer, January 2024 |
| Samsung Odyssey 3D 27-inch monitor | About USD 2,000 (U.S.), INR 127,299 (India) | SamMobile, March 2025; Samsung India, April 2025 |
| Sony ELF-SR2 27-inch professional display | USD 5,000 expected MSRP | The FPS Review, April 2023 |
| Looking Glass 86-inch hololuminescent display | USD 20,000 list, USD 15,000 pre-order | Looking Glass, December 2025 |
| HP Dimension with Google Beam | USD 24,999 before license and installation | TechSpot, June 2025 |
Request a Free Sample
Fill in your details and we'll send you a free sample report.
- Sample data tables & charts
- Research methodology
Desk monitors, light field rooms and clinics lift demand
Eye tracking brings 3D monitors to consumer price points
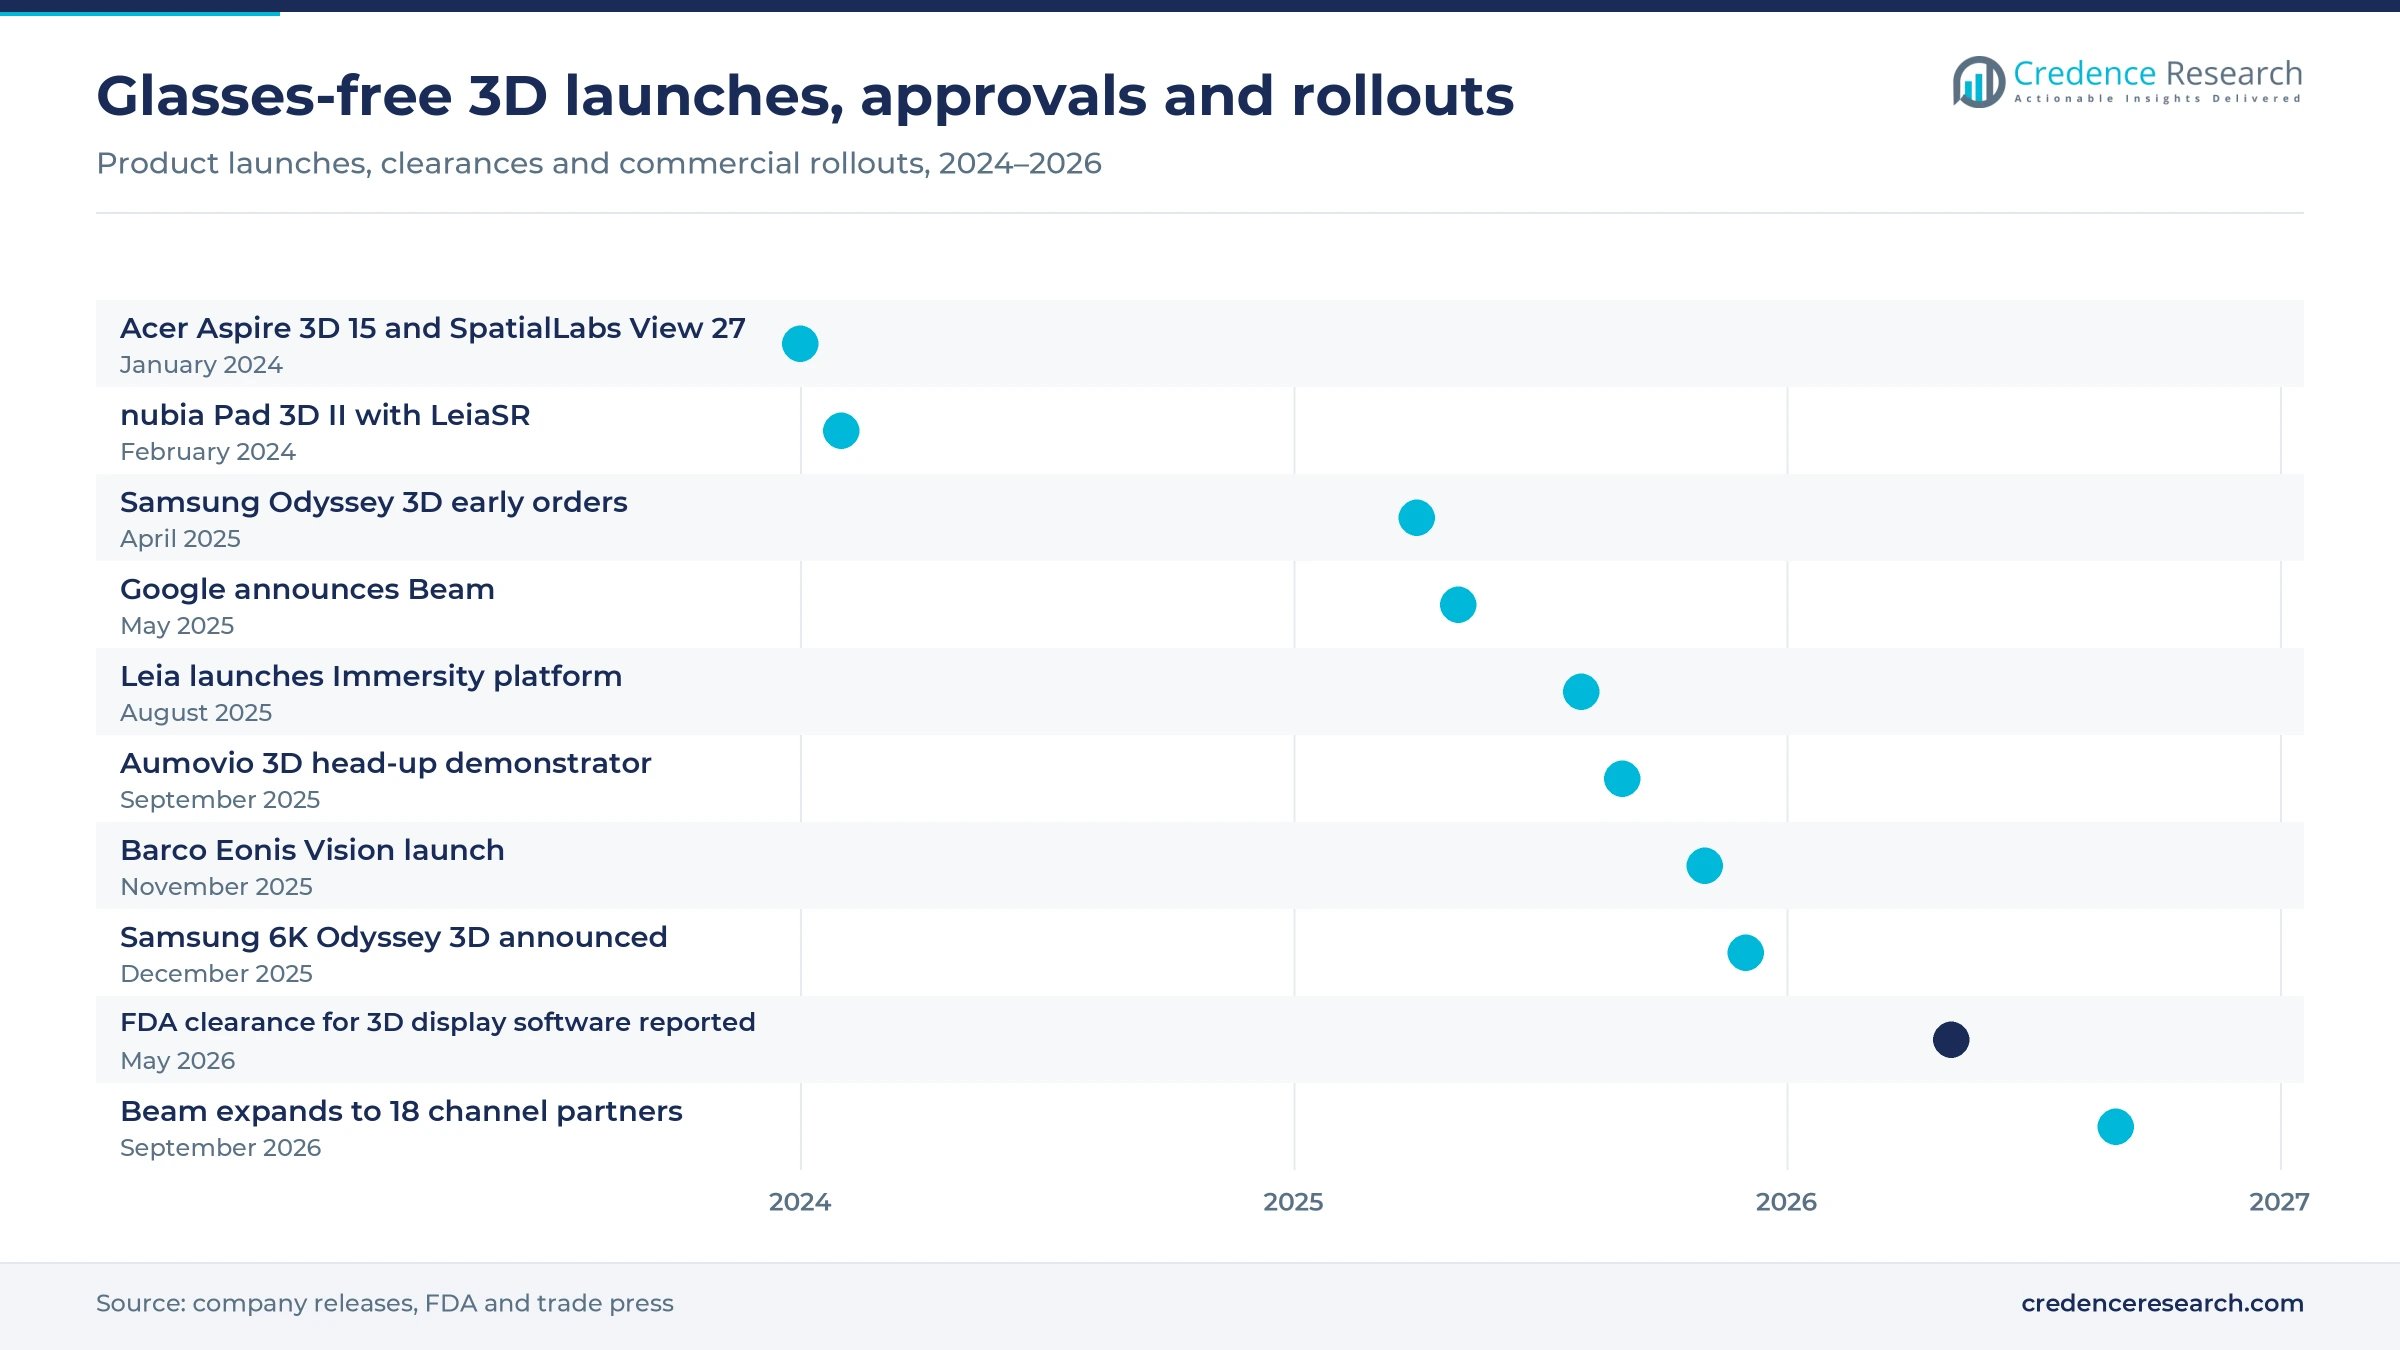
Eye tracking has turned glasses-free 3D from a specialist tool into a consumer product, because tracking one viewer lets a standard lenticular panel deliver depth without the many views that multi-view screens need. Sony launched its 27-inch ELF-SR2 in May 2023 for industrial design, surgical planning and architecture buyers. Acer launched the Aspire 3D 15 laptop in January 2024 for North America, EMEA and China, with SpatialLabs Go software that converts 2D content to 3D in real time, alongside the Predator SpatialLabs View 27 monitor for North America and EMEA. Samsung announced a 32-inch 6K Odyssey 3D on Dec. 24, 2025, TFTCentral reported, though price and shipping dates were not disclosed. Gaming brands gain volume from this shift, while panel suppliers face pressure to cut the cost of tracking cameras and lens sheets.
Light field rooms create an enterprise telepresence category
Large companies are paying for life-size remote meetings, which creates a high-value category for light field panels that serve one remote participant at full scale. Google named Deloitte, Salesforce, Citadel, NEC and Duolingo as early Beam customers when it launched the platform. HP announced the Dimension system for Beam at InfoComm in June 2025 for select enterprise customers, with a separately sold Google Beam license required for calls, TechSpot reported. Google said on Sept. 23, 2026, that 18 channel partners can now deploy the system and that bookable rooms open in Atlanta, Chicago, New York and Palo Alto, Mixed reported. Buyers of enterprise video conferencing rooms gain a premium tier, while integrators such as AVI-SPL earn installation fees.
Clinical approvals open hospital budgets for 3D review
Hospitals can now buy glasses-free 3D for consultations and surgical planning, because cleared software turns CT and MR scans into depth images without manual segmentation. The FDA cleared Avatar Medical Software V1 under 510(k) K222035 on May 24, 2023, and HospiMedica reported on May 6, 2026, that a later clearance was the first for software intended for glasses-free 3D medical displays. AUO showed a naked-eye 3D solution with eye tracking for surgeon training and consultation at Touch Taiwan in April 2025. Medical display makers with clinical channels gain most, because hospitals buy through validated workstation vendors rather than retail.
Retail and out-of-home screens pay for depth that stops passersby
Brands and venue owners are buying depth to raise dwell time, and that budget funds large-format 3D screens in stores, airports and city squares. Looking Glass opened pre-orders for an 86-inch hololuminescent display on Dec. 16, 2025, for transport hubs, flagship stores, museums and theme parks, with shipping in spring 2026. Samsung put an 85-inch Spatial Signage display on sale after unveiling it at ISE 2026, using a patented 3D Plate behind the LCD panel to create depth in a 52 mm housing, with 32-inch and 55-inch versions planned, ChannelNews reported. These projects extend digital signage budgets into 3D content, and display makers capture most of the hardware spending, while content studios are paid separately by the brand.
AI conversion and licensed optics reshape the supply chain
AI depth conversion shifts value from content to software
Display brands are shifting toward AI software that converts ordinary 2D video and games into 3D, to address the shortage of native content, creating openings for depth-estimation tools across consumer and professional screens. Leia launched its Immersity platform on Aug. 13, 2025, combining AI conversion software with switchable display hardware under one brand. Samsung offers an Odyssey 3D Hub app that detects video and plays it in 3D. Conversion software lets brands sell 3D hardware before native libraries exist, which shortens the wait for a usable catalog on each new monitor or tablet. Software owners gain recurring license income, while hardware-only makers lose differentiation.
Licensed optical stacks concentrate know-how in a few firms
Device makers are shifting toward licensing 3D optics, tracking and weaving software instead of building them, to cut development cost, creating openings for platform owners across monitors, tablets and medical displays. Leia has more than 10 customers, including Samsung, Acer and Barco, and holds more than 2,000 patents after buying Dimenco and the Royal Philips 3D portfolio in 2023, Mergermarket reported on April 24, 2026. BOE showed a 10.95-inch naked-eye 3D gaming handheld at Display Week 2025, China Daily reported, and panel makers now offer 3D-ready stacks to brands. Brands gain speed to market, although licensing fees cap their margins.
Car cockpits offer a large opening for eye-tracked 3D
Vehicle cockpits form a clear opening, because the driver sits in a fixed position that eye-tracked optics handle well, and depth can separate warnings from routine data. Continental said in March 2020 that its parallax barrier 3D cluster, with a camera that follows the driver, entered volume production in the Genesis GV80 high-line variant. Aumovio, formerly Continental's automotive unit, showed a near-production head-up system with an Epitone 3D display that uses eye tracking to send each eye its own image at IAA Mobility in September 2025. Tier-one cockpit suppliers such as Aumovio gain most, because carmakers usually buy complete display modules.
Smartphones are the next volume opening for licensors
Smartphones offer the largest unit opening, because a 3D layer can be added to panels that already ship in hundreds of millions. Leia expects the first OEM smartphones with its technology in early 2028 and may raise USD 50 million to USD 100 million to support that push, Mergermarket reported. ZTE planned the nubia Pad 3D II for Europe, the Middle East, Japan and China, with China Mobile and Orange collaborating on glasses-free products, according to Leia. Credence Research treats phones as upside to the base forecast, and carriers that subsidize devices could set the pace, while panel makers gain only if the optical layer adds little thickness.
One-viewer optics, thin content and high system prices
Eye-tracked screens serve only one viewer at a time
Most affordable products track one pair of eyes, so a second viewer sees a flat or distorted image. This limits sales to personal desks and blocks shared use in classrooms and family rooms. Samsung says its 2D-to-3D video conversion needs an RTX 3080 or better graphics card and does not work with DRM content or HDR mode. Schools and households are most exposed, while multi-view and holographic suppliers can serve these groups at higher prices.
Native 3D games and video remain scarce
Games do not show depth automatically, so each title must be optimized for the 3D mode before buyers see the full effect. MacRumors noted in January 2026 that Samsung's 6K model, shown at CES, lists a short set of launch titles, including The First Berserker Khazan, Lies of P Overture and Stellar Blade. Makers of premium 4K gaming monitors are most exposed, because a thin library weakens the case for a price premium, and they must fund studio partnerships to close the gap.
System prices keep group-view 3D in pilot budgets
Group-view systems still cost many times a 2D screen, so they stay in pilot and flagship budgets. HP Japan priced the wall-mount Dimension at JPY 6,598,900 in August 2026, excluding the Beam license, installation and maintenance. Buyers must purchase a Google Beam license separately, and Google had not disclosed its cost when HP announced the hardware, TechSpot reported. Mid-size firms and public agencies are most exposed, since total cost per room is hard to forecast before purchase.
Loose 3D labels make performance hard to compare
Sellers apply the naked-eye 3D label to very different products, which makes quotes hard to compare and invites disappointment. Invidis noted in March 2026 that a 41-meter LED sphere in Shanghai sold as naked-eye 3D relies on forced perspective with a narrow sweet spot. IEC 62629-22-1, edition 2.0 of October 2016, sets optical measuring methods for two-view, multi-view and integral imaging displays. Advertisers and procurement teams are most exposed unless tenders specify those tests.
Asia Pacific leads on panel supply and device launches
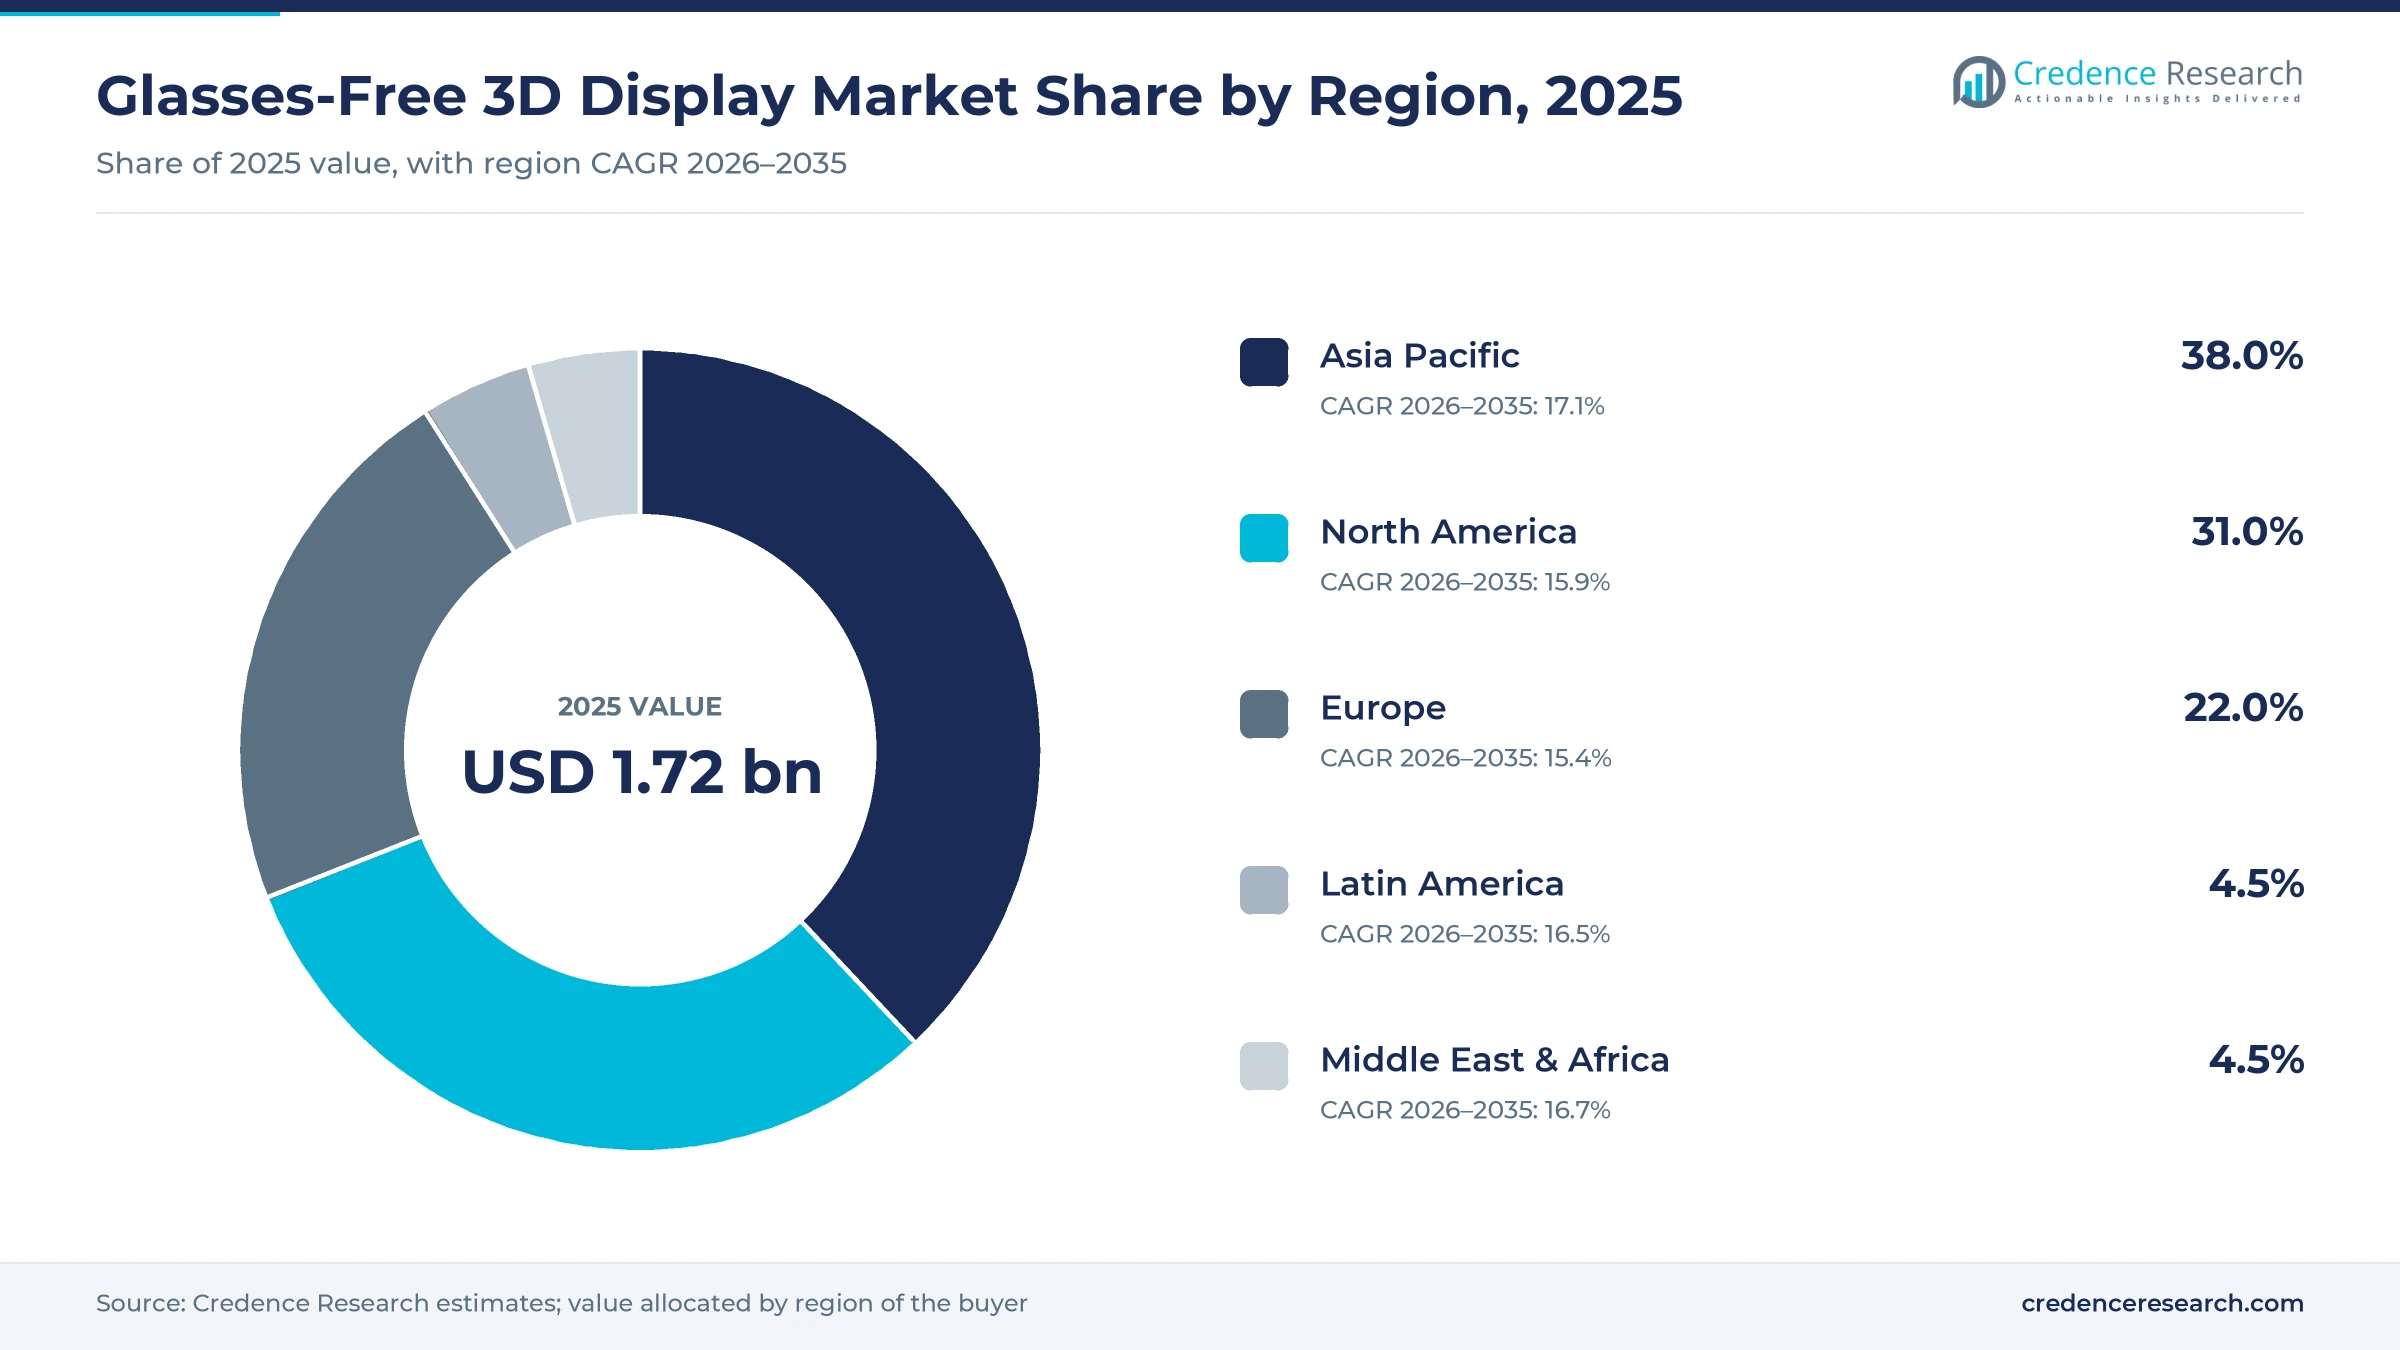
Regional value follows panel supply, device launches and enterprise budgets, so Asia Pacific and North America held most of the 2025 value. Europe adds medical and optical engineering demand, while Latin America and the Middle East and Africa remain small.
| Region | Value, 2025 (USD billion) | Share, 2025 | CAGR, 2026–2035 |
|---|---|---|---|
| Asia Pacific | 0.65 | 38.0% | 17.1% |
| North America | 0.53 | 31.0% | 15.9% |
| Europe | 0.38 | 22.0% | 15.4% |
| Latin America | 0.08 | 4.5% | 16.5% |
| Middle East & Africa | 0.08 | 4.5% | 16.7% |
Asia Pacific leads on panel makers and device launches
Asia Pacific held 38.0% of 2025 value and grows fastest at 17.1% a year. Samsung, BOE, AUO, ZTE and Sony design or build most devices in the region, and Chinese LED makers supply most large outdoor screens sold for 3D campaigns. Samsung launched the Odyssey 3D in India on April 9, 2025, at INR 127,299, which shows demand reaching new consumer markets. AUO said in April 2025 that its SurgiEyes real-time 3D system for robotic surgery had reached nearly 30 medical institutions in Japan through its partner SkyJet.
North America leads in enterprise and clinical 3D buying
North America held 31.0% of 2025 value and grows at 15.9% a year. The region hosts the first bookable Beam rooms and most named enterprise customers described above, and Sony first sold its ELF-SR2 through professional channels in the United States and Canada. FDA clearances for 3D review software give hospitals a clear route to purchase, which favors vendors that already hold U.S. regulatory files, such as Avatar Medical working with Barco.
Europe builds on medical displays and optical engineering
Europe held 22.0% of 2025 value and grows at 15.4% a year. Barco, based in Belgium, sells medical displays through hospital channels, and its Eonis Vision assessments include European hospitals. Leia keeps an office in the Netherlands through Dimenco, its Dutch optics unit, which gives European device and medical customers local engineering support. Acer priced the Predator SpatialLabs View 27 at EUR 1,999 for EMEA buyers, close to its U.S. price.
Middle East and Africa start with retail and venue screens
The Middle East and Africa held 4.5% of 2025 value and grow at 16.7% a year. ZTE planned the nubia Pad 3D II for Middle East buyers, but no regional order data were found for this edition. Demand comes mainly from malls, airports and venues that use 3D signage, so the estimate rests on Credence Research modeling of display imports and retail projects.
Latin America remains a small import market
Latin America held 4.5% of 2025 value and grows at 16.5% a year. No local maker or verified large project was found for this edition, so the value comes from imported gaming monitors, laptops and signage, and it rests on Credence Research estimates. Import duties raise shelf prices in Brazil and Argentina, which keeps eye-tracked monitors a niche purchase for enthusiasts and design studios.
Monitor, telepresence and medical launches mark 2025-26
| Development | Status and market relevance |
|---|---|
| In September 2025, Looking Glass announced its hololuminescent display, starting at USD 2,000 for a 16-inch unit. | Product announcement with Q4 2025 availability; it moves group-view 3D into standard signage form factors. |
| In November 2025, Barco and Avatar Medical launched Eonis Vision, a glasses-free 3D display for clinical consultations. | Commercial launch of the display; the bundled software version awaits FDA clearance, with hospital assessments underway. |
| In December 2025, Samsung announced a 32-inch 6K Odyssey 3D monitor with real-time eye tracking. | Announcement ahead of CES 2026; price and availability were not disclosed at the time. |
| In August 2026, HP Japan announced HP Dimension with Google Beam, with sales starting in October 2026. | Commercial launch in Japan; it extends HP's Beam hardware sales into Asia. |
| In September 2026, Google said 18 channel partners can deploy Beam and that bookable rooms open in four U.S. cities. | Commercial expansion; it lowers the trial barrier for firms that cannot yet buy a full system. |
Lenticular sheets, barriers, light fields and trackers
- Lenticular lens sheets bend light from alternate pixel columns toward each eye, keeping brightness high and they dominate eye-tracked monitors and laptops.
- Parallax barriers block alternate columns with a slatted mask, which is cheaper and switchable but dims the image, so they suit cockpit clusters more than monitors.
- Light field panels emit many directional views at once, so several people see depth together, although they need very high native resolution and processing power.
- Tracking and weaving software locates the eyes with cameras and recomputes the interleaved image every frame, which decides crosstalk and the size of the sweet spot.
Need a Custom Version of This Report?
Tailor the scope, geography, or segments to your exact requirements.
- Custom geography or segment scope
- Direct access to our analyst team
Optics licensors and device brands split the margins
Competition runs on three factors, the quality of the optical stack and tracking, the depth of the content library, and access to retail, hospital or enterprise channels. Samsung leads consumer monitors with its Odyssey 3D line, while Acer, ASUS and Lenovo sell 3D laptops and monitors that rely in part on licensed optics. Leia supplies optics and software to several of these brands and to Barco in medical displays. Sony and Looking Glass serve designers, developers and signage buyers, HP sells the hardware for Google Beam rooms, and ZTE carries the technology into tablets. BOE and AUO compete as panel makers offering 3D-ready stacks. Device brands win on distribution, while licensors win on patents and software updates, so most partnerships are multi-year technology agreements rather than one-off component purchases.
How the supply side of 3D displays is organized
Supply sits in four layers, and each one earns different margins. Panel makers such as BOE, AUO and Samsung supply LCD, OLED and LED panels at commodity margins. Optics and software licensors, led by Leia, provide lens designs, tracking and rendering code and earn the highest margins per unit. Device brands such as Samsung, Acer, ASUS, Sony and HP package the product and carry the retail risk. Integrators and LED project firms install signage and meeting rooms. Patents on weaving and tracking form the main entry barrier.
Companies profiled and their roles in this market
| Company | Type | Role in the market |
|---|---|---|
| Samsung Electronics | Device brand and panel maker | Odyssey 3D eye-tracked gaming monitors in 27-inch 4K and 32-inch 6K sizes |
| Leia Inc. | Optics and software licensor | LeiaSR and Immersity optics, tracking and AI conversion software for device makers |
| Sony Corporation | Professional display maker | ELF-SR2 Spatial Reality Display for design, medical and signage users |
| Acer Inc. | Device brand | SpatialLabs laptops and monitors with head tracking and 2D-to-3D conversion |
| ASUSTeK Computer Inc. | Device brand | Spatial Vision OLED laptops with lenticular optics and eye tracking |
| HP Inc. | Telepresence hardware maker | HP Dimension light field system for Google Beam meeting rooms |
| Looking Glass Factory | Specialist | Light field and hololuminescent displays for developers, retail and venues |
| Barco NV | Medical display maker | Eonis 3D glasses-free display for clinical consultations and planning |
| AUO Corporation | Panel maker | Naked-eye 3D medical display solution with eye tracking for surgeons |
| BOE Technology Group | Panel maker | Naked-eye 3D panels, including a gaming handheld shown in 2025 |
| ZTE Corporation (nubia) | Device brand | nubia Pad 3D tablets with LeiaSR glasses-free 3D |
| Lenovo Group | Device brand | ThinkVision 27 3D monitor with switchable lenticular lens and eye tracking |
Growth depends on content and per-viewer cost, not optics
Credence Research's view is that growth now depends on content and cost per viewer rather than on optics, which work well for a seated user. Eye-tracked monitors have reached consumer prices, but scarce native titles still limit repeat demand. The higher-value growth comes from light field meeting rooms, clinical 3D review and car cockpits, where buyers pay for a defined task. Licensors with patents and conversion software are best placed, while brands without their own software face price competition.
Device list prices and launch records anchor the estimate
The report uses 2025 as the base year and 2026 to 2035 as the forecast period. Market values come from the Credence Research model, which updates the earlier estimate on this page to the 2025 base and checks it against product list prices and launch records. Regional and segment splits are Credence Research estimates built from device, panel and project data. Sources include the FDA, the IEC, company releases and news reports. No interviews or surveys were conducted for this edition of the glasses free 3D display report. No vendor discloses unit shipments of glasses-free products, and large LED screens sold for forced-perspective campaigns are hard to separate from 2D signage, so the advertising share carries the most uncertainty.
Telepresence, clinics and cars carry growth to 2035
Through 2035, glasses-free 3D should spread from gaming desks into meeting rooms, hospitals and vehicles, where buyers pay for a specific task rather than novelty. AI conversion will reduce the content gap, and eye tracking will keep single-viewer products near mainstream monitor prices. Light field and holographic systems should fall in cost as panel resolution rises. Asia Pacific keeps the largest share through its panel and device makers, while smartphone adoption after 2028 is the main upside to the forecast.
Content supply and smartphone timing decide the range to 2035
The outcome depends on whether studios and AI tools supply enough 3D content and whether smartphone makers adopt the optics on time. The downside case assumes eye-tracked monitors stay a niche and enterprise rooms remain pilots. The upside case assumes phones ship from 2028 and hospitals buy 3D review screens at scale. The base case sits between them, with steady monitor sales, gradual room rollouts and clinical growth.
| Scenario | CAGR, 2026–2035 | Value, 2035 | What has to hold |
|---|---|---|---|
| Downside | 12.3% | USD 5.69 billion | Content stays scarce, monitors remain a niche and enterprise rooms stay in pilots |
| Base | 16.30% | USD 7.79 billion | Monitor sales rise steadily while telepresence and clinical displays expand gradually |
| Upside | 19.8% | USD 10.17 billion | Smartphones adopt 3D optics from 2028 and hospitals buy 3D review screens at scale |
Frequently Asked Questions
How big is the glasses-free 3D display market?
Which are the leading glasses-free 3D display companies?
How much does a glasses-free 3D monitor cost?
How do glasses-free 3D monitors work?
Are glasses-free 3D LED billboards true 3D?
Which region leads the glasses-free 3D display market?
Are glasses-free 3D displays used in smartphones?
How are glasses-free 3D displays used in healthcare?
Table of Content
Chapter 1 Market Segmentation
- 1.1 Segmentation Framework
- 1.1.1 Product and Service Classification
- 1.1.2 Application and End-Use Classification
- 1.1.3 Technology and Solution Classification
- 1.1.4 Customer and Distribution Channel Classification
- 1.1.5 Geographic Segmentation
- 1.1.6 Market Segment Definitions and Boundaries
- 1.2 By Product Type
- 1.2.1 Autostereoscopic Displays
- 1.2.2 Holographic Displays
- 1.2.3 Multi-View Displays
- 1.3 By Technology
- 1.3.1 Lenticular Lens Technology
- 1.3.2 Parallax Barrier Technology
- 1.3.3 Light Field Technology
- 1.4 By End-User
- 1.4.1 Entertainment and Gaming
- 1.4.2 Healthcare
- 1.4.3 Education
- 1.4.4 Retail and Advertising
- 1.4.5 Others
Chapter 2 Introduction
- 2.1 Report Objectives and Scope
- 2.2 Product Definition and Industry Terminology
- 2.3 Market Inclusions and Exclusions
- 2.4 Research Process
- 2.4.1 Primary Research and Expert Interviews
- 2.4.2 Secondary Research and Source Review
- 2.4.3 Top-Down and Bottom-Up Estimation
- 2.4.4 Data Triangulation and Verification
- 2.5 Market Size Measurement Basis
- 2.5.1 2025: USD 1.72 billion → 2035: USD 7.79 billion
- 2.6 Historical and Forecast Reference Periods
- 2.6.1 Historical Period: 2018-2025
- 2.6.2 Base Year: 2025
- 2.6.3 Forecast Period: 2025-2035
- 2.7 Research Assumptions and Limitations
Chapter 3 Executive Summary
- 3.1 Market Snapshot and Key Findings
- 3.2 Base-Year Market Size, 2025
- 3.3 Forecast Market Size, 2035
- 3.4 Revenue and Volume Growth Outlook
- 3.5 Key Demand and Supply Indicators
- 3.6 Leading Market Segments
- 3.7 Fastest-Growing Market Opportunities
- 3.8 Regional Performance Highlights
- 3.9 Technology and Industry Transformation
- 3.10 Competitive Landscape Summary
- 3.11 Analyst View and Strategic Implications
Chapter 4 Global Glasses Free 3D Display Market Trends and Developments
- 4.1 Historical Industry Development, 2018-2025
- 4.2 Recent Market Trends and Developments
- 4.3 Demand and Customer Behavior Trends
- 4.4 Technology and Product Innovation
- 4.5 Artificial Intelligence, Automation and Digitalization
- 4.6 Local Manufacturing and Supply Chain Realignment
- 4.7 Industry Partnerships, Mergers and Acquisitions
- 4.8 Sustainability and Circular Economy Developments
- 4.9 Government and Private Sector Investment Trends
- 4.10 Emerging Business Models and Commercialization
- 4.11 Industry Developments and Announcements
Chapter 5 Global Glasses Free 3D Display Market Production, Supply and Demand Analysis
- 5.1 Demand Trend and Consumption Analysis, 2018-2025
- 5.2 Demand Forecast, 2025-2035
- 5.3 Production and Output Trend, 2018-2025
- 5.4 Production and Output Forecast, 2025-2035
- 5.5 Installed Capacity and Capacity Utilization
- 5.6 Company-Wise Production Plants and Statistics
- 5.6.1 Installed Production Capacity
- 5.6.2 Actual Production
- 5.6.3 Planned Capacity and Expansion Targets
- 5.7 Supply Chain Structure and Procurement Trends
- 5.8 Supply-Demand Gap and Bottlenecks
- 5.9 Import Dependence and Sourcing Structure
- 5.10 Contract Manufacturing and Outsourcing
- 5.11 Regional Supply and Demand Concentration
Chapter 6 Global Glasses Free 3D Display Market Pricing Analysis
- 6.1 Pricing Structure and Measurement
- 6.2 Historical Pricing Trends, 2018-2025
- 6.3 Pricing Outlook, 2025-2035
- 6.4 Average Selling Price and Unit Economics
- 6.5 Pricing by Product and Market Segment
- 6.6 Geographic Pricing Differences
- 6.7 Key Input, Energy, Labor and Logistics Costs
- 6.8 Contract Pricing and Purchasing Models
- 6.9 Pricing Sensitivity and Competitive Positioning
- 6.10 Price, Margin and Profitability Implications
Chapter 7 Global Glasses Free 3D Display Market Dynamics
- 7.1 Market Growth Drivers
- 7.1.1 Demand-Side Drivers
- 7.1.2 Technology and Innovation Drivers
- 7.1.3 Infrastructure and Investment Drivers
- 7.1.4 Regulatory and Policy Drivers
- 7.2 Market Restraints
- 7.2.1 Cost and Affordability Constraints
- 7.2.2 Technology and Adoption Barriers
- 7.2.3 Supply Chain and Operational Constraints
- 7.3 Market Challenges
- 7.3.1 Competitive Pressure and Margin Erosion
- 7.3.2 Skills, Infrastructure and Implementation Gaps
- 7.4 Emerging Market Opportunities
- 7.5 Market Dynamics Impact and Time-Horizon Assessment
Chapter 8 Global Glasses Free 3D Display Value Chain Analysis
- 8.1 Industry Value Chain Overview
- 8.2 Upstream Suppliers and Critical Inputs
- 8.3 Technology and Component Providers
- 8.4 Manufacturing or Service Delivery
- 8.5 Distribution, Channel Partners and Integrators
- 8.6 Downstream Applications and End Users
- 8.7 Value Addition and Profit Pools
- 8.8 Vertical Integration and Outsourcing
- 8.9 Supplier Concentration and Risk
- 8.10 Supply Chain Localization and Resilience
Chapter 9 Global Glasses Free 3D Display Market Regulations and Policies
- 9.1 Relevant Laws, Standards and Compliance Frameworks
- 9.2 Product, Service, Safety and Quality Requirements
- 9.3 Government Policies, Incentives and Subsidies
- 9.4 Imports, Exports and Trade Barriers
- 9.5 Public Procurement and Local Content Requirements
- 9.6 Environmental and Sustainability Compliance
- 9.7 Upcoming Policy Changes and Market Implications
Chapter 10 Global Glasses Free 3D Display Market Hotspots and Opportunities
- 10.1 Market Opportunity Mapping and Growth Hotspots
- 10.2 High-Growth Applications and Customer Groups
- 10.3 Underserved Markets and White-Space Opportunities
- 10.4 Emerging Technology and Product Opportunities
- 10.5 New Capacity and Investment Hotspots
- 10.6 Market Entry and Expansion Opportunities
- 10.7 Distribution and Partnership Opportunities
- 10.8 Near-Term and Long-Term Commercial Potential
- 10.9 Opportunity Attractiveness and Execution Risks
Chapter 11 Global Glasses Free 3D Display Market Outlook, 2025-2035
- 11.1 Market Size and Analysis
- 11.1.1 Revenue (Market Measurement: 2025: USD 1.72 billion → 2035: USD 7.79 billion)
- 11.1.2 Market Volume and Quantity Sold
- 11.1.3 Historical Market Size, 2018-2025
- 11.1.4 Base-Year Market Size, 2025
- 11.2 Market Forecast, 2025-2035
- 11.2.1 Revenue Forecast to 2035
- 11.2.2 Volume Forecast to 2035
- 11.2.3 CAGR and Year-on-Year Growth
- 11.2.4 Incremental Revenue Opportunity
- 11.3 Forecast Assumptions and Scenario Analysis
- 11.3.1 Base-Case Forecast
- 11.3.2 Optimistic and Conservative Scenarios
- 11.3.3 Technology, Pricing and Policy Sensitivities
- 11.4 Market Attractiveness and Growth Outlook
Chapter 12 Global Glasses Free 3D Display Market Segmentation and Outlook
- 12.1 Segmentation Summary and Market Shares, 2025
- 12.2 Largest and Fastest-Growing Segments
- 12.3 By Product Type - Market Size and Forecast, 2025-2035
- 12.3.1 Segment Definition and Scope
- 12.3.2 Historical Market Size, 2018-2025
- 12.3.3 Revenue Forecast, 2025-2035
- 12.3.4 Volume Forecast, 2025-2035
- 12.3.5 Base-Year Market Share, 2025
- 12.3.6 Segment CAGR and Growth Drivers
- 12.3.7 Subsegment Market Size and Forecast
- 12.3.7.1 Autostereoscopic Displays
- 12.3.7.2 Holographic Displays
- 12.3.7.3 Multi-View Displays
- 12.3.8 Subsegment Pricing and Adoption Trends
- 12.3.9 Leading Suppliers and Competition
- 12.3.10 Regional Demand and Opportunities
- 12.4 By Technology - Market Size and Forecast, 2025-2035
- 12.4.1 Segment Definition and Scope
- 12.4.2 Historical Market Size, 2018-2025
- 12.4.3 Revenue Forecast, 2025-2035
- 12.4.4 Volume Forecast, 2025-2035
- 12.4.5 Base-Year Market Share, 2025
- 12.4.6 Segment CAGR and Growth Drivers
- 12.4.7 Subsegment Market Size and Forecast
- 12.4.7.1 Lenticular Lens Technology
- 12.4.7.2 Parallax Barrier Technology
- 12.4.7.3 Light Field Technology
- 12.4.8 Subsegment Pricing and Adoption Trends
- 12.4.9 Leading Suppliers and Competition
- 12.4.10 Regional Demand and Opportunities
- 12.5 By End-User - Market Size and Forecast, 2025-2035
- 12.5.1 Segment Definition and Scope
- 12.5.2 Historical Market Size, 2018-2025
- 12.5.3 Revenue Forecast, 2025-2035
- 12.5.4 Volume Forecast, 2025-2035
- 12.5.5 Base-Year Market Share, 2025
- 12.5.6 Segment CAGR and Growth Drivers
- 12.5.7 Subsegment Market Size and Forecast
- 12.5.7.1 Entertainment and Gaming
- 12.5.7.2 Healthcare
- 12.5.7.3 Education
- 12.5.7.4 Retail and Advertising
- 12.5.7.5 Others
- 12.5.8 Subsegment Pricing and Adoption Trends
- 12.5.9 Leading Suppliers and Competition
- 12.5.10 Regional Demand and Opportunities
- 12.6 Segment Growth Comparison
- 12.7 Segment Attractiveness and Priority Matrix
Chapter 13 Global Glasses Free 3D Display End-Use and Application Market Outlook
- 13.1 End-Use Industry and Customer Demand Structure
- 13.2 Leading Applications and Customer Groups
- 13.3 End-Use Market Size, Share and Forecast
- 13.4 Major End-Use Industry Deep Dives
- 13.4.1 Customer Requirements and Use Cases
- 13.4.2 Demand and Replacement Cycles
- 13.4.3 Technical and Regulatory Considerations
- 13.4.4 Purchasing and Procurement Models
- 13.4.5 Leading Vendors and Distribution Channels
- 13.4.6 Forecast and Commercial Opportunities
- 13.5 Emerging Applications and Cross-Segment Demand
- 13.6 End-Use Industry Investment Priorities
Chapter 14 Global Glasses Free 3D Display Geographic Market Outlook, 2025-2035
- 14.1 Regional Market Size and Share, 2025
- 14.2 Regional Market Forecast, 2025-2035
- 14.3 Regional Pricing, Production and Demand Differences
- 14.4 North America
- 14.4.1 United States
- 14.4.2 Canada
- 14.4.3 Mexico
- 14.5 Europe
- 14.5.1 Germany
- 14.5.2 France
- 14.5.3 Italy
- 14.5.4 United Kingdom
- 14.5.5 Spain
- 14.5.6 Poland
- 14.5.7 Russia
- 14.5.8 Netherlands
- 14.5.9 Belgium
- 14.5.10 Sweden
- 14.5.11 Denmark
- 14.5.12 Norway
- 14.5.13 Rest of Europe
- 14.6 Asia Pacific
- 14.6.1 China
- 14.6.2 India
- 14.6.3 Japan
- 14.6.4 South Korea
- 14.6.5 Thailand
- 14.6.6 Indonesia
- 14.6.7 Vietnam
- 14.6.8 Malaysia
- 14.6.9 Australia
- 14.6.10 Rest of Asia Pacific
- 14.7 Latin America
- 14.7.1 Brazil
- 14.7.2 Argentina
- 14.7.3 Colombia
- 14.7.4 Chile
- 14.7.5 Rest of Latin America
- 14.8 Middle East
- 14.8.1 Saudi Arabia
- 14.8.2 United Arab Emirates
- 14.8.3 Turkey
- 14.8.4 Israel
- 14.8.5 Iran
- 14.8.6 Rest of the Middle East
- 14.9 Africa
- 14.9.1 South Africa
- 14.9.2 Egypt
- 14.9.3 Nigeria
- 14.9.4 Morocco
- 14.9.5 Rest of Africa
- 14.10 Regional Investment, Policy and Supply Chain Differences
- 14.11 Regional Competitive Landscape
- 14.12 Geographic Growth Hotspots
Chapter 15 Global Glasses Free 3D Display Technology, Innovation and Sustainability Outlook
- 15.1 Technology Landscape and Maturity
- 15.2 Product, Process and Service Innovation
- 15.3 AI, Automation and Digital Tools in the Industry
- 15.4 Technology Adoption and Performance Benchmarking
- 15.5 Innovation Pipeline and R&D Investment
- 15.6 Patent and Intellectual Property Trends
- 15.7 Energy Efficiency and Resource Management
- 15.8 Sustainability, Recycling and Circularity
- 15.9 Technology Roadmap, 2025-2035
- 15.10 Risks of Obsolescence and Technology Substitution
Chapter 16 Global Glasses Free 3D Display Market Key Strategic Imperatives
- 16.1 Growth and Market Entry Priorities
- 16.2 High-Return Products and Segments
- 16.3 Pricing, Profitability and Cost Optimization
- 16.4 Technology Investment and Product Differentiation
- 16.5 Supply Chain Localization and Resilience
- 16.6 Distribution and Customer Acquisition
- 16.7 Partnership, Acquisition and Capacity Strategy
- 16.8 Regional Expansion Priorities
- 16.9 Short-, Medium- and Long-Term Actions
Chapter 17 Competition Outlook
- 17.1 Industry Competition Characteristics
- 17.2 Market Structure and Concentration
- 17.3 Market Share and Competitive Positioning, 2025
- 17.4 Company-Wise Revenue and Product Benchmarking
- 17.5 Production and Service Capacity Benchmarking
- 17.6 Technology, Pricing and Differentiation
- 17.7 Regional Footprint and Distribution Strength
- 17.8 Mergers, Acquisitions and Strategic Alliances
- 17.9 New Entrants and Competitive Threats
- 17.10 Porter's Five Forces and Industry Attractiveness
- 17.11 Competitive Outlook, 2025-2035
Chapter 18 Company Profiles
- 18.1 Company Coverage and Selection Criteria
- 18.2 Samsung Electronics
- 18.2.1 Business Description
- 18.2.2 Company Ownership and Geographic Presence
- 18.2.3 Product and Service Portfolio
- 18.2.4 Manufacturing and Operating Footprint
- 18.2.5 Production Capacity and Expansion Plans
- 18.2.6 Financial Performance and Investment
- 18.2.7 Market Share and Competitive Position
- 18.2.8 Technology and Innovation Capabilities
- 18.2.9 Strategic Alliances or Partnerships
- 18.2.10 Recent Developments
- 18.2.11 Growth Strategy and Outlook
- 18.3 Leia Inc.
- 18.4 Sony Corporation
- 18.5 Acer Inc.
- 18.6 ASUSTeK Computer Inc.
- 18.7 HP Inc.
- 18.8 Looking Glass Factory
- 18.9 Barco NV
- 18.10 AUO Corporation
- 18.11 BOE Technology Group
- 18.12 ZTE Corporation (nubia)
- 18.13 Lenovo Group
- 18.14 Other Relevant Market Participants
Note: Every listed company is profiled on the structure shown under the first company. The company list is preliminary and may change based on research findings, market developments, data availability and client requirements.
Chapter 19 Disclaimer
- 19.1 Research and Forecast Disclaimer
- 19.2 Data Source and Estimation Limitations
Note: The depth of individual sections depends on data availability for this market. Volume, capacity, trade and other unit-based metrics are included where applicable.

