
Campuses and apartments reshape package handover
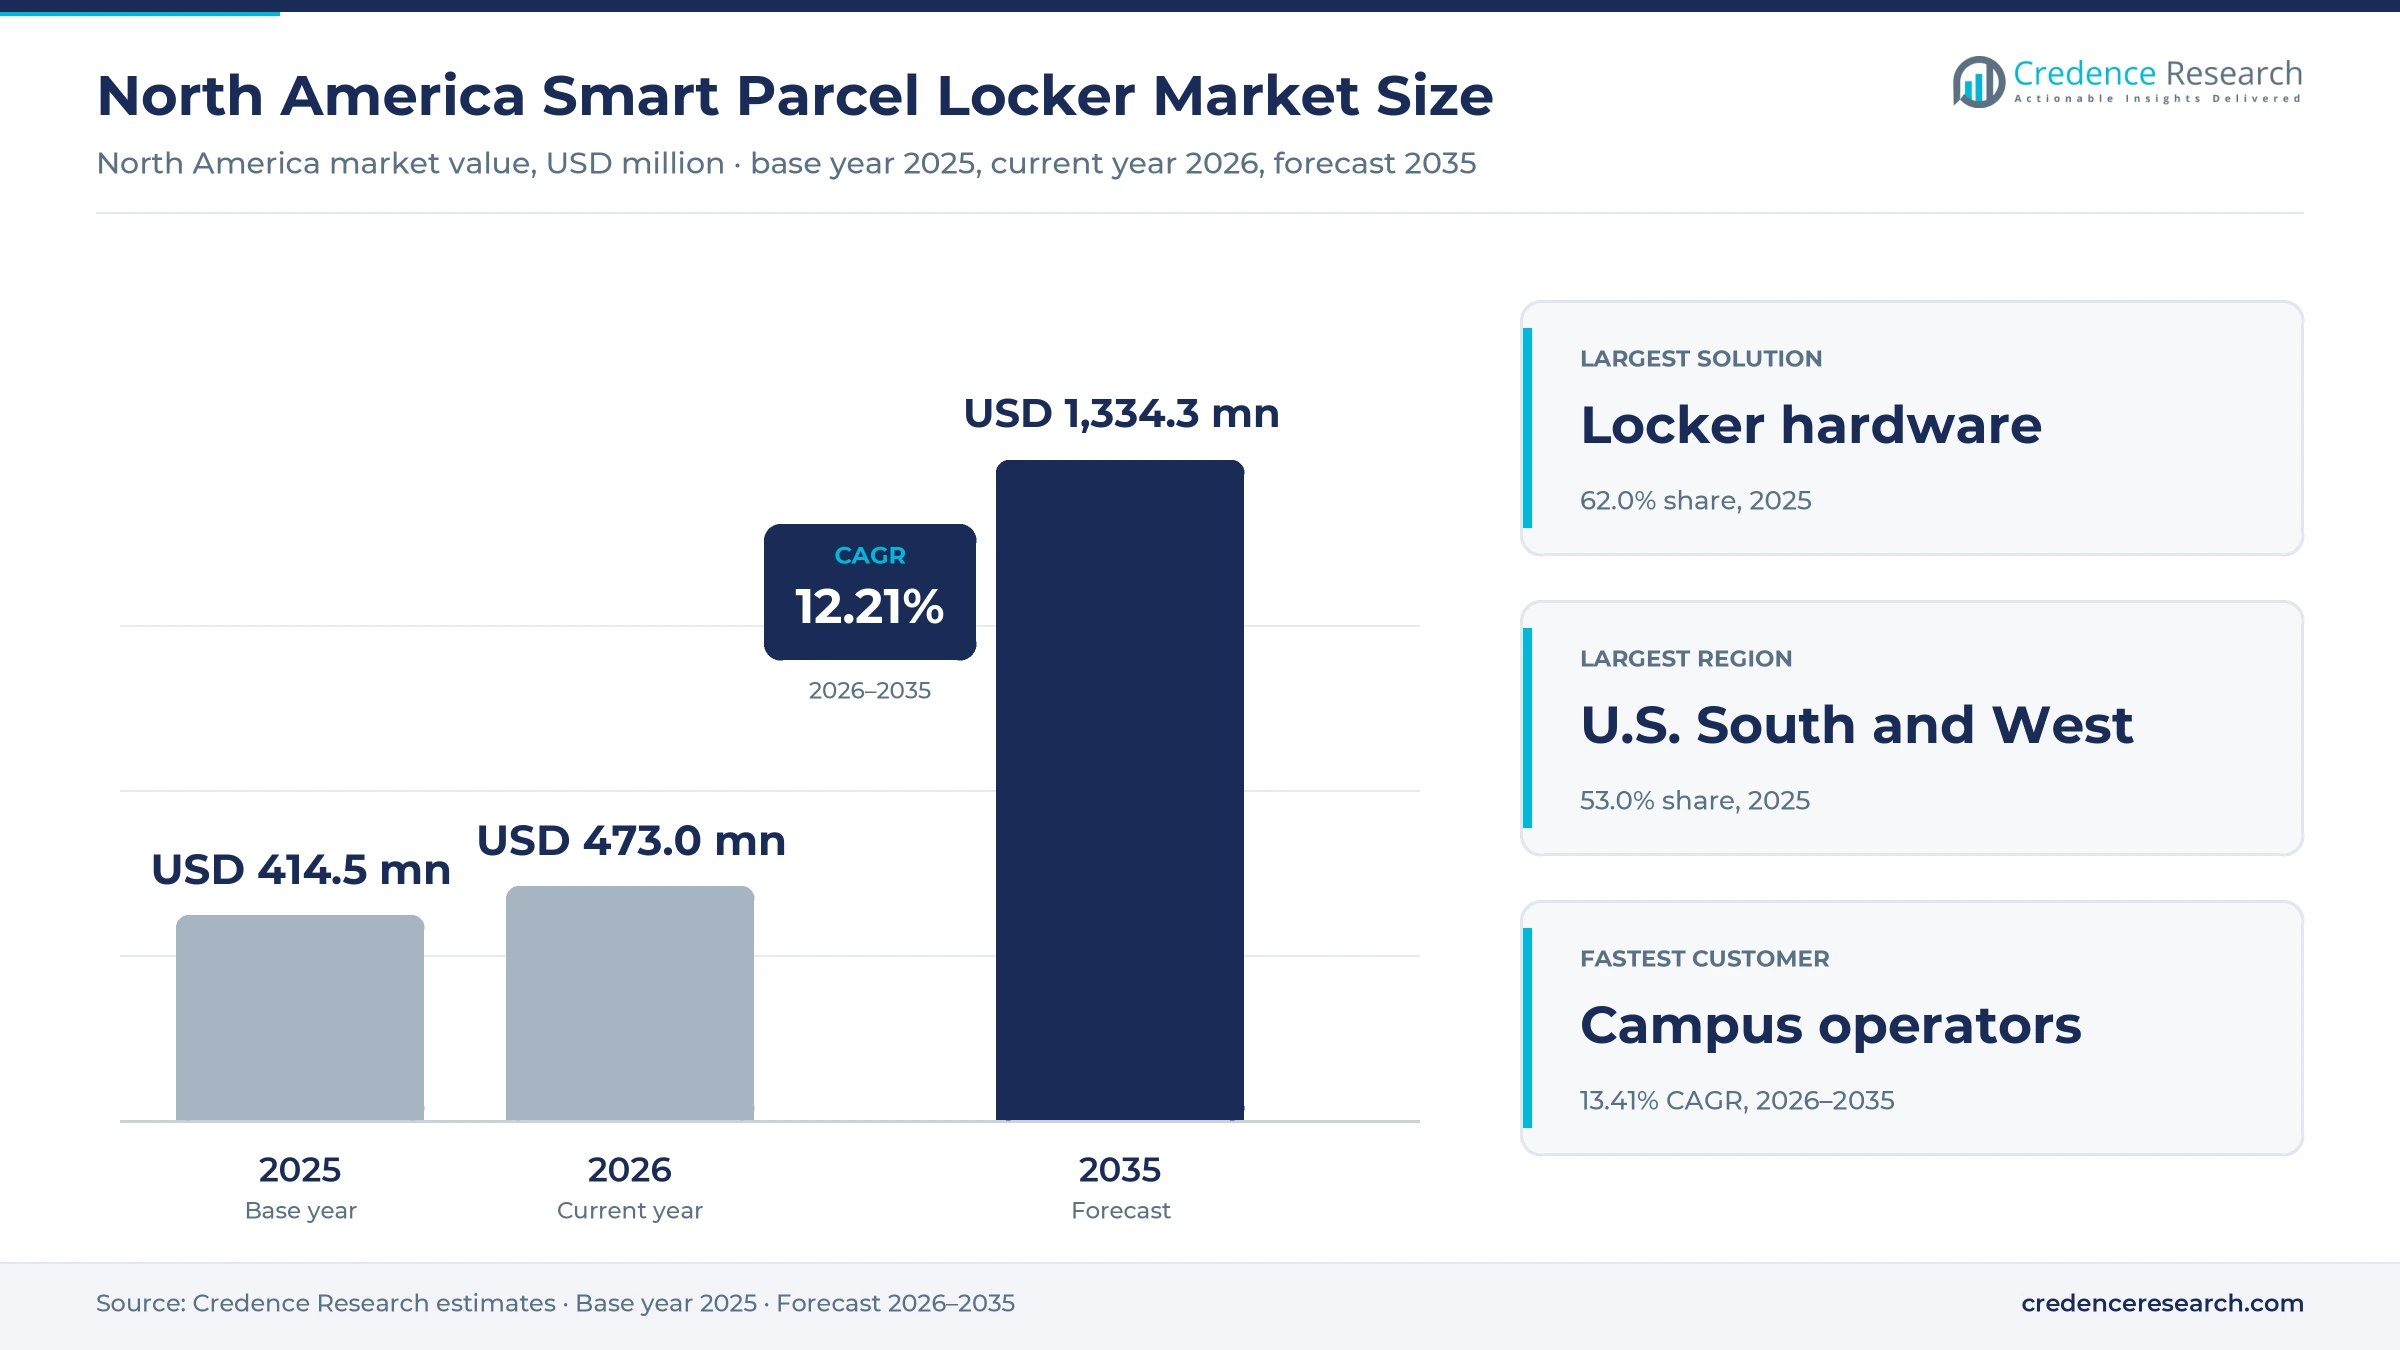
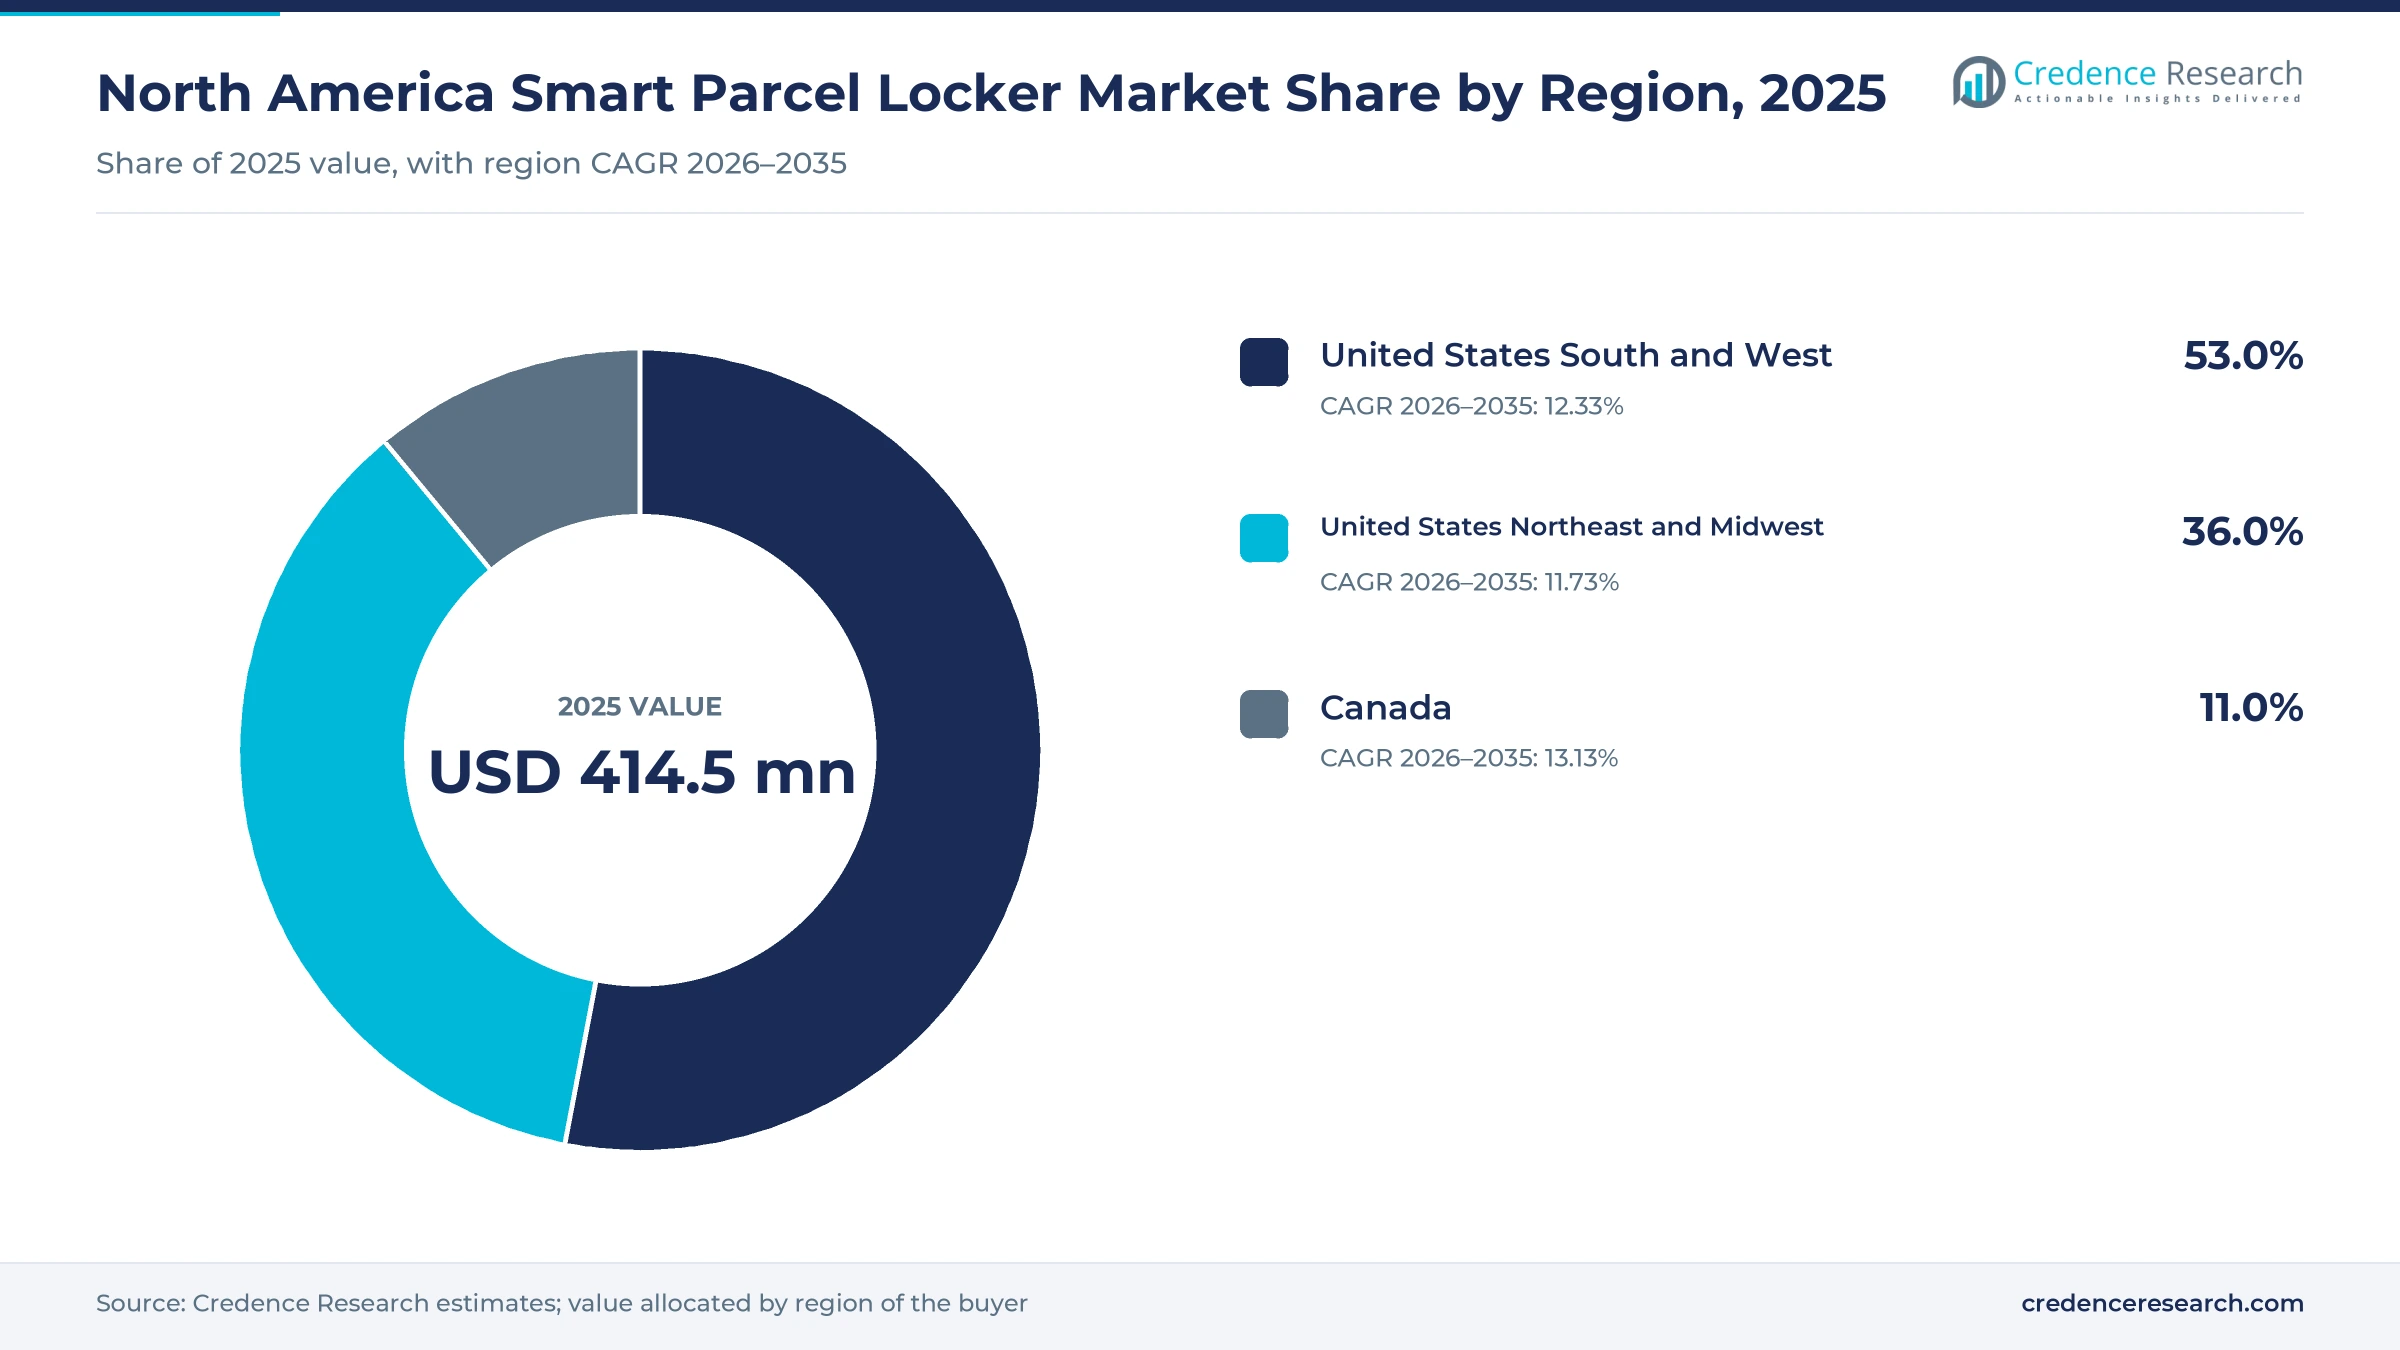
The North America smart parcel locker market was valued at USD 414.5 million in 2025 and is projected to increase from USD 473.0 million in 2026 to USD 1.33 billion by 2035, registering a CAGR of 12.21% during 2026–2035. Demand comes from apartment owners, university mail centers, retailers and carriers that need to release packages without staff at the door. The United States South and West held the largest share, 53.0% in 2025, because U.S. Census Bureau estimates show the South growing 6.0% between April 2020 and July 2025, about double the national rate. Canada is the fastest-growing region at 13.13% a year as Canada Post moves nearly four million door-to-door addresses toward community mailboxes, which pushes building owners and retailers to rethink parcel handover. A commercial change also sets the tone, because Amazon reported more than 25,000 U.S. locker locations in September 2026, which raises user familiarity while tightening competition for host sites.
What does the smart parcel locker market cover in North America?
The market counts electronic compartment lockers, robotic dispensing terminals and temperature-controlled units sold or leased to property, retail, campus and logistics operators, along with the management software and the installation and support services attached to them. Buyers usually purchase through direct enterprise sales, systems integrators or authorized resellers, and multi-year software and support plans often follow the hardware order.
The scope excludes carrier delivery fees, e-commerce shipping charges, plain mechanical mailboxes and the community mailboxes that postal operators install for addressed mail. The value chain runs from steel cabinet and electronics assembly through software platforms and installers to the operators that host the units on their sites.
North America Smart Parcel Locker Market Insights
- The market grows from USD 414.5 million in 2025 to USD 1.33 billion by 2035 at a 12.21% CAGR during 2026–2035, with software and campus accounts growing faster than the total.
- The United States South and West held 53.0% of 2025 value, ahead of the Northeast and Midwest, while Canada posts the fastest regional growth at 13.13% a year.
- Locker hardware held 62.0% of 2025 value because each new site starts with a cabinet order, and software revenue then follows on the installed units.
- Canada Post began its first community mailbox conversions in October 2026, a change that alters how nearly four million Canadian addresses receive parcels and opens a building-level alternative.
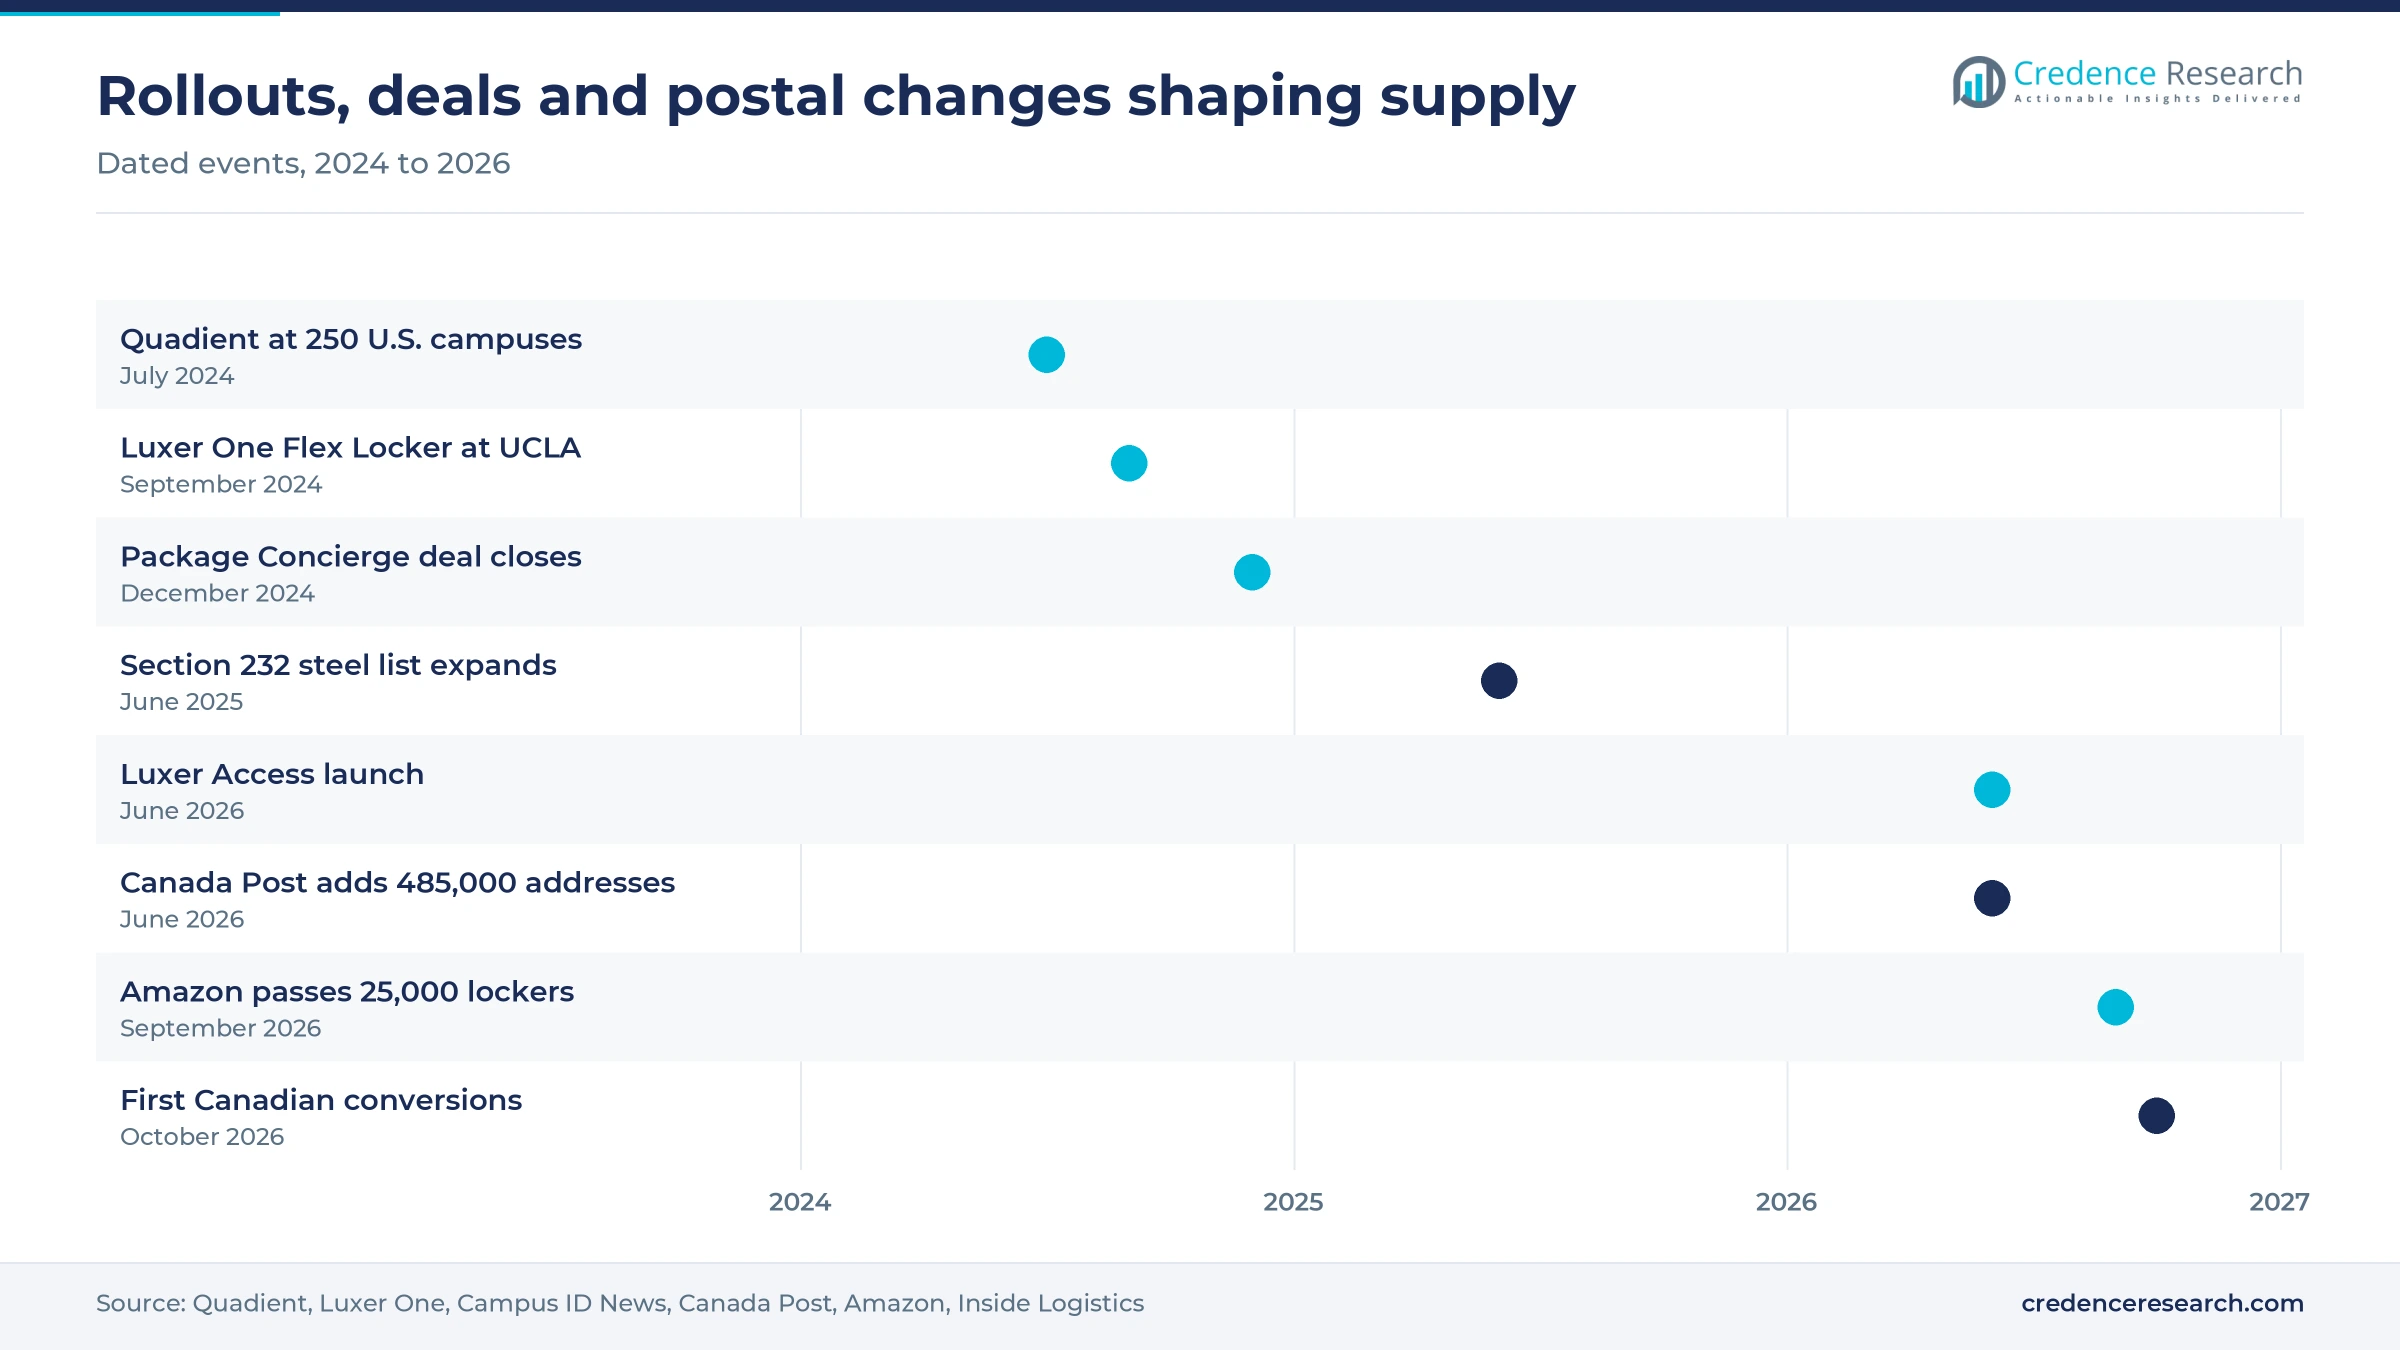
- Quadient closed its Package Concierge purchase on Dec. 17, 2024, adding about 3,000 units, which shows that buying an installed base has become a direct route to scale.
Hardware leads value as campus software demand climbs
Why does locker hardware lead while management software grows fastest?
Based on solution type, the market is categorized into locker hardware, management software and deployment and lifecycle services. Locker hardware led with 62.0% of 2025 value because every site begins with a physical order, and Quadient alone has set a target of 40,000 installed units worldwide by 2030 after reaching about 26,600 in the first half of 2025. Management software grows fastest at 13.71% a year as owners tie lockers to building systems, and Luxer One launched its Luxer Access platform at NAA Apartmentalize in June 2026 with property management software integrations central to the design.
Why does parcel delivery lead while retail order pickup climbs?
Based on application, the market is categorized into parcel delivery, retail order pickup and parcel returns. Parcel delivery led with 64.0% of 2025 value because inbound packages fill most compartments, and Quadient reported that total package volume across its higher education and multifamily clients rose 16% in the last three months of 2024. Retail order pickup grows fastest at 13.09% a year as retailers extend store fulfillment, since Lowe's said in September 2020 that more than 60% of its online orders were collected in stores. Parcel returns remain smaller, although Quadient's Parcel Pending unit now markets barcode-based drop-off lockers to retailers.
Why do property operators lead while campus operators grow fastest?
Based on customer type, the market is categorized into property operators, retail operators, campus operators and logistics operators. Property operators led with 46.0% of 2025 value because apartment communities install lockers building by building, and BriefGlance reported in June 2026 that Luxer One serves more than 12,000 properties. Campus operators grow fastest at 13.41% a year as package volume at universities outran other accounts, rising 23% in the last quarter of 2024 according to Quadient. That company now counts more than 300 colleges and universities among its locker customers, up from about 250 in July 2024.
Why do compartment lockers lead while chilled units grow fastest?
Based on technology, the market is categorized into electronic compartment lockers, robotic dispensing terminals and temperature-controlled lockers. Electronic compartment lockers led with 78.0% of 2025 value because they fit lobbies and mailrooms, and Canada Post counts nearly 22,000 lockers in apartment and condominium buildings. Temperature-controlled lockers grow fastest at 13.59% a year as food access programs join grocery buyers, with more than 40 North American college food pantries already using Quadient lockers and a refrigerated unit donated through Swipe Out Hunger. Robotic terminals stay specialized, although Bell and Howell's CleverFlex stores up to 2,500 packages.
| Segment Group | Leading Sub-segment | Share, 2025 | Fastest-growing Sub-segment | CAGR, 2026–2035 |
|---|---|---|---|---|
| By Solution Type | Locker hardware | 62.0% | Management software | 13.71% |
| By Application | Parcel delivery | 64.0% | Retail order pickup | 13.09% |
| By Customer Type | Property operators | 46.0% | Campus operators | 13.41% |
| By Technology | Electronic compartment lockers | 78.0% | Temperature-controlled lockers | 13.59% |
Request a Free Sample
Fill in your details and we'll send you a free sample report.
- Sample data tables & charts
- Research methodology
Campus volumes and theft risk push institutions to automate
Campus parcel intensity outruns mail center staffing
Campus mail centers now handle parcel volumes that counter staffing cannot absorb at peak, so universities are buying capacity instead of adding hours. Michigan State University residence halls received 368,000 packages in the last academic year, with fewer than 10 reported lost, according to The State News in October 2025. Wake Forest University, with about 9,000 students, saw its mail center handle roughly 19,000 packages a month at peak, according to a Pitney Bowes case study. National Student Clearinghouse data published in January 2026 put fall 2025 enrollment at 19.4 million, up 1% from a year earlier. Because enrollment grows far more slowly than package loads, campus operators grow at 13.41% a year on volume per student.
Secure institutional handover replaces open mailrooms
Institutions buy lockers because a logged, code-based release moves responsibility away from an unattended doorway or an overloaded front desk. A U.S. Postal Service report cited by The State News counted at least 58 million packages reported stolen nationwide over the prior year. A Harris Poll for Position Imaging, fielded in September 2024 among 2,076 adults, found 19% had experienced package theft at their current residence and 63% were more likely to order online with more secure delivery options. Local pressure is visible as well, since a Trowbridge Lofts resident near Michigan State signed an informal petition to change the mailroom system after a package was stolen. Pitney Bowes also reports that 76% of higher education respondents saw security concerns fully alleviated after adopting lockers.
Portfolio deployment standardization favors single platforms
Owners with many sites increasingly specify one platform across a portfolio, because a single vendor simplifies support, resident data and system integration. BriefGlance reported in June 2026 that Yardi and RealPage integrations are central to Luxer One's new platform and that the company has managed more than 560 million package deliveries. Retail shows the same logic at larger scale, since Quadient said in February 2023 that nearly 2,000 Lowe's stores in the United States and Canada hosted its installations. Consolidation reinforces the pattern, because Quadient closed its purchase of Package Concierge of Manhattan, Kansas, on Dec. 17, 2024, adding about 3,000 units serving residential, commercial, retail and campus customers. Property operators held 46.0% of 2025 value across the four customer groups.
Online retail growth keeps parcels flowing to shared sites
Online retail sets the baseline for locker demand, because every extra parcel adds pressure on shared buildings that lack receiving staff. U.S. Census Bureau data show e-commerce sales of $340.2 billion in the second quarter of 2026, up 12.2% from a year earlier and equal to 17.1% of retail sales. The Pitney Bowes Parcel Shipping Index, published June 30, 2025, counted about 22.37 billion U.S. parcels in 2024, up 3.4% from 2023. Those volumes move through last-mile delivery networks that favor consolidated drops, and Amazon said in September 2026 that customers are on track to collect more than 100 million packages from pickup locations this year.
Rented capacity and access platforms change the sale
Shift toward rented peak capacity on campuses
Buyers are starting to treat some capacity as a seasonal expense rather than a permanent purchase, which lowers the entry cost for sites with sharp delivery peaks. Campus ID News reported on Sept. 19, 2024, that Luxer One's Flex Locker program lets campuses and multifamily residences rent extra units on a 90-day plan with an option to extend. Delivery and installation take about eight weeks, and use can begin roughly 15 minutes after the units arrive. UCLA was rolling out the program for that fall term, while Luxer One lockers already stood at more than 200 on-campus locations. Luxer One described peak delivery season in December 2025 as running from October through December, the window such rentals target.
Rise of lockers inside wider building access platforms
Locker vendors are moving into broader building technology, because a single login for doors and packages is easier for owners to justify than separate tools. Luxer One launched Luxer Access in June 2026, drawing on the hardware and security base of its parent ASSA ABLOY, and BriefGlance reported that nearly 60% of renters prefer smartphone entry over keys. The move places lockers closer to electronic access control, where rivals such as ButterflyMX and Door.com already sell to the same apartment owners. Management software grows at 13.71% a year as a result. BriefGlance also cited support uptime of 99.9%, a measure that matters once package and door functions share one platform.
Canadian mailbox conversions open a building-level opportunity
Canada offers a clear opening because its postal reform changes how millions of households receive parcels at exactly the moment building owners review their options. Canada Post said on Oct. 22, 2026, that nearly four million door-to-door addresses will move to community mailboxes over the coming years, with the first conversions under way in Sept-Iles and Winnipeg. Inside Logistics reported on June 12, 2026, that about 485,000 more addresses would follow from 2027, including 158,000 in Ontario and 139,000 in Quebec. Retailers and property owners on those last-mile routes can offer lockers as a closer pickup point. Canada therefore remains the fastest-growing zone in the Credence Research regional model.
Campus food access creates an opening for refrigerated units
Food access programs give vendors a route into chilled lockers that does not depend on grocery chains, whose locker pilots date back to 2020. Quadient reports that more than 40 college and university food pantries in North America already use its lockers, and it has offered discounts to Swipe Out Hunger member campuses. Swipe Out Hunger has worked with more than 900 campuses, which indicates the size of the addressable base. Quadient also cites the 2023-2024 Hope Center survey, which found 41% of college students experienced food insecurity. Equipment is available, since Bell and Howell introduced its QuickCollect GL in January 2021 with temperature set per column. Temperature-controlled lockers therefore grow at 13.59% a year from a small base of sites.
Free retail networks and steel costs squeeze vendors
Free retailer networks compete for users and host sites
Amazon reported more than 25,000 U.S. locker locations in September 2026, including more than 750 on college campuses, and pickup carries no additional customer cost. That free offer weakens the case for a paid campus or apartment system, particularly at smaller sites with modest volume. Independent vendors therefore have to prove value on carrier-agnostic access and resident data, since Retail TouchPoints reported that Amazon holds packages for only three calendar days. Vendors that sell mail center integration are best placed to defend these accounts.
Steel tariffs raise cabinet and import costs
Locker cabinets rely heavily on steel, so trade policy feeds directly into hardware pricing for North American buyers and assemblers. GEODIS reported on June 13, 2025, that a 50% Section 232 rate applies to steel content on an expanded list of derivative goods from June 23, 2025, and although lockers were not among the eight categories added, steel input prices remain exposed. Assemblers buying imported steel face the most direct margin pressure from that rate. Vendors can limit the effect through regional final assembly and longer supplier contracts.
A softer apartment pipeline slows new-build specifications
New construction is a natural moment to specify lockers, so a weaker pipeline delays orders from property operators and their developers. The National Apartment Association reported in summer 2025 that build-to-rent units under construction fell 37.5% year over year to about 68,900, while about 39% of 69 CBRE-tracked markets showed negative annual rent growth. Owners under rent pressure tend to postpone amenity spending in that environment. Vendors therefore lean on retrofits, financing and rental programs to keep existing buildings buying during the slowdown.
Postal finances and mailboxes cloud Canadian demand
Canada Post reported a loss before tax of $482 million for the first half of 2026, which limits its capacity to fund large new locker programs on its own. Inside Logistics also reported that the conversion places mail and most parcels in locked compartments, so community mailboxes can substitute for private units in converted neighborhoods. Canadian vendors are affected most, because site timing depends on schedules still being finalized. Suppliers can reduce the exposure by focusing on condominium towers, campuses and retail sites outside the conversion program.
South and West lead while Canada grows fastest
| Region | Value, 2025 (USD million) | Share, 2025 | CAGR, 2026–2035 |
|---|---|---|---|
| United States South and West | 219.7 | 53.0% | 12.33% |
| United States Northeast and Midwest | 149.2 | 36.0% | 11.73% |
| Canada | 45.6 | 11.0% | 13.13% |
United States South and West lead on population growth
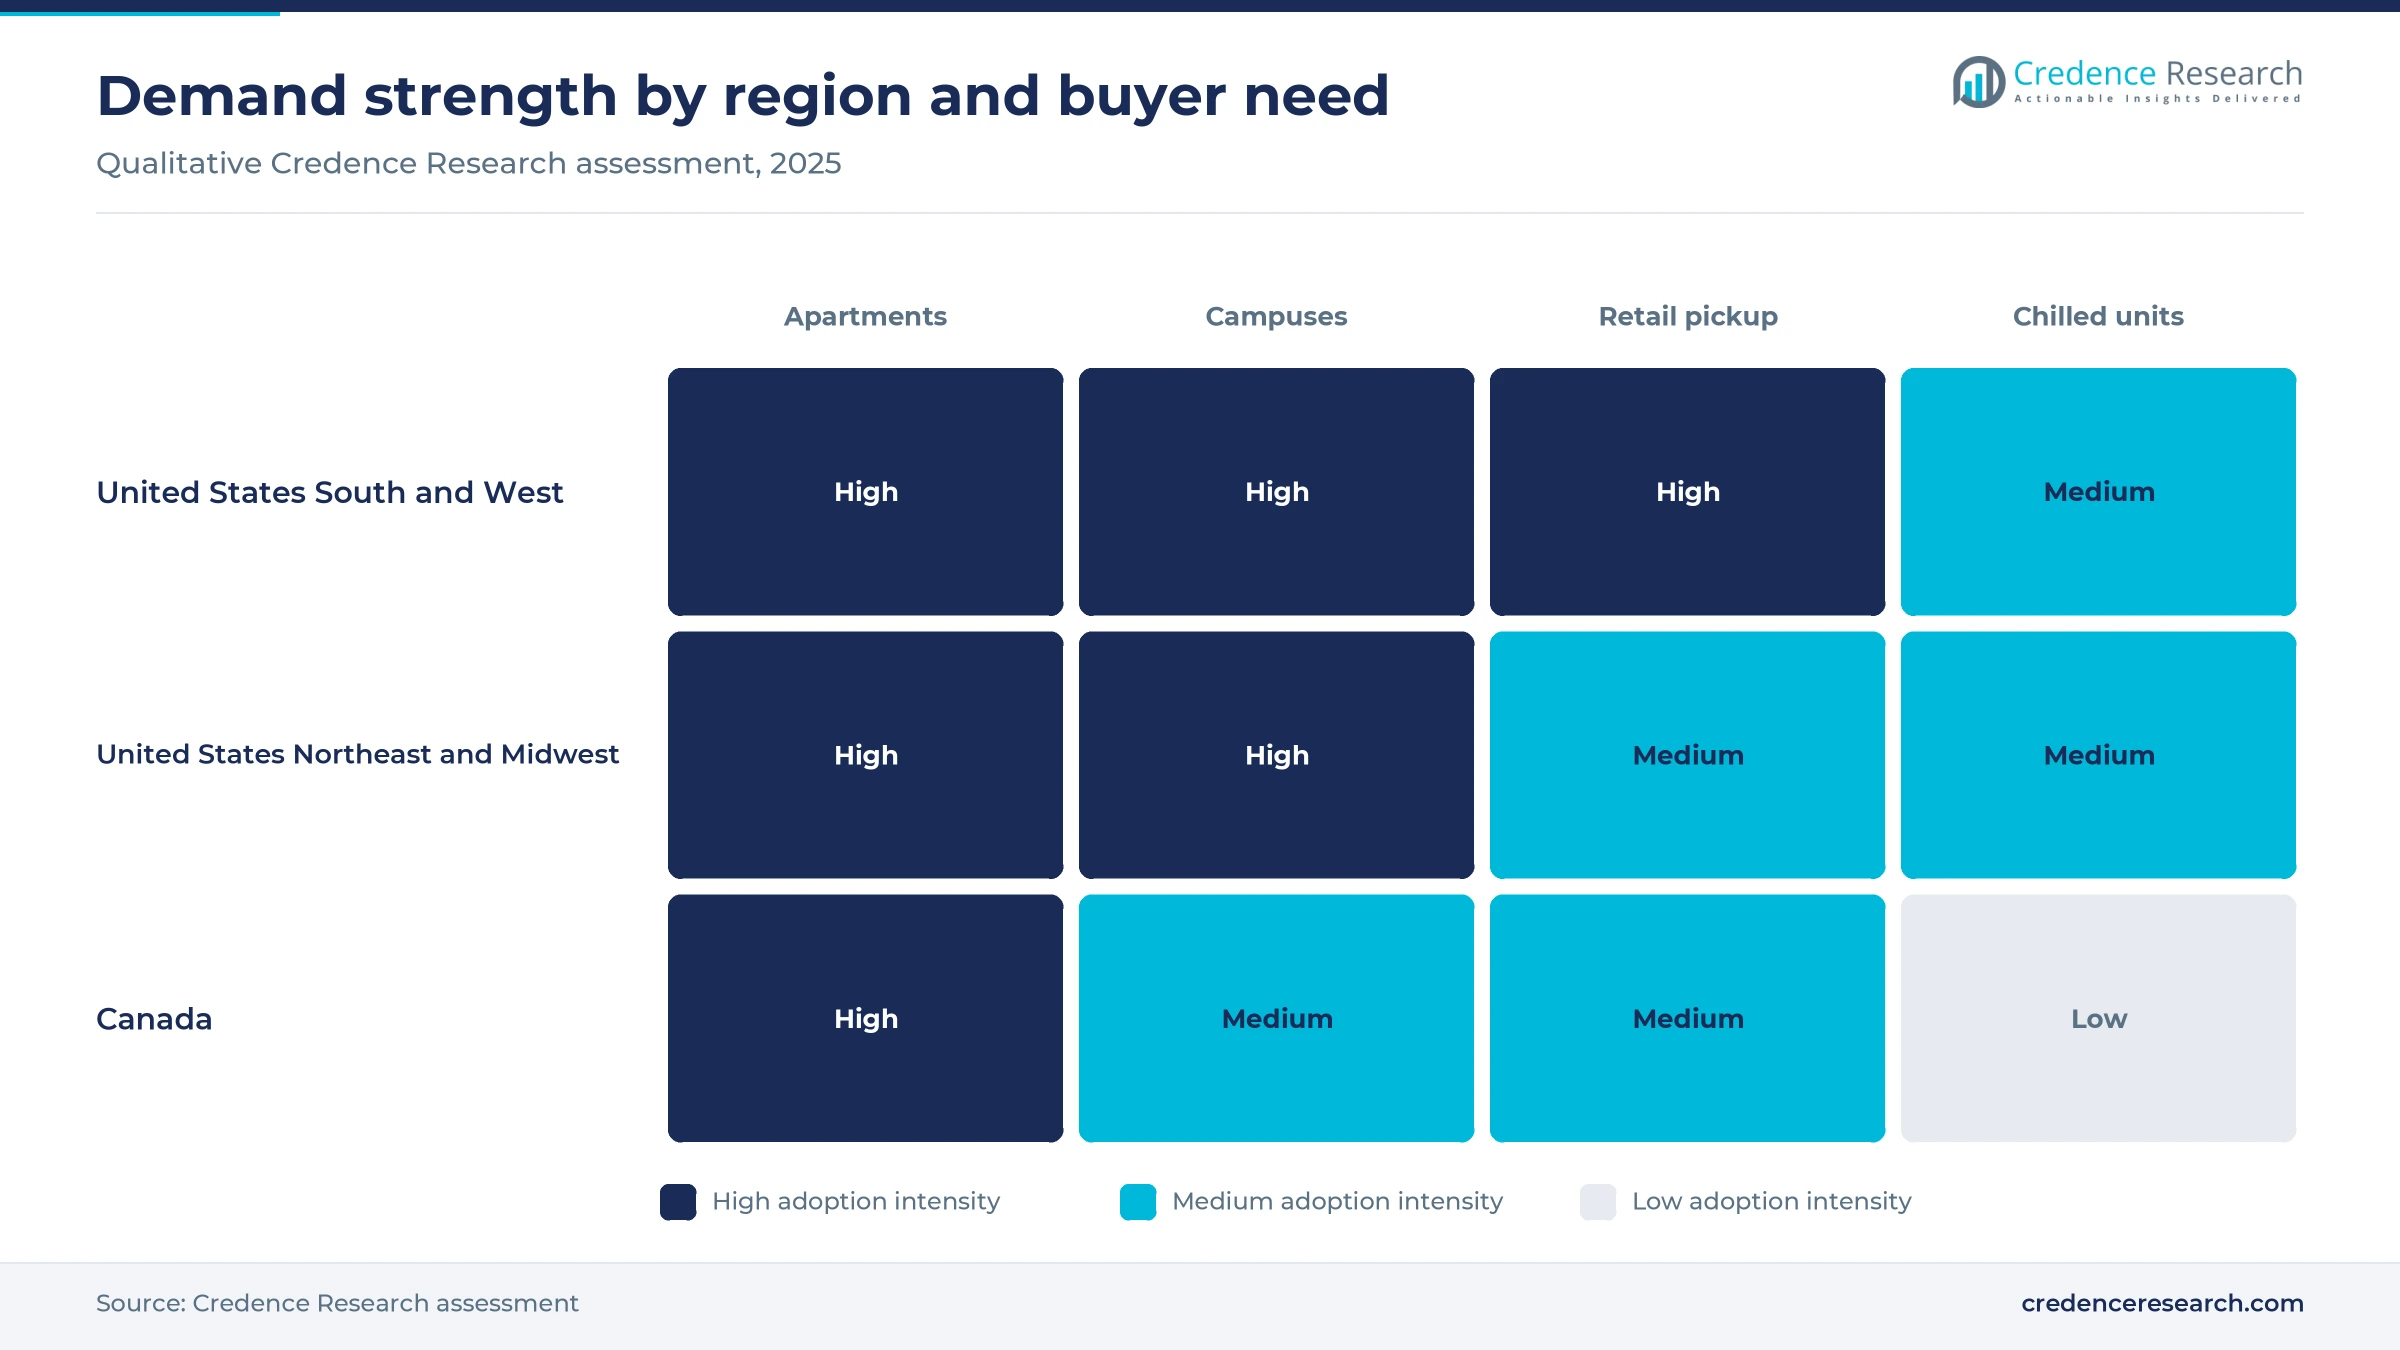
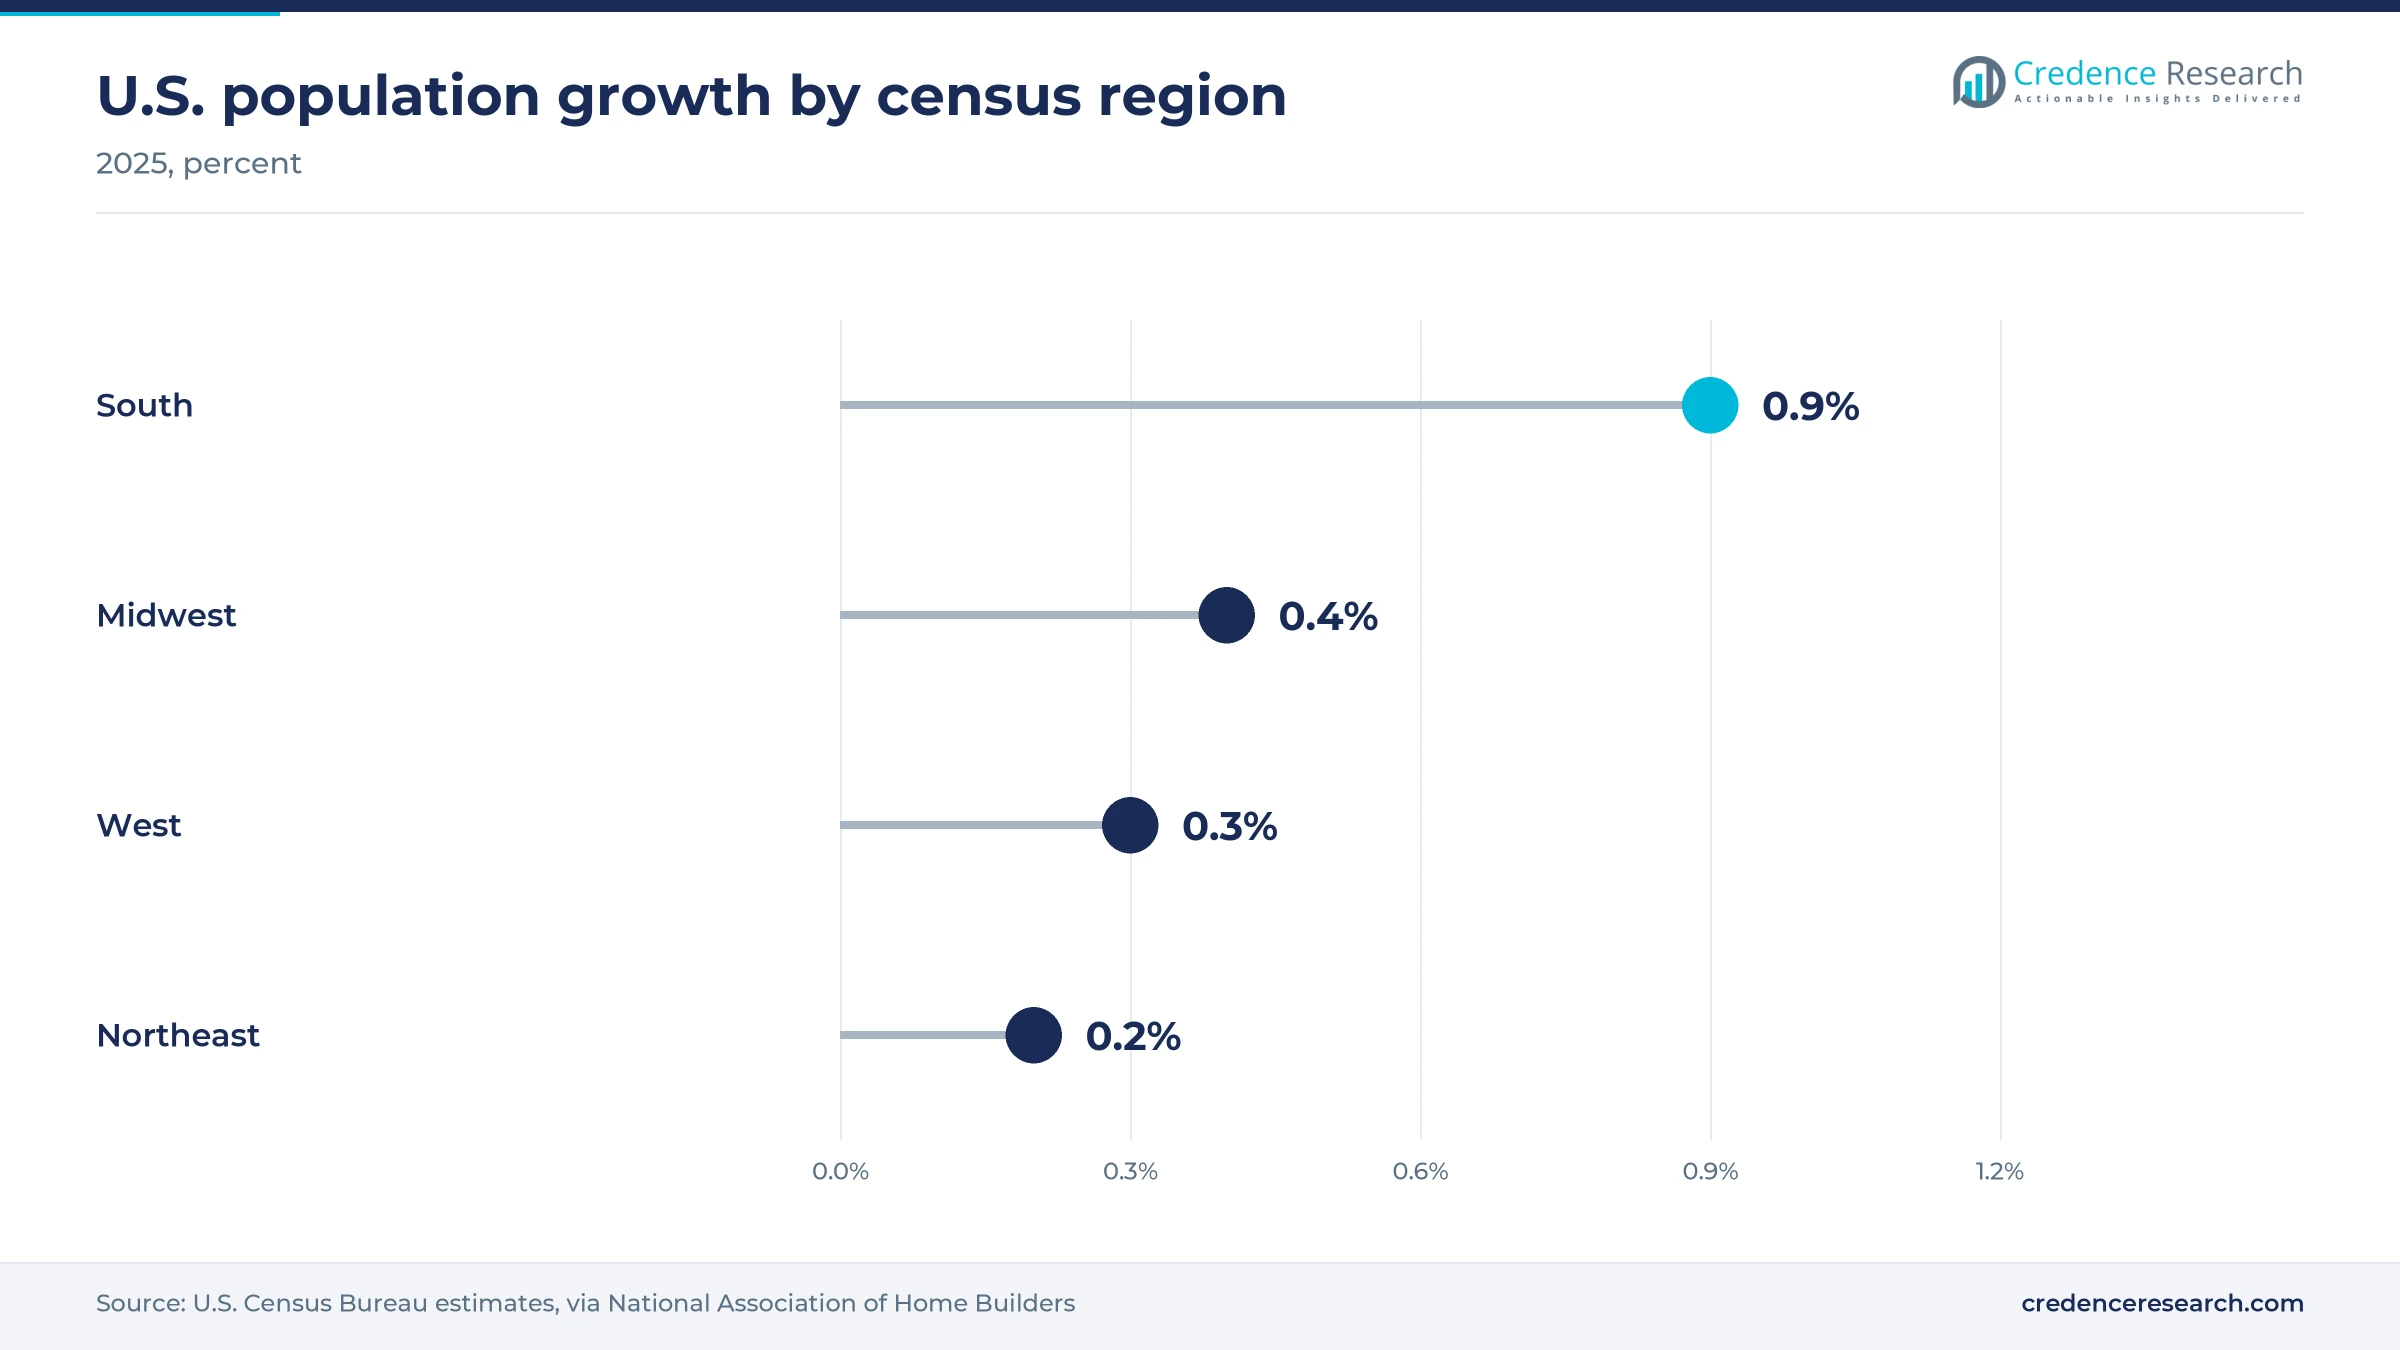
The United States South and West held 53.0% of 2025 value and grows at 12.33% a year. The Census Bureau's Vintage 2025 estimates show the South growing 6.0% from April 2020 to July 2025, with metro counties up 6.7%, which supports new apartment and campus sites. Named accounts reflect this geography, including the University of Alabama, University of Florida, University of Houston and Kennesaw State with Quadient, and UCLA and Oregon State with Luxer One.
United States Northeast and Midwest rely on dense retrofits
The United States Northeast and Midwest held 36.0% of 2025 value and grow at 11.73% a year, the slowest pace among the three zones. The National Association of Home Builders reported 2025 population growth of 0.2% in the Northeast and 0.4% in the Midwest, so older buildings and campuses matter more than new supply. Quadient gained a strong Northeast presence through Package Concierge, while Luxer One lockers serve Penn State, Rutgers and NYU.
Canada grows fastest as postal delivery changes
Canada held 11.0% of 2025 value and grows fastest at 13.13% a year, helped by a large installed base and postal reform. Canada Post serves more than 17.8 million addresses across the region, which frames parcel demand, and Inside Logistics reported that nearly three-quarters already receive mail through centralized systems. Campus demand is also visible in Ontario, where a Pitney Bowes case study shows Wilfrid Laurier University with 61 lockers in Waterloo and 30 in Brantford, and 94% of surveyed students reporting an extremely positive experience.
Acquisitions and rollouts mark a busy 2024 to 2026
| Development | Status and market relevance |
|---|---|
| In July 2024, Quadient said more than 250 U.S. higher education institutions had installed its lockers, serving more than 1.5 million students a year. | Live; the campus customer count has since passed 300 |
| In December 2024, Quadient closed its purchase of Package Concierge, adding about 3,000 units in the United States. | Completed; adds Northeast coverage and campus accounts |
| In December 2025, Luxer One reported more than 500 million locker deliveries processed and predicted wider retail pickup use in 2026. | Company outlook; the figure had passed 560 million by June 2026 |
| In June 2026, Luxer One launched its Luxer Access platform at NAA Apartmentalize in New Orleans. | Launched; extends the vendor from packages into building entry |
| In October 2026, Canada Post began its first community mailbox conversions in Sept-Iles and Winnipeg. | Under way; about 485,000 more addresses follow from 2027 |
Four technologies define how lockers handle packages
- Electronic compartment lockers release a door after a code or barcode scan, and Pitney Bowes offers ParcelPoint versions with delivery in four to ten weeks depending on the series.
- Robotic dispensing terminals retrieve packages internally for high-volume stores, and Cleveron launched a redesigned 403 model in 2025 that takes up less store space.
- Temperature-controlled lockers hold groceries and pantry orders, and Albertsons began testing such units at Jewel-Osco and Safeway stores in October 2020.
- Rental and oversized formats widen the use case beyond small boxes, much like self-service kiosks did for retail counters, as Quadient now sells single-door large compartments for furniture and building materials.
Need a Custom Version of This Report?
Tailor the scope, geography, or segments to your exact requirements.
- Custom geography or segment scope
- Direct access to our analyst team
Installed base and software ties decide vendor position
Parcel locker competition turns on installed base, software integration and the ability to serve multi-site accounts. Quadient, through its Parcel Pending brand, combines multifamily, campus and retail accounts and has used acquisition to add scale. Luxer One, a wholly owned subsidiary of ASSA ABLOY, concentrates on apartment communities and campuses and is extending into building access. Pitney Bowes sells through its mailing relationships, reaching universities, enterprises and government mail centers with ParcelPoint systems. Cleveron supplies robotic terminals built for store pickup, and its history with Walmart began with a U.S. pilot in 2016. Bell and Howell announced an exclusive North American agreement with Cleveron in March 2018 and also sells refrigerated grocery units. Amazon also competes indirectly through its own free consumer locker network. Vendors therefore defend accounts on carrier-agnostic access, property system links and service coverage rather than cabinet price alone.
Companies profiled and their roles in this market
| Company | Type | Role in the market |
|---|---|---|
| Quadient | Locker vendor | Sells Parcel Pending systems to multifamily, campus and retail accounts across the United States and Canada |
| Luxer One | Locker vendor | ASSA ABLOY subsidiary serving apartment communities and university campuses, with Flex Locker rentals |
| Pitney Bowes | Mailing and locker supplier | Supplies lockers to universities such as Wake Forest and Wilfrid Laurier and to enterprise mail centers |
| Cleveron | Robotic terminal maker | Estonian maker of robotic terminals, with a Walmart pilot in the United States from 2016 |
| Bell and Howell | Systems integrator and supplier | Offers QuickCollect GL refrigerated lockers and CleverFlex terminals for North American retailers, announced in 2018 |
Campus and portfolio accounts hold the best margins
Credence Research's view is that the best returns sit with campus and multi-site property accounts, where lockers become part of daily operations and software renewals follow. Campus demand rose 23% in Quadient's locker volumes in late 2024, which shows that usage can outrun the installed base and supports expansion orders. The largest risk is free consumer networks at small sites, so vendors should avoid competing on price there. Canada deserves early attention, since postal conversions will prompt building owners to review parcel handling, although the timing remains uncertain until Canada Post finalizes its schedules.
How Credence Research built this regional estimate
The report uses 2025 as the base year and 2026 to 2035 as the forecast period. Market values come from the Credence Research model, and regional and segment splits are Credence Research estimates informed by population, enrollment, parcel and installed-base data. Sources include U.S. Census Bureau statistics, Canada Post reports, company releases and case studies, and trade press named in the text. No interviews or surveys were conducted for this edition, and figures from third-party polls are attributed where used.
Software and Canada carry growth through 2035
The parcel locker market reaches USD 1.33 billion by 2035, and the mix should tilt gradually toward software, services and campus accounts as the installed base matures. Hardware remains the largest segment through 2035 because replacement and expansion orders continue, but recurring platform fees should provide a steadier base for vendors. Canada gains share as postal conversions proceed through 2027 and beyond, while the South and West keep their lead on population growth. Refrigerated units remain a small base with visible upside, provided food access and grocery pilots turn into repeat orders.
Frequently Asked Questions
How big is the North America smart parcel locker market?
Which region leads this market?
Which region grows fastest?
Which solution type holds the largest share?
Why are campuses buying more lockers?
Which companies compete in this market?
What is the main challenge for vendors?
Which technology grows fastest?
Table of Content
Chapter 1 Market Segmentation
- 1.1 Segmentation Framework
- 1.1.1 Product and Service Classification
- 1.1.2 Application and End-Use Classification
- 1.1.3 Technology and Solution Classification
- 1.1.4 Customer and Distribution Channel Classification
- 1.1.5 Geographic Segmentation
- 1.1.6 Market Segment Definitions and Boundaries
- 1.2 By Solution Type
- 1.2.1 Locker hardware
- 1.2.2 Management software
- 1.2.3 Deployment and lifecycle services
- 1.3 By Application
- 1.3.1 Parcel delivery
- 1.3.2 Retail order pickup
- 1.3.3 Parcel returns
- 1.4 By Customer Type
- 1.4.1 Property operators
- 1.4.2 Retail operators
- 1.4.3 Campus operators
- 1.4.4 Logistics operators
- 1.5 By Technology
- 1.5.1 Electronic compartment lockers
- 1.5.2 Robotic dispensing terminals
- 1.5.3 Temperature-controlled lockers
Chapter 2 Introduction
- 2.1 Report Objectives and Scope
- 2.2 Product Definition and Industry Terminology
- 2.3 Market Inclusions and Exclusions
- 2.4 Research Process
- 2.4.1 Primary Research and Expert Interviews
- 2.4.2 Secondary Research and Source Review
- 2.4.3 Top-Down and Bottom-Up Estimation
- 2.4.4 Data Triangulation and Verification
- 2.5 Market Size Measurement Basis
- 2.5.1 2025: USD 414.5 million → 2035: USD 1.33 billion
- 2.6 Historical and Forecast Reference Periods
- 2.6.1 Historical Period: 2018-2025
- 2.6.2 Base Year: 2025
- 2.6.3 Forecast Period: 2025-2035
- 2.7 Research Assumptions and Limitations
Chapter 3 Executive Summary
- 3.1 Market Snapshot and Key Findings
- 3.2 Base-Year Market Size, 2025
- 3.3 Forecast Market Size, 2035
- 3.4 Revenue and Volume Growth Outlook
- 3.5 Key Demand and Supply Indicators
- 3.6 Leading Market Segments
- 3.7 Fastest-Growing Market Opportunities
- 3.8 Regional Performance Highlights
- 3.9 Technology and Industry Transformation
- 3.10 Competitive Landscape Summary
- 3.11 Analyst View and Strategic Implications
Chapter 4 North America Smart Parcel Locker Market Trends and Developments
- 4.1 Historical Industry Development, 2018-2025
- 4.2 Recent Market Trends and Developments
- 4.3 Demand and Customer Behavior Trends
- 4.4 Technology and Product Innovation
- 4.5 Artificial Intelligence, Automation and Digitalization
- 4.6 Local Manufacturing and Supply Chain Realignment
- 4.7 Industry Partnerships, Mergers and Acquisitions
- 4.8 Sustainability and Circular Economy Developments
- 4.9 Government and Private Sector Investment Trends
- 4.10 Emerging Business Models and Commercialization
- 4.11 Industry Developments and Announcements
Chapter 5 North America Smart Parcel Locker Market Production, Supply and Demand Analysis
- 5.1 Demand Trend and Consumption Analysis, 2018-2025
- 5.2 Demand Forecast, 2025-2035
- 5.3 Production and Output Trend, 2018-2025
- 5.4 Production and Output Forecast, 2025-2035
- 5.5 Installed Capacity and Capacity Utilization
- 5.6 Company-Wise Production Plants and Statistics
- 5.6.1 Installed Production Capacity
- 5.6.2 Actual Production
- 5.6.3 Planned Capacity and Expansion Targets
- 5.7 Supply Chain Structure and Procurement Trends
- 5.8 Supply-Demand Gap and Bottlenecks
- 5.9 Import Dependence and Sourcing Structure
- 5.10 Contract Manufacturing and Outsourcing
- 5.11 Regional Supply and Demand Concentration
Chapter 6 North America Smart Parcel Locker Market Pricing Analysis
- 6.1 Pricing Structure and Measurement
- 6.2 Historical Pricing Trends, 2018-2025
- 6.3 Pricing Outlook, 2025-2035
- 6.4 Average Selling Price and Unit Economics
- 6.5 Pricing by Product and Market Segment
- 6.6 Geographic Pricing Differences
- 6.7 Key Input, Energy, Labor and Logistics Costs
- 6.8 Contract Pricing and Purchasing Models
- 6.9 Pricing Sensitivity and Competitive Positioning
- 6.10 Price, Margin and Profitability Implications
Chapter 7 North America Smart Parcel Locker Market Dynamics
- 7.1 Market Growth Drivers
- 7.1.1 Demand-Side Drivers
- 7.1.2 Technology and Innovation Drivers
- 7.1.3 Infrastructure and Investment Drivers
- 7.1.4 Regulatory and Policy Drivers
- 7.2 Market Restraints
- 7.2.1 Cost and Affordability Constraints
- 7.2.2 Technology and Adoption Barriers
- 7.2.3 Supply Chain and Operational Constraints
- 7.3 Market Challenges
- 7.3.1 Competitive Pressure and Margin Erosion
- 7.3.2 Skills, Infrastructure and Implementation Gaps
- 7.4 Emerging Market Opportunities
- 7.5 Market Dynamics Impact and Time-Horizon Assessment
Chapter 8 North America Smart Parcel Locker Value Chain Analysis
- 8.1 Industry Value Chain Overview
- 8.2 Upstream Suppliers and Critical Inputs
- 8.3 Technology and Component Providers
- 8.4 Manufacturing or Service Delivery
- 8.5 Distribution, Channel Partners and Integrators
- 8.6 Downstream Applications and End Users
- 8.7 Value Addition and Profit Pools
- 8.8 Vertical Integration and Outsourcing
- 8.9 Supplier Concentration and Risk
- 8.10 Supply Chain Localization and Resilience
Chapter 9 North America Smart Parcel Locker Market Regulations and Policies
- 9.1 Relevant Laws, Standards and Compliance Frameworks
- 9.2 Product, Service, Safety and Quality Requirements
- 9.3 Government Policies, Incentives and Subsidies
- 9.4 Imports, Exports and Trade Barriers
- 9.5 Public Procurement and Local Content Requirements
- 9.6 Environmental and Sustainability Compliance
- 9.7 Upcoming Policy Changes and Market Implications
Chapter 10 North America Smart Parcel Locker Market Hotspots and Opportunities
- 10.1 Market Opportunity Mapping and Growth Hotspots
- 10.2 High-Growth Applications and Customer Groups
- 10.3 Underserved Markets and White-Space Opportunities
- 10.4 Emerging Technology and Product Opportunities
- 10.5 New Capacity and Investment Hotspots
- 10.6 Market Entry and Expansion Opportunities
- 10.7 Distribution and Partnership Opportunities
- 10.8 Near-Term and Long-Term Commercial Potential
- 10.9 Opportunity Attractiveness and Execution Risks
Chapter 11 North America Smart Parcel Locker Market Outlook, 2025-2035
- 11.1 Market Size and Analysis
- 11.1.1 Revenue (Market Measurement: 2025: USD 414.5 million → 2035: USD 1.33 billion)
- 11.1.2 Market Volume and Quantity Sold
- 11.1.3 Historical Market Size, 2018-2025
- 11.1.4 Base-Year Market Size, 2025
- 11.2 Market Forecast, 2025-2035
- 11.2.1 Revenue Forecast to 2035
- 11.2.2 Volume Forecast to 2035
- 11.2.3 CAGR and Year-on-Year Growth
- 11.2.4 Incremental Revenue Opportunity
- 11.3 Forecast Assumptions and Scenario Analysis
- 11.3.1 Base-Case Forecast
- 11.3.2 Optimistic and Conservative Scenarios
- 11.3.3 Technology, Pricing and Policy Sensitivities
- 11.4 Market Attractiveness and Growth Outlook
Chapter 12 North America Smart Parcel Locker Market Segmentation and Outlook
- 12.1 Segmentation Summary and Market Shares, 2025
- 12.2 Largest and Fastest-Growing Segments
- 12.3 By Solution Type - Market Size and Forecast, 2025-2035
- 12.3.1 Segment Definition and Scope
- 12.3.2 Historical Market Size, 2018-2025
- 12.3.3 Revenue Forecast, 2025-2035
- 12.3.4 Volume Forecast, 2025-2035
- 12.3.5 Base-Year Market Share, 2025
- 12.3.6 Segment CAGR and Growth Drivers
- 12.3.7 Subsegment Market Size and Forecast
- 12.3.7.1 Locker hardware
- 12.3.7.2 Management software
- 12.3.7.3 Deployment and lifecycle services
- 12.3.8 Subsegment Pricing and Adoption Trends
- 12.3.9 Leading Suppliers and Competition
- 12.3.10 Regional Demand and Opportunities
- 12.4 By Application - Market Size and Forecast, 2025-2035
- 12.4.1 Segment Definition and Scope
- 12.4.2 Historical Market Size, 2018-2025
- 12.4.3 Revenue Forecast, 2025-2035
- 12.4.4 Volume Forecast, 2025-2035
- 12.4.5 Base-Year Market Share, 2025
- 12.4.6 Segment CAGR and Growth Drivers
- 12.4.7 Subsegment Market Size and Forecast
- 12.4.7.1 Parcel delivery
- 12.4.7.2 Retail order pickup
- 12.4.7.3 Parcel returns
- 12.4.8 Subsegment Pricing and Adoption Trends
- 12.4.9 Leading Suppliers and Competition
- 12.4.10 Regional Demand and Opportunities
- 12.5 By Customer Type - Market Size and Forecast, 2025-2035
- 12.5.1 Segment Definition and Scope
- 12.5.2 Historical Market Size, 2018-2025
- 12.5.3 Revenue Forecast, 2025-2035
- 12.5.4 Volume Forecast, 2025-2035
- 12.5.5 Base-Year Market Share, 2025
- 12.5.6 Segment CAGR and Growth Drivers
- 12.5.7 Subsegment Market Size and Forecast
- 12.5.7.1 Property operators
- 12.5.7.2 Retail operators
- 12.5.7.3 Campus operators
- 12.5.7.4 Logistics operators
- 12.5.8 Subsegment Pricing and Adoption Trends
- 12.5.9 Leading Suppliers and Competition
- 12.5.10 Regional Demand and Opportunities
- 12.6 By Technology - Market Size and Forecast, 2025-2035
- 12.6.1 Segment Definition and Scope
- 12.6.2 Historical Market Size, 2018-2025
- 12.6.3 Revenue Forecast, 2025-2035
- 12.6.4 Volume Forecast, 2025-2035
- 12.6.5 Base-Year Market Share, 2025
- 12.6.6 Segment CAGR and Growth Drivers
- 12.6.7 Subsegment Market Size and Forecast
- 12.6.7.1 Electronic compartment lockers
- 12.6.7.2 Robotic dispensing terminals
- 12.6.7.3 Temperature-controlled lockers
- 12.6.8 Subsegment Pricing and Adoption Trends
- 12.6.9 Leading Suppliers and Competition
- 12.6.10 Regional Demand and Opportunities
- 12.7 Segment Growth Comparison
- 12.8 Segment Attractiveness and Priority Matrix
Chapter 13 North America Smart Parcel Locker End-Use and Application Market Outlook
- 13.1 End-Use Industry and Customer Demand Structure
- 13.2 Leading Applications and Customer Groups
- 13.3 End-Use Market Size, Share and Forecast
- 13.4 Major End-Use Industry Deep Dives
- 13.4.1 Customer Requirements and Use Cases
- 13.4.2 Demand and Replacement Cycles
- 13.4.3 Technical and Regulatory Considerations
- 13.4.4 Purchasing and Procurement Models
- 13.4.5 Leading Vendors and Distribution Channels
- 13.4.6 Forecast and Commercial Opportunities
- 13.5 Emerging Applications and Cross-Segment Demand
- 13.6 End-Use Industry Investment Priorities
Chapter 14 North America Smart Parcel Locker Geographic Market Outlook, 2025-2035
- 14.1 Regional Market Size and Country-Level Shares, 2025
- 14.2 Country Market Size Comparison, 2025
- 14.3 Country Market Forecasts, 2025-2035
- 14.4 Subregional Industrial and Demand Clusters
- 14.5 Intra-Regional Pricing and Cost Differences
- 14.6 Cross-Border Trade and Supply Networks
- 14.7 Regional Supply and Demand Balances
- 14.8 Country Opportunity Comparison and Prioritization
Note: Every listed country is covered on the structure shown under the first country.
Chapter 15 North America Smart Parcel Locker Technology, Innovation and Sustainability Outlook
- 15.1 Technology Landscape and Maturity
- 15.2 Product, Process and Service Innovation
- 15.3 AI, Automation and Digital Tools in the Industry
- 15.4 Technology Adoption and Performance Benchmarking
- 15.5 Innovation Pipeline and R&D Investment
- 15.6 Patent and Intellectual Property Trends
- 15.7 Energy Efficiency and Resource Management
- 15.8 Sustainability, Recycling and Circularity
- 15.9 Technology Roadmap, 2025-2035
- 15.10 Risks of Obsolescence and Technology Substitution
Chapter 16 North America Smart Parcel Locker Market Key Strategic Imperatives
- 16.1 Growth and Market Entry Priorities
- 16.2 High-Return Products and Segments
- 16.3 Pricing, Profitability and Cost Optimization
- 16.4 Technology Investment and Product Differentiation
- 16.5 Supply Chain Localization and Resilience
- 16.6 Distribution and Customer Acquisition
- 16.7 Partnership, Acquisition and Capacity Strategy
- 16.8 Regional Expansion Priorities
- 16.9 Short-, Medium- and Long-Term Actions
Chapter 17 Competition Outlook
- 17.1 Industry Competition Characteristics
- 17.2 Market Structure and Concentration
- 17.3 Market Share and Competitive Positioning, 2025
- 17.4 Company-Wise Revenue and Product Benchmarking
- 17.5 Production and Service Capacity Benchmarking
- 17.6 Technology, Pricing and Differentiation
- 17.7 Regional Footprint and Distribution Strength
- 17.8 Mergers, Acquisitions and Strategic Alliances
- 17.9 New Entrants and Competitive Threats
- 17.10 Porter's Five Forces and Industry Attractiveness
- 17.11 Competitive Outlook, 2025-2035
Chapter 18 Company Profiles
- 18.1 Company Coverage and Selection Criteria
- 18.2 Quadient
- 18.2.1 Business Description
- 18.2.2 Company Ownership and Geographic Presence
- 18.2.3 Product and Service Portfolio
- 18.2.4 Manufacturing and Operating Footprint
- 18.2.5 Production Capacity and Expansion Plans
- 18.2.6 Financial Performance and Investment
- 18.2.7 Market Share and Competitive Position
- 18.2.8 Technology and Innovation Capabilities
- 18.2.9 Strategic Alliances or Partnerships
- 18.2.10 Recent Developments
- 18.2.11 Growth Strategy and Outlook
- 18.3 Cleveron
- 18.4 Pitney Bowes
- 18.5 Luxer One
- 18.6 Bell and Howell
- 18.7 Other Relevant Market Participants
Note: Every listed company is profiled on the structure shown under the first company. The company list is preliminary and may change based on research findings, market developments, data availability and client requirements.
Chapter 19 Disclaimer
- 19.1 Research and Forecast Disclaimer
- 19.2 Data Source and Estimation Limitations
Note: The depth of individual sections depends on data availability for this market. Volume, capacity, trade and other unit-based metrics are included where applicable.

