Mines buy the most belt while warehouses add the most growth
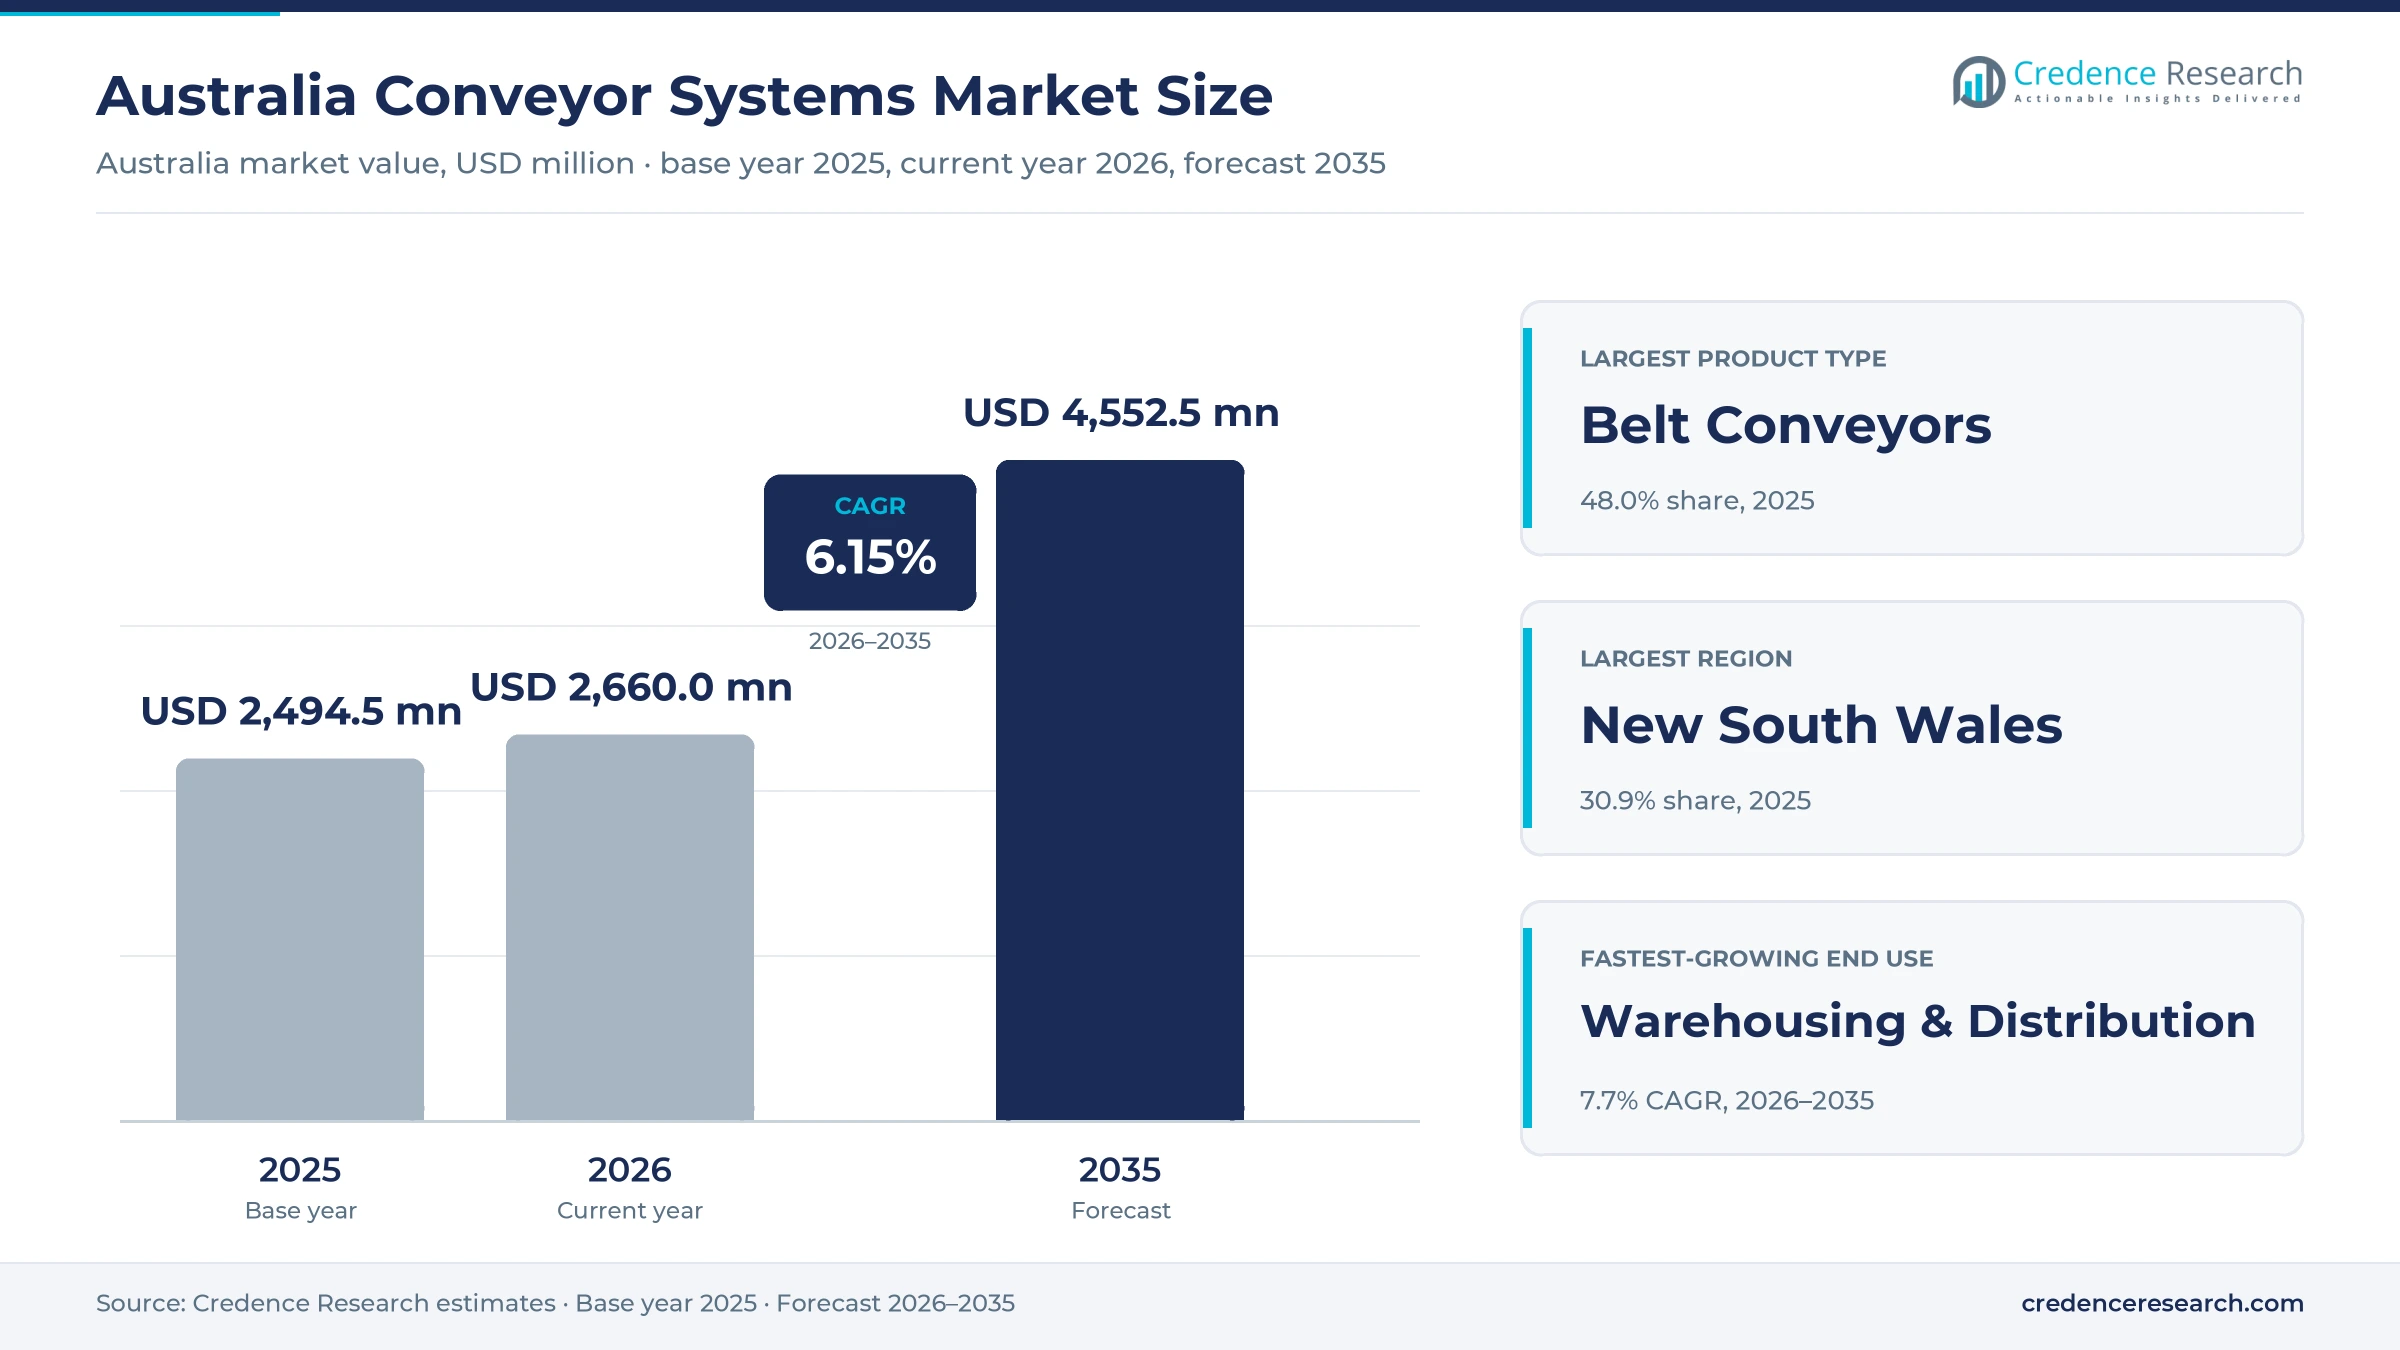
The Australia conveyor systems market was valued at USD 2.49 billion in 2025 and is projected to increase from USD 2.66 billion in 2026 to USD 4.55 billion by 2035, registering a CAGR of 6.15% during 2026–2035. Demand comes from iron ore, coal and gold mines that run long overland belts, from grocery and parcel networks that are automating their distribution centers, and from ports and airports adding handling capacity. New South Wales held the largest regional share, 30.9% in 2025, because Sydney hosts the largest automated retail and parcel sites alongside Hunter Valley coal mines and terminals. Victoria grows fastest at 6.4% a year, as new grocery and wholesale distribution centers are being built in Melbourne's west. Buying behavior is also changing, with miners asking for belt recycling and condition monitoring, and retailers asking for shuttle and sortation systems instead of fixed lines.
Belt, roller and sortation lines across mines and warehouses
The estimate measures total spending on conveyor systems in Australia. That covers new belt, roller, chain, screw and auger, and bucket and vertical conveyors with their drives, controls and sortation modules. It also covers the engineering, structures and installation delivered with them, and aftermarket spending on replacement belting, idlers, rollers and parts, plus maintenance and service contracts. Credence Research estimates that engineering, installation and aftermarket work make up more than half of the total, because on long mining and port systems that work often costs more than the conveyor hardware itself. Buyers include miners, port and rail operators, retailers, third-party logistics providers, food and beverage plants, manufacturers and airports, which usually buy through tenders for large systems and through distributors for spare parts.
The estimate excludes cranes, forklifts, autonomous mobile robots sold without conveyors and stand-alone storage racking. It also leaves out the ore, parcels and goods carried on the lines. The value chain runs from belting, idler, roller and drive makers through OEMs and system integrators to the engineering, procurement and construction contractors and maintenance providers that install and run the systems.
Australia Conveyor Systems Market Insights
- The Australia conveyor systems market was valued at USD 2.49 billion in 2025 and is projected to reach USD 4.55 billion by 2035, registering a CAGR of 6.15% during 2026–2035.
- New South Wales held 30.9% of 2025 value, because Sydney's automated retail and parcel sites and the Hunter Valley's coal mines and terminals sit in the same state.
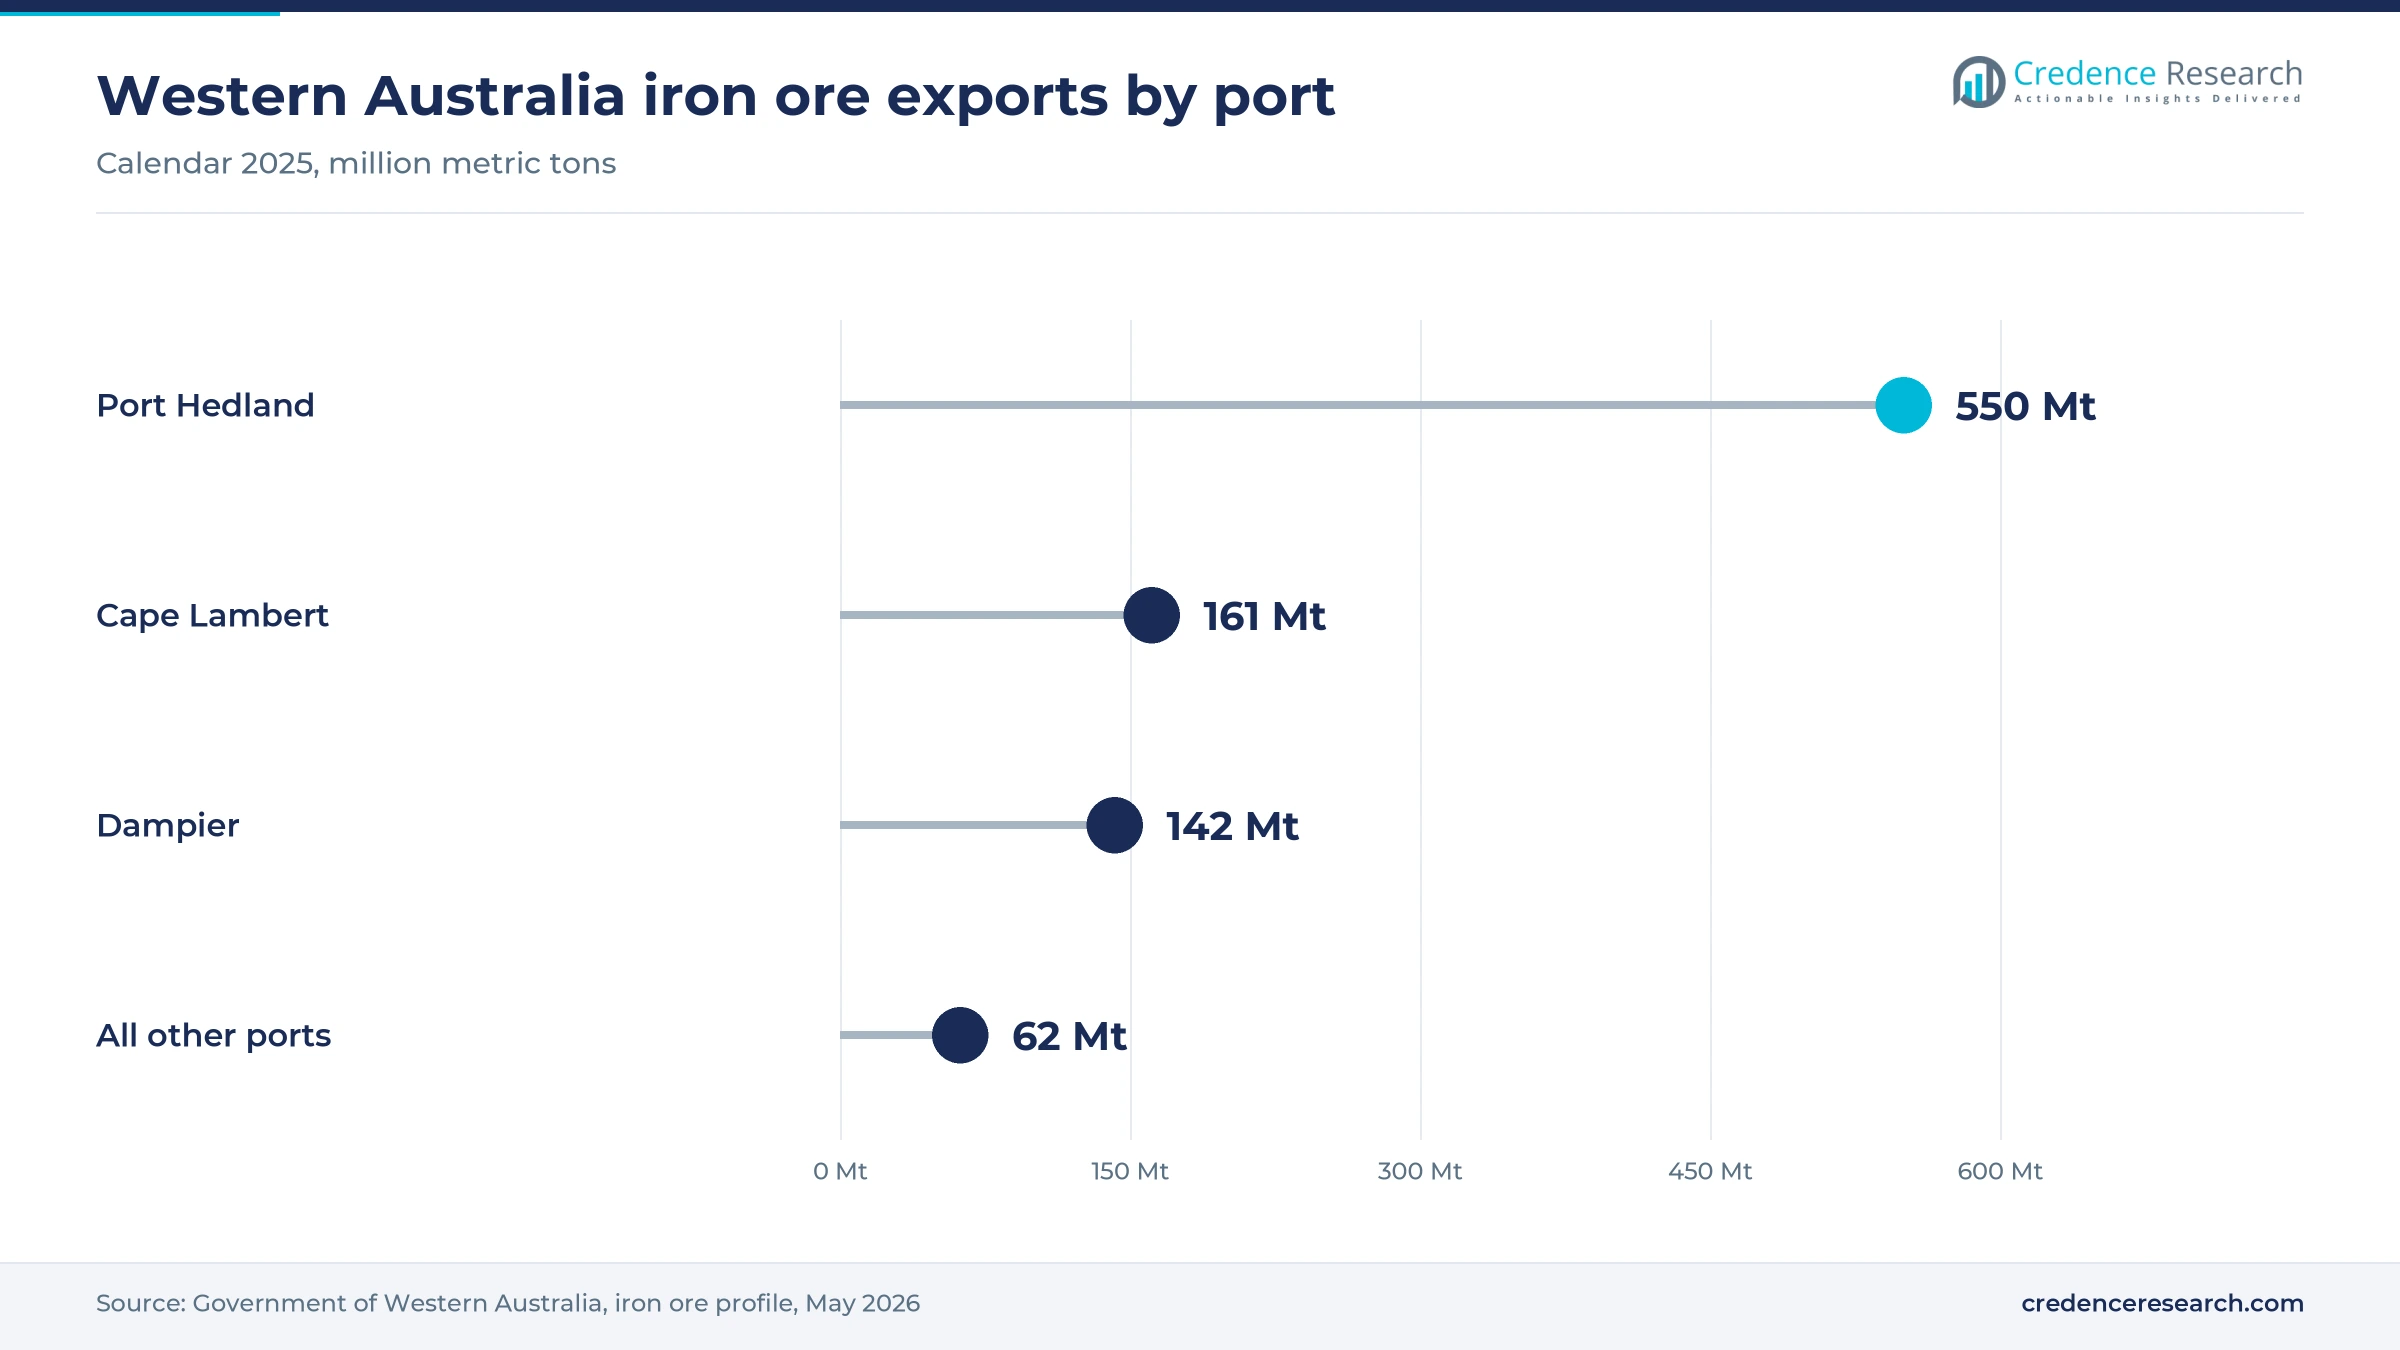
- Mining and minerals led end use with 41.0% of 2025 value, because Western Australia shipped about 915 million metric tons of iron ore through its ports in 2025.
- Fluor bought the FLS overland conveyor product line in December 2025, adding to a trend of consolidation among suppliers of long mining belts.
- Warehousing and distribution grows fastest by end use at 7.7% a year during 2026–2035, as Coles, Woolworths and Metcash run new automated distribution centers.
Belt lines and mining lead as automated sortation gains
Overland belts keep the largest share of spending
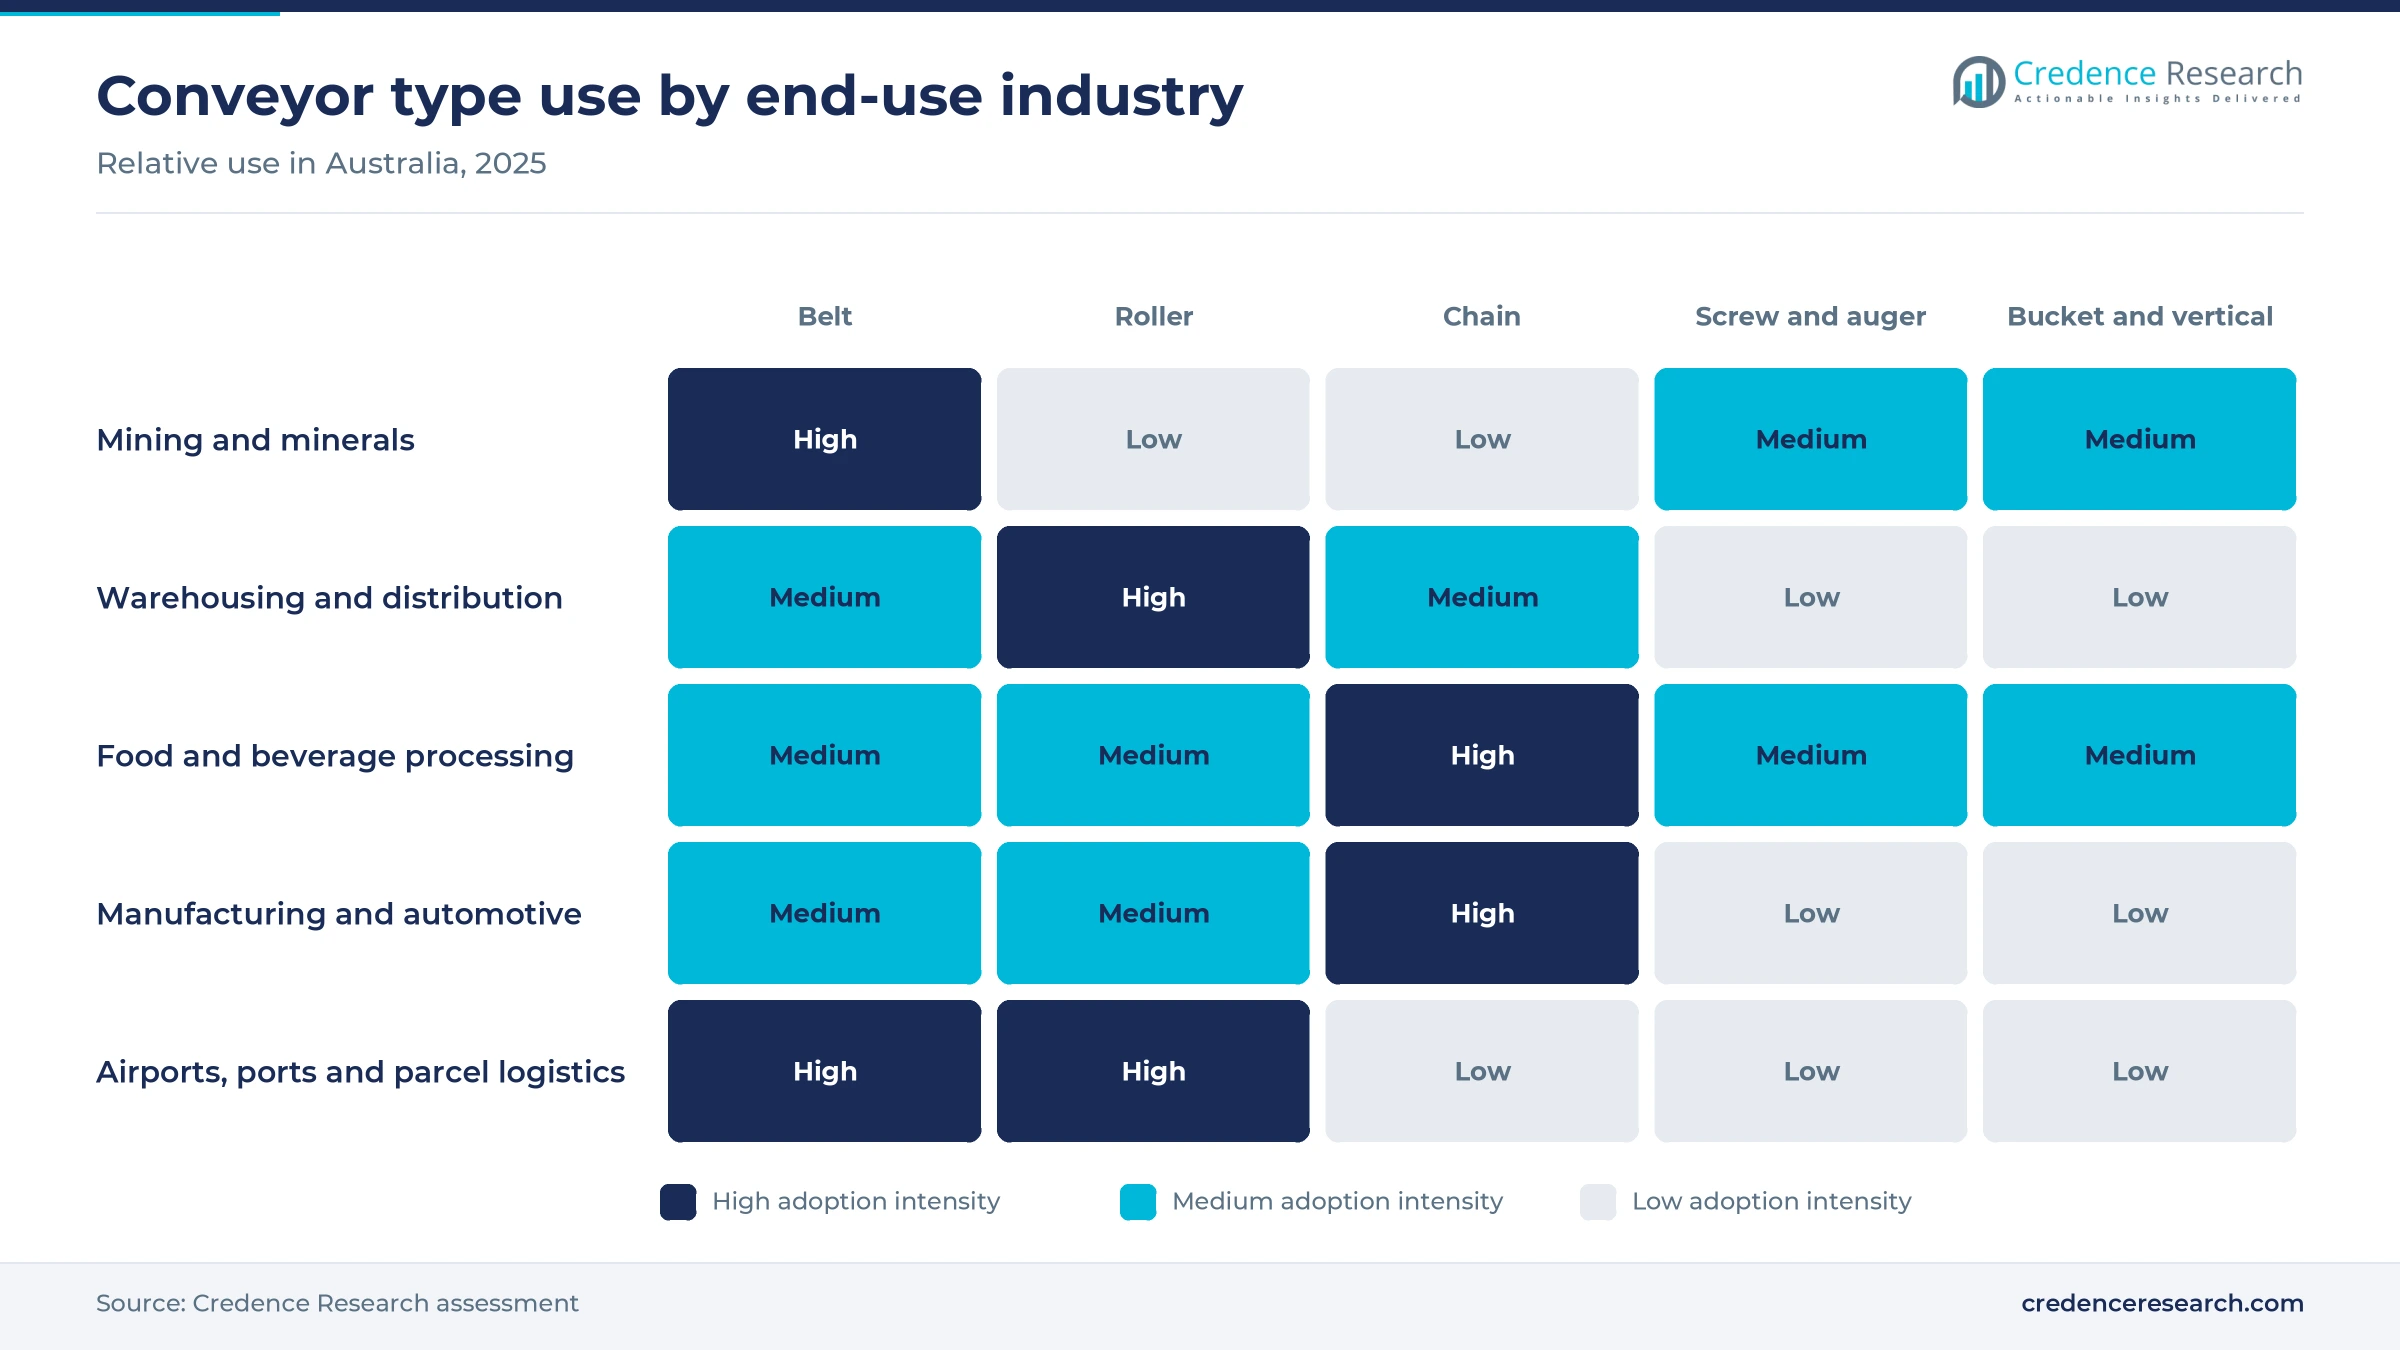
Based on product type, the market is categorized into belt conveyors, roller conveyors, chain conveyors, screw and auger conveyors, and bucket and vertical conveyors. Belt conveyors led with 48.0% of 2025 value, because Pilbara and Hunter Valley mines move ore over many kilometers on steel cord belts. Rio Tinto's Western Range hub, which delivered first ore in March 2025, uses an 18 km conveyor to link its crusher to the Paraburdoo plant, according to Australian Mining. Roller conveyors grow fastest at 6.8% a year, as distribution centers such as Metcash's 115,000-square-meter Truganina site, automated by Dematic in July 2025, need powered roller lines to feed pick stations.
Mines lead on value as retail DCs grow the fastest
Based on end-use industry, the market is categorized into mining and minerals, warehousing and distribution, food and beverage processing, manufacturing and automotive, and airports, ports and parcel logistics. Mining and minerals led with 41.0% of 2025 value, because Western Australia exported about 915 million metric tons of iron ore through its ports in 2025, according to the state government. Every metric ton crosses several belts between pit, plant and ship. Warehousing and distribution grows fastest at 7.7% a year, as Coles' Kemps Creek center, opened in August 2024 with Witron technology, is built to move more than 4 million cartons a week.
Fixed lines dominate, but automated sortation gains share
Based on technology, the market is categorized into conventional fixed conveyors, automated conveyor and sortation, sensor-enabled predictive maintenance, energy-efficient drives and controls, and flexible modular conveyors. Conventional fixed conveyors led with 46.0% of 2025 value, because mine haulage still runs on fixed steel structures. Fenner Conveyors won a turnkey contract for a 9 km overland conveyor at Malabar Resources' Maxwell underground coal mine in New South Wales, using Australian-made steel cord belting. Automated conveyor and sortation grows fastest at 8.0% a year, as Dematic is adding conveyor sortation to a new CoolDrive center in Victoria due by August 2026.
Miners buy direct, while retrofit work grows fastest
Based on sales channel, the market is categorized into direct OEM sales, system integrators and EPC contractors, authorized distributors and retrofit and modernization partners. Direct OEM sales led with 38.0% of 2025 value, because large miners order critical handling equipment straight from OEMs. Metso booked an order worth about EUR 16 million in September 2025 to replace railcar dumper cells in the Pilbara for a customer it has supplied since 2002. Retrofit and modernization partners grow fastest at 7.1% a year, as Port Waratah Coal Services set an A$270 million program in May 2025 to replace a shiploader in service since 1984.
| Segment Group | Leading Sub-segment | Share, 2025 | Fastest-growing Sub-segment | CAGR, 2026–2035 |
|---|---|---|---|---|
| By Product Type | Belt Conveyors | 48.0% | Roller Conveyors | 6.8% |
| By End-Use Industry | Mining & Minerals | 41.0% | Warehousing & Distribution | 7.7% |
| By Technology | Conventional Fixed Conveyors | 46.0% | Automated Conveyor & Sortation | 8.0% |
| By Sales Channel | Direct OEM Sales | 38.0% | Retrofit & Modernization Partners | 7.1% |
Meter rates for light lines, project bids for mine belts
Conveyor pricing in Australia works on two levels that follow the buyer. Light unit-load conveyors for warehouses and plants are quoted per meter or per standard section, and motorized zone control, curves and merges add most of the cost above a basic gravity line. Mining and port systems are priced as engineered projects, where steel structures, belting, drives and installation sit in one tender and can run to hundreds of millions of Australian dollars. Steel prices, belt rubber costs and the Australian dollar move both levels. For buyers, the implication is that lifetime belt and service costs usually decide value on mining systems, while controls and software decide it in warehouses.
| System or package | Typical price or fee | Basis |
|---|---|---|
| Powered (motorized) roller conveyor | A$500 to A$3,000 per meter | IndustrySearch price guide, July 2026 |
| New 30 m standard belt conveyor (purchase only) | A$15,000 to A$40,000 | IndustrySearch buyer guide, March 2026 |
| New 30 m standard roller conveyor (purchase only) | A$8,000 to A$25,000 | IndustrySearch buyer guide, March 2026 |
| Overland conveyor, radial stacker and stockpile package, 12 km | A$757 million construction scope | BHP Western Ridge contract to Sedgman CPB, May 2024 |
| Mixed gravity and powered line, 40 m, mid-size DC | A$40,000 to A$100,000 | IndustrySearch price guide, July 2026 |
Request a Free Sample
Fill in your details and we'll send you a free sample report.
- Sample data tables & charts
- Research methodology
Ore volumes, DC automation and port upgrades lift demand
Resource throughput keeps sustaining capital flowing
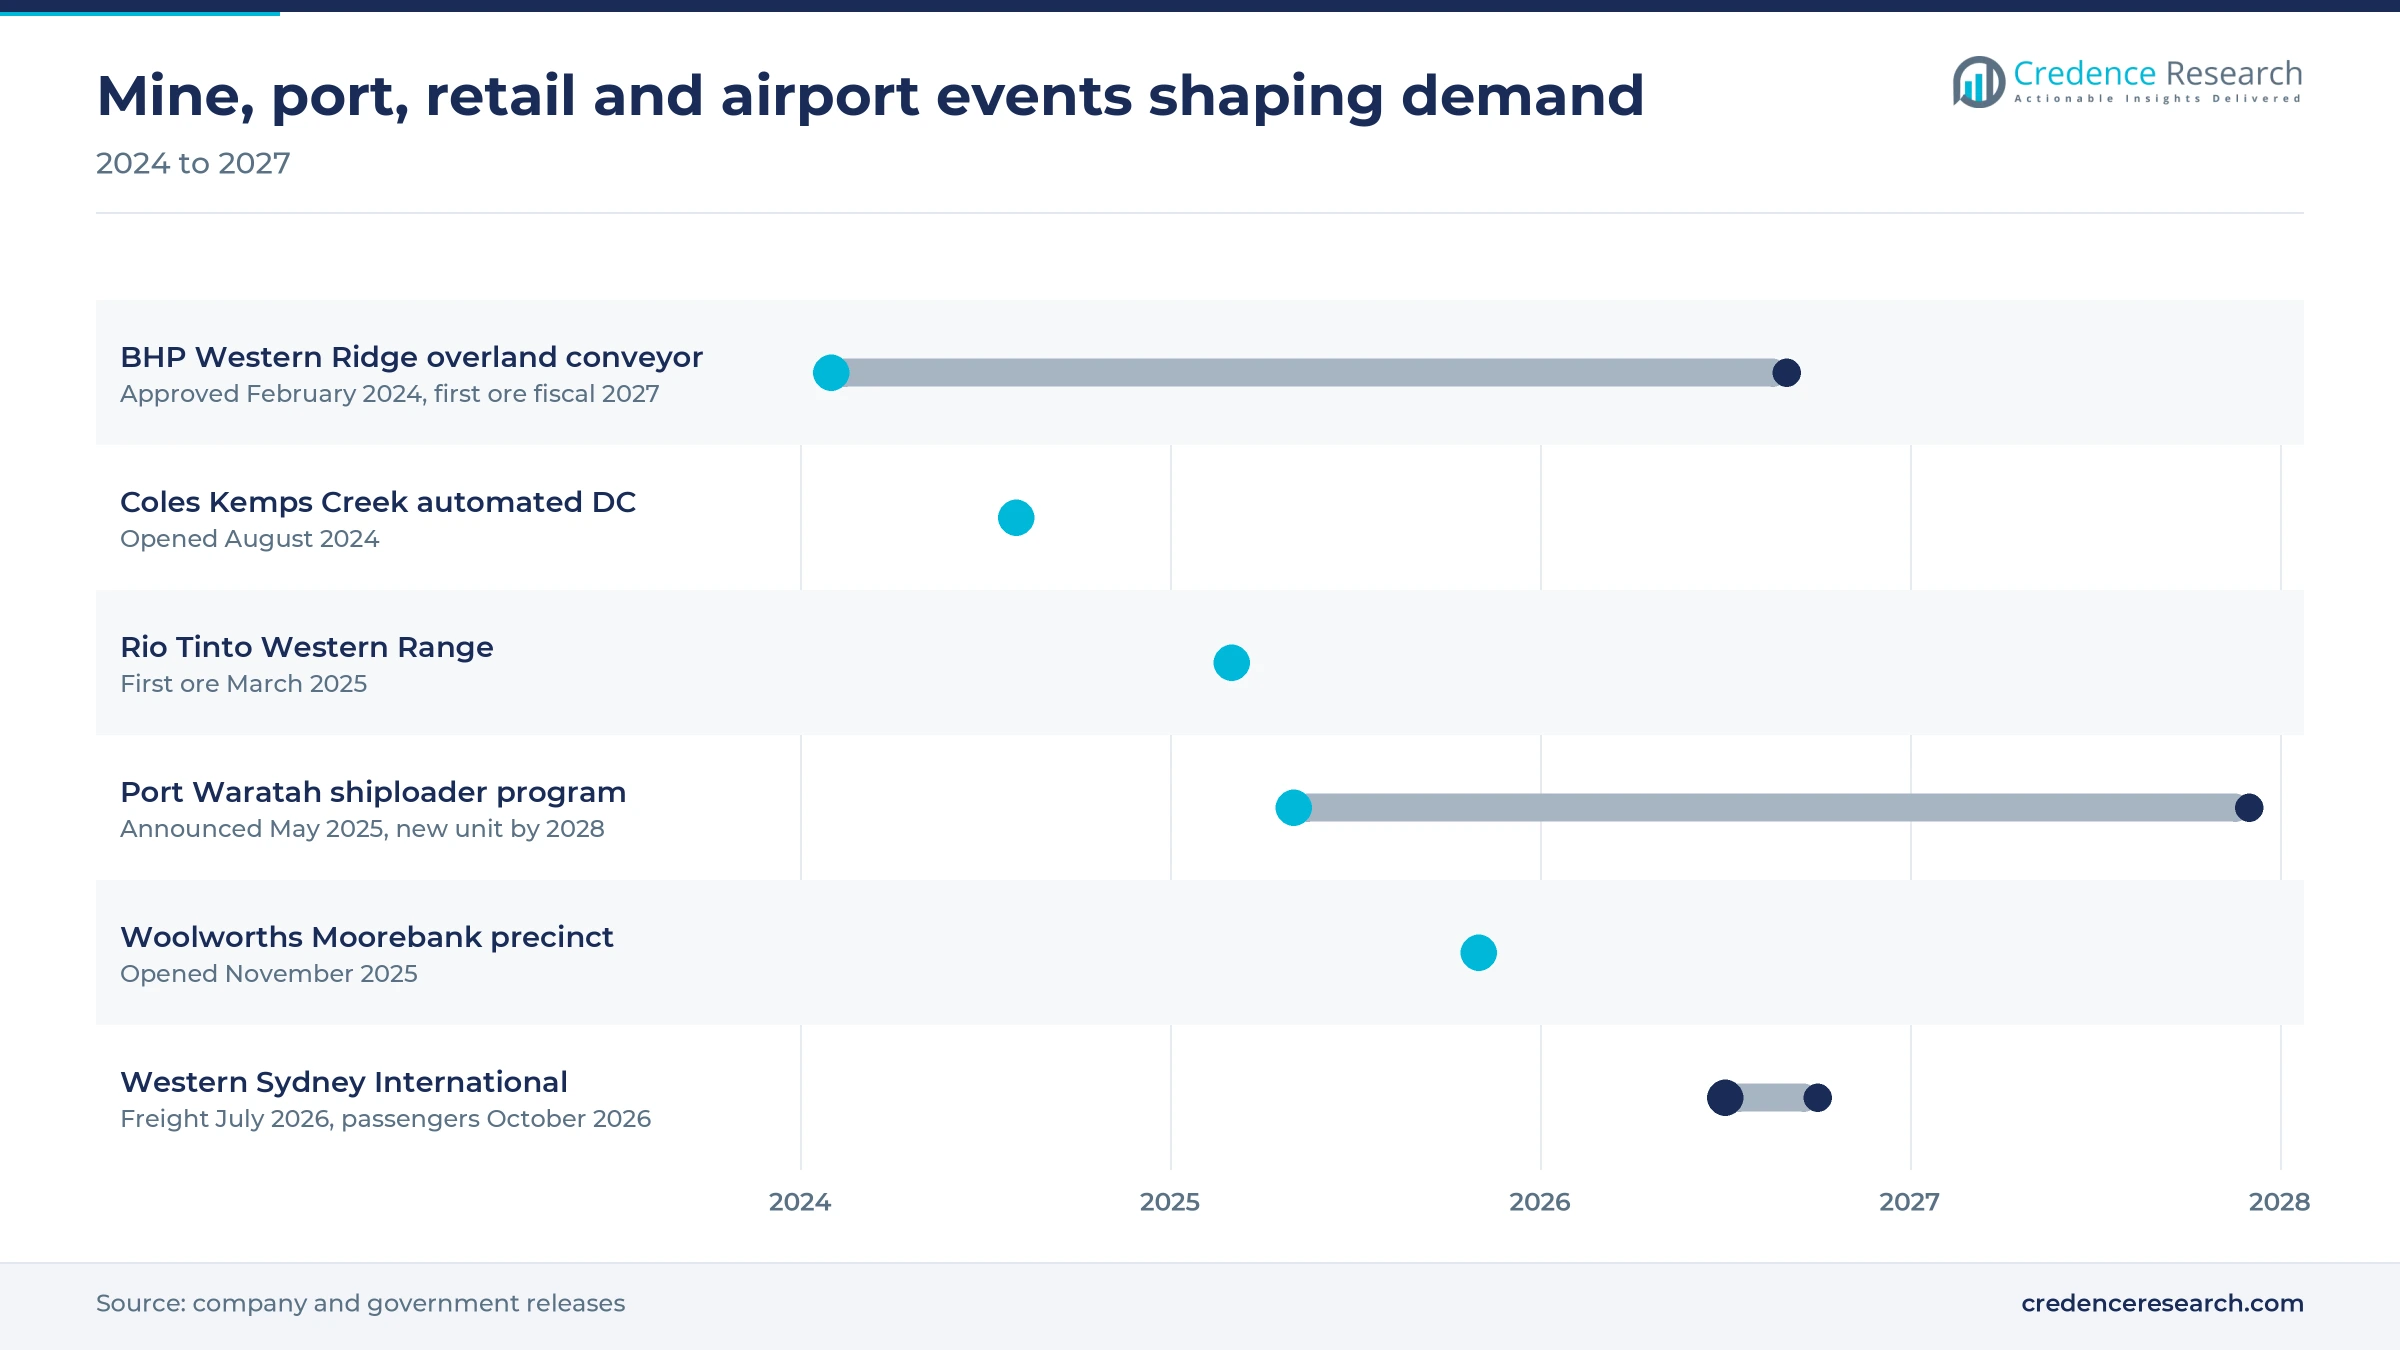
Mining throughput is the largest source of conveyor spending, because every metric ton mined needs belts, idlers and drives that wear out and must be replaced. Ores and metals made up about 34.6% of Australia's merchandise exports in 2025, according to World Bank data, which keeps miners investing to hold volumes. BHP approved US$943 million in February 2024 for its Western Ridge project at Newman, which adds a 12 km overland conveyor and targets first production in the first quarter of fiscal 2027. Port Hedland handled 546 million metric tons in 2024-25, up 1%, according to the Western Australian government, so belt and idler wear scales with export volume. For suppliers, this means a steady base of replacement orders even when new mine approvals slow.
Online orders push retailers into automated DCs
Warehouse automation is the fastest-growing source of demand, because online orders need picking, sorting and dispatch at volumes that manual sheds cannot handle. Australians spent a record A$82.6 billion online in 2025, up 13.9%, across 9.8 million households, according to Australia Post data reported in March 2026. Woolworths opened its A$1.3 billion Moorebank precinct on Nov. 13, 2025, with two automated centers built to handle more than 5 million cartons a week for over 1,000 stores. Third-party operators in e-commerce fulfillment face the same throughput pressure. Integrators that can deliver conveyor, shuttle and sortation packages together win the largest share of each project.
Port and freight upgrades add bulk handling work
Freight infrastructure spending creates conveyor work at ports and terminals, because higher export volumes need new stackers, reclaimers, car dumpers and shiploading lines. The Australian Government has committed A$565 million to common-user port upgrades across the Pilbara, including A$115 million for Dampier, according to Australian Mining. Pilbara Ports handled 71.2 million metric tons in December 2025, its highest December on record, which shows how close terminals run to capacity. Monadelphous also won an A$200 million BHP contract in August 2026 to install Car Dumper 6 and its materials handling plant at Nelson Point by 2028. Suppliers with port references and local fabrication capacity are best placed for these long tenders.
Wage costs and flat productivity favor automation
Rising labor costs push operators to automate handling, because conveyors and sortation cut the manual moves that drive warehouse wages. Labor costs rose 3% to 3.5% while labor productivity grew only 0.8% in the year to September 2025, according to a Dematic release in March 2026 citing ABS data. Coca-Cola Europacific Partners' Brisbane warehouse, automated by SSI SCHAEFER, now stores over 30,000 pallets automatically and picks more than 2.5 million cases a year, with Intralox case singulation, according to Process Online in July 2025. Food and beverage producers that face similar wage pressure are likely to follow, and suppliers that can show a short payback on labor savings will win these orders.
Belt recycling, supplier consolidation and new hubs emerge
Belt recycling rises as miners seek take-back services
Mining customers now ask conveyor suppliers to take back worn belts, which is turning end-of-life rubber into a service line. Fenner Conveyors partnered with Tyrecycle, which confirmed in September 2025 that it recycles mining conveyor belts at its Port Hedland and East Rockingham sites, according to Tyre News. Long steel cord haulage lines, such as the 9 km Maxwell overland belt noted above, leave a large stock of worn belting to dispose of, which adds service demand. NEPEAN added NEPEAN Belting in 2025, with sites in Mackay and Kelso, which puts belt supply and service under one contract. Suppliers that bundle supply, splicing and take-back can lock in multi-year belt contracts with large miners.
Consolidation is reshaping the overland supply base
The supply base for long mining conveyors is consolidating, which shifts bargaining power toward a few integrated groups. Fluor bought the FLS Overland Conveyor Products Group in December 2025 and placed it in Virta, its bulk materials handling arm, according to International Mining. Imports still supplied about USD 264 million of conveyor equipment in 2024, including USD 145 million of other continuous conveyors and USD 85.9 million of belt-type units, according to UN Comtrade data, so global OEMs keep a large role. Australian buyers should expect fewer, larger bidders for overland packages and more emphasis on full life-cycle service contracts.
Grocery and logistics DC pipelines open new work
A pipeline of new retail and logistics centers is a clear opening for conveyor and sortation suppliers over the next five years. Coles committed A$880 million in November 2024 to a third automated center at Truganina, Victoria, built with Witron and due within five years. Industrial take-up reached a record 1.49 million square meters in the third quarter of 2026, according to JLL, and 70.7% of space under construction was pre-committed. JLL also notes that large tenants are building automation into new sites, because older sheds cannot be automated cost-effectively. Suppliers with automated sortation and shuttle references can win these greenfield programs.
Airport and parcel hubs open room for sortation lines
New airport and parcel hubs open a second automation market beyond retail, because baggage and parcel flows need high-speed sortation. Western Sydney International was set to open to freight on July 26, 2026, and to passengers on Oct. 25, 2026, with capacity for up to 10 million passengers a year. Vanderlande was chosen in March 2021 to supply its tote-based baggage handling line. Australia Post opened a Brisbane Airport hub in April 2026 that handles about 250,000 parcels a day, and delivered about 111 million parcels in the 2025 peak. Sortation suppliers that can deliver to these operators gain long service contracts.
Trade shortages and lumpy mine capex slow project delivery
Trade shortages stretch installation and service crews
Skilled labor shortages slow conveyor installation and maintenance, because belt splicing, mechanical fitting and electrical work need licensed tradespeople. About 29% of occupations were in shortage in the 2025 Occupation Shortage List, and nearly half of trade roles, according to Jobs and Skills Australia. Remote mines and new distribution centers compete for the same crews. Suppliers respond with prefabricated modules, remote monitoring and fly-in service teams to protect delivery dates.
Mining capex softness delays some greenfield orders
Mining investment can stall large conveyor orders, because new overland systems depend on final investment decisions. Mining investment fell 1.4% and mining equipment and machinery fell 0.8% in the June quarter of 2025, according to the Australian Bureau of Statistics. Coal and lithium price swings make some owners delay new projects while they keep spending on maintenance. Suppliers that balance project work with recurring belt and idler supply ride out these gaps more easily.
Ramp-up problems raise risk on complex mine projects
Complex processing and handling projects can run late, which shifts risk onto equipment suppliers and contractors. Fortescue took a A$1.1 billion pre-tax impairment on July 31, 2026, after further ramp-up delays at its Iron Bridge magnetite project in the Pilbara, according to Australian Mining Review. Delays of this kind lead owners to demand tighter performance guarantees and liquidated damages clauses. Suppliers now price that risk into overland and plant tenders, which raises bid costs.
Few new warehouse completions slow automation starts
A shortage of new modern sheds limits where automation can go, because most automated systems need tall, purpose-built buildings. Industrial completions fell 51.5% to 280,400 square meters in the third quarter of 2026, the lowest since 2021, according to JLL. Fewer new buildings mean fewer greenfield conveyor and sortation projects in the short term. Integrators are therefore offering compact retrofits for existing sheds while tenants wait for new space.
New South Wales leads while Victoria adds DCs fastest
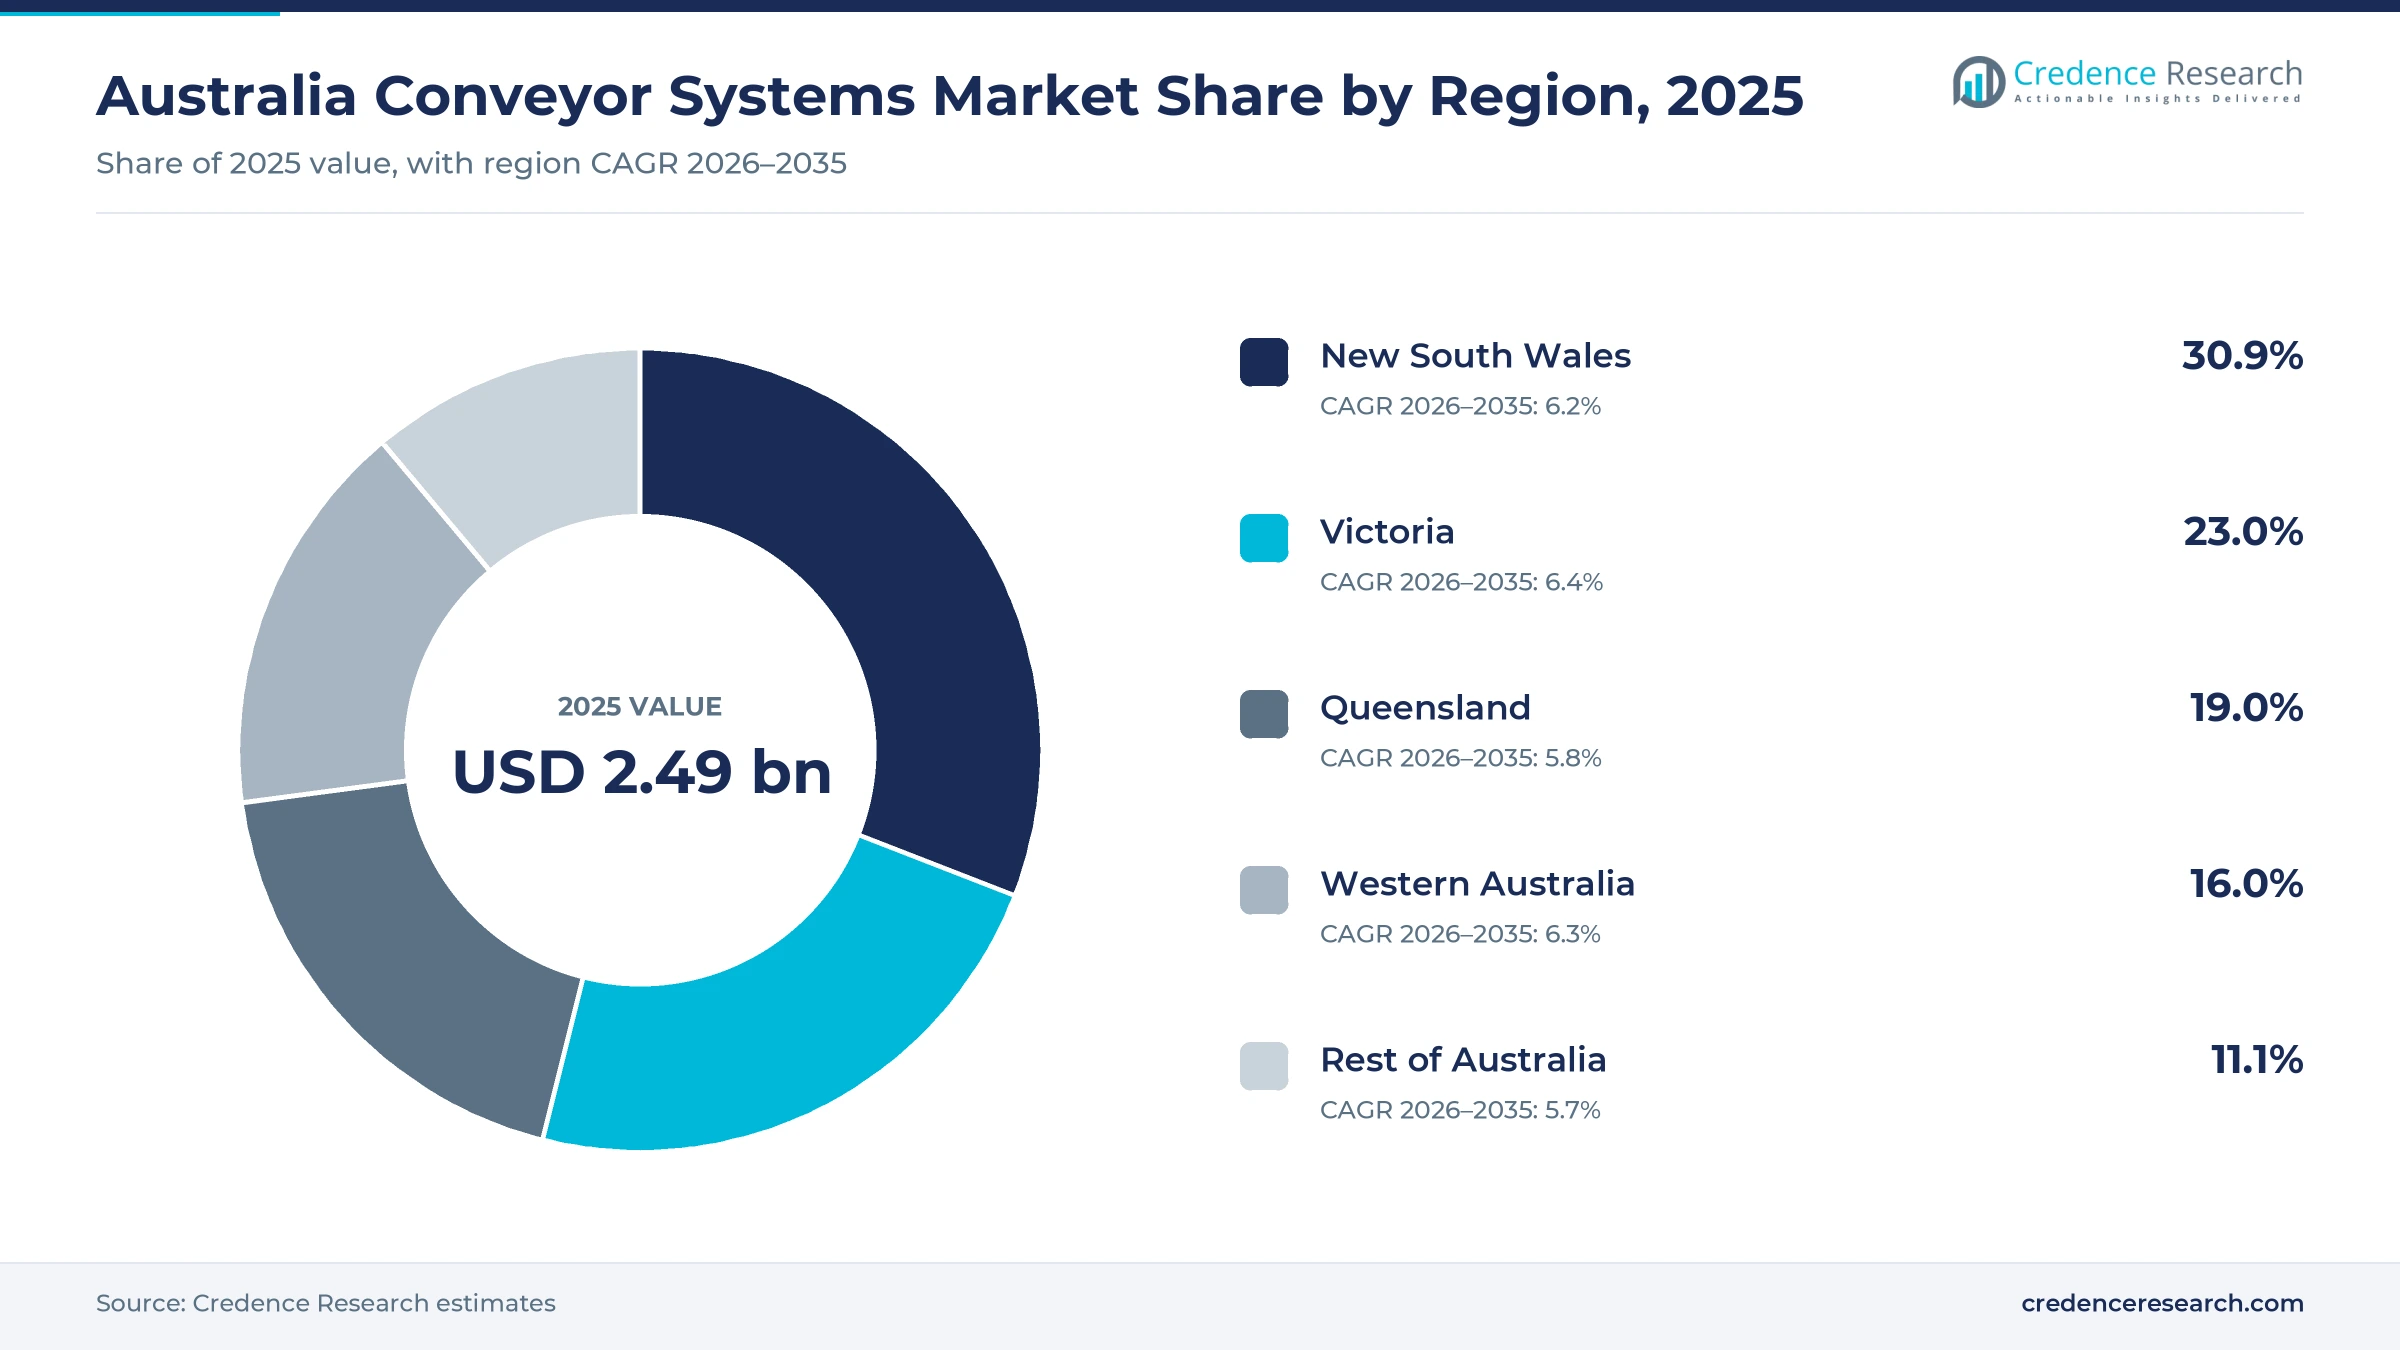
Conveyor demand is spread across five zones that differ in mining output, retail distribution and port activity. New South Wales and Victoria together held more than half of 2025 conveyor demand, because the two largest retail and parcel networks run from Sydney and Melbourne. New South Wales leads in value, while Victoria adds demand fastest as Melbourne's west fills with automated distribution centers.
| Region | Value, 2025 (USD billion) | Share, 2025 | CAGR, 2026–2035 |
|---|---|---|---|
| New South Wales | 0.77 | 30.9% | 6.2% |
| Victoria | 0.57 | 23.0% | 6.4% |
| Queensland | 0.47 | 19.0% | 5.8% |
| Western Australia | 0.40 | 16.0% | 6.3% |
| Rest of Australia | 0.28 | 11.1% | 5.7% |
Sydney DCs and Hunter coal keep New South Wales ahead
New South Wales held 30.9% of 2025 value and grows at 6.2% a year, because Sydney hosts the largest automated grocery and parcel sites while the Hunter Valley runs coal mines and terminals. Port Waratah's Kooragang and Carrington terminals in Newcastle have a combined capacity of 145 million metric tons a year, according to Hunter Headline. The Woolworths and Coles centers in western Sydney and the new airport noted above add sortation and conveyor demand close to these coal and port lines.
Melbourne's west makes Victoria the fastest-growing zone
Victoria held 23.0% of 2025 value and grows fastest at 6.4% a year, because Truganina and nearby suburbs in Melbourne's west have become the main cluster for new grocery and wholesale distribution centers. The center's long build means installation and commissioning work continues in the state for several years. The Coles and Metcash projects at Truganina and CoolDrive's new center described earlier give roller, shuttle and sortation suppliers a steady flow of tenders in the state.
Coal lines and Brisbane hubs anchor Queensland demand
Queensland held 19.0% of 2025 value and grows at 5.8% a year, because Bowen Basin coal mines and export terminals need long belts, while Brisbane adds parcel and beverage hubs. NEPEAN Belting operates from Mackay, and the Australia Post and Coca-Cola Europacific Partners sites in Brisbane described above add automated demand. Coal price swings slow growth in Queensland compared with the other four zones.
Pilbara ore keeps Western Australia a belt market
Western Australia held 16.0% of 2025 value and grows at 6.3% a year, because Pilbara iron ore mines, rail unloaders and ports run some of the world's busiest belt systems. Port Hedland shipped 50.9 million metric tons of iron ore in December 2025 alone, Pilbara Ports said. Rail unloaders such as the Metso car dumpers described earlier also need feed and transfer belts that wear on fixed cycles.
South Australia, Tasmania and the territories add niche projects
Rest of Australia held 11.1% of 2025 value and grows at 5.7% a year, because South Australia, Tasmania and the territories have smaller mining and retail bases. Australia Post plans a Hobart facility for late 2027 that can sort up to 6,000 parcels an hour, according to FreightWaves. Gold, copper and mineral sands mines in these zones add occasional conveyor and underground mining equipment orders.
New mine hubs, grocery DCs and an airport reset demand
| Development | Status and market relevance |
|---|---|
| In March 2025, Rio Tinto delivered first ore from its Western Range hub in the Pilbara, linked by an 18 km conveyor. | Adds a long overland belt system to the iron ore base |
| In May 2025, Port Waratah Coal Services set an A$270 million program to replace and refurbish shiploaders at Kooragang. | New shiploader expected to operate by 2028 |
| In November 2025, Woolworths opened its A$1.3 billion Moorebank precinct with two automated distribution centers. | Built to handle more than 5 million cartons a week |
| In December 2025, Fluor bought the FLS Overland Conveyor Products Group and placed it in its Virta unit. | Consolidates the overland conveyor supply base |
| In June 2026, the federal government confirmed that Western Sydney International would open to passengers on Oct. 25, 2026. | Vanderlande was chosen in 2021 to supply its baggage system |
Tote baggage lines, shuttles and belt sensors gain ground
- Tote-based baggage lines carry each bag in its own tray, which improves tracking, cuts mishandled bags and lets new airports buffer luggage before each flight.
- Shuttle and goods-to-person systems feed roller conveyors from dense storage, which raises picking rates in grocery and wholesale centers and reduces the walking that drives labor cost.
- Belt condition monitoring tracks splices, rips and idler wear with sensors and cameras, which helps miners plan shutdowns and avoid unplanned belt failures on critical haulage lines.
- Variable speed drives match belt speed to load, which cuts energy use and wear on long overland conveyors and smooths starts on heavily loaded belts.
Need a Custom Version of This Report?
Tailor the scope, geography, or segments to your exact requirements.
- Custom geography or segment scope
- Direct access to our analyst team
Mining specialists and intralogistics integrators split work
Competition splits between bulk handling specialists that serve mines and ports and intralogistics integrators that serve retail, parcel and food sites. NEPEAN Conveyors designs, builds and services overland systems for BHP, Rio Tinto, Anglo American, Fortescue and Whitehaven, and added belting in 2025. Fenner Conveyors combines Fenner Dunlop belting with turnkey engineering, as on the Maxwell project. Metso supplies car dumpers and handling equipment to Pilbara operators. In warehouses, Dematic automates sites for Metcash and CoolDrive, while SSI SCHAEFER runs the Coca-Cola Europacific Partners site in Brisbane and opened a new ANZ head office in Sydney in May 2025. Intralox supplies case singulation and modular belting to food and beverage lines. Suppliers win on references, local service crews and life-cycle cost rather than on equipment price alone.
Two supply chains serve mines and warehouses
The supply side is split into two groups that rarely compete head to head. Mining and port work goes to Australian and global bulk handling specialists such as NEPEAN, Fenner Conveyors and Metso, which pair local fabrication with engineering contractors such as Sedgman CPB and Monadelphous. Warehouse, food and parcel work goes to intralogistics integrators such as Dematic, SSI SCHAEFER, Witron and Vanderlande, which work alongside component makers such as Intralox. Entry barriers are high in both groups, because buyers demand proven references, local service crews and performance guarantees. Margins sit mostly in software, controls and multi-year service contracts rather than in steel and belting.
Companies profiled and their roles in this market
| Company | Type | Role in the market |
|---|---|---|
| NEPEAN Conveyors | Australian bulk handling OEM | Overland conveyors, belting and service for major miners |
| Fenner Conveyors | Belting maker and turnkey contractor | 9 km Maxwell overland conveyor; belt recycling with Tyrecycle |
| Metso | Global mining equipment OEM | Pilbara railcar dumper cells ordered September 2025 |
| Dematic | Intralogistics integrator | Metcash Truganina and CoolDrive Victoria automation |
| SSI SCHAEFER | Intralogistics integrator | Coca-Cola Europacific Partners Brisbane automated warehouse |
| Intralox | Modular belting and case handling supplier | Case singulation at the Coca-Cola Europacific Partners Brisbane site |
Credence Research view on where conveyor value moves
Credence Research's view is that Australia conveyor systems value will shift steadily from mine haulage toward warehouse, parcel and airport sortation through 2035, although mining will stay the largest end use. Mining and minerals held 41.0% of 2025 demand, while warehousing and distribution grows at 7.7% a year to 2035. Belt conveyors will keep the biggest share because iron ore volumes stay high and belts wear out on a fixed cycle. The best margin opportunity sits with suppliers that sell controls, monitoring and multi-year service rather than steel alone. The main risk is a pause in mining investment that coincides with a slow year for new warehouse completions.
Import data, project scopes and list prices anchor sizing
The report uses 2025 as the base year for every value, share and growth rate. Market values come from the Credence Research model, which combines import data for conveyors, belting and parts, local supply, published project scopes, supplier list prices and estimated aftermarket and maintenance spending. Regional zones and segment splits by product type, end-use industry, technology and sales channel are Credence Research estimates. Sources used are official trade and labor statistics, government releases, company announcements and industry press, and no interviews or surveys were used.
Warehouse automation outpaces mining spend through 2035
The market is expected to reach USD 4.55 billion by 2035, a 6.15% CAGR during 2026–2035, as miners keep replacing belts and retailers keep automating. Growth should be strongest in warehousing and distribution, in automated sortation and in Victoria, where new grocery centers cluster. Belt conveyors should keep the largest product share because iron ore and coal volumes stay high. Powered roller lines and automated sortation gain share fastest, because every new grocery and parcel center needs them, while mine haulage grows only with ore volume. In contrast, a long pause in mining investment would slow orders for overland belts and port equipment.
Mine spending and DC starts decide the 2035 range
The range of outcomes depends mainly on mining investment and on how many new automated distribution centers start. A downside case assumes weaker coal and lithium prices that delay overland projects, plus slow warehouse completions. The base case assumes steady iron ore throughput, ongoing retrofits and the grocery center pipeline now under way. An upside case needs new copper and critical minerals mines together with faster e-commerce growth that pulls more parcel and sortation hubs forward.
| Scenario | CAGR, 2026–2035 | Value, 2035 | What has to hold |
|---|---|---|---|
| Downside | 4.7% | USD 4.00 billion | Coal and lithium weakness delays overland projects and warehouse completions stay low |
| Base | 6.15% | USD 4.55 billion | Iron ore throughput holds, retrofits continue and announced grocery centers open on schedule |
| Upside | 7.4% | USD 5.04 billion | New critical minerals mines start and e-commerce growth pulls parcel hubs forward |
Frequently Asked Questions
How big is the Australia conveyor systems market?
Which region leads conveyor demand in Australia?
Which region grows fastest?
Which product type holds the largest share?
Which end use grows fastest?
How are conveyor systems priced in Australia?
Who are the leading suppliers?
What are the main risks to growth?
Table of Content
Chapter 1 Market Segmentation
- 1.1 Segmentation Framework
- 1.1.1 Product and Service Classification
- 1.1.2 Application and End-Use Classification
- 1.1.3 Technology and Solution Classification
- 1.1.4 Customer and Distribution Channel Classification
- 1.1.5 Geographic Segmentation
- 1.1.6 Market Segment Definitions and Boundaries
- 1.2 By Product Type
- 1.2.1 Belt Conveyors
- 1.2.2 Roller Conveyors
- 1.2.3 Chain Conveyors
- 1.2.4 Screw & Auger Conveyors
- 1.2.5 Bucket & Vertical Conveyors
- 1.3 By End-Use Industry
- 1.3.1 Mining & Minerals
- 1.3.2 Warehousing & Distribution
- 1.3.3 Food & Beverage Processing
- 1.3.4 Manufacturing & Automotive
- 1.3.5 Airports, Ports & Parcel Logistics
- 1.4 By Technology
- 1.4.1 Conventional Fixed Conveyors
- 1.4.2 Automated Conveyor & Sortation
- 1.4.3 Sensor-Enabled Predictive Maintenance
- 1.4.4 Energy-Efficient Drives & Controls
- 1.4.5 Flexible Modular Conveyors
- 1.5 By Sales Channel
- 1.5.1 Direct OEM Sales
- 1.5.2 System Integrators & EPC Contractors
- 1.5.3 Authorized Distributors
- 1.5.4 Retrofit & Modernization Partners
Chapter 2 Introduction
- 2.1 Report Objectives and Scope
- 2.2 Product Definition and Industry Terminology
- 2.3 Market Inclusions and Exclusions
- 2.4 Research Process
- 2.4.1 Primary Research and Expert Interviews
- 2.4.2 Secondary Research and Source Review
- 2.4.3 Top-Down and Bottom-Up Estimation
- 2.4.4 Data Triangulation and Verification
- 2.5 Market Size Measurement Basis
- 2.5.1 2025: USD 2.49 billion → 2035: USD 4.55 billion
- 2.6 Historical and Forecast Reference Periods
- 2.6.1 Historical Period: 2018-2025
- 2.6.2 Base Year: 2025
- 2.6.3 Forecast Period: 2025-2035
- 2.7 Research Assumptions and Limitations
Chapter 3 Executive Summary
- 3.1 Market Snapshot and Key Findings
- 3.2 Base-Year Market Size, 2025
- 3.3 Forecast Market Size, 2035
- 3.4 Revenue and Volume Growth Outlook
- 3.5 Key Demand and Supply Indicators
- 3.6 Leading Market Segments
- 3.7 Fastest-Growing Market Opportunities
- 3.8 Regional Performance Highlights
- 3.9 Technology and Industry Transformation
- 3.10 Competitive Landscape Summary
- 3.11 Analyst View and Strategic Implications
Chapter 4 Australia Conveyor Systems Market Trends and Developments
- 4.1 Historical Industry Development, 2018-2025
- 4.2 Recent Market Trends and Developments
- 4.3 Demand and Customer Behavior Trends
- 4.4 Technology and Product Innovation
- 4.5 Artificial Intelligence, Automation and Digitalization
- 4.6 Local Manufacturing and Supply Chain Realignment
- 4.7 Industry Partnerships, Mergers and Acquisitions
- 4.8 Sustainability and Circular Economy Developments
- 4.9 Government and Private Sector Investment Trends
- 4.10 Emerging Business Models and Commercialization
- 4.11 Industry Developments and Announcements
Chapter 5 Australia Conveyor Systems Market Production, Supply and Demand Analysis
- 5.1 Demand Trend and Consumption Analysis, 2018-2025
- 5.2 Demand Forecast, 2025-2035
- 5.3 Production and Output Trend, 2018-2025
- 5.4 Production and Output Forecast, 2025-2035
- 5.5 Installed Capacity and Capacity Utilization
- 5.6 Company-Wise Production Plants and Statistics
- 5.6.1 Installed Production Capacity
- 5.6.2 Actual Production
- 5.6.3 Planned Capacity and Expansion Targets
- 5.7 Supply Chain Structure and Procurement Trends
- 5.8 Supply-Demand Gap and Bottlenecks
- 5.9 Import Dependence and Sourcing Structure
- 5.10 Contract Manufacturing and Outsourcing
- 5.11 Regional Supply and Demand Concentration
Chapter 6 Australia Conveyor Systems Market Pricing Analysis
- 6.1 Pricing Structure and Measurement
- 6.2 Historical Pricing Trends, 2018-2025
- 6.3 Pricing Outlook, 2025-2035
- 6.4 Average Selling Price and Unit Economics
- 6.5 Pricing by Product and Market Segment
- 6.6 Geographic Pricing Differences
- 6.7 Key Input, Energy, Labor and Logistics Costs
- 6.8 Contract Pricing and Purchasing Models
- 6.9 Pricing Sensitivity and Competitive Positioning
- 6.10 Price, Margin and Profitability Implications
Chapter 7 Australia Conveyor Systems Market Dynamics
- 7.1 Market Growth Drivers
- 7.1.1 Demand-Side Drivers
- 7.1.2 Technology and Innovation Drivers
- 7.1.3 Infrastructure and Investment Drivers
- 7.1.4 Regulatory and Policy Drivers
- 7.2 Market Restraints
- 7.2.1 Cost and Affordability Constraints
- 7.2.2 Technology and Adoption Barriers
- 7.2.3 Supply Chain and Operational Constraints
- 7.3 Market Challenges
- 7.3.1 Competitive Pressure and Margin Erosion
- 7.3.2 Skills, Infrastructure and Implementation Gaps
- 7.4 Emerging Market Opportunities
- 7.5 Market Dynamics Impact and Time-Horizon Assessment
Chapter 8 Australia Conveyor Systems Value Chain Analysis
- 8.1 Industry Value Chain Overview
- 8.2 Upstream Suppliers and Critical Inputs
- 8.3 Technology and Component Providers
- 8.4 Manufacturing or Service Delivery
- 8.5 Distribution, Channel Partners and Integrators
- 8.6 Downstream Applications and End Users
- 8.7 Value Addition and Profit Pools
- 8.8 Vertical Integration and Outsourcing
- 8.9 Supplier Concentration and Risk
- 8.10 Supply Chain Localization and Resilience
Chapter 9 Australia Conveyor Systems Market Regulations and Policies
- 9.1 Relevant Laws, Standards and Compliance Frameworks
- 9.2 Product, Service, Safety and Quality Requirements
- 9.3 Government Policies, Incentives and Subsidies
- 9.4 Imports, Exports and Trade Barriers
- 9.5 Public Procurement and Local Content Requirements
- 9.6 Environmental and Sustainability Compliance
- 9.7 Upcoming Policy Changes and Market Implications
Chapter 10 Australia Conveyor Systems Market Hotspots and Opportunities
- 10.1 Market Opportunity Mapping and Growth Hotspots
- 10.2 High-Growth Applications and Customer Groups
- 10.3 Underserved Markets and White-Space Opportunities
- 10.4 Emerging Technology and Product Opportunities
- 10.5 New Capacity and Investment Hotspots
- 10.6 Market Entry and Expansion Opportunities
- 10.7 Distribution and Partnership Opportunities
- 10.8 Near-Term and Long-Term Commercial Potential
- 10.9 Opportunity Attractiveness and Execution Risks
Chapter 11 Australia Conveyor Systems Market Outlook, 2025-2035
- 11.1 Market Size and Analysis
- 11.1.1 Revenue (Market Measurement: 2025: USD 2.49 billion → 2035: USD 4.55 billion)
- 11.1.2 Market Volume and Quantity Sold
- 11.1.3 Historical Market Size, 2018-2025
- 11.1.4 Base-Year Market Size, 2025
- 11.2 Market Forecast, 2025-2035
- 11.2.1 Revenue Forecast to 2035
- 11.2.2 Volume Forecast to 2035
- 11.2.3 CAGR and Year-on-Year Growth
- 11.2.4 Incremental Revenue Opportunity
- 11.3 Forecast Assumptions and Scenario Analysis
- 11.3.1 Base-Case Forecast
- 11.3.2 Optimistic and Conservative Scenarios
- 11.3.3 Technology, Pricing and Policy Sensitivities
- 11.4 Market Attractiveness and Growth Outlook
Chapter 12 Australia Conveyor Systems Market Segmentation and Outlook
- 12.1 Segmentation Summary and Market Shares, 2025
- 12.2 Largest and Fastest-Growing Segments
- 12.3 By Product Type - Market Size and Forecast, 2025-2035
- 12.3.1 Segment Definition and Scope
- 12.3.2 Historical Market Size, 2018-2025
- 12.3.3 Revenue Forecast, 2025-2035
- 12.3.4 Volume Forecast, 2025-2035
- 12.3.5 Base-Year Market Share, 2025
- 12.3.6 Segment CAGR and Growth Drivers
- 12.3.7 Subsegment Market Size and Forecast
- 12.3.7.1 Belt Conveyors
- 12.3.7.2 Roller Conveyors
- 12.3.7.3 Chain Conveyors
- 12.3.7.4 Screw & Auger Conveyors
- 12.3.7.5 Bucket & Vertical Conveyors
- 12.3.8 Subsegment Pricing and Adoption Trends
- 12.3.9 Leading Suppliers and Competition
- 12.3.10 Regional Demand and Opportunities
- 12.4 By End-Use Industry - Market Size and Forecast, 2025-2035
- 12.4.1 Segment Definition and Scope
- 12.4.2 Historical Market Size, 2018-2025
- 12.4.3 Revenue Forecast, 2025-2035
- 12.4.4 Volume Forecast, 2025-2035
- 12.4.5 Base-Year Market Share, 2025
- 12.4.6 Segment CAGR and Growth Drivers
- 12.4.7 Subsegment Market Size and Forecast
- 12.4.7.1 Mining & Minerals
- 12.4.7.2 Warehousing & Distribution
- 12.4.7.3 Food & Beverage Processing
- 12.4.7.4 Manufacturing & Automotive
- 12.4.7.5 Airports, Ports & Parcel Logistics
- 12.4.8 Subsegment Pricing and Adoption Trends
- 12.4.9 Leading Suppliers and Competition
- 12.4.10 Regional Demand and Opportunities
- 12.5 By Technology - Market Size and Forecast, 2025-2035
- 12.5.1 Segment Definition and Scope
- 12.5.2 Historical Market Size, 2018-2025
- 12.5.3 Revenue Forecast, 2025-2035
- 12.5.4 Volume Forecast, 2025-2035
- 12.5.5 Base-Year Market Share, 2025
- 12.5.6 Segment CAGR and Growth Drivers
- 12.5.7 Subsegment Market Size and Forecast
- 12.5.7.1 Conventional Fixed Conveyors
- 12.5.7.2 Automated Conveyor & Sortation
- 12.5.7.3 Sensor-Enabled Predictive Maintenance
- 12.5.7.4 Energy-Efficient Drives & Controls
- 12.5.7.5 Flexible Modular Conveyors
- 12.5.8 Subsegment Pricing and Adoption Trends
- 12.5.9 Leading Suppliers and Competition
- 12.5.10 Regional Demand and Opportunities
- 12.6 By Sales Channel - Market Size and Forecast, 2025-2035
- 12.6.1 Segment Definition and Scope
- 12.6.2 Historical Market Size, 2018-2025
- 12.6.3 Revenue Forecast, 2025-2035
- 12.6.4 Volume Forecast, 2025-2035
- 12.6.5 Base-Year Market Share, 2025
- 12.6.6 Segment CAGR and Growth Drivers
- 12.6.7 Subsegment Market Size and Forecast
- 12.6.7.1 Direct OEM Sales
- 12.6.7.2 System Integrators & EPC Contractors
- 12.6.7.3 Authorized Distributors
- 12.6.7.4 Retrofit & Modernization Partners
- 12.6.8 Subsegment Pricing and Adoption Trends
- 12.6.9 Leading Suppliers and Competition
- 12.6.10 Regional Demand and Opportunities
- 12.7 Segment Growth Comparison
- 12.8 Segment Attractiveness and Priority Matrix
Chapter 13 Australia Conveyor Systems End-Use and Application Market Outlook
- 13.1 End-Use Industry and Customer Demand Structure
- 13.2 Leading Applications and Customer Groups
- 13.3 End-Use Market Size, Share and Forecast
- 13.4 Major End-Use Industry Deep Dives
- 13.4.1 Customer Requirements and Use Cases
- 13.4.2 Demand and Replacement Cycles
- 13.4.3 Technical and Regulatory Considerations
- 13.4.4 Purchasing and Procurement Models
- 13.4.5 Leading Vendors and Distribution Channels
- 13.4.6 Forecast and Commercial Opportunities
- 13.5 Emerging Applications and Cross-Segment Demand
- 13.6 End-Use Industry Investment Priorities
Chapter 14 Australia Conveyor Systems Geographic Market Outlook, 2025-2035
- 14.1 Domestic Market Distribution and Demand Clusters
- 14.2 State- or Province-Wise Market Size and Forecast, 2025-2035
- 14.3 City and Metropolitan Market Outlook
- 14.4 Industrial, Manufacturing and Commercial Clusters
- 14.5 Geographic Concentration of Key End Users
- 14.6 Local Pricing and Purchasing Differences
- 14.7 Domestic Production Facilities and Capacity Map
- 14.8 Local Infrastructure and Project Pipeline
- 14.9 State-Level Policy and Incentive Differences
- 14.10 Subnational Investment Hotspots and Opportunities
- 14.11 Distribution and Logistics Networks
- 14.12 Domestic Competitive Footprint
Chapter 15 Australia Conveyor Systems Technology, Innovation and Sustainability Outlook
- 15.1 Technology Landscape and Maturity
- 15.2 Product, Process and Service Innovation
- 15.3 AI, Automation and Digital Tools in the Industry
- 15.4 Technology Adoption and Performance Benchmarking
- 15.5 Innovation Pipeline and R&D Investment
- 15.6 Patent and Intellectual Property Trends
- 15.7 Energy Efficiency and Resource Management
- 15.8 Sustainability, Recycling and Circularity
- 15.9 Technology Roadmap, 2025-2035
- 15.10 Risks of Obsolescence and Technology Substitution
Chapter 16 Australia Conveyor Systems Market Key Strategic Imperatives
- 16.1 Growth and Market Entry Priorities
- 16.2 High-Return Products and Segments
- 16.3 Pricing, Profitability and Cost Optimization
- 16.4 Technology Investment and Product Differentiation
- 16.5 Supply Chain Localization and Resilience
- 16.6 Distribution and Customer Acquisition
- 16.7 Partnership, Acquisition and Capacity Strategy
- 16.8 Regional Expansion Priorities
- 16.9 Short-, Medium- and Long-Term Actions
Chapter 17 Competition Outlook
- 17.1 Industry Competition Characteristics
- 17.2 Market Structure and Concentration
- 17.3 Market Share and Competitive Positioning, 2025
- 17.4 Company-Wise Revenue and Product Benchmarking
- 17.5 Production and Service Capacity Benchmarking
- 17.6 Technology, Pricing and Differentiation
- 17.7 Regional Footprint and Distribution Strength
- 17.8 Mergers, Acquisitions and Strategic Alliances
- 17.9 New Entrants and Competitive Threats
- 17.10 Porter's Five Forces and Industry Attractiveness
- 17.11 Competitive Outlook, 2025-2035
Chapter 18 Company Profiles
- 18.1 Company Coverage and Selection Criteria
- 18.2 NEPEAN Conveyors
- 18.2.1 Business Description
- 18.2.2 Company Ownership and Geographic Presence
- 18.2.3 Product and Service Portfolio
- 18.2.4 Manufacturing and Operating Footprint
- 18.2.5 Production Capacity and Expansion Plans
- 18.2.6 Financial Performance and Investment
- 18.2.7 Market Share and Competitive Position
- 18.2.8 Technology and Innovation Capabilities
- 18.2.9 Strategic Alliances or Partnerships
- 18.2.10 Recent Developments
- 18.2.11 Growth Strategy and Outlook
- 18.3 Fenner Conveyors
- 18.4 Metso
- 18.5 FLS
- 18.6 Dematic
- 18.7 SSI SCHAEFER
- 18.8 BEUMER Group
- 18.9 Interroll
- 18.10 Intralox
- 18.11 Tsubaki Australia
- 18.12 Other Relevant Market Participants
Note: Every listed company is profiled on the structure shown under the first company. The company list is preliminary and may change based on research findings, market developments, data availability and client requirements.
Chapter 19 Disclaimer
- 19.1 Research and Forecast Disclaimer
- 19.2 Data Source and Estimation Limitations
Note: The depth of individual sections depends on data availability for this market. Volume, capacity, trade and other unit-based metrics are included where applicable.