Bovine mastitis spend moves from cure toward prevention
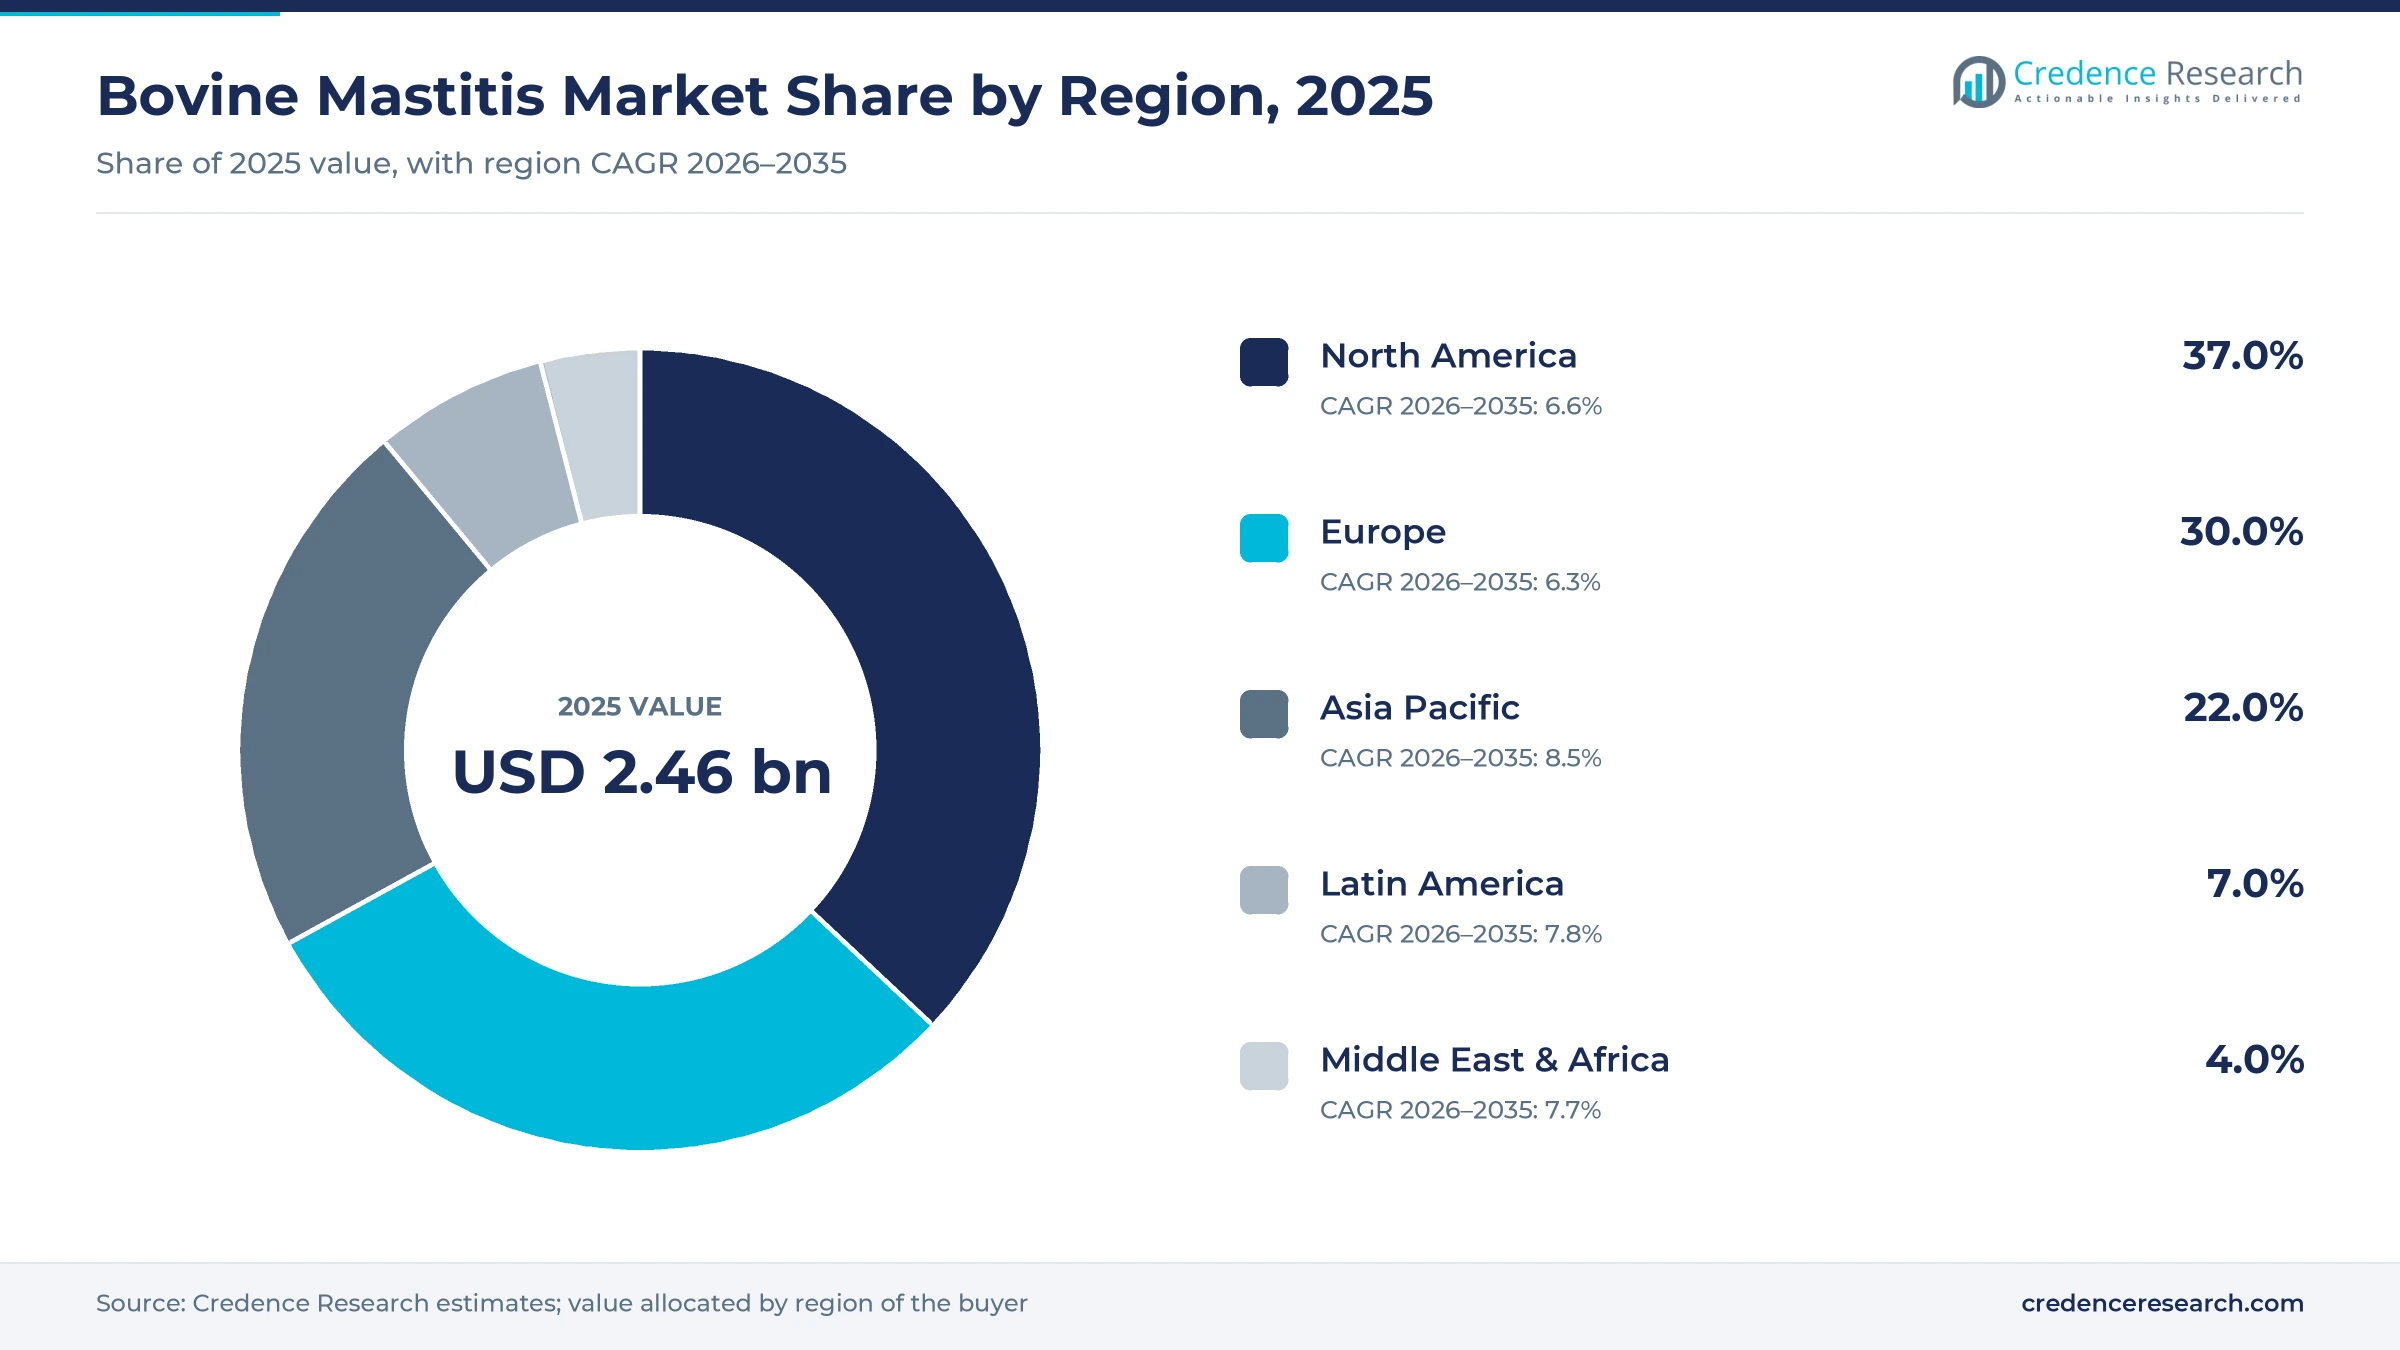
The global bovine mastitis market was valued at USD 2.46 billion in 2025 and is projected to increase from USD 2.63 billion in 2026 to USD 4.88 billion by 2035, registering a CAGR of 7.10% during 2026–2035. Demand comes from commercial dairy herds that treat clinical cases with intramammary antibiotics and anti-inflammatories, and that protect cows at drying off with antibiotic tubes, internal teat sealants and vaccines. North America held the largest regional share, 37.0% in 2025, because U.S. herds are large, milk is paid on quality and producers buy branded tubes through veterinary channels. Asia Pacific is the fastest-growing region at 8.5% a year, as organized dairying expands in India and Oceania adopts new vaccines. The European Union has not permitted blanket antibiotic treatment of every cow at drying off since January 2022, a rule that moves spending toward sealants, cell-count testing and vaccines. Cheap generic tubes still cap prices, so value growth depends on prevention products.
Which udder health products sit inside this estimate?
The estimate counts products that dairy farmers and veterinarians use to treat or prevent udder infection in cows and dairy buffalo, namely lactating and dry-cow antibiotic tubes, injectable antibiotics, mastitis vaccines, anti-inflammatory drugs given for mastitis cases, internal teat sealants and teat disinfectants. Values are taken at manufacturer selling prices for the year in which products are sold.
Somatic cell sensors, culture kits, milking hardware and herd software sit outside the estimate, although they decide when a cow is treated. Milk discarded during withdrawal periods and the cost of culled cows are losses to the farm, not product sales, so they are excluded as well.

Bovine Mastitis Market Insights
- The market is valued at USD 2.46 billion in 2025 and is projected to reach USD 4.88 billion by 2035, growing at a 7.10% CAGR as prevention products gain ground.
- North America led with 37.0% of 2025 value, because large U.S. herds buy branded tubes, sealants and vaccines through veterinary channels.
- Antibiotics held 58.0% of 2025 value, since clinical cases and dry-off protection in most herds still rely on intramammary antibiotic tubes.
- European regulators advised in March 2026 that quarter-based selective dry-cow therapy cuts antibiotic use without harming animal health.
- Boehringer Ingelheim said in April 2026 that its Lenzelta mastitis vaccine would be available in several EU countries, widening prevention options at drying off.
Antibiotics lead while dry-off vaccines grow fastest
Why do antibiotics lead while vaccines grow fastest?
Based on product, the market is categorized into antibiotics, vaccines, anti-inflammatories and teat sealants and others. Antibiotics led with 58.0% of 2025 value because no other product cures an established bacterial infection, and Boehringer Ingelheim's U.S. mastitis range lists four antibiotic tubes, Polymast, ToDAY, Dry-Clox and ToMORROW, against one sealant and one vaccine. Vaccines grow fastest at 8.8% a year as pathogen-specific products reach new markets, and HIPRA launched UBAC against Streptococcus uberis in New Zealand in February 2024, six years after its European release. Vaccines lower the number and severity of cases but cure nothing, so antibiotics stay in the treatment plan.
Why does clinical mastitis lead while subclinical cases grow fastest?
Based on type, the market is categorized into clinical mastitis and subclinical mastitis. Clinical Mastitis led with 57.0% of 2025 value because visible cases are treated at once, and Merck Animal Health material published in Hoard's Dairyman in August 2025 puts the cost of one case at up to USD 444 per cow. Subclinical Mastitis grows fastest at 7.5% a year as hidden infections become visible to farmers, and DeLaval introduced its BioSensors Milk Cell Analysis unit for VMS V300 robots in April 2025 to read somatic cells during each milking. Better detection lifts the number of treated cases before it lowers them.
Why do intramammary products lead while systemic products grow faster?
Based on route of administration, the market is categorized into intramammary and systemic products. Intramammary led with 72.0% of 2025 value because tubes deliver the drug into the infected quarter, and Norbrook alone sells cloxacillin and cefalonium dry-cow suspensions such as Cepritect 250 mg in single 3 g syringes across several markets. Systemic products grow faster at 7.6% a year as herds add injected vaccines and transdermal anti-inflammatories used in veterinary pain management, and Merck Animal Health groups Bovilis J-5 and Banamine Transdermal with its tubes in the M-Power dairy portfolio.
Why does lactating therapy lead while dry-period products grow fastest?
Based on therapy, the market is categorized into lactating period and dry period products. Lactating Period products led with 55.0% of 2025 value because cases in milking cows need fast cures, and Boehringer Ingelheim sells ToDAY as a two-tube course and Polymast as three once-daily tubes. Dry Period products grow fastest at 7.6% a year as herds replace blanket antibiotic dry-off with sealants, and Elanco's Australian label for InterSeal, dated April 2, 2025, allows the sealant alone or with a dry-cow antibiotic. Sealant use per cow rises even where antibiotic tubes per cow fall.
| Segment Group | Leading Sub-segment | Share, 2025 | Fastest-growing Sub-segment | CAGR, 2026–2035 |
|---|---|---|---|---|
| By Product | Antibiotics | 58.0% | Vaccines | 8.8% |
| By Type | Clinical Mastitis | 57.0% | Subclinical Mastitis | 7.5% |
| By Route of Administration | Intramammary | 72.0% | Systemic | 7.6% |
| By Therapy | Lactating Period | 55.0% | Dry Period | 7.6% |
Low tube prices make prevention the profit pool
Mastitis products are sold through veterinarians and farm distributors at prices of a few dollars a dose, so suppliers earn on volume and brand loyalty rather than on unit price. At the U.S. list prices below, a blanket dry-off with four antibiotic tubes and four teat seals costs about USD 30 per cow, a small fraction of the per-case loss cited above. That gap explains why farmers rarely skip treatment on price, and why generic tubes compete hard on cost. Vaccines and sealants carry more brand value because farmers choose them by trial data and veterinary advice.
| Product and pack | Typical price or fee | Basis |
|---|---|---|
| ToDAY cephapirin lactating tubes, box of 12 | USD 70.29, about USD 5.86 per syringe | FBN list price, November 2026 |
| Spectramast DC ceftiofur dry-cow tubes, pail of 144 | USD 723.85, about USD 5.03 per syringe | FBN list price, November 2026 |
| Orbeseal internal teat sealant, pail of 144 | USD 364.29, about USD 2.53 per syringe | FBN list price, November 2026 |
| Lockout internal teat sealant, pail of 144 | USD 387.57, about USD 2.69 per syringe | FBN list price, November 2026 |
| Bovilis J-5 coliform vaccine, 50 doses | USD 99.70, about USD 1.99 per dose | FBN list price, November 2026 |
Request a Free Sample
Fill in your details and we'll send you a free sample report.
- Sample data tables & charts
- Research methodology
Bigger herds and costly cases keep udder care funded
How does U.S. herd growth lift treatment volumes?
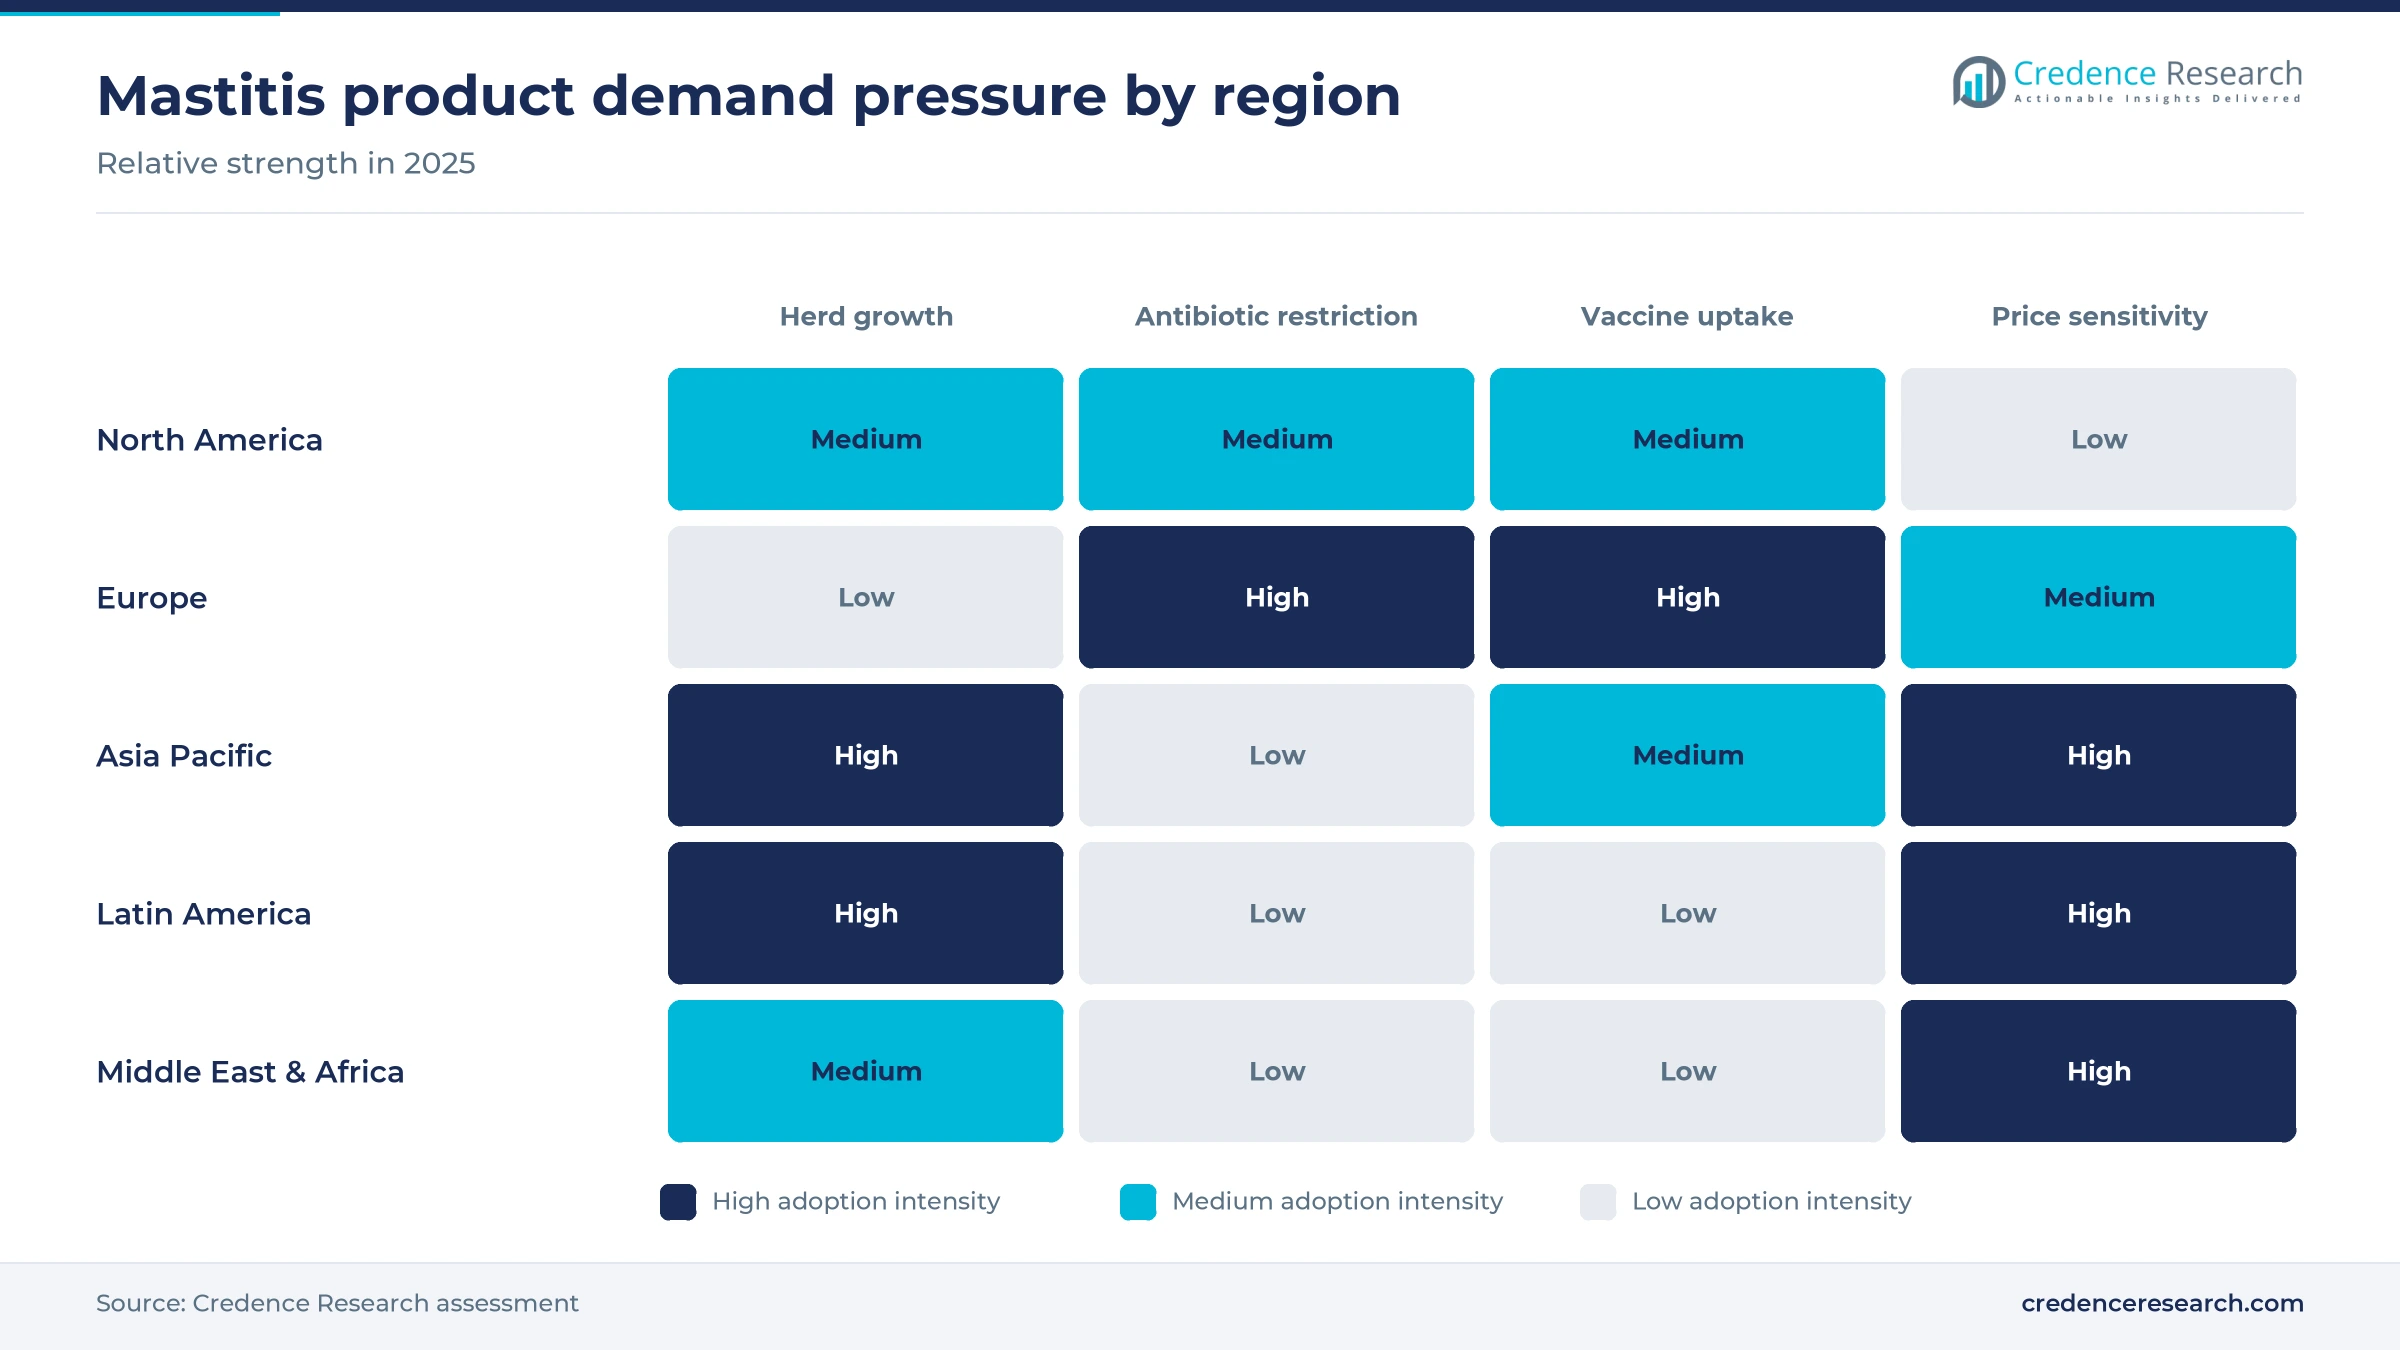
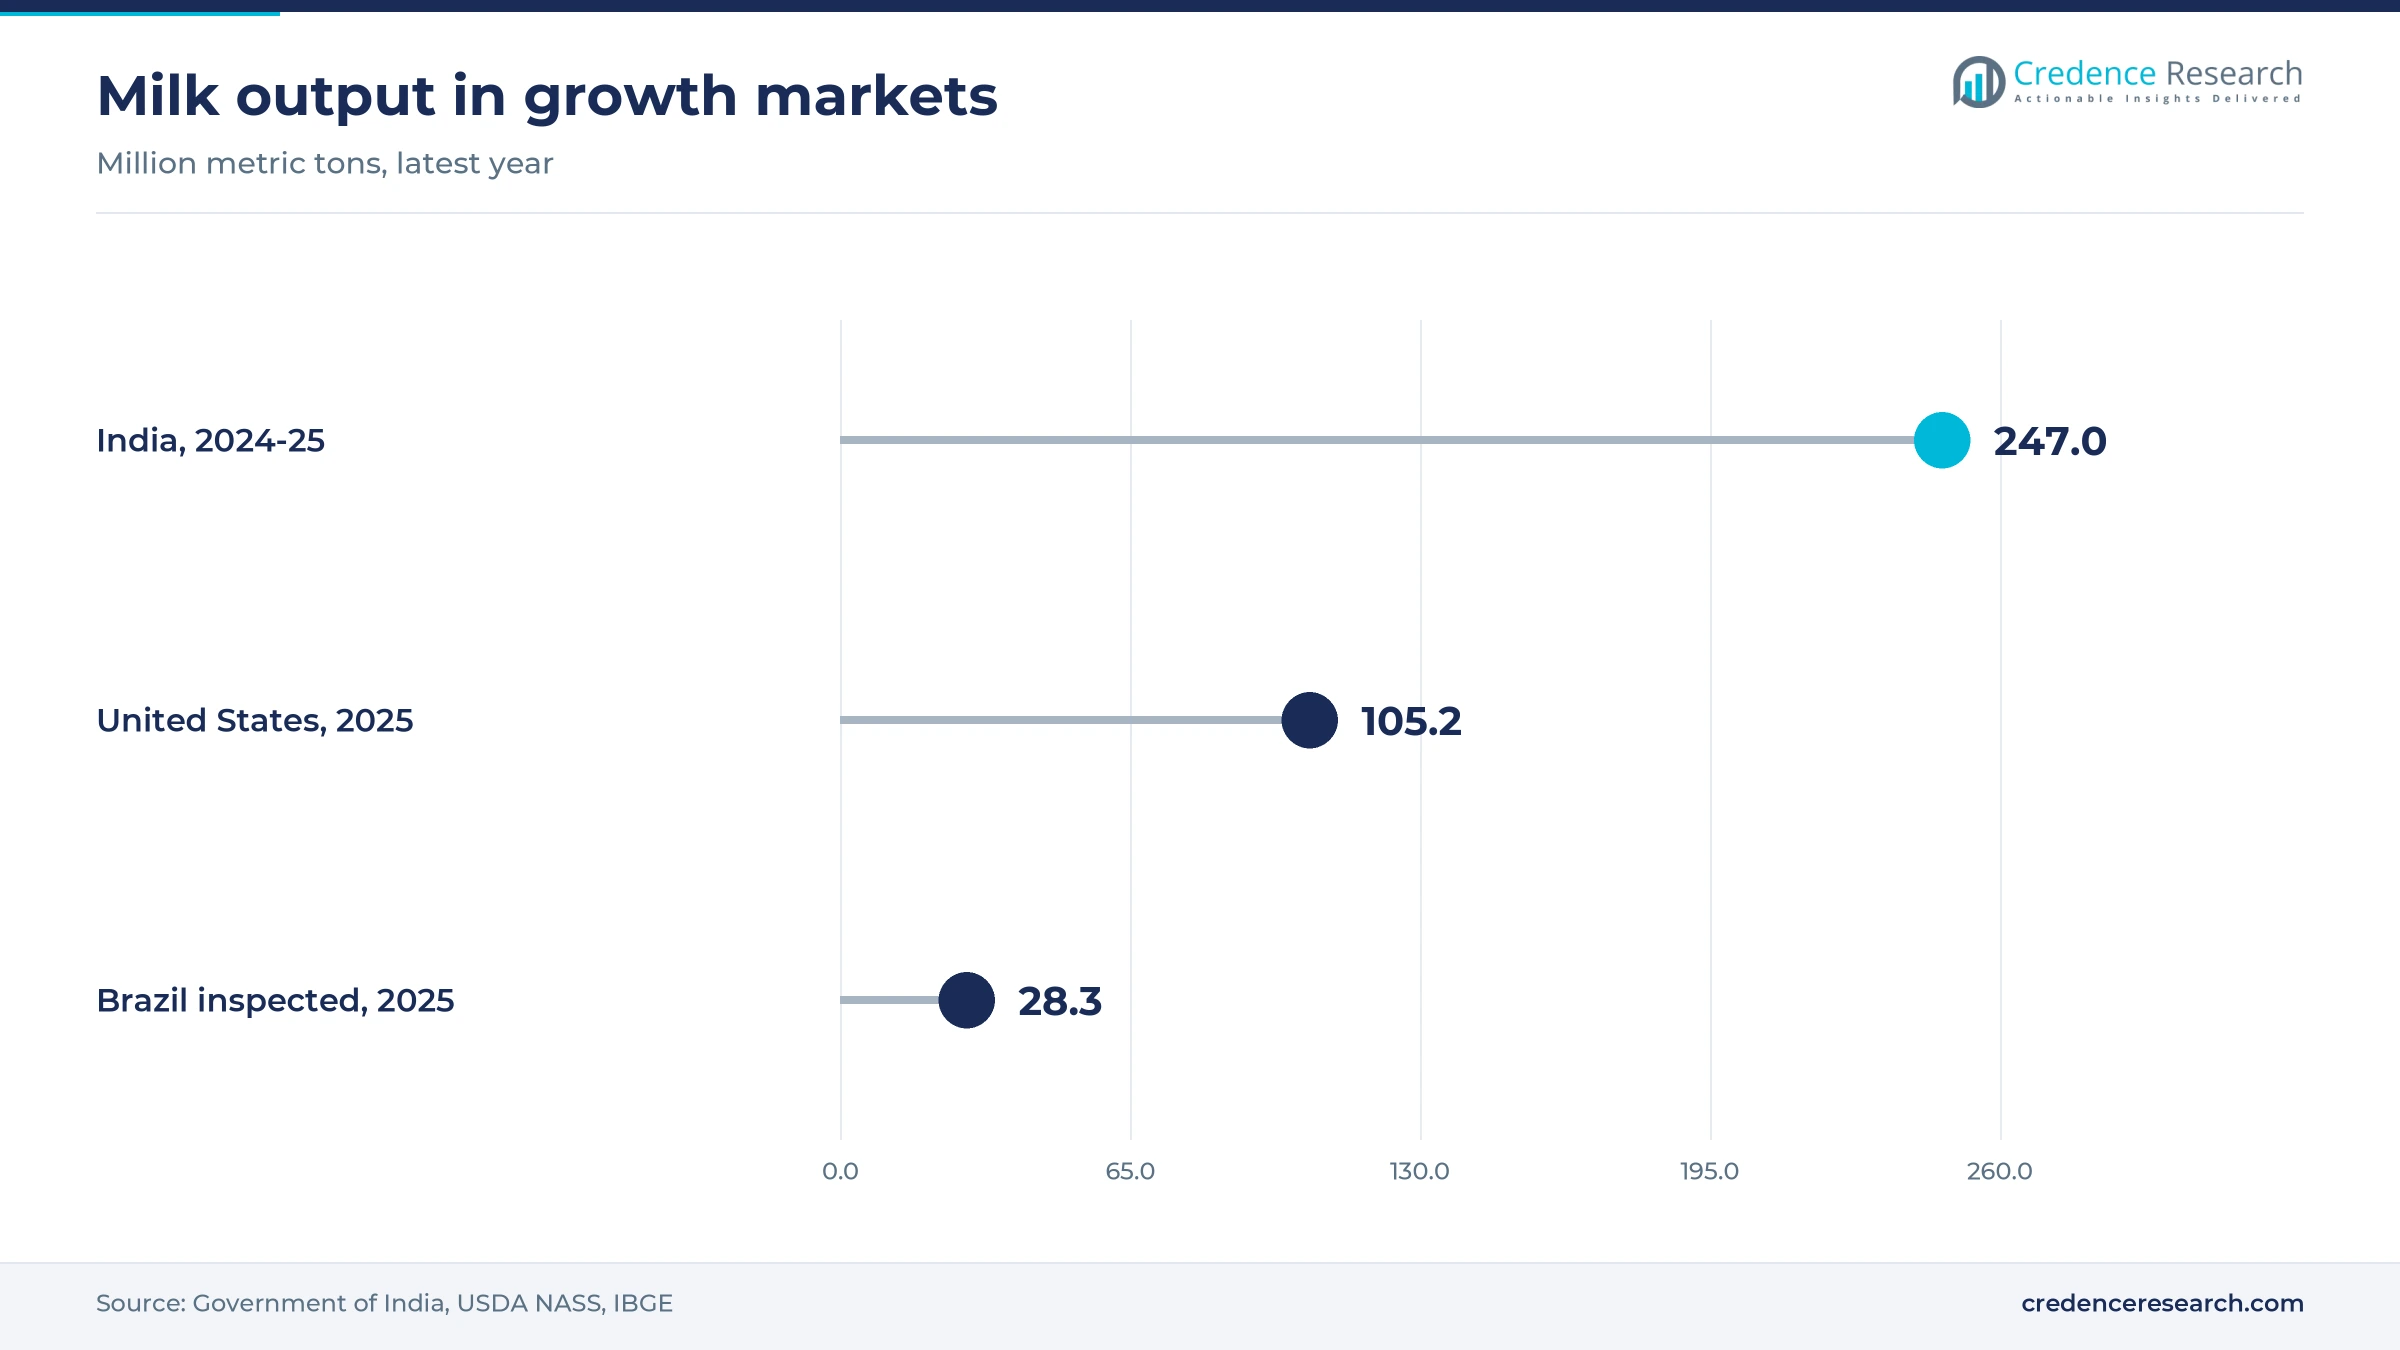
A larger U.S. milking herd adds cows that need treatment for clinical cases and protection at every drying off. U.S. milk production rose 2.6% in 2025 to 232 billion pounds, and the herd averaged 9.50 million cows, up 153,000 head, according to USDA NASS. Output per cow reached 24,390 pounds, and high-yielding cows carry more udder stress around calving. Each added cow brings a dry-off course and a share of clinical cases, so tube and sealant volume rises with herd size. This growth anchors the regional lead of North America, and it favors suppliers with broad U.S. veterinary distribution such as Zoetis, Boehringer Ingelheim and Merck Animal Health.
Why does rising world milk output widen the customer base?
Global milk output keeps rising, and most new volume comes from countries where commercial herds are replacing backyard animals. World milk production was forecast at 992.7 million metric tons in 2025, up 1%, according to FAO figures reported by Dairy Industries International in June 2025. India alone produced more than 247 million metric tons in 2024-25, nearly a quarter of world output, the All India Radio news service reported in March 2026. Organized Indian and Pakistani dairies buy branded tubes and teat dips, while smallholders tend to rely on cheaper generics or none at all. Asia Pacific therefore posts the fastest regional growth, and suppliers with local manufacturing and low-cost generics gain most.
How do case costs justify spending on prevention?
A single case of mastitis costs far more than the products that prevent or treat it, which keeps farm spending resilient. Merck Animal Health material published by Hoard's Dairyman in August 2025 estimates that mastitis costs U.S. producers USD 2 billion a year in losses, and up to USD 444 for one case. Most losses come from discarded milk, lower yield and culling, not from drugs. The same material notes that most environmental cases in early lactation start during the dry period, which shifts budgets toward dry-off sealants and vaccines. Dry-period products therefore grow faster than lactating treatments, while a lactating tube lists at about USD 5.86 in the U.S. market, so even a three-tube course costs a small part of one lost case.
Why do antibiotic sales still underpin the market?
Antibiotics remain the base of the market because no other product cures an established infection, and sales data show no collapse in use. U.S. sales of medically important antimicrobials for food-producing animals rose 16% between 2023 and 2024, the FDA reported on Dec. 5, 2025, although volume stayed 27% below the 2015 peak. Dairy herds draw on that supply of veterinary antibiotics, and intramammary tubes are a steady part of that demand. Antibiotics held 58.0% of product value in 2025, so suppliers of cephalosporin and penicillin tubes keep a stable base while prevention products grow on top of it. The main risk for these suppliers comes from regulators rather than from farm demand.
Selective dry-off, sensors and vaccines reset demand
Selective dry-cow therapy is shifting spend toward teat sealants
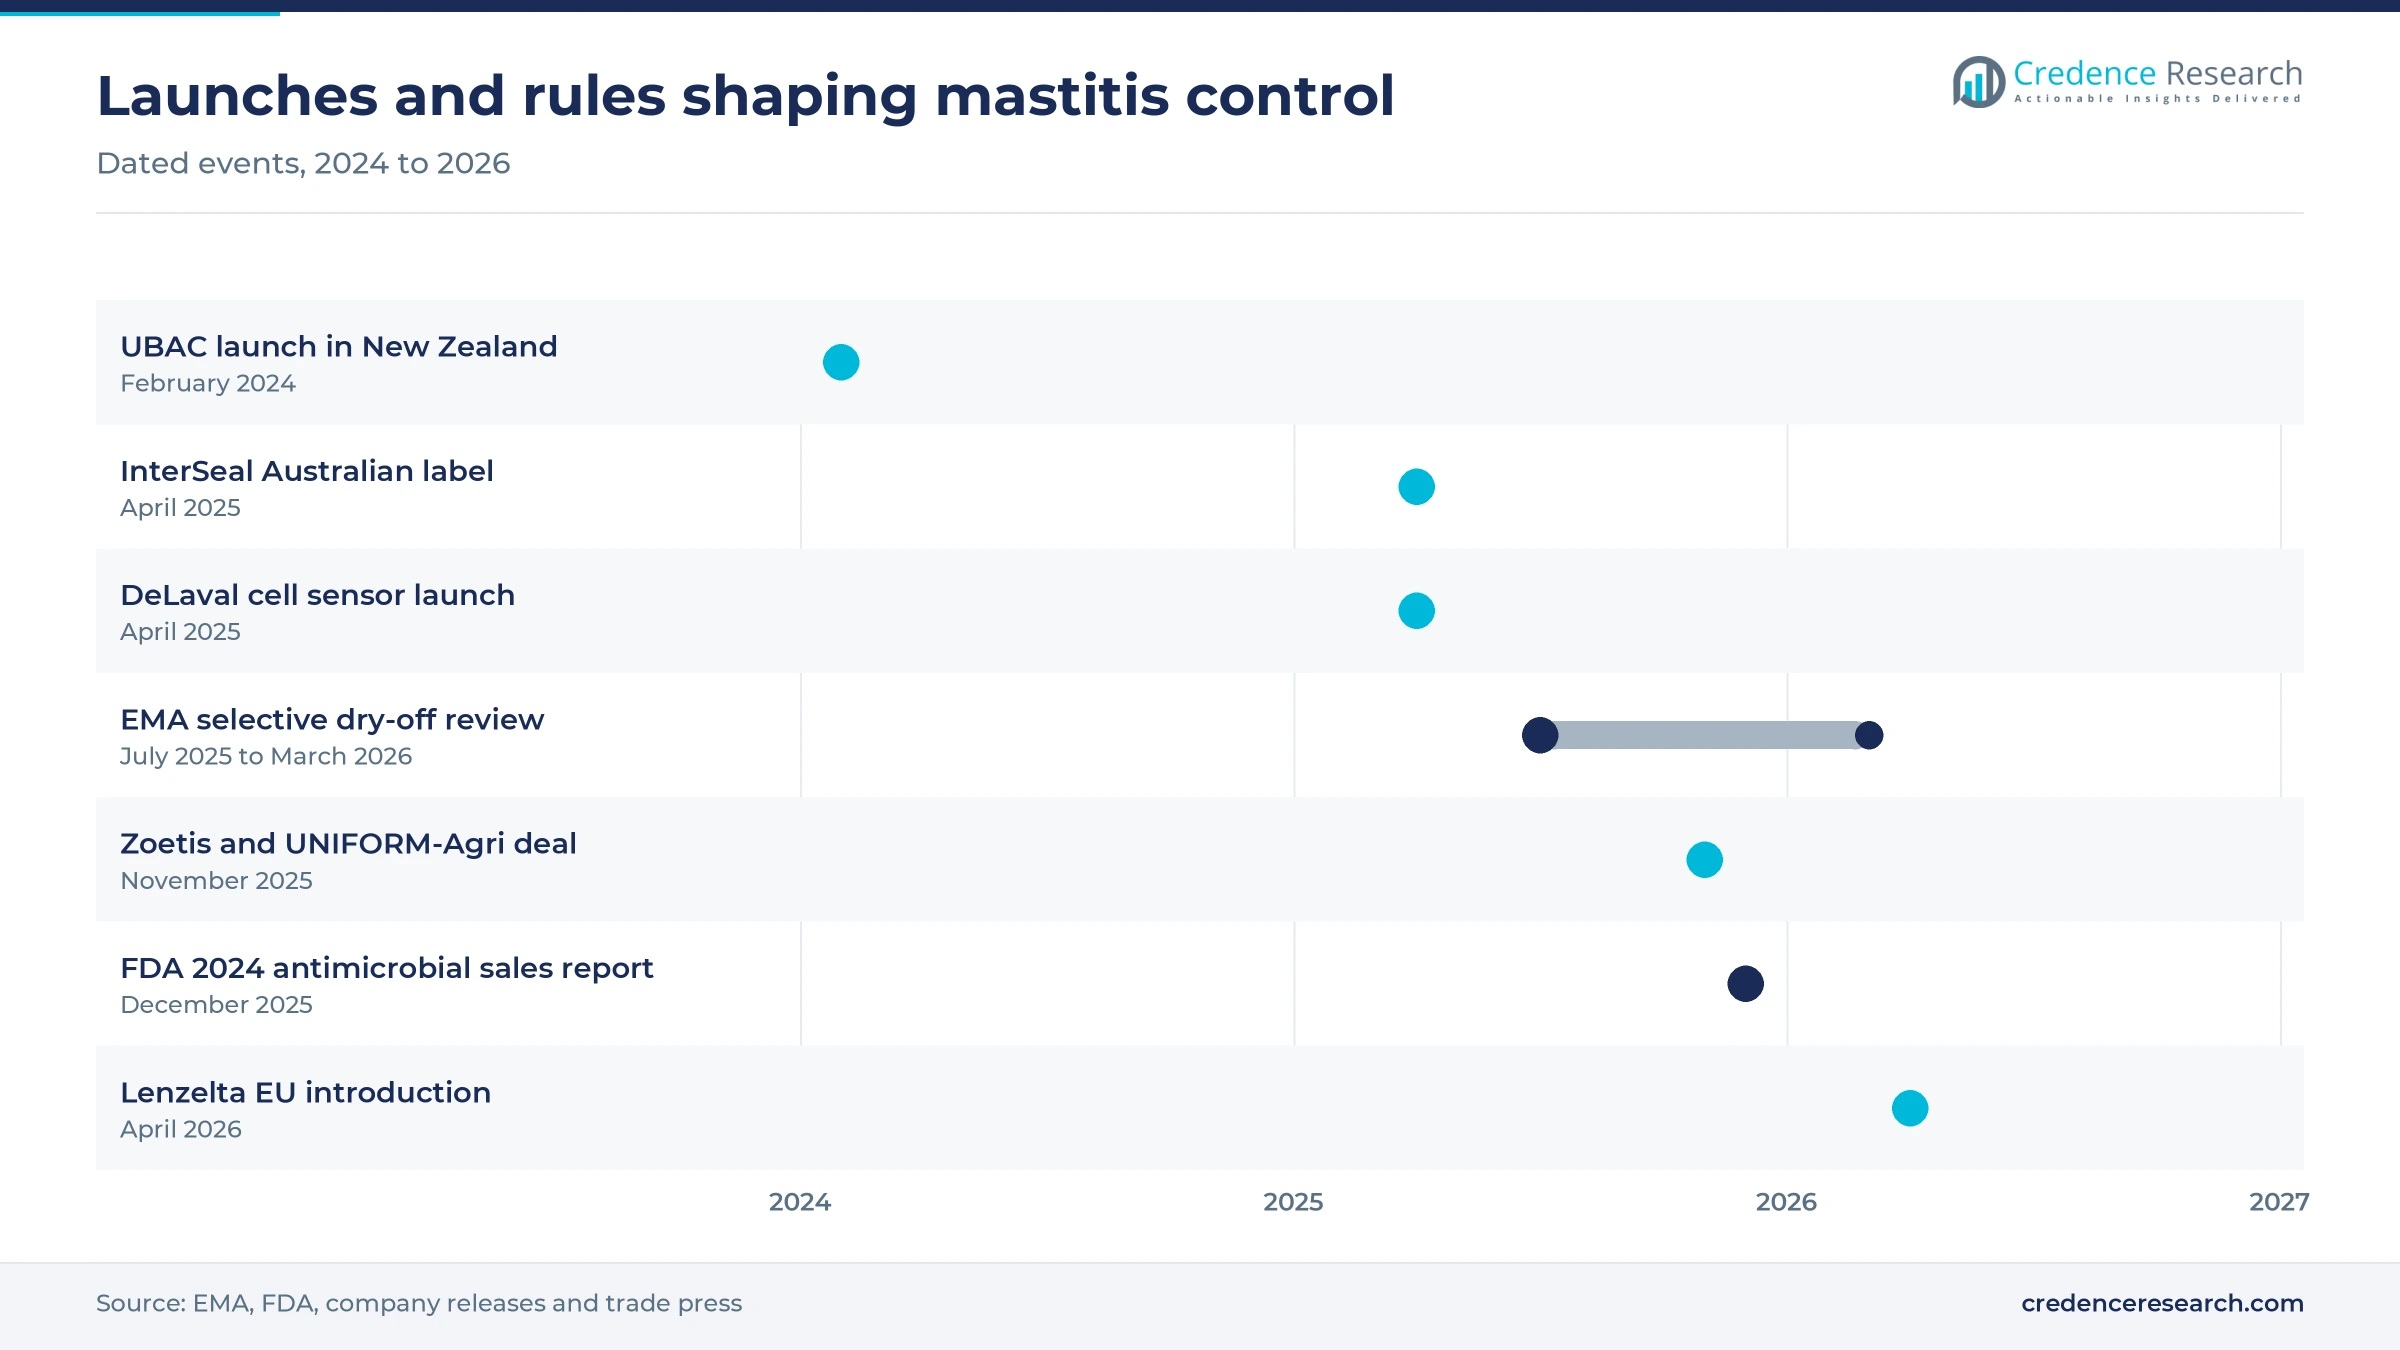
European dairies are shifting from treating every cow at drying off to treating only infected cows or quarters, which moves spending from antibiotic tubes to sealants and testing. Regulation (EU) 2019/6 took effect in January 2022 and ended blanket dry-off in the bloc, according to guidance from Ireland's Department of Agriculture, Food and the Marine. In March 2026 the EMA veterinary committee advised that quarter-based selective therapy reduces antibiotic use without harming animal health, after a German request in July 2025. The committee also tied the approach to accurate diagnostics and teat sealants. Sealant makers gain, while suppliers that sell mainly dry-cow antibiotics in Europe lose volume per cow.
In-line cell sensors are emerging as the trigger for treatment
Robotic and parlor milking equipment is adding somatic cell sensors, so treatment decisions rest more on data and less on visible clots. DeLaval introduced its BioSensors Milk Cell Analysis unit with the VMS V300 robot in April 2025, using optical counts of stained cells. Merck Animal Health already bundles SenseHub Dairy monitoring with its tubes and vaccines in the M-Power portfolio. In November 2025, Zoetis agreed with UNIFORM-Agri to place CLARIFIDE Plus genetic results inside herd management software, which UNIFORM-Agri says serves more than 18,000 farm accounts in over 50 countries. Earlier detection lifts subclinical treatment, which grows at 7.5% a year, and favors suppliers that link products to data.
Where do dry-off vaccines open a new revenue line?
Vaccines given at drying off open a revenue line that does not depend on antibiotic rules, and new products are reaching European herds. Boehringer Ingelheim said on April 13, 2026 that Lenzelta, a two-dose vaccine against Staphylococcus aureus and E. coli, would be available in several EU countries from April 2026. HIPRA's UBAC cut clinical cases caused by Streptococcus uberis by 50% in a large field study, the Danish newspaper Landbrugsavisen reported in August 2020. Vaccines grow at 8.8% a year from a small base. Herds with recurring Staphylococcus aureus or coliform problems are the first buyers, and suppliers with field trial data win veterinary recommendations.
Why is Brazil a supply gap for branded udder health products?
Brazil offers an opening for suppliers that can sell branded tubes and sealants into a fast-formalizing dairy chain. Inspected dairies acquired about 27.51 billion liters of milk in 2025, the highest volume on record, according to IBGE preliminary data. Milk that enters inspected plants is tested for quality and residues, which rewards farms that treat cases properly and observe withdrawal times. Vetoquinol signed an agreement in April 2019 to buy Clarion Biociencias, a Brazilian laboratory focused on cattle, which shows how foreign suppliers enter through local makers. Latin America grows at 7.8% a year, and local manufacturing keeps prices within reach of mid-size farms.
Stewardship, shrinking herds and weak cell limits weigh
How do European antibiotic targets squeeze tube volumes?
A 5% rise in 2024 after years of decline puts pressure on member states to tighten national antibiotic targets, which limits tube sales per cow. The second ESUAvet report, published by the EMA in December 2025, recorded that rise in veterinary antimicrobial sales for food-producing animals from 2023, and these animals took 98% of veterinary sales. Generic tube makers that sell mainly in Europe are most exposed, unless they add sealants or vaccines.
Why do shrinking herds in Europe and China cap volume?
Fewer cows in two large dairy regions cap the number of dry-off courses and treated cases. The EU dairy herd fell 1.1% in 2025 to about 19.02 million head, AHDB reported, as farms exit on cost and environmental rules. China's liquid milk output fell 2.8% in 2024 to 27.4 million tons, Yicai Global reported in May 2025, citing the China Dairy Industry Association. Suppliers with heavy exposure to these regions face flat volume and must win share through pricing or new products.
How do generic tubes and private labels hold prices down?
Intramammary tubes and sealants are mature products with many approved generics, so price competition is strong. VetoSeal, a 65% bismuth subnitrate sealant sold in Canada by Vetoquinol, is manufactured by Norbrook, according to its product listing on Drugs.com. Contract and private-label supply lets distributors switch suppliers with little cost. The result is that branded suppliers defend prices through trial data and service, while smaller farms in price-sensitive markets choose the cheapest tube that their veterinarian accepts.
Why does the U.S. cell count limit weaken subclinical demand?
A loose U.S. limit on somatic cells in bulk milk reduces the pressure on farms to find and treat hidden infections. The Grade A Pasteurized Milk Ordinance allows 750,000 cells per milliliter, while the American Veterinary Medical Association supports a limit of 400,000, the level the EU already applies to imports, according to USDA AMS export guidance. Farms shipping only to U.S. plants face no legal trigger to treat subclinical cows, so this segment depends on processor quality premiums.
North America leads, Asia Pacific grows fastest
| Region | Value, 2025 (USD billion) | Share, 2025 | CAGR, 2026–2035 |
|---|---|---|---|
| North America | 0.91 | 37.0% | 6.6% |
| Europe | 0.74 | 30.0% | 6.3% |
| Asia Pacific | 0.54 | 22.0% | 8.5% |
| Latin America | 0.17 | 7.0% | 7.8% |
| Middle East & Africa | 0.10 | 4.0% | 7.7% |
North America leads on large herds and branded tubes
North America held 37.0% of 2025 value and grows at 6.6% a year. The United States accounts for most regional value, since its 9.50 million milk cows dwarf the Canadian and Mexican commercial herds. U.S. dairies buy branded tubes, sealants and coliform vaccines through veterinary distributors, and the national portfolios of Zoetis, Boehringer Ingelheim and Merck Animal Health compete for the same dry-off programs. Growth slows because selective dry-off is spreading on large farms, which trims tubes per cow even as herds expand.
Europe shifts its spend from tubes to sealants and vaccines
Europe held 30.0% of 2025 value and grows at 6.3% a year, the slowest rate of any region. A shrinking herd and the end of blanket dry-off limit antibiotic volume, as described above. European farms still pay for quality, because milk payment and export rules punish high cell counts. Value therefore moves toward sealants, cell-count testing and vaccines such as the Lenzelta launch noted above, which favors Boehringer Ingelheim, HIPRA and the sealant makers over generic tube suppliers.
Asia Pacific grows fastest on Indian volume and Oceania vaccines
Asia Pacific held 22.0% of 2025 value and grows at 8.5% a year, the fastest of any region. India is the largest milk producer, as noted above, but only organized dairies buy branded products, so value per animal stays low. New Zealand and Australia run large pasture herds with routine dry-off programs, and the UBAC launch noted above gives pasture herds a Streptococcus uberis vaccine. China adds demand from large confinement farms, although its falling milk output slows that growth.
Latin America grows on Brazil's inspected milk supply
Latin America held 7.0% of 2025 value and grows at 7.8% a year. Brazil carries most regional demand, and the rise in inspected milk volumes described above draws more farms into quality testing and residue control. Argentina, Mexico and Colombia add commercial herds that use dry-off tubes and sealants. Local manufacturing and price-sensitive buyers keep generic products important, so value grows faster than in Europe but from lower prices per cow.
Middle East and Africa depend on large integrated dairies
Middle East & Africa held 4.0% of 2025 value and grows at 7.7% a year. Demand sits in large integrated dairies in Saudi Arabia, Israel and South Africa, which run high-yielding herds with veterinary programs. Smallholder herds across most of Africa buy few branded products. Public data on mastitis product use in this region are thin, so this share is a Credence Research estimate built from herd structure rather than reported sales.
Vaccine launches and dry-off advice in 2024 to 2026
| Development | Status and market relevance |
|---|---|
| In February 2024, HIPRA launched its UBAC vaccine against Streptococcus uberis in New Zealand through Agilis Vet. | Launch completed; it extends a vaccine first released in Europe in 2018 to a large pasture-based dairy market. |
| In April 2025, DeLaval introduced its BioSensors Milk Cell Analysis unit with the VMS V300 milking robot. | Launch completed; the sensor reads somatic cells during milking and supports cow-level treatment decisions. |
| In November 2025, Zoetis and UNIFORM-Agri agreed to place CLARIFIDE Plus genetic results inside herd management software. | Partnership announced; development was set to start at the end of 2025, with data offered on a cloud platform. |
| In March 2026, the EMA veterinary committee adopted scientific advice on quarter-based selective dry-cow therapy. | Advice adopted; the committee said the approach can be reflected in the product information of dry-cow antibiotics. |
| In April 2026, Boehringer Ingelheim announced that its Lenzelta mastitis vaccine would be available in several EU countries. | Introduction announced; availability stated from April 2026 in unnamed EU countries, and the two-dose vaccine targets Staphylococcus aureus and E. coli and is given at drying off. |
Cephalosporins, bismuth seals and core antigens
- Intramammary cephalosporins and penicillins deliver cephapirin, ceftiofur, cefalonium or cloxacillin straight into the quarter, which gives high drug levels at the site of infection.
- Bismuth subnitrate internal teat sealants form a physical plug in the teat canal during the dry period, which keeps bacteria out without an antibiotic.
- Core-antigen and pathogen-specific vaccines prime the cow against E. coli, Staphylococcus aureus or Streptococcus uberis, which reduces the severity and number of cases.
- In-line somatic cell sensors count cells in each milking, so farmers can treat infected cows early and leave healthy cows untreated at dry-off.
Need a Custom Version of This Report?
Tailor the scope, geography, or segments to your exact requirements.
- Custom geography or segment scope
- Direct access to our analyst team
Tube portfolios and vaccine pipelines set positions
Companies compete on the breadth of their tube and sealant ranges, on vaccine trial data and on the reach of their veterinary sales forces. Zoetis, Boehringer Ingelheim and Merck Animal Health sell complete dairy programs in the United States, and each pairs lactating and dry-cow tubes with sealants, vaccines or anti-inflammatories so that a herd can buy one protocol. Elanco sells sealants such as InterSeal in Australia and other markets. Norbrook and Vetoquinol compete on generic and private-label tubes and sealants, a pattern that holds prices low in mature markets. HIPRA and Boehringer Ingelheim, both established makers of animal vaccines, lead the newer vaccine segment in Europe, while DeLaval shapes demand through milking robots, sensors and teat hygiene products. Selective dry-off favors suppliers that can offer diagnostics advice and sealants together, because herds need both to cut antibiotic use safely.
How is the supply side organized and where do margins sit?
Supply is led by a few animal health companies with full dairy portfolios, namely Zoetis, Boehringer Ingelheim, Merck Animal Health and Elanco, which sell tubes, sealants, vaccines and anti-inflammatories through veterinarians. Generic makers such as Norbrook supply their own brands and private labels, and HIPRA competes as a vaccine specialist. Barriers to entry are residue and withdrawal studies for every tube, regulatory approval country by country and veterinary trust. Margins are thin on old antibiotic tubes and higher on vaccines and branded sealants, where trial data justify a premium.
Companies profiled and their roles in this market
| Company | Type | Role in the market |
|---|---|---|
| Zoetis Inc. | Full-line supplier | Sells Spectramast tubes, Orbeseal teat sealant and J-5 coliform bacterins |
| Boehringer Ingelheim International GmbH | Full-line supplier | Sells ToDAY, ToMORROW, Polymast and Dry-Clox tubes, Lockout sealant, J-Vac and Lenzelta |
| Merck Animal Health (Merck & Co., Inc.) | Full-line supplier | Sells Amoxi-Mast and Orbenin-DC tubes, Bovilis J-5 and Banamine Transdermal |
| Elanco Animal Health Incorporated | Animal health supplier | Sells InterSeal internal teat sealant for dry cows in Australia |
| HIPRA | Vaccine specialist | Sells Startvac and UBAC mastitis vaccines in Europe and New Zealand |
| Norbrook Laboratories Ltd. | Generic manufacturer | Makes dry-cow tubes such as Cepritect and Noroclox and private-label sealants |
| Vetoquinol S.A. | Animal health supplier | Sells VetoSeal bismuth teat sealant for dry cows in Canada |
| DeLaval (Tetra Laval) | Equipment and hygiene supplier | Sells teat dips and disinfectants counted here, plus milk cell sensors that guide treatment |
Prevention products will take share from treatment
Credence Research's view is that prevention products will take a growing share of bovine mastitis spending, while antibiotic tubes keep the largest share but lose volume per cow. The European turn to selective dry-off is the model that other regions will follow more slowly, because it pairs fewer antibiotic courses with more sealants, more testing and more vaccines. Suppliers with vaccine trial data and trusted sealant brands are best placed, while generic tube makers face flat volume. Herd growth in the United States, India and Brazil keeps total value rising. Vaccines will hold a larger slice of bovine mastitis spending by 2035 than in 2025.
Earlier estimate rolled forward and tested on herds
The report uses 2025 as the base year and forecasts to 2035. The 2025 value rolls the earlier Credence Research estimate forward with its own growth rate and tests it against herd numbers from USDA NASS, AHDB and Indian government data, and against U.S. list prices for tubes, sealants and vaccines. Segment and regional shares are Credence Research estimates built from herd structure, product approvals and company portfolios. Sources are official statistics, regulator documents, company releases and distributor price lists; no interviews or surveys were used.
Prevention and Asian herds carry growth to 2035
Bovine mastitis product value is set to rise from USD 2.63 billion in 2026 to USD 4.88 billion by 2035 as herds in the United States, India and Brazil grow and prevention products spread. Vaccines and dry-period products grow faster than lactating treatments, while antibiotic tubes keep the largest share. Europe stays the slowest region because of its shrinking herd and strict antibiotic rules. The forecast assumes no ban on cephalosporin tubes in major markets, and a faster U.S. move to selective dry-off would pull growth toward the downside case. North America keeps the largest regional share of demand through 2035, while Asia Pacific narrows the gap by 2035.
Stewardship rules and herd growth set the range of outcomes
The outcome to 2035 depends on how far selective dry-off spreads beyond Europe and on how quickly herds in India, Brazil and the United States grow. Vaccine uptake is the main upside lever, because each vaccinated cow adds spend without antibiotic restrictions. A downside follows if U.S. buyers adopt selective dry-off fast while prices for generic tubes fall, and an upside needs broad vaccine use and faster formalization of Asian dairying.
| Scenario | CAGR, 2026–2035 | Value, 2035 | What has to hold |
|---|---|---|---|
| Downside | 5.6% | USD 4.30 billion | Selective dry-off spreads fast in the U.S. and generic tube prices fall |
| Base | 7.10% | USD 4.88 billion | Herd growth and sealant uptake continue at the current pace |
| Upside | 8.3% | USD 5.40 billion | Dry-off vaccines reach wide use and Asian dairies formalize faster |
Frequently Asked Questions
How big is the bovine mastitis market?
How large is the U.S. mastitis market?
Which product holds the largest share?
Which product grows fastest?
How do EU antibiotic rules affect demand?
Which region grows fastest?
Who are the leading companies?
What does a dry-off treatment cost per cow?
Table of Content
Chapter 1 Market Segmentation
- 1.1 Segmentation Framework
- 1.1.1 Product and Service Classification
- 1.1.2 Application and End-Use Classification
- 1.1.3 Technology and Solution Classification
- 1.1.4 Customer and Distribution Channel Classification
- 1.1.5 Geographic Segmentation
- 1.1.6 Market Segment Definitions and Boundaries
- 1.2 By Product
- 1.2.1 Antibiotics
- 1.2.2 Vaccines
- 1.2.3 Anti-inflammatories
- 1.2.4 Teat Sealants & Others
- 1.3 By Type
- 1.3.1 Clinical Mastitis
- 1.3.2 Subclinical Mastitis
- 1.4 By Route of Administration
- 1.4.1 Intramammary
- 1.4.2 Systemic
- 1.5 By Therapy
- 1.5.1 Lactating Period
- 1.5.2 Dry Period
Chapter 2 Introduction
- 2.1 Report Objectives and Scope
- 2.2 Product Definition and Industry Terminology
- 2.3 Market Inclusions and Exclusions
- 2.4 Research Process
- 2.4.1 Primary Research and Expert Interviews
- 2.4.2 Secondary Research and Source Review
- 2.4.3 Top-Down and Bottom-Up Estimation
- 2.4.4 Data Triangulation and Verification
- 2.5 Market Size Measurement Basis
- 2.5.1 2025: USD 2.46 billion → 2035: USD 4.88 billion
- 2.6 Historical and Forecast Reference Periods
- 2.6.1 Historical Period: 2018-2025
- 2.6.2 Base Year: 2025
- 2.6.3 Forecast Period: 2025-2035
- 2.7 Research Assumptions and Limitations
Chapter 3 Executive Summary
- 3.1 Market Snapshot and Key Findings
- 3.2 Base-Year Market Size, 2025
- 3.3 Forecast Market Size, 2035
- 3.4 Revenue and Volume Growth Outlook
- 3.5 Key Demand and Supply Indicators
- 3.6 Leading Market Segments
- 3.7 Fastest-Growing Market Opportunities
- 3.8 Regional Performance Highlights
- 3.9 Technology and Industry Transformation
- 3.10 Competitive Landscape Summary
- 3.11 Analyst View and Strategic Implications
Chapter 4 Global Bovine Mastitis Market Trends and Developments
- 4.1 Historical Industry Development, 2018-2025
- 4.2 Recent Market Trends and Developments
- 4.3 Demand and Customer Behavior Trends
- 4.4 Technology and Product Innovation
- 4.5 Artificial Intelligence, Automation and Digitalization
- 4.6 Local Manufacturing and Supply Chain Realignment
- 4.7 Industry Partnerships, Mergers and Acquisitions
- 4.8 Sustainability and Circular Economy Developments
- 4.9 Government and Private Sector Investment Trends
- 4.10 Emerging Business Models and Commercialization
- 4.11 Industry Developments and Announcements
Chapter 5 Global Bovine Mastitis Market Production, Supply and Demand Analysis
- 5.1 Demand Trend and Consumption Analysis, 2018-2025
- 5.2 Demand Forecast, 2025-2035
- 5.3 Production and Output Trend, 2018-2025
- 5.4 Production and Output Forecast, 2025-2035
- 5.5 Installed Capacity and Capacity Utilization
- 5.6 Company-Wise Production Plants and Statistics
- 5.6.1 Installed Production Capacity
- 5.6.2 Actual Production
- 5.6.3 Planned Capacity and Expansion Targets
- 5.7 Supply Chain Structure and Procurement Trends
- 5.8 Supply-Demand Gap and Bottlenecks
- 5.9 Import Dependence and Sourcing Structure
- 5.10 Contract Manufacturing and Outsourcing
- 5.11 Regional Supply and Demand Concentration
Chapter 6 Global Bovine Mastitis Market Pricing Analysis
- 6.1 Pricing Structure and Measurement
- 6.2 Historical Pricing Trends, 2018-2025
- 6.3 Pricing Outlook, 2025-2035
- 6.4 Average Selling Price and Unit Economics
- 6.5 Pricing by Product and Market Segment
- 6.6 Geographic Pricing Differences
- 6.7 Key Input, Energy, Labor and Logistics Costs
- 6.8 Contract Pricing and Purchasing Models
- 6.9 Pricing Sensitivity and Competitive Positioning
- 6.10 Price, Margin and Profitability Implications
Chapter 7 Global Bovine Mastitis Market Dynamics
- 7.1 Market Growth Drivers
- 7.1.1 Demand-Side Drivers
- 7.1.2 Technology and Innovation Drivers
- 7.1.3 Infrastructure and Investment Drivers
- 7.1.4 Regulatory and Policy Drivers
- 7.2 Market Restraints
- 7.2.1 Cost and Affordability Constraints
- 7.2.2 Technology and Adoption Barriers
- 7.2.3 Supply Chain and Operational Constraints
- 7.3 Market Challenges
- 7.3.1 Competitive Pressure and Margin Erosion
- 7.3.2 Skills, Infrastructure and Implementation Gaps
- 7.4 Emerging Market Opportunities
- 7.5 Market Dynamics Impact and Time-Horizon Assessment
Chapter 8 Global Bovine Mastitis Value Chain Analysis
- 8.1 Industry Value Chain Overview
- 8.2 Upstream Suppliers and Critical Inputs
- 8.3 Technology and Component Providers
- 8.4 Manufacturing or Service Delivery
- 8.5 Distribution, Channel Partners and Integrators
- 8.6 Downstream Applications and End Users
- 8.7 Value Addition and Profit Pools
- 8.8 Vertical Integration and Outsourcing
- 8.9 Supplier Concentration and Risk
- 8.10 Supply Chain Localization and Resilience
Chapter 9 Global Bovine Mastitis Market Regulations and Policies
- 9.1 Relevant Laws, Standards and Compliance Frameworks
- 9.2 Product, Service, Safety and Quality Requirements
- 9.3 Government Policies, Incentives and Subsidies
- 9.4 Imports, Exports and Trade Barriers
- 9.5 Public Procurement and Local Content Requirements
- 9.6 Environmental and Sustainability Compliance
- 9.7 Upcoming Policy Changes and Market Implications
Chapter 10 Global Bovine Mastitis Market Hotspots and Opportunities
- 10.1 Market Opportunity Mapping and Growth Hotspots
- 10.2 High-Growth Applications and Customer Groups
- 10.3 Underserved Markets and White-Space Opportunities
- 10.4 Emerging Technology and Product Opportunities
- 10.5 New Capacity and Investment Hotspots
- 10.6 Market Entry and Expansion Opportunities
- 10.7 Distribution and Partnership Opportunities
- 10.8 Near-Term and Long-Term Commercial Potential
- 10.9 Opportunity Attractiveness and Execution Risks
Chapter 11 Global Bovine Mastitis Market Outlook, 2025-2035
- 11.1 Market Size and Analysis
- 11.1.1 Revenue (Market Measurement: 2025: USD 2.46 billion → 2035: USD 4.88 billion)
- 11.1.2 Market Volume and Quantity Sold
- 11.1.3 Historical Market Size, 2018-2025
- 11.1.4 Base-Year Market Size, 2025
- 11.2 Market Forecast, 2025-2035
- 11.2.1 Revenue Forecast to 2035
- 11.2.2 Volume Forecast to 2035
- 11.2.3 CAGR and Year-on-Year Growth
- 11.2.4 Incremental Revenue Opportunity
- 11.3 Forecast Assumptions and Scenario Analysis
- 11.3.1 Base-Case Forecast
- 11.3.2 Optimistic and Conservative Scenarios
- 11.3.3 Technology, Pricing and Policy Sensitivities
- 11.4 Market Attractiveness and Growth Outlook
Chapter 12 Global Bovine Mastitis Market Segmentation and Outlook
- 12.1 Segmentation Summary and Market Shares, 2025
- 12.2 Largest and Fastest-Growing Segments
- 12.3 By Product - Market Size and Forecast, 2025-2035
- 12.3.1 Segment Definition and Scope
- 12.3.2 Historical Market Size, 2018-2025
- 12.3.3 Revenue Forecast, 2025-2035
- 12.3.4 Volume Forecast, 2025-2035
- 12.3.5 Base-Year Market Share, 2025
- 12.3.6 Segment CAGR and Growth Drivers
- 12.3.7 Subsegment Market Size and Forecast
- 12.3.7.1 Antibiotics
- 12.3.7.2 Vaccines
- 12.3.7.3 Anti-inflammatories
- 12.3.7.4 Teat Sealants & Others
- 12.3.8 Subsegment Pricing and Adoption Trends
- 12.3.9 Leading Suppliers and Competition
- 12.3.10 Regional Demand and Opportunities
- 12.4 By Type - Market Size and Forecast, 2025-2035
- 12.4.1 Segment Definition and Scope
- 12.4.2 Historical Market Size, 2018-2025
- 12.4.3 Revenue Forecast, 2025-2035
- 12.4.4 Volume Forecast, 2025-2035
- 12.4.5 Base-Year Market Share, 2025
- 12.4.6 Segment CAGR and Growth Drivers
- 12.4.7 Subsegment Market Size and Forecast
- 12.4.7.1 Clinical Mastitis
- 12.4.7.2 Subclinical Mastitis
- 12.4.8 Subsegment Pricing and Adoption Trends
- 12.4.9 Leading Suppliers and Competition
- 12.4.10 Regional Demand and Opportunities
- 12.5 By Route of Administration - Market Size and Forecast, 2025-2035
- 12.5.1 Segment Definition and Scope
- 12.5.2 Historical Market Size, 2018-2025
- 12.5.3 Revenue Forecast, 2025-2035
- 12.5.4 Volume Forecast, 2025-2035
- 12.5.5 Base-Year Market Share, 2025
- 12.5.6 Segment CAGR and Growth Drivers
- 12.5.7 Subsegment Market Size and Forecast
- 12.5.7.1 Intramammary
- 12.5.7.2 Systemic
- 12.5.8 Subsegment Pricing and Adoption Trends
- 12.5.9 Leading Suppliers and Competition
- 12.5.10 Regional Demand and Opportunities
- 12.6 By Therapy - Market Size and Forecast, 2025-2035
- 12.6.1 Segment Definition and Scope
- 12.6.2 Historical Market Size, 2018-2025
- 12.6.3 Revenue Forecast, 2025-2035
- 12.6.4 Volume Forecast, 2025-2035
- 12.6.5 Base-Year Market Share, 2025
- 12.6.6 Segment CAGR and Growth Drivers
- 12.6.7 Subsegment Market Size and Forecast
- 12.6.7.1 Lactating Period
- 12.6.7.2 Dry Period
- 12.6.8 Subsegment Pricing and Adoption Trends
- 12.6.9 Leading Suppliers and Competition
- 12.6.10 Regional Demand and Opportunities
- 12.7 Segment Growth Comparison
- 12.8 Segment Attractiveness and Priority Matrix
Chapter 13 Global Bovine Mastitis Geographic Market Outlook, 2025-2035
- 13.1 Regional Market Size and Share, 2025
- 13.2 Regional Market Forecast, 2025-2035
- 13.3 Regional Pricing, Production and Demand Differences
- 13.4 North America
- 13.4.1 United States
- 13.4.2 Canada
- 13.4.3 Mexico
- 13.5 Europe
- 13.5.1 Germany
- 13.5.2 France
- 13.5.3 Italy
- 13.5.4 United Kingdom
- 13.5.5 Spain
- 13.5.6 Poland
- 13.5.7 Russia
- 13.5.8 Netherlands
- 13.5.9 Belgium
- 13.5.10 Sweden
- 13.5.11 Denmark
- 13.5.12 Norway
- 13.5.13 Rest of Europe
- 13.6 Asia Pacific
- 13.6.1 China
- 13.6.2 India
- 13.6.3 Japan
- 13.6.4 South Korea
- 13.6.5 Thailand
- 13.6.6 Indonesia
- 13.6.7 Vietnam
- 13.6.8 Malaysia
- 13.6.9 Australia
- 13.6.10 Rest of Asia Pacific
- 13.7 Latin America
- 13.7.1 Brazil
- 13.7.2 Argentina
- 13.7.3 Colombia
- 13.7.4 Chile
- 13.7.5 Rest of Latin America
- 13.8 Middle East
- 13.8.1 Saudi Arabia
- 13.8.2 United Arab Emirates
- 13.8.3 Turkey
- 13.8.4 Israel
- 13.8.5 Iran
- 13.8.6 Rest of the Middle East
- 13.9 Africa
- 13.9.1 South Africa
- 13.9.2 Egypt
- 13.9.3 Nigeria
- 13.9.4 Morocco
- 13.9.5 Rest of Africa
- 13.10 Regional Investment, Policy and Supply Chain Differences
- 13.11 Regional Competitive Landscape
- 13.12 Geographic Growth Hotspots
Chapter 14 Global Bovine Mastitis Technology, Innovation and Sustainability Outlook
- 14.1 Technology Landscape and Maturity
- 14.2 Product, Process and Service Innovation
- 14.3 AI, Automation and Digital Tools in the Industry
- 14.4 Technology Adoption and Performance Benchmarking
- 14.5 Innovation Pipeline and R&D Investment
- 14.6 Patent and Intellectual Property Trends
- 14.7 Energy Efficiency and Resource Management
- 14.8 Sustainability, Recycling and Circularity
- 14.9 Technology Roadmap, 2025-2035
- 14.10 Risks of Obsolescence and Technology Substitution
Chapter 15 Global Bovine Mastitis Market Key Strategic Imperatives
- 15.1 Growth and Market Entry Priorities
- 15.2 High-Return Products and Segments
- 15.3 Pricing, Profitability and Cost Optimization
- 15.4 Technology Investment and Product Differentiation
- 15.5 Supply Chain Localization and Resilience
- 15.6 Distribution and Customer Acquisition
- 15.7 Partnership, Acquisition and Capacity Strategy
- 15.8 Regional Expansion Priorities
- 15.9 Short-, Medium- and Long-Term Actions
Chapter 16 Competition Outlook
- 16.1 Industry Competition Characteristics
- 16.2 Market Structure and Concentration
- 16.3 Market Share and Competitive Positioning, 2025
- 16.4 Company-Wise Revenue and Product Benchmarking
- 16.5 Production and Service Capacity Benchmarking
- 16.6 Technology, Pricing and Differentiation
- 16.7 Regional Footprint and Distribution Strength
- 16.8 Mergers, Acquisitions and Strategic Alliances
- 16.9 New Entrants and Competitive Threats
- 16.10 Porter's Five Forces and Industry Attractiveness
- 16.11 Competitive Outlook, 2025-2035
Chapter 17 Company Profiles
- 17.1 Company Coverage and Selection Criteria
- 17.2 Zoetis Inc.
- 17.2.1 Business Description
- 17.2.2 Company Ownership and Geographic Presence
- 17.2.3 Product and Service Portfolio
- 17.2.4 Manufacturing and Operating Footprint
- 17.2.5 Production Capacity and Expansion Plans
- 17.2.6 Financial Performance and Investment
- 17.2.7 Market Share and Competitive Position
- 17.2.8 Technology and Innovation Capabilities
- 17.2.9 Strategic Alliances or Partnerships
- 17.2.10 Recent Developments
- 17.2.11 Growth Strategy and Outlook
- 17.3 Boehringer Ingelheim International GmbH
- 17.4 Merck Animal Health (Merck & Co., Inc.)
- 17.5 Elanco Animal Health Incorporated
- 17.6 HIPRA
- 17.7 Norbrook Laboratories Ltd.
- 17.8 Vetoquinol S.A.
- 17.9 DeLaval (Tetra Laval)
- 17.10 Other Relevant Market Participants
Note: Every listed company is profiled on the structure shown under the first company. The company list is preliminary and may change based on research findings, market developments, data availability and client requirements.
Chapter 18 Disclaimer
- 18.1 Research and Forecast Disclaimer
- 18.2 Data Source and Estimation Limitations
Note: The depth of individual sections depends on data availability for this market. Volume, capacity, trade and other unit-based metrics are included where applicable.