
Aging populations push demand for elderly care services
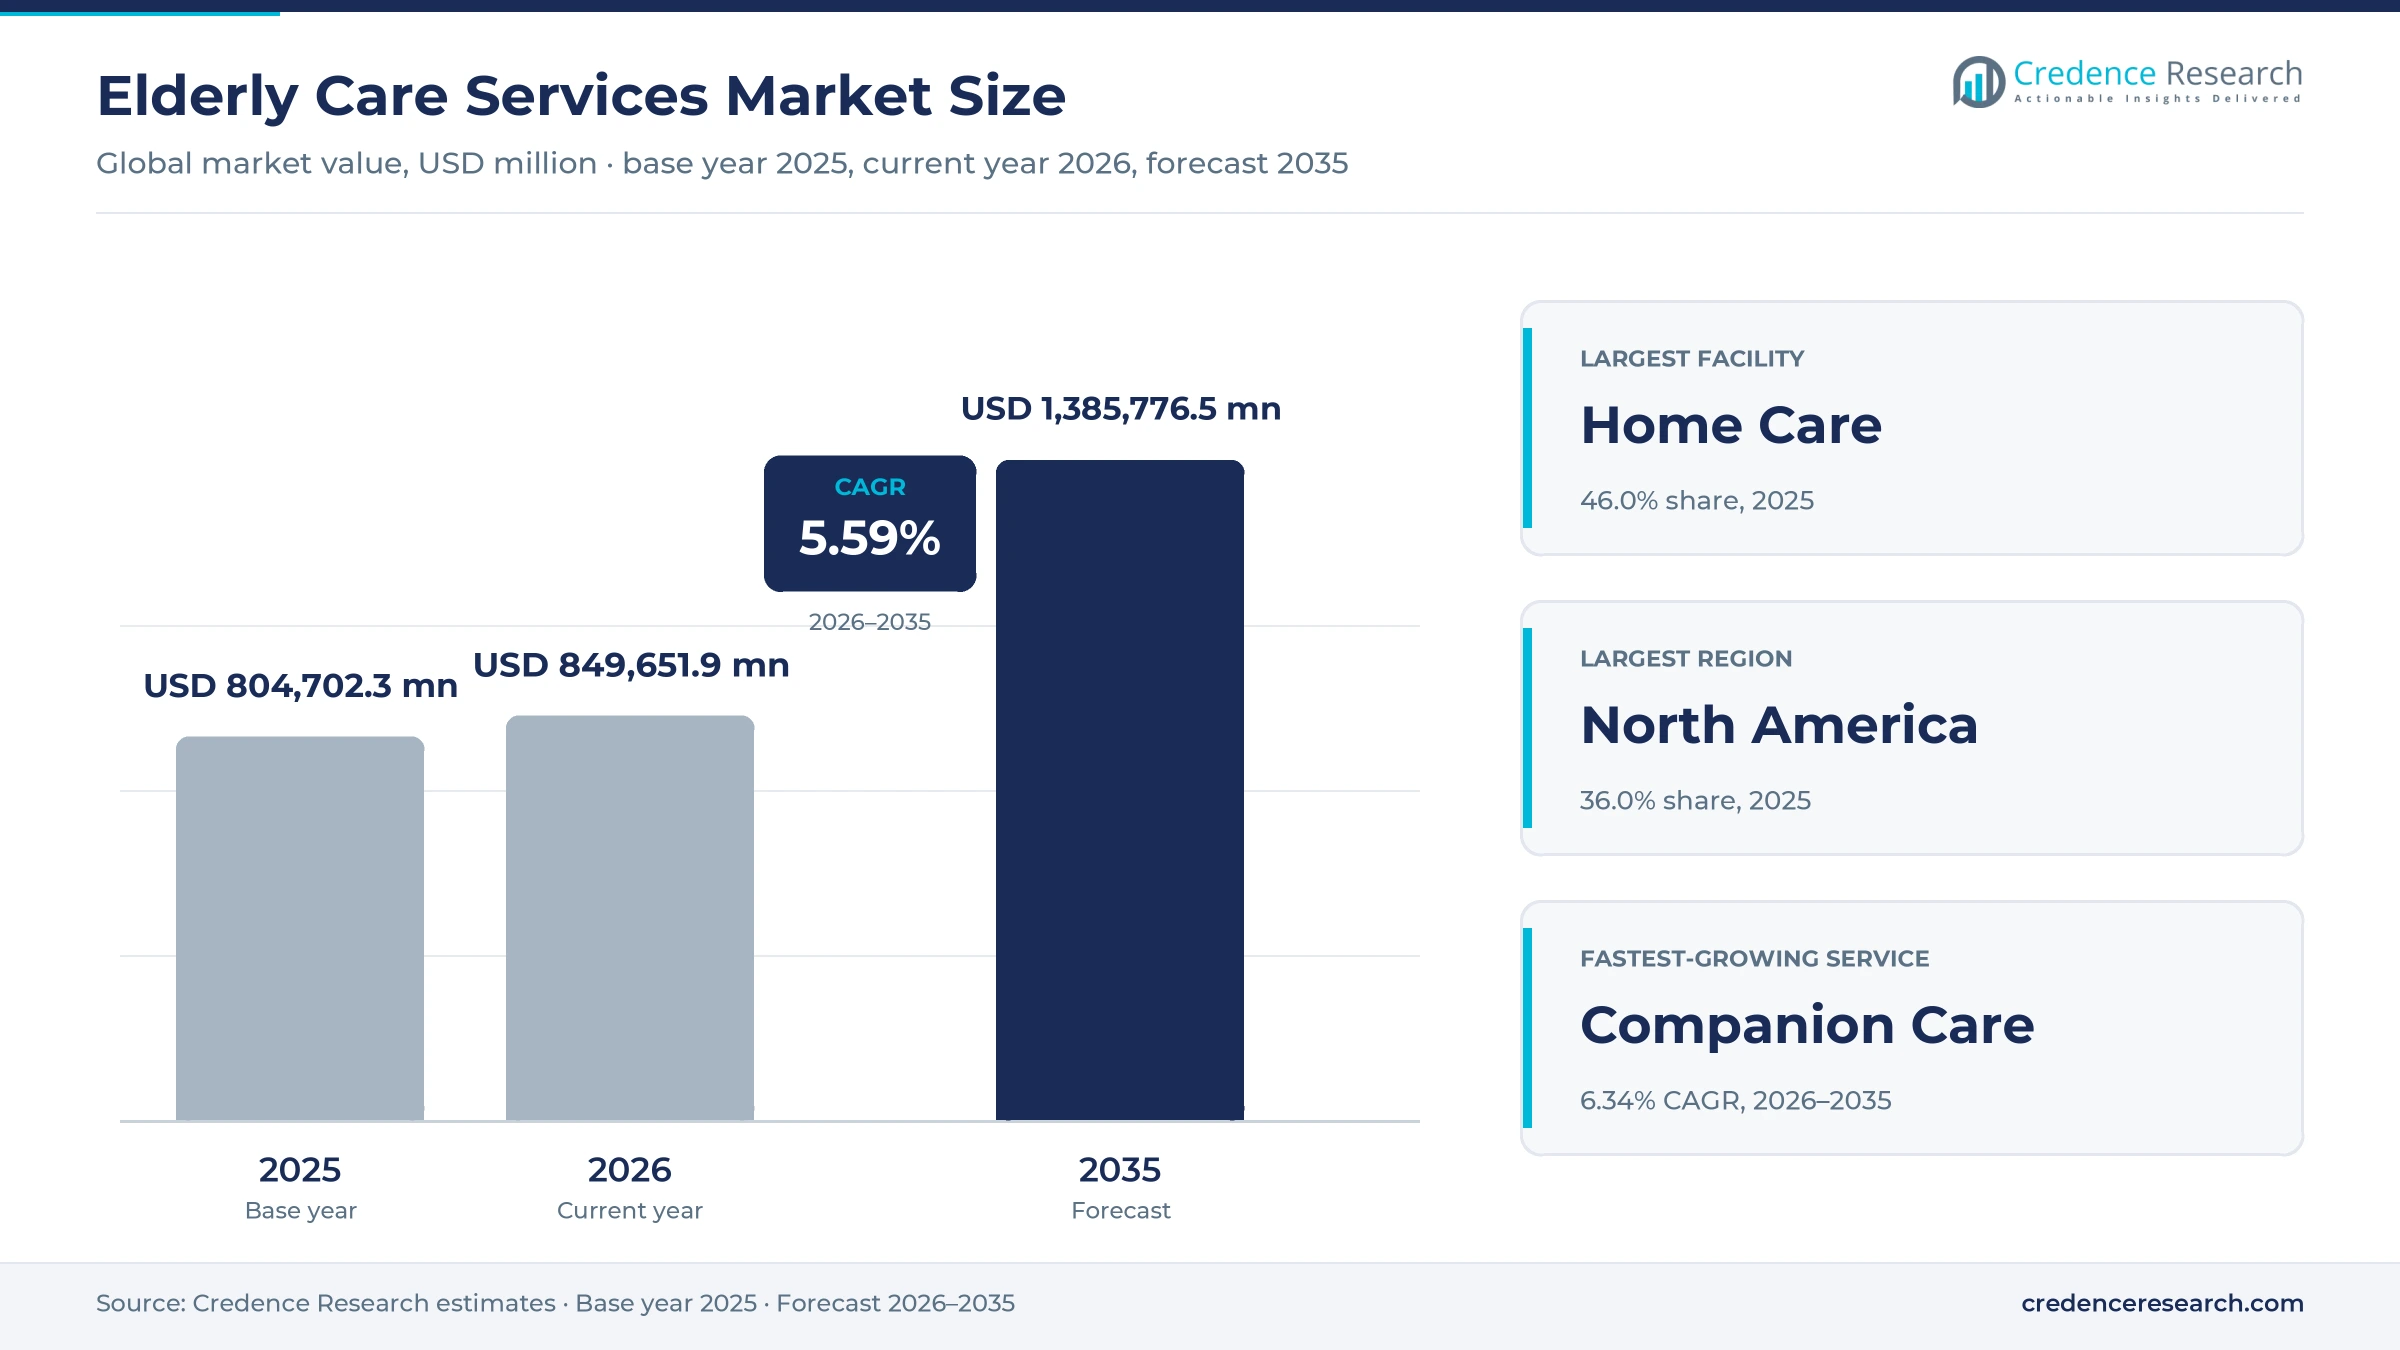
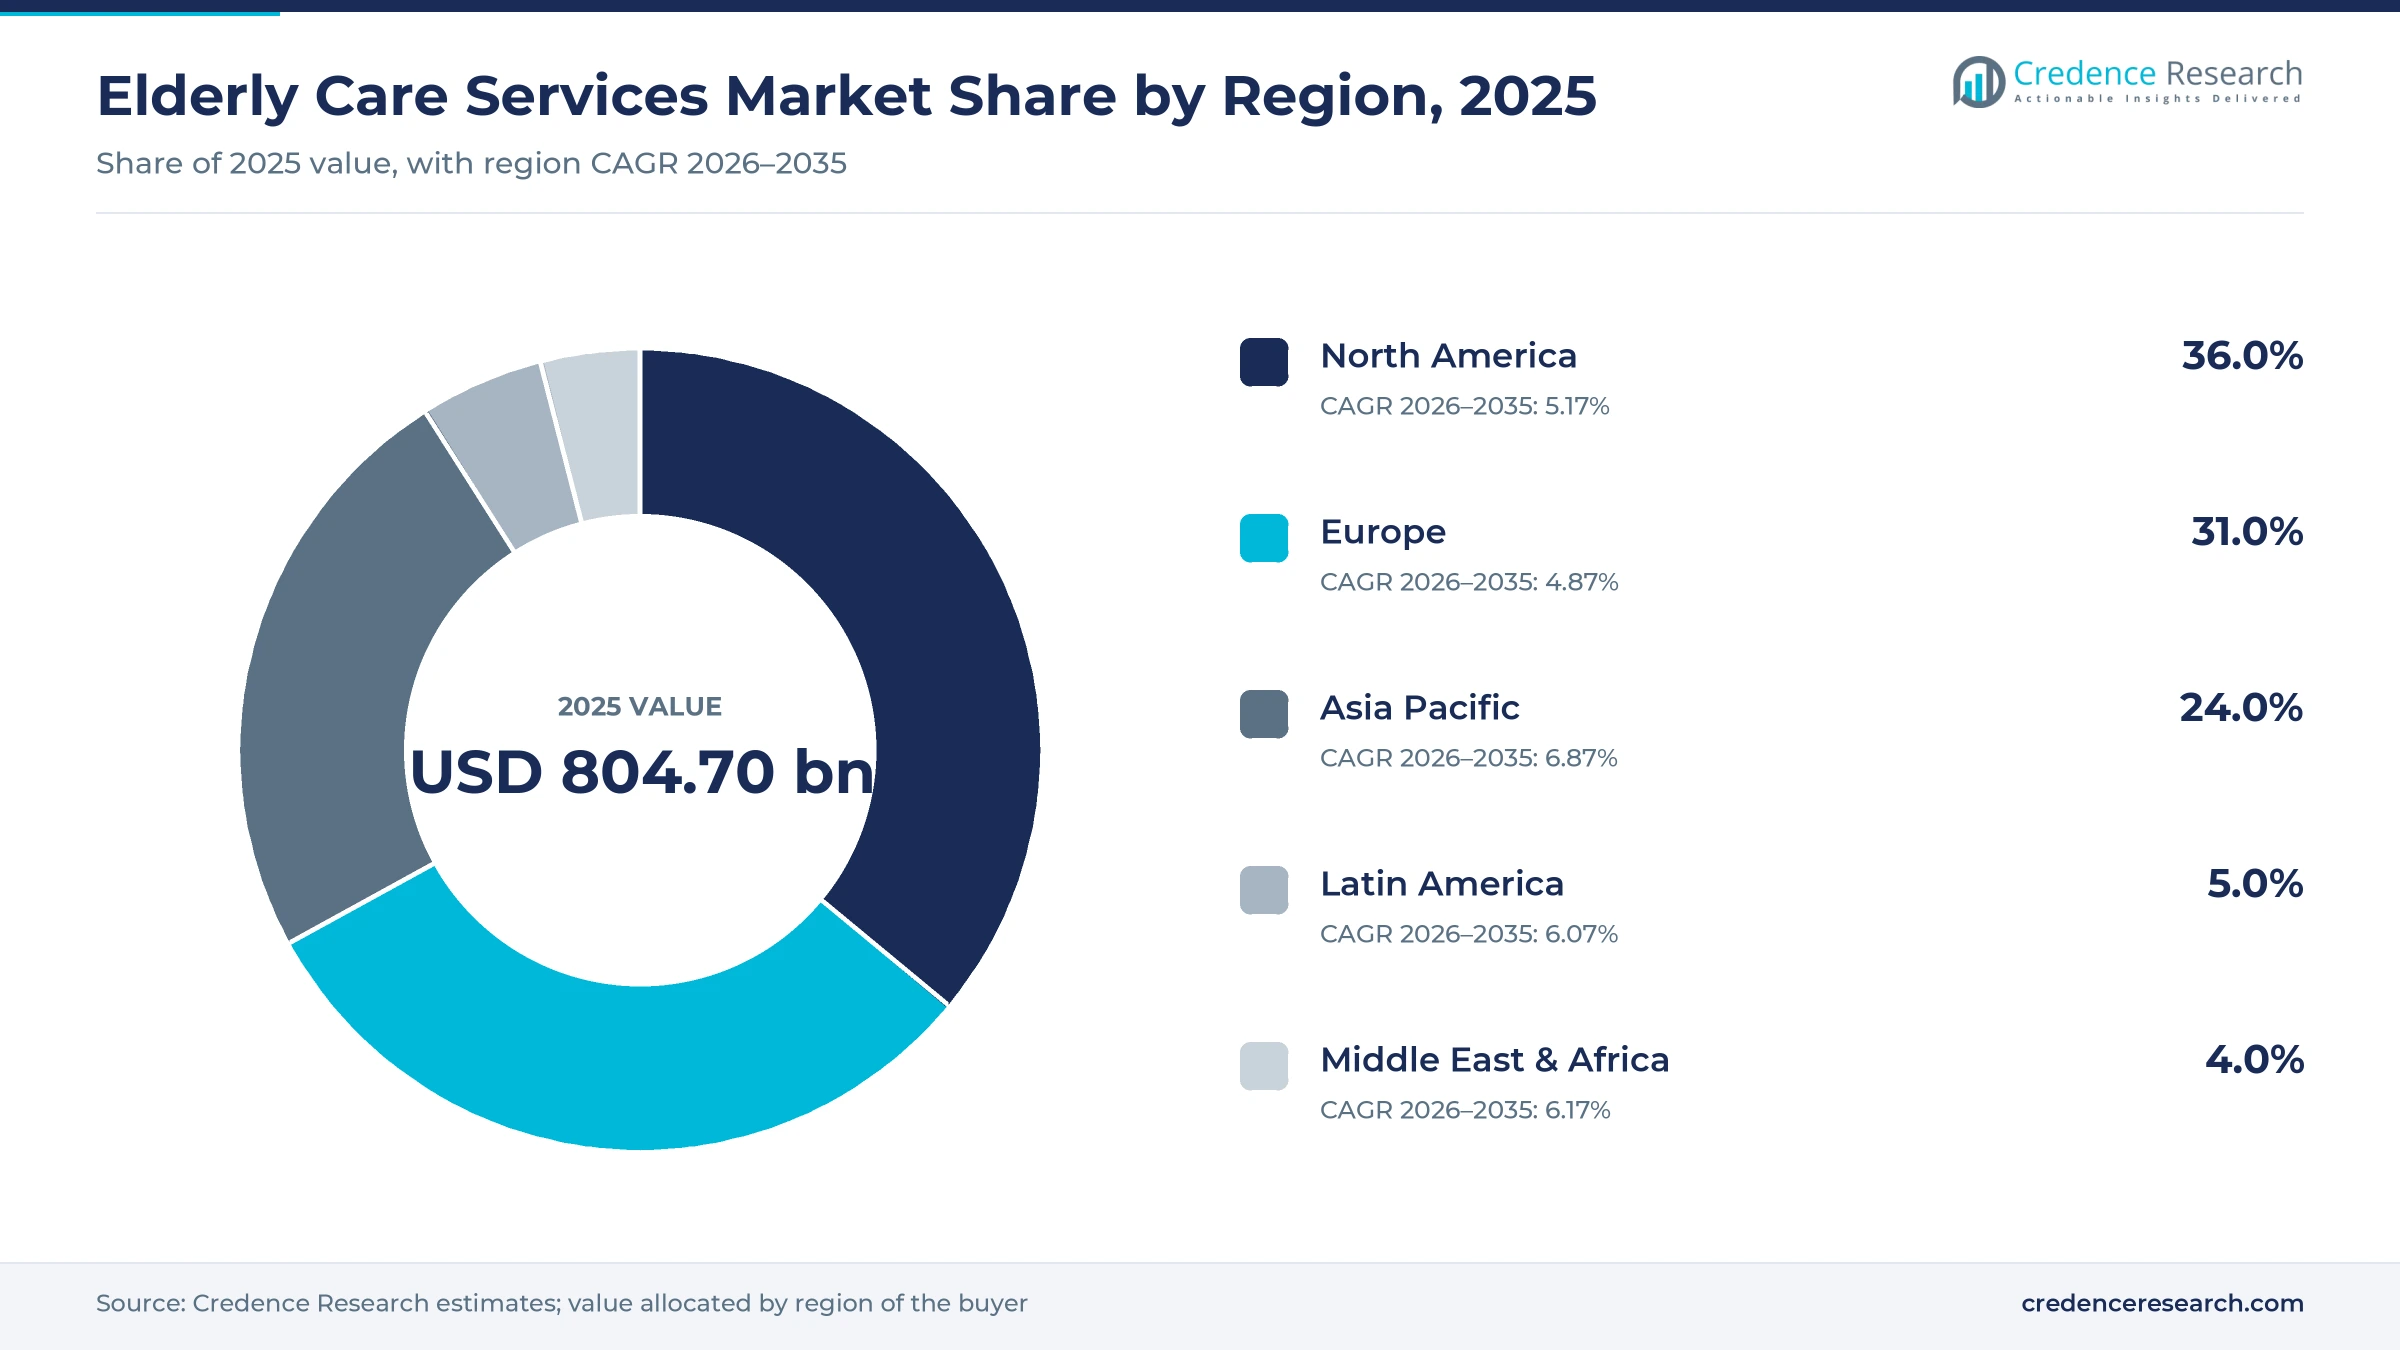
The global elderly care services market was valued at USD 804.70 billion in 2025 and is projected to increase from USD 849.65 billion in 2026 to USD 1,385.78 billion by 2035, registering a CAGR of 5.59% during 2026–2035. Demand comes from longer life expectancy, rising rates of dementia and chronic disease, and smaller families that can no longer provide all support at home. North America held the largest regional share, 36.0% in 2025, because public programs and private payers fund large home health and residential networks there. Asia Pacific is the fastest-growing region at 6.87% a year, as China, Japan, Singapore and India expand services for very large older populations. Policy also shifted in late 2025, when Australia started its new aged care law and the Support at Home program on Nov. 1. As a result, governments and families are moving spending away from hospitals and toward home and community support.
Which senior support services does this analysis count?
The analysis counts paid personal care, companion care, homemaking, rehabilitation and related support delivered to older adults at home, in day centers and in public or private residential facilities. Families, public insurers, private insurers and local governments buy these services through hourly visits, monthly packages and residential contracts.
Hospital acute treatment, prescription drugs and medical equipment sales sit outside the scope of this analysis. The value chain runs from training providers and staffing agencies through home care agencies, nursing homes and day centers to the older adults and families who receive daily support.
Elderly Care Services Market Insights
- The elderly care services market grows from USD 804.70 billion in 2025 to USD 1,385.78 billion by 2035, a 5.59% CAGR as aging populations need more daily support.
- North America held 36.0% of global senior support value in 2025, supported by public insurance programs and large home health networks.
- Home care led service facilities with 46.0% of 2025 value, while companion care grows fastest among service types at 6.34% a year.
- In July 2025, the United Kingdom closed its overseas recruitment route for care workers, which tightened staffing for providers across England and Wales.
- Operators such as Epoch Elder Care, Econ Healthcare Group and United Medicare compete on staff quality, specialist dementia programs and local coverage.
Home care leads as companion care grows fastest
Why does home care take most facility spending?
Based on service facility, the market is categorized into home care, private facilities and public facilities. Home Care led with a 46.0% share of 2025 value, because most older adults prefer to age in their own homes. Home Care also grows fastest at 6.10% a year, as governments fund home packages to reduce hospital and nursing home costs. Private facilities attract families seeking specialist dementia support and higher comfort levels.
Which service type grows fastest through 2035?
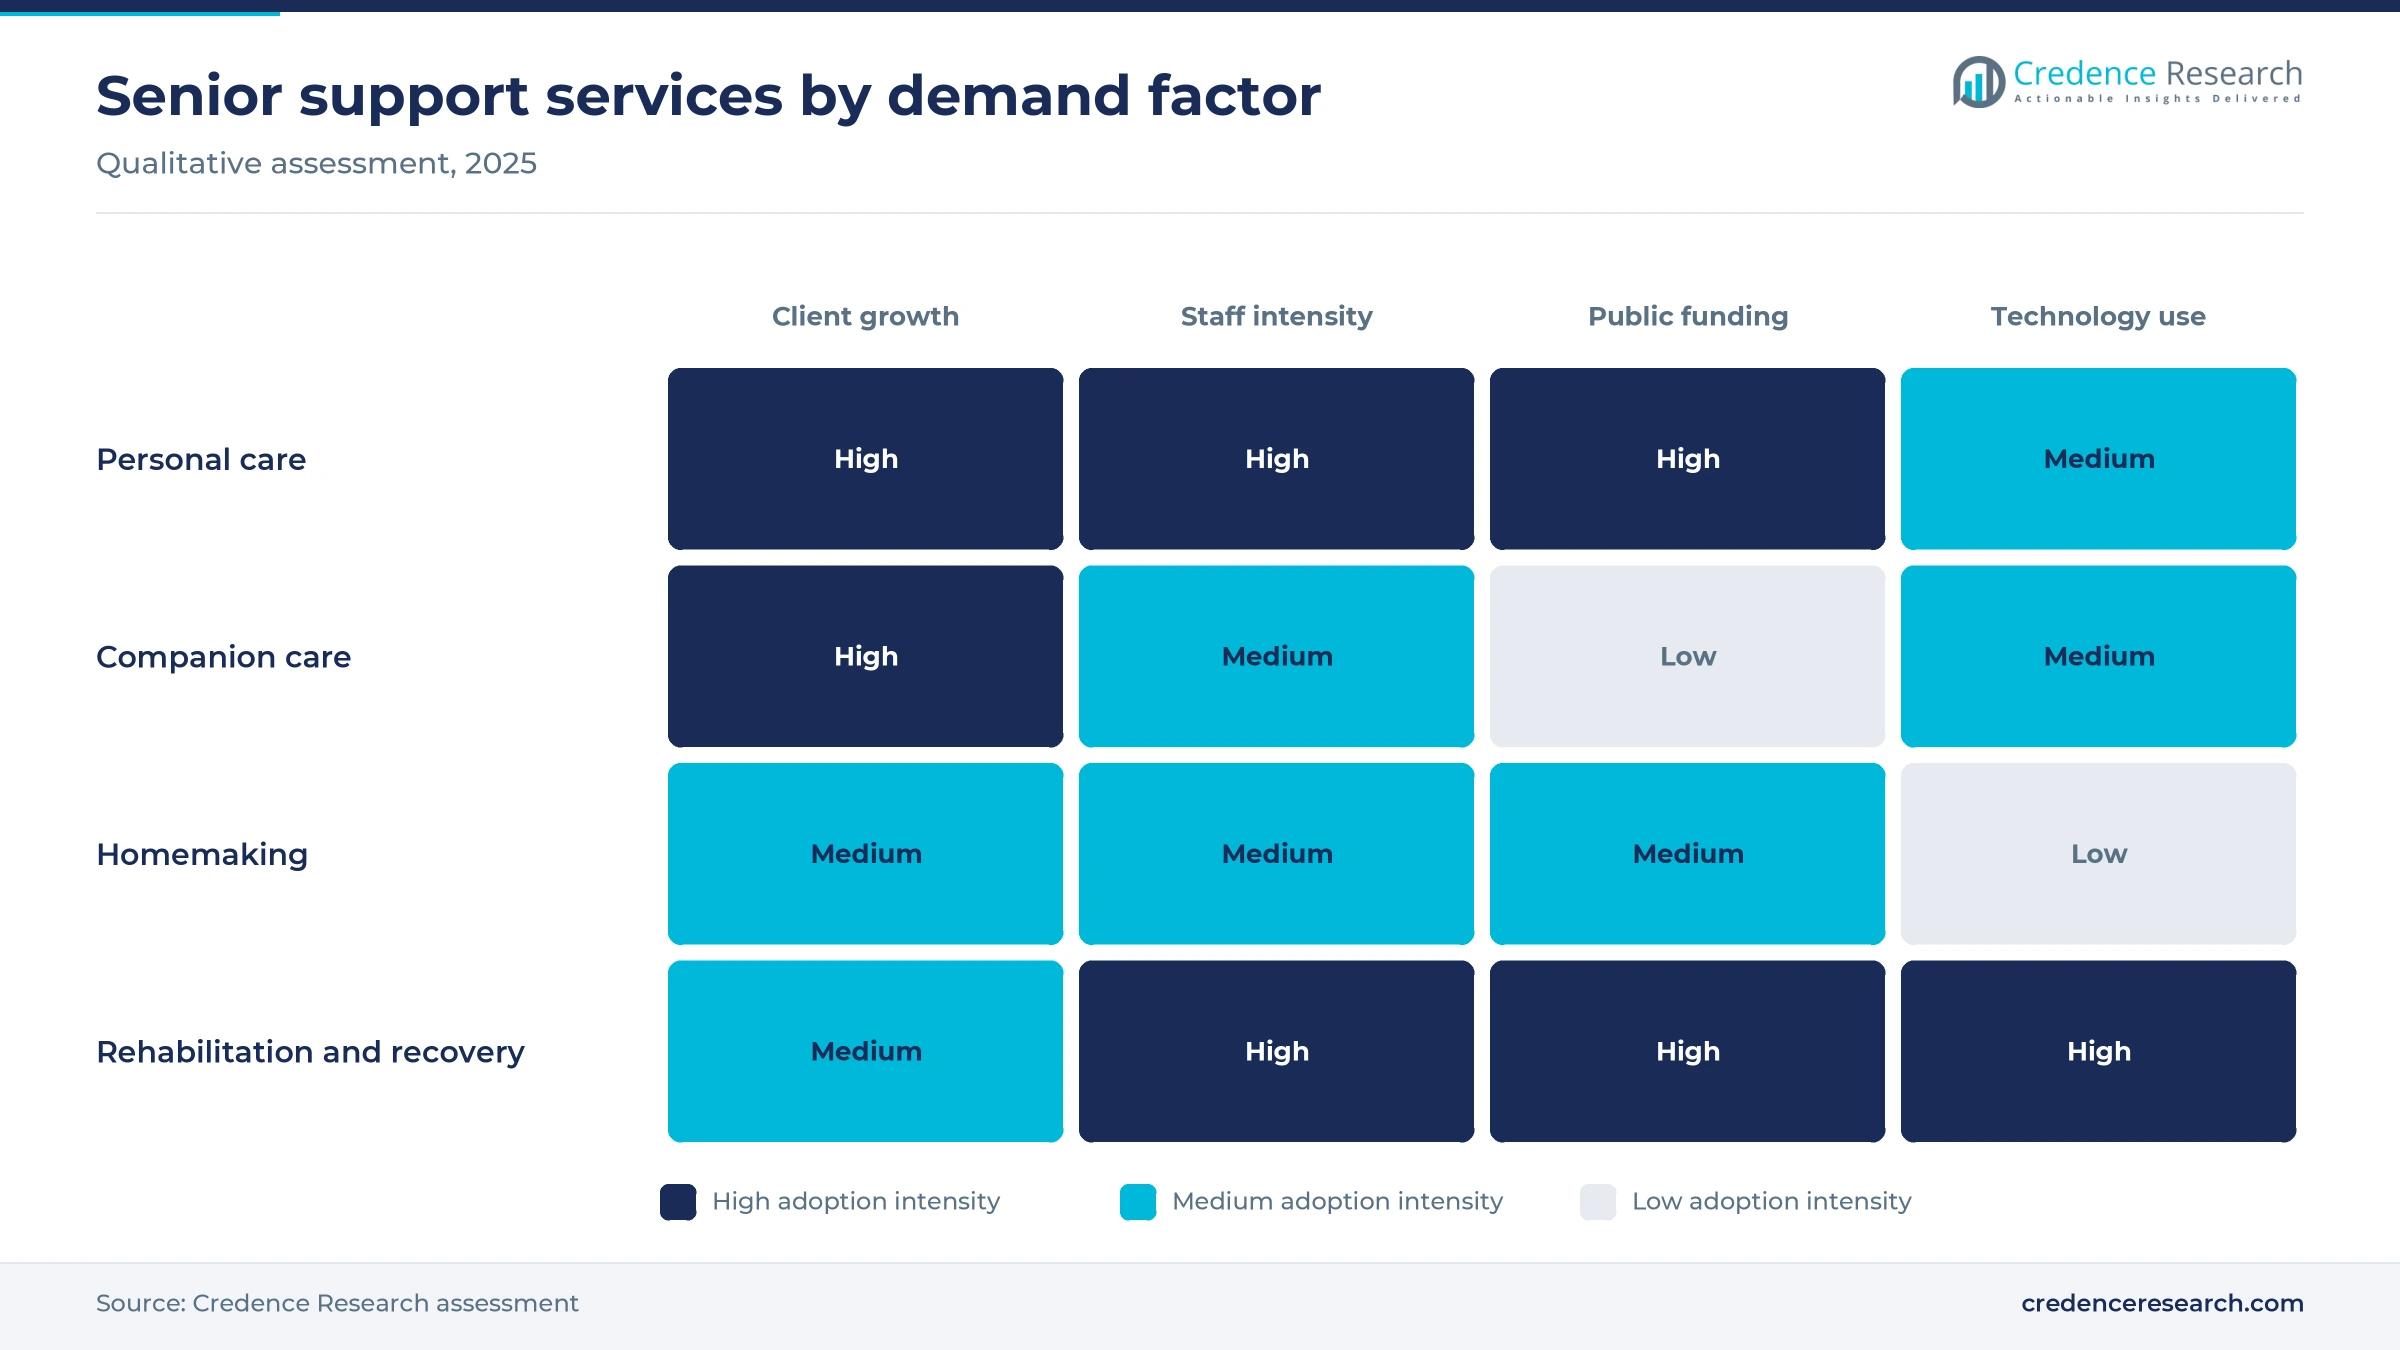
Based on service type, the market is categorized into personal care, companion care, homemaking, rehabilitation and recovery, and others. Personal Care led with a 38.0% share of 2025 value, because bathing, dressing and mobility help are core needs for frail adults. Companion Care grows fastest at 6.34% a year, as loneliness among adults living alone now drives demand for regular visits and social support.
How do public insurers shape spending on senior support?
Based on payment source, the market is categorized into public insurance, private insurance and out-of-pocket payment. Public Insurance led with a 52.0% share of 2025 value, because Medicaid, national long-term support schemes and local programs fund most home and residential support. Private Insurance grows fastest at 6.49% a year, as more working adults buy long-term support cover for their later years.
| Segment Group | Leading Sub-segment | Share, 2025 | Fastest-growing Sub-segment | CAGR, 2026–2035 |
|---|---|---|---|---|
| By Service Facility | Home Care | 46.0% | Home Care | 6.10% |
| By Service Type | Personal Care | 38.0% | Companion Care | 6.34% |
| By Payment Source | Public Insurance | 52.0% | Private Insurance | 6.49% |
Request a Free Sample
Fill in your details and we'll send you a free sample report.
- Sample data tables & charts
- Research methodology
Population aging and public funding lift demand
How does rapid population aging raise demand for support?
Population aging is the main driver, because the number of adults who need daily help rises with every year of longer life. According to the World Health Organization fact sheet on aging and health, one in six people worldwide will be aged 60 years or over by 2030. The number of people aged 80 years or older is expected to triple between 2020 and 2050 to reach 426 million. As a result, providers in every region face steady growth in clients who need personal care and supervision.
Why do public funding reforms favor paid home support?
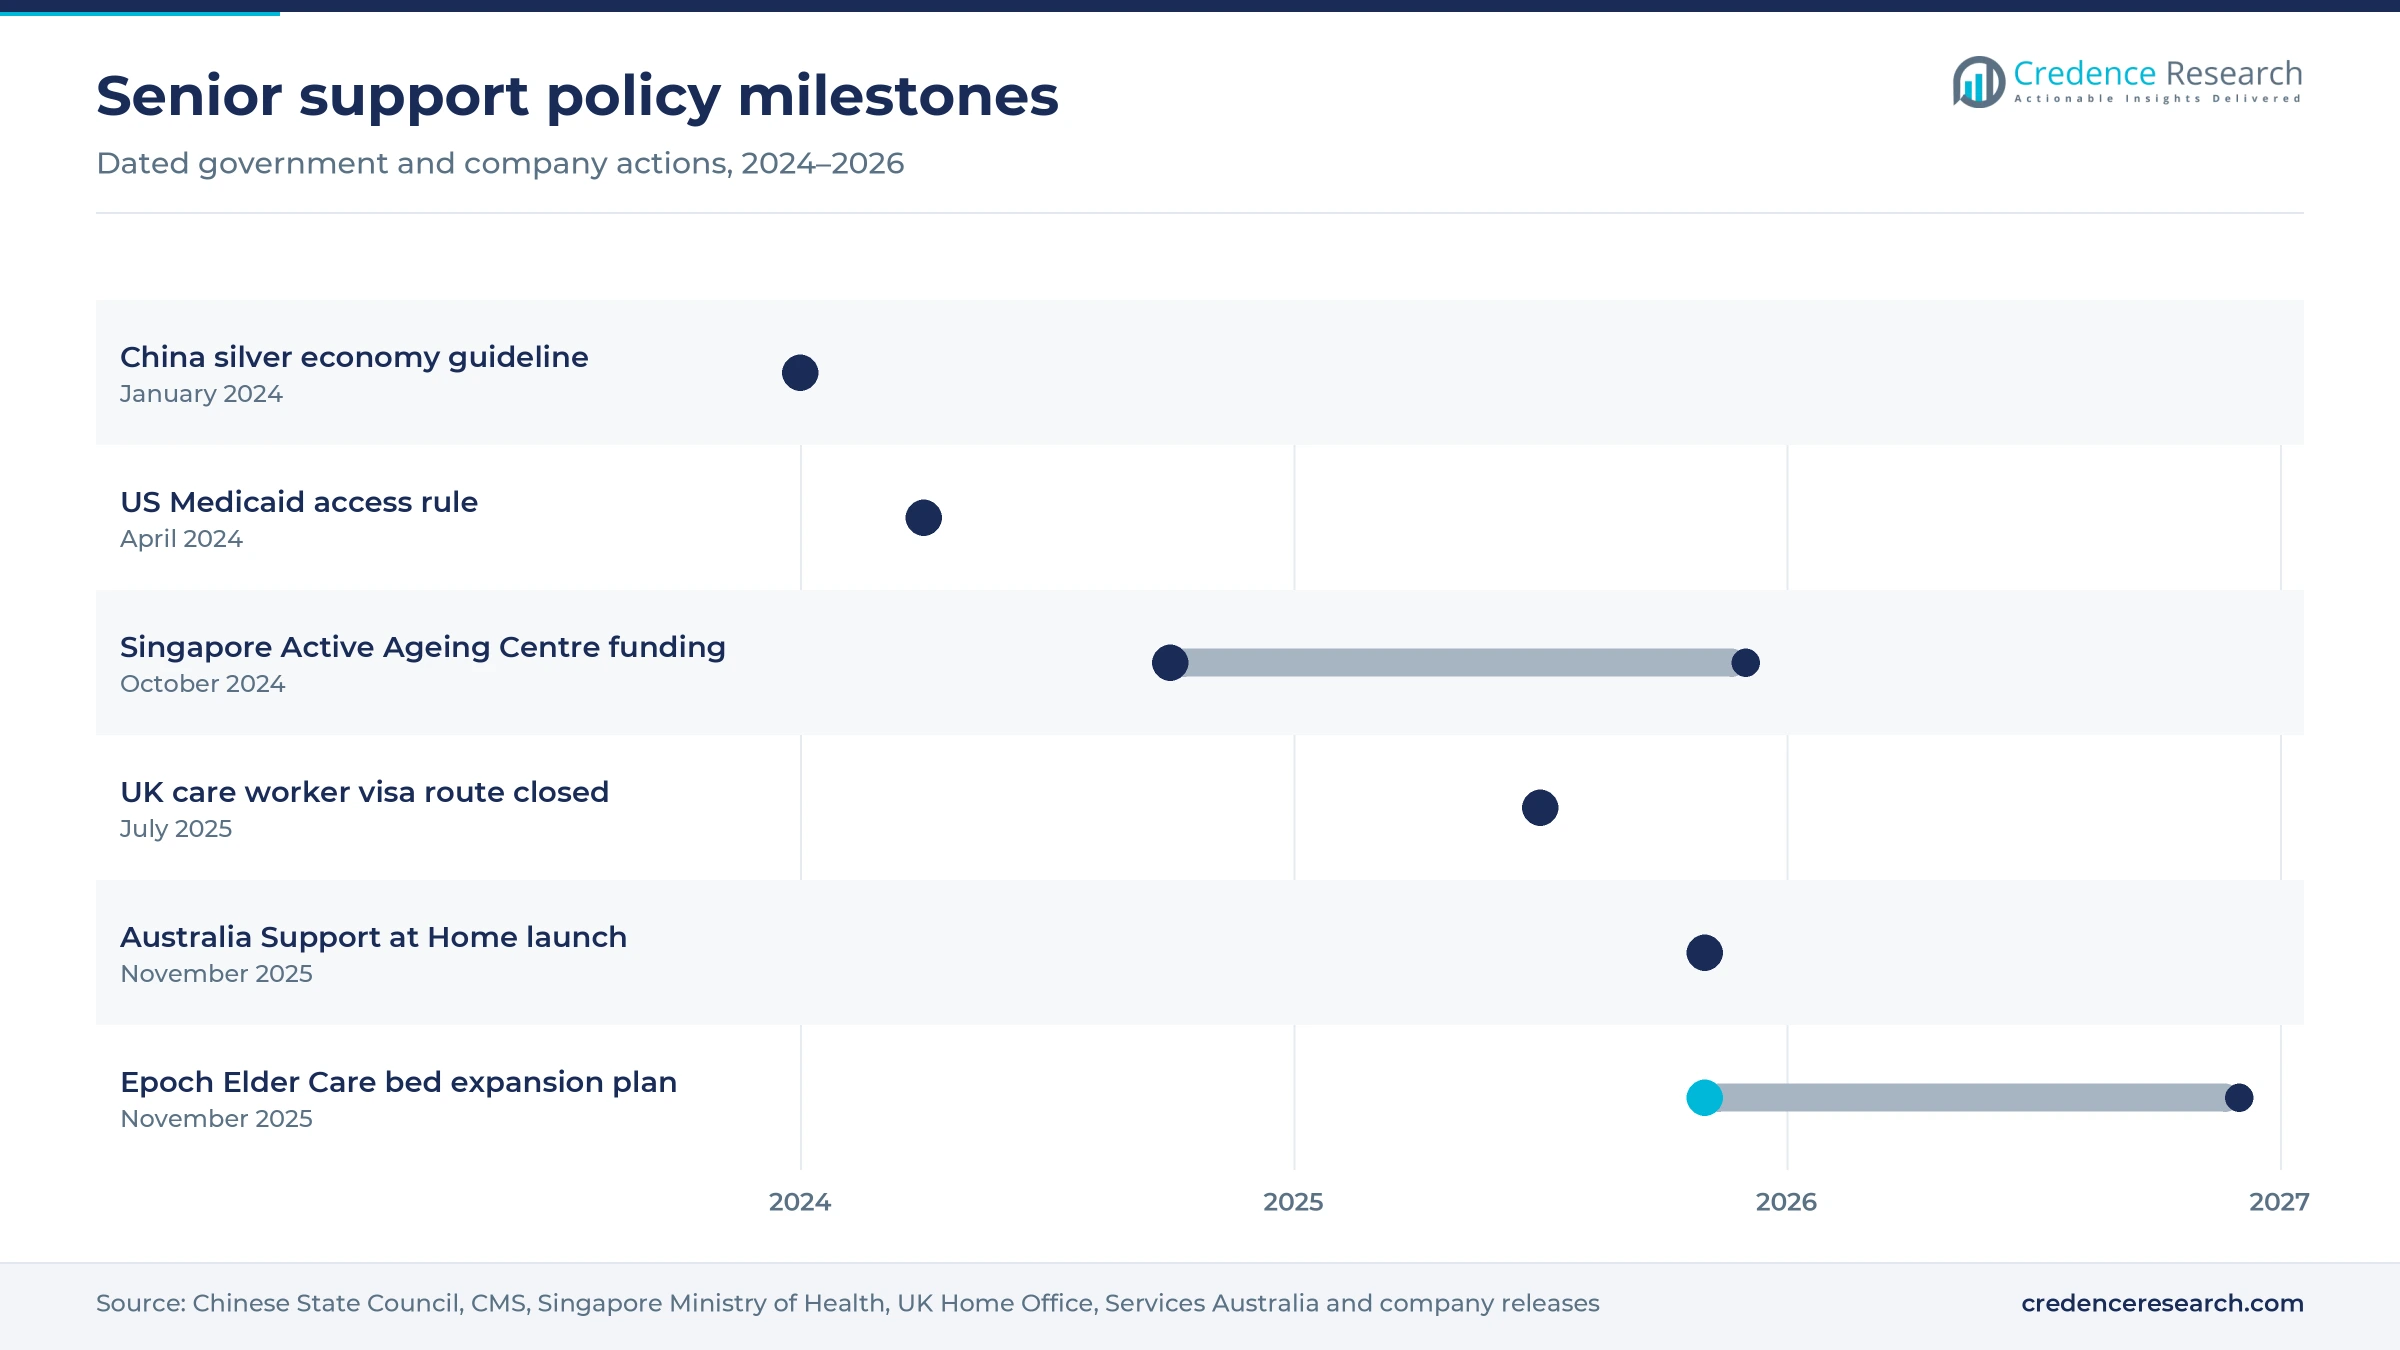
Public funding reforms favor home support, because governments want older adults to stay out of hospitals and nursing homes for as long as possible. In April 2024, CMS finalized a Medicaid access rule that requires at least 80% of payments for homemaker, home health aide and personal care services to go toward compensation for direct care workers. States have several years to comply with this payment requirement under the rule. In turn, agencies that pay and retain staff well are better placed to win public contracts.
How do Asian government programs expand community support?
Asian governments are expanding community programs, because their populations are aging faster than health budgets can absorb hospital care. In January 2024, the Chinese State Council issued a guideline on the silver economy, which aims to expand services and products for senior citizens and to build around ten industrial parks nationwide. Singapore is also adding Active Ageing Centres and home personal care capacity across the island. As a result, operators in Asia Pacific gain new public and private clients.
Why do dementia and chronic illness lift demand for skilled help?
Dementia and chronic illness lift demand for skilled support, because these conditions require supervision, medication reminders and help with daily tasks over many years. Families often cannot provide this level of support while also working full time. Many households therefore combine paid home visits with personal emergency response systems and day programs. In turn, providers that offer specialist dementia training and longer visit hours can charge higher rates.
Care shifts toward homes, communities and technology
How is support shifting from facilities toward homes?
Support is shifting from residential facilities toward homes, because older adults and payers both prefer lower-cost care in familiar settings. Australia started its new Aged Care Act and the Support at Home program on Nov. 1, 2025, replacing the Home Care Packages Program and the Short-Term Restorative Care Programme. The change sets one framework for home support and short-term recovery services. As a result, home care agencies in Australia are adjusting pricing, staffing and reporting.
Why is remote monitoring rising in home support?
Remote monitoring is rising in home support, because sensors and connected devices let small teams follow more clients between visits. Agencies now pair visits with remote patient monitoring for blood pressure, falls and medication adherence among frail adults. Families receive alerts and updates through simple phone apps, which builds trust in paid support. In turn, providers can offer tiered packages that combine visits, monitoring and on-call help.
Can specialist dementia homes open a growth opportunity?
Specialist dementia homes offer a clear opportunity, because many general facilities cannot manage memory loss and behavioral symptoms safely. In November 2025, Epoch Elder Care said it is scaling capacity from about 200 to more than 500 beds and aims for 1,000 beds within five years. The company is opening new facilities such as Monet House in Pune. As a result, operators with dementia training and secure buildings can win families who pay out of pocket.
Where can providers win clients in community programs?
Providers can win clients in community programs, because governments now fund day centers and social activities that delay the need for residential care. Singapore had 214 Active Ageing Centres in 2024, and the Ministry of Health planned $140 million to enhance and expand the network. The ministry also planned an island-wide rollout of enhanced home personal care by the end of 2025. As a result, operators with community centers can add companion, rehabilitation and respite services.
Workforce gaps and funding pressure limit capacity
Why do workforce shortages limit provider capacity?
Workforce shortages are the main constraint, because personal care work is physically demanding and often poorly paid. In July 2025, the United Kingdom closed the overseas route for care worker visas, so new entry clearance applications are no longer accepted. Providers in England that relied on international recruitment must now hire and train more local staff. As a result, many agencies turn down new clients or raise hourly rates to retain workers.
How does public funding pressure squeeze provider margins?
Public funding pressure squeezes margins, because public insurers set rates that often rise more slowly than wages and building costs. Providers that depend on public contracts then have little room to raise pay or invest in training. Rules that direct a fixed share of payments to worker pay can help staff but also limit spending on management and technology. In turn, small agencies often merge with larger groups to share costs.
Why do quality and safety concerns slow family trust?
Quality and safety concerns slow family trust, because reports of neglect in residential settings receive wide public attention. Regulators respond with stricter inspections, reporting rules and staffing standards for facilities. Families then compare providers more carefully and often delay moving a parent into residential support. As a result, operators must invest in training, audits and clear communication to keep occupancy rates high.
How do high out-of-pocket costs limit access?
High out-of-pocket costs limit access, because many families in Asia, Latin America and Africa receive little public support for long-term care. Households then rely on unpaid relatives or informal helpers who lack formal training. Private insurance cover for long-term support remains limited in most emerging markets. In turn, demand for paid services grows more slowly than the older population, and providers must offer lower-cost packages to reach middle-income households.
North America leads as Asia Pacific grows fastest
| Region | Value, 2025 (USD billion) | Share, 2025 | CAGR, 2026–2035 |
|---|---|---|---|
| North America | 289.69 | 36.0% | 5.17% |
| Europe | 249.46 | 31.0% | 4.87% |
| Asia Pacific | 193.13 | 24.0% | 6.87% |
| Latin America | 40.24 | 5.0% | 6.07% |
| Middle East & Africa | 32.19 | 4.0% | 6.17% |
Why does North America hold the largest regional share?
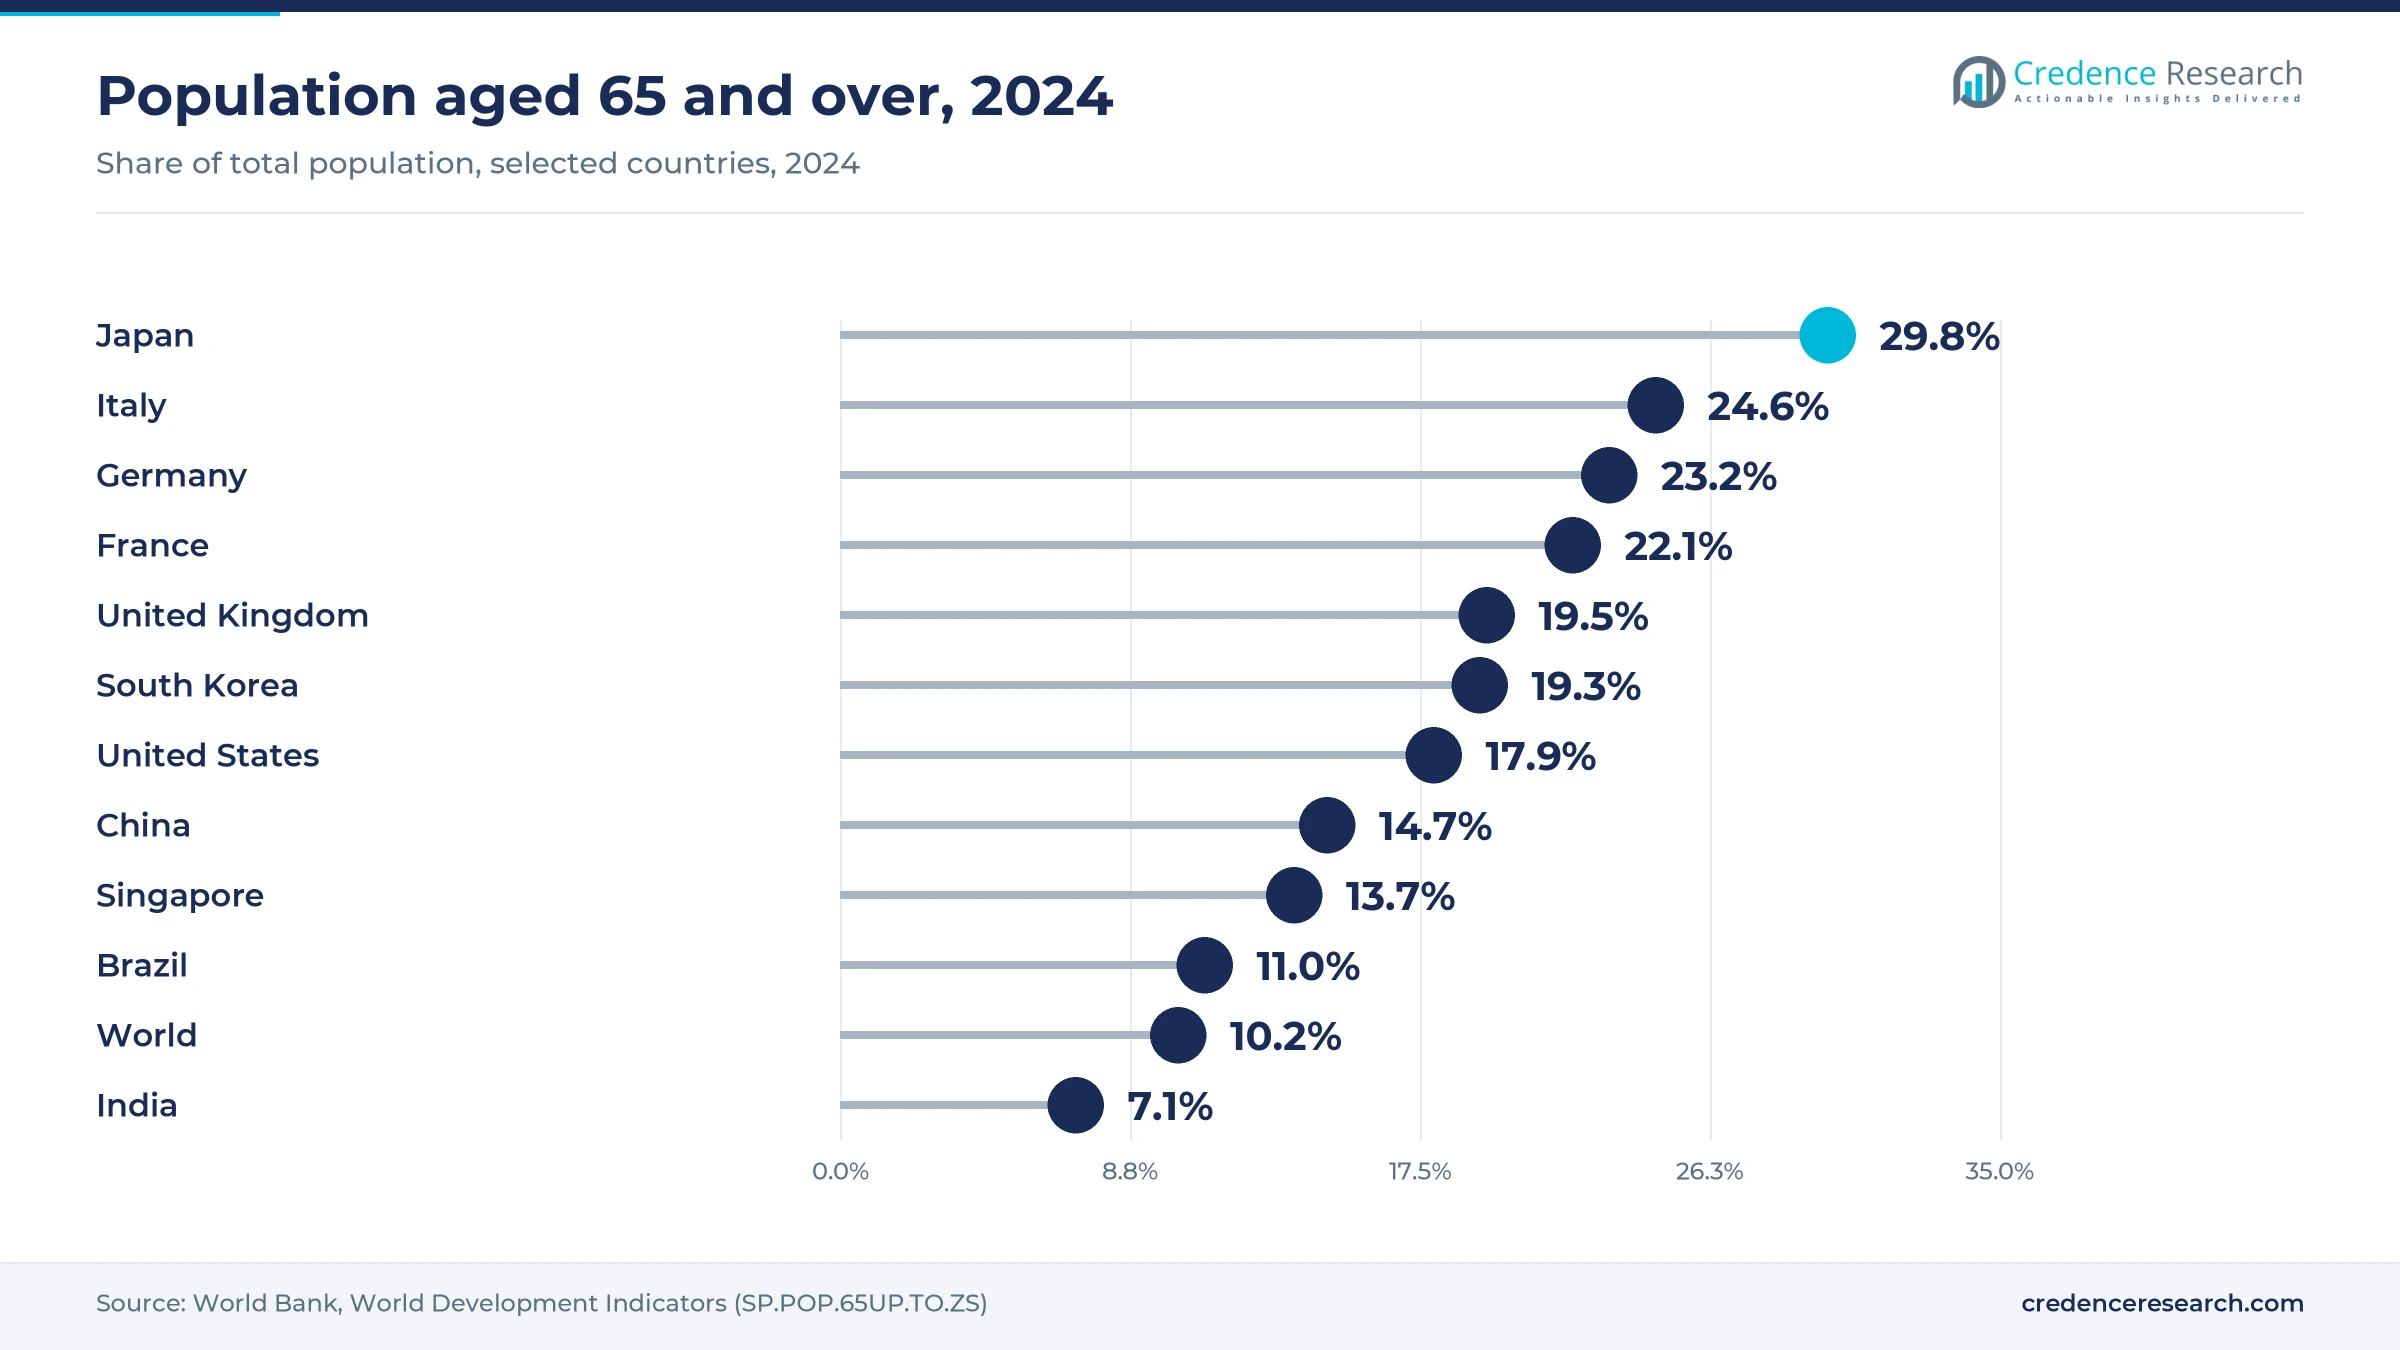
North America held a 36.0% share of 2025 value and grows at 5.17% a year through 2035. The United States drives this position, because Medicare, Medicaid and private payers fund large home health, personal care and residential networks. People aged 65 and over made up 17.9% of the U.S. population in 2024, according to World Bank data. Federal rules on worker pay and growing demand for assisted living keep providers investing in staff and new capacity.
What shapes demand across Europe?
Europe held a 31.0% share of 2025 value and grows at 4.87% a year through 2035. Italy, Germany and France have some of the oldest populations in the world, with people aged 65 and over making up 24.6%, 23.2% and 22.1% of their populations in 2024. National long-term support schemes fund most home and residential services in these countries. However, staff shortages and tight public budgets keep growth below the global rate.
How fast is Asia Pacific adding clients?
Asia Pacific held a 24.0% share of 2025 value and is the fastest-growing region at 6.87% a year. Japan has the oldest population among large economies, with 29.8% of residents aged 65 and over in 2024, while China reached 14.7%. China's silver economy policy and Singapore's community programs expand services for very large groups of older adults. India adds demand from urban families that now buy professional home support and specialist dementia homes.
Where is Latin America adding demand?
Latin America held a 5.0% share of 2025 value and grows at 6.07% a year through 2035. Brazil leads regional demand, and people aged 65 and over made up 11.0% of its population in 2024. Private operators are adding home support and residential homes in large cities.
What limits growth in the Middle East and Africa?
The Middle East and Africa held a 4.0% share of 2025 value and grows at 6.17% a year through 2035. Gulf states add higher-value demand from private home support, while family care remains the norm across most of Africa.
Government reforms reshaped senior support since 2024
| Development | Status and market relevance |
|---|---|
| In January 2024, the Chinese State Council issued a guideline to develop the silver economy and expand services for senior citizens. | Issued; plans about ten industrial parks and support for senior consumption |
| In April 2024, CMS finalized a Medicaid access rule requiring 80% of home support payments to go toward worker compensation. | Final; states have several years to comply with the payment requirement |
| In October 2024, the Singapore Ministry of Health announced $140 million to enhance and expand Active Ageing Centres. | Announced; network reached 214 centers, with enhanced home personal care planned by end-2025 |
| In July 2025, the United Kingdom closed the overseas recruitment route for care worker visas. | In effect; new entry clearance applications for care workers are no longer accepted |
| In November 2025, Australia started its new Aged Care Act and launched the Support at Home program. | In force; replaced the Home Care Packages Program and Short-Term Restorative Care Programme |
Monitoring, telehealth and scheduling tools lead change
- Connected sensors and alarms detect falls, inactivity and wandering at home, which lets small teams respond quickly between scheduled visits.
- Telehealth visits connect older adults with nurses and doctors from home, which reduces travel and supports earlier action on health changes.
- Scheduling and care planning software matches workers to clients and records each visit, which supports public reporting rules and billing.
- Rehabilitation technology such as guided exercise programs and stroke rehabilitation tools helps older adults recover mobility after illness or surgery.
Need a Custom Version of This Report?
Tailor the scope, geography, or segments to your exact requirements.
- Custom geography or segment scope
- Direct access to our analyst team
Local operators compete on staff, trust and coverage
Competition is fragmented, because most services are delivered by local operators that serve one city or country. In Singapore, United Medicare Pte Ltd., St Luke's ElderCare Ltd, SASCO Integrated Eldercare Centre, Pacific Healthcare Nursing Home and Econ Healthcare Group run nursing homes, day centers and community programs that work closely with public agencies. In India, Epoch Elder Care, Samvedna Senior Care and ApnaCare focus on assisted living, dementia support and home visits for urban families. Rosewood Care Group Inc., RIEI Co. Ltd., Cascade Healthcare, Millennia Personal Care Services and GoldenCare Group Private Limited add residential and home support in their local markets. Providers compete on staff training, dementia expertise, family communication and the ability to win public contracts. As a result, buyers often favor operators that combine home visits, day programs and residential beds under one brand.
Companies profiled and their roles in this market
| Company | Type | Role in the market |
|---|---|---|
| United Medicare Pte Ltd. | Operator | Nursing homes and senior support services in Singapore |
| St Luke's ElderCare Ltd | Nonprofit operator | Day centers, rehabilitation and community support |
| SASCO Integrated Eldercare Centre | Nonprofit operator | Residential and community senior support in Singapore |
| Pacific Healthcare Nursing Home | Operator | Residential nursing support |
| Econ Healthcare Group | Operator | Nursing homes and senior support services |
| Epoch Elder Care | Operator | Assisted living and dementia homes in India |
| Samvedna Senior Care | Operator | Dementia support and senior programs in India |
| ApnaCare | Home support | Home visits and personal support |
| Rosewood Care Group Inc. | Operator | Residential and home support |
| RIEI Co. Ltd. | Operator | Residential and home support |
| Cascade Healthcare | Operator | Senior support services |
| Millennia Personal Care Services | Home support | Personal support and home visits |
| GoldenCare Group Private Limited | Operator | Senior support services |
Home and community models set the growth pace
Credence Research's view is that home and community models will set the pace of growth through 2035, because they cost less than residential beds and match what most older adults want. The overall market grows at 5.59% a year, supported by aging populations, public funding reforms and rising rates of dementia. Personal care keeps the largest base, but companion and recovery services grow faster as loneliness and post-hospital needs rise. Operators that recruit and retain trained staff, use remote monitoring and win public contracts will gain the most share over the decade.
How Credence Research sized senior support spending
The report uses 2025 as the base year and 2026 to 2035 as the forecast period. Market values come from the Credence Research model, which builds spending by service facility, service type, payment source and region. Regional and segment splits are Credence Research estimates informed by World Health Organization and World Bank statistics, government policy releases from the United States, China, Singapore, Australia and the United Kingdom, and company announcements. No primary interviews or surveys were used in preparing this edition of the report.
Senior support spending outlook to 2035
By 2035, the elderly care services market is projected to reach USD 1,385.78 billion, with growth led by home support, companion visits and recovery programs. Personal care will remain the largest service type, although payers will expect better reporting and outcomes. North America keeps the highest spending per client, while Asia Pacific adds the most new clients through public programs and private operators. More support will move into homes and community centers over the forecast period. As a result, advantage will depend on staff supply, dementia skills and the ability to combine visits with remote monitoring.
Frequently Asked Questions
How big is the global elderly care services market?
Which service facility leads the market?
Which region leads spending on senior support?
Which service type grows fastest?
How did Australia change its aged care system?
What does the U.S. Medicaid access rule mean for providers?
Who are the leading elderly care service providers?
What restrains growth in elderly care services?
Table of Content
Chapter 1 Market Segmentation
- 1.1 Segmentation Framework
- 1.1.1 Product and Service Classification
- 1.1.2 Application and End-Use Classification
- 1.1.3 Technology and Solution Classification
- 1.1.4 Customer and Distribution Channel Classification
- 1.1.5 Geographic Segmentation
- 1.1.6 Market Segment Definitions and Boundaries
- 1.2 By Service Facility
- 1.2.1 Home Care
- 1.2.2 Private Facilities
- 1.2.3 Public Facilities
- 1.3 By Service Type
- 1.3.1 Personal Care
- 1.3.2 Rehabilitation/Recovery
- 1.3.3 Companion Care
- 1.3.4 Homemaking
- 1.3.5 Others
- 1.4 By Payment Source
- 1.4.1 Public Insurance
- 1.4.2 Out-of-Pocket
- 1.4.3 Private Insurance
Chapter 2 Introduction
- 2.1 Report Objectives and Scope
- 2.2 Product Definition and Industry Terminology
- 2.3 Market Inclusions and Exclusions
- 2.4 Research Process
- 2.4.1 Primary Research and Expert Interviews
- 2.4.2 Secondary Research and Source Review
- 2.4.3 Top-Down and Bottom-Up Estimation
- 2.4.4 Data Triangulation and Verification
- 2.5 Market Size Measurement Basis
- 2.5.1 2025: USD 804.70 billion → 2035: USD 1,385.78 billion
- 2.6 Historical and Forecast Reference Periods
- 2.6.1 Historical Period: 2018-2025
- 2.6.2 Base Year: 2025
- 2.6.3 Forecast Period: 2025-2035
- 2.7 Research Assumptions and Limitations
Chapter 3 Executive Summary
- 3.1 Market Snapshot and Key Findings
- 3.2 Base-Year Market Size, 2025
- 3.3 Forecast Market Size, 2035
- 3.4 Revenue and Volume Growth Outlook
- 3.5 Key Demand and Supply Indicators
- 3.6 Leading Market Segments
- 3.7 Fastest-Growing Market Opportunities
- 3.8 Regional Performance Highlights
- 3.9 Technology and Industry Transformation
- 3.10 Competitive Landscape Summary
- 3.11 Analyst View and Strategic Implications
Chapter 4 Global Elderly Care Services Market Trends and Developments
- 4.1 Historical Industry Development, 2018-2025
- 4.2 Recent Market Trends and Developments
- 4.3 Demand and Customer Behavior Trends
- 4.4 Technology and Product Innovation
- 4.5 Artificial Intelligence, Automation and Digitalization
- 4.6 Local Manufacturing and Supply Chain Realignment
- 4.7 Industry Partnerships, Mergers and Acquisitions
- 4.8 Sustainability and Circular Economy Developments
- 4.9 Government and Private Sector Investment Trends
- 4.10 Emerging Business Models and Commercialization
- 4.11 Industry Developments and Announcements
Chapter 5 Global Elderly Care Services Market Supply and Demand Analysis
- 5.1 Demand Trend and Consumption Analysis, 2018-2025
- 5.2 Demand Forecast, 2025-2035
- 5.3 Supply Chain Structure and Procurement Trends
- 5.4 Supply-Demand Gap and Bottlenecks
- 5.5 Import Dependence and Sourcing Structure
- 5.6 Regional Supply and Demand Concentration
Chapter 6 Global Elderly Care Services Market Pricing Analysis
- 6.1 Pricing Structure and Measurement
- 6.2 Historical Pricing Trends, 2018-2025
- 6.3 Pricing Outlook, 2025-2035
- 6.4 Pricing by Product and Market Segment
- 6.5 Geographic Pricing Differences
- 6.6 Key Input, Energy, Labor and Logistics Costs
- 6.7 Contract Pricing and Purchasing Models
- 6.8 Pricing Sensitivity and Competitive Positioning
- 6.9 Price, Margin and Profitability Implications
Chapter 7 Global Elderly Care Services Market Dynamics
- 7.1 Market Growth Drivers
- 7.1.1 Demand-Side Drivers
- 7.1.2 Technology and Innovation Drivers
- 7.1.3 Infrastructure and Investment Drivers
- 7.1.4 Regulatory and Policy Drivers
- 7.2 Market Restraints
- 7.2.1 Cost and Affordability Constraints
- 7.2.2 Technology and Adoption Barriers
- 7.2.3 Supply Chain and Operational Constraints
- 7.3 Market Challenges
- 7.3.1 Competitive Pressure and Margin Erosion
- 7.3.2 Skills, Infrastructure and Implementation Gaps
- 7.4 Emerging Market Opportunities
- 7.5 Market Dynamics Impact and Time-Horizon Assessment
Chapter 8 Global Elderly Care Services Value Chain Analysis
- 8.1 Industry Value Chain Overview
- 8.2 Upstream Suppliers and Critical Inputs
- 8.3 Technology and Component Providers
- 8.4 Manufacturing or Service Delivery
- 8.5 Distribution, Channel Partners and Integrators
- 8.6 Downstream Applications and End Users
- 8.7 Value Addition and Profit Pools
- 8.8 Vertical Integration and Outsourcing
- 8.9 Supplier Concentration and Risk
- 8.10 Supply Chain Localization and Resilience
Chapter 9 Global Elderly Care Services Market Regulations and Policies
- 9.1 Relevant Laws, Standards and Compliance Frameworks
- 9.2 Product, Service, Safety and Quality Requirements
- 9.3 Government Policies, Incentives and Subsidies
- 9.4 Imports, Exports and Trade Barriers
- 9.5 Public Procurement and Local Content Requirements
- 9.6 Data Protection, AI and Cybersecurity Compliance
- 9.7 Upcoming Policy Changes and Market Implications
Chapter 10 Global Elderly Care Services Market Hotspots and Opportunities
- 10.1 Market Opportunity Mapping and Growth Hotspots
- 10.2 High-Growth Applications and Customer Groups
- 10.3 Underserved Markets and White-Space Opportunities
- 10.4 Emerging Technology and Product Opportunities
- 10.5 New Capacity and Investment Hotspots
- 10.6 Market Entry and Expansion Opportunities
- 10.7 Distribution and Partnership Opportunities
- 10.8 Near-Term and Long-Term Commercial Potential
- 10.9 Opportunity Attractiveness and Execution Risks
Chapter 11 Global Elderly Care Services Market Outlook, 2025-2035
- 11.1 Market Size and Analysis
- 11.1.1 Revenue (Market Measurement: 2025: USD 804.70 billion → 2035: USD 1,385.78 billion)
- 11.1.2 Historical Market Size, 2018-2025
- 11.1.3 Base-Year Market Size, 2025
- 11.2 Market Forecast, 2025-2035
- 11.2.1 Revenue Forecast to 2035
- 11.2.2 CAGR and Year-on-Year Growth
- 11.2.3 Incremental Revenue Opportunity
- 11.3 Forecast Assumptions and Scenario Analysis
- 11.3.1 Base-Case Forecast
- 11.3.2 Optimistic and Conservative Scenarios
- 11.3.3 Technology, Pricing and Policy Sensitivities
- 11.4 Market Attractiveness and Growth Outlook
Chapter 12 Global Elderly Care Services Market Segmentation and Outlook
- 12.1 Segmentation Summary and Market Shares, 2025
- 12.2 Largest and Fastest-Growing Segments
- 12.3 By Service Facility - Market Size and Forecast, 2025-2035
- 12.3.1 Segment Definition and Scope
- 12.3.2 Historical Market Size, 2018-2025
- 12.3.3 Revenue Forecast, 2025-2035
- 12.3.4 Base-Year Market Share, 2025
- 12.3.5 Segment CAGR and Growth Drivers
- 12.3.6 Subsegment Market Size and Forecast
- 12.3.6.1 Home Care
- 12.3.6.2 Private Facilities
- 12.3.6.3 Public Facilities
- 12.3.7 Subsegment Pricing and Adoption Trends
- 12.3.8 Leading Suppliers and Competition
- 12.3.9 Regional Demand and Opportunities
- 12.4 By Service Type - Market Size and Forecast, 2025-2035
- 12.4.1 Segment Definition and Scope
- 12.4.2 Historical Market Size, 2018-2025
- 12.4.3 Revenue Forecast, 2025-2035
- 12.4.4 Base-Year Market Share, 2025
- 12.4.5 Segment CAGR and Growth Drivers
- 12.4.6 Subsegment Market Size and Forecast
- 12.4.6.1 Personal Care
- 12.4.6.2 Rehabilitation/Recovery
- 12.4.6.3 Companion Care
- 12.4.6.4 Homemaking
- 12.4.6.5 Others
- 12.4.7 Subsegment Pricing and Adoption Trends
- 12.4.8 Leading Suppliers and Competition
- 12.4.9 Regional Demand and Opportunities
- 12.5 By Payment Source - Market Size and Forecast, 2025-2035
- 12.5.1 Segment Definition and Scope
- 12.5.2 Historical Market Size, 2018-2025
- 12.5.3 Revenue Forecast, 2025-2035
- 12.5.4 Base-Year Market Share, 2025
- 12.5.5 Segment CAGR and Growth Drivers
- 12.5.6 Subsegment Market Size and Forecast
- 12.5.6.1 Public Insurance
- 12.5.6.2 Out-of-Pocket
- 12.5.6.3 Private Insurance
- 12.5.7 Subsegment Pricing and Adoption Trends
- 12.5.8 Leading Suppliers and Competition
- 12.5.9 Regional Demand and Opportunities
- 12.6 Segment Growth Comparison
- 12.7 Segment Attractiveness and Priority Matrix
Chapter 13 Global Elderly Care Services Geographic Market Outlook, 2025-2035
- 13.1 Regional Market Size and Share, 2025
- 13.2 Regional Market Forecast, 2025-2035
- 13.3 Regional Pricing, Production and Demand Differences
- 13.4 North America
- 13.4.1 United States
- 13.4.2 Canada
- 13.4.3 Mexico
- 13.5 Europe
- 13.5.1 Germany
- 13.5.2 France
- 13.5.3 Italy
- 13.5.4 United Kingdom
- 13.5.5 Spain
- 13.5.6 Poland
- 13.5.7 Russia
- 13.5.8 Netherlands
- 13.5.9 Belgium
- 13.5.10 Sweden
- 13.5.11 Denmark
- 13.5.12 Norway
- 13.5.13 Rest of Europe
- 13.6 Asia Pacific
- 13.6.1 China
- 13.6.2 India
- 13.6.3 Japan
- 13.6.4 South Korea
- 13.6.5 Thailand
- 13.6.6 Indonesia
- 13.6.7 Vietnam
- 13.6.8 Malaysia
- 13.6.9 Australia
- 13.6.10 Rest of Asia Pacific
- 13.7 Latin America
- 13.7.1 Brazil
- 13.7.2 Argentina
- 13.7.3 Colombia
- 13.7.4 Chile
- 13.7.5 Rest of Latin America
- 13.8 Middle East
- 13.8.1 Saudi Arabia
- 13.8.2 United Arab Emirates
- 13.8.3 Turkey
- 13.8.4 Israel
- 13.8.5 Iran
- 13.8.6 Rest of the Middle East
- 13.9 Africa
- 13.9.1 South Africa
- 13.9.2 Egypt
- 13.9.3 Nigeria
- 13.9.4 Morocco
- 13.9.5 Rest of Africa
- 13.10 Regional Investment, Policy and Supply Chain Differences
- 13.11 Regional Competitive Landscape
- 13.12 Geographic Growth Hotspots
Chapter 14 Global Elderly Care Services Technology, Innovation and Sustainability Outlook
- 14.1 Technology Landscape and Maturity
- 14.2 Product, Process and Service Innovation
- 14.3 AI, Automation and Digital Tools in the Industry
- 14.4 Technology Adoption and Performance Benchmarking
- 14.5 Innovation Pipeline and R&D Investment
- 14.6 Energy Efficiency and Resource Management
- 14.7 Sustainability, Recycling and Circularity
- 14.8 Technology Roadmap, 2025-2035
- 14.9 Risks of Obsolescence and Technology Substitution
Chapter 15 Global Elderly Care Services Market Key Strategic Imperatives
- 15.1 Growth and Market Entry Priorities
- 15.2 High-Return Products and Segments
- 15.3 Pricing, Profitability and Cost Optimization
- 15.4 Technology Investment and Product Differentiation
- 15.5 Supply Chain Localization and Resilience
- 15.6 Distribution and Customer Acquisition
- 15.7 Partnership, Acquisition and Capacity Strategy
- 15.8 Regional Expansion Priorities
- 15.9 Short-, Medium- and Long-Term Actions
Chapter 16 Competition Outlook
- 16.1 Industry Competition Characteristics
- 16.2 Market Structure and Concentration
- 16.3 Market Share and Competitive Positioning, 2025
- 16.4 Company-Wise Revenue and Product Benchmarking
- 16.5 Production and Service Capacity Benchmarking
- 16.6 Technology, Pricing and Differentiation
- 16.7 Regional Footprint and Distribution Strength
- 16.8 Mergers, Acquisitions and Strategic Alliances
- 16.9 New Entrants and Competitive Threats
- 16.10 Porter's Five Forces and Industry Attractiveness
- 16.11 Competitive Outlook, 2025-2035
Chapter 17 Company Profiles
- 17.1 Company Coverage and Selection Criteria
- 17.2 United Medicare Pte Ltd.
- 17.2.1 Business Description
- 17.2.2 Company Ownership and Geographic Presence
- 17.2.3 Product and Service Portfolio
- 17.2.4 Manufacturing and Operating Footprint
- 17.2.5 Financial Performance and Investment
- 17.2.6 Market Share and Competitive Position
- 17.2.7 Technology and Innovation Capabilities
- 17.2.8 Strategic Alliances or Partnerships
- 17.2.9 Recent Developments
- 17.2.10 Growth Strategy and Outlook
- 17.3 St Luke's ElderCare Ltd
- 17.4 Millennia Personal Care Services
- 17.5 GoldenCare Group Private Limited
- 17.6 ApnaCare
- 17.7 Epoch Elder Care
- 17.8 Econ Healthcare Group
- 17.9 RIEI Co. Ltd.
- 17.10 Cascade Healthcare
- 17.11 SASCO Integrated Eldercare Centre
- 17.12 Rosewood Care Group Inc.
- 17.13 Samvedna Senior Care
- 17.14 Pacific Healthcare Nursing Home
- 17.15 Other Relevant Market Participants
Note: Every listed company is profiled on the structure shown under the first company. The company list is preliminary and may change based on research findings, market developments, data availability and client requirements.
Chapter 18 Disclaimer
- 18.1 Research and Forecast Disclaimer
- 18.2 Data Source and Estimation Limitations
Note: The depth of individual sections depends on data availability for this market. Volume, capacity, trade and other unit-based metrics are included where applicable.

