
Lifelong hepatitis B care and cure-focused agents lead value
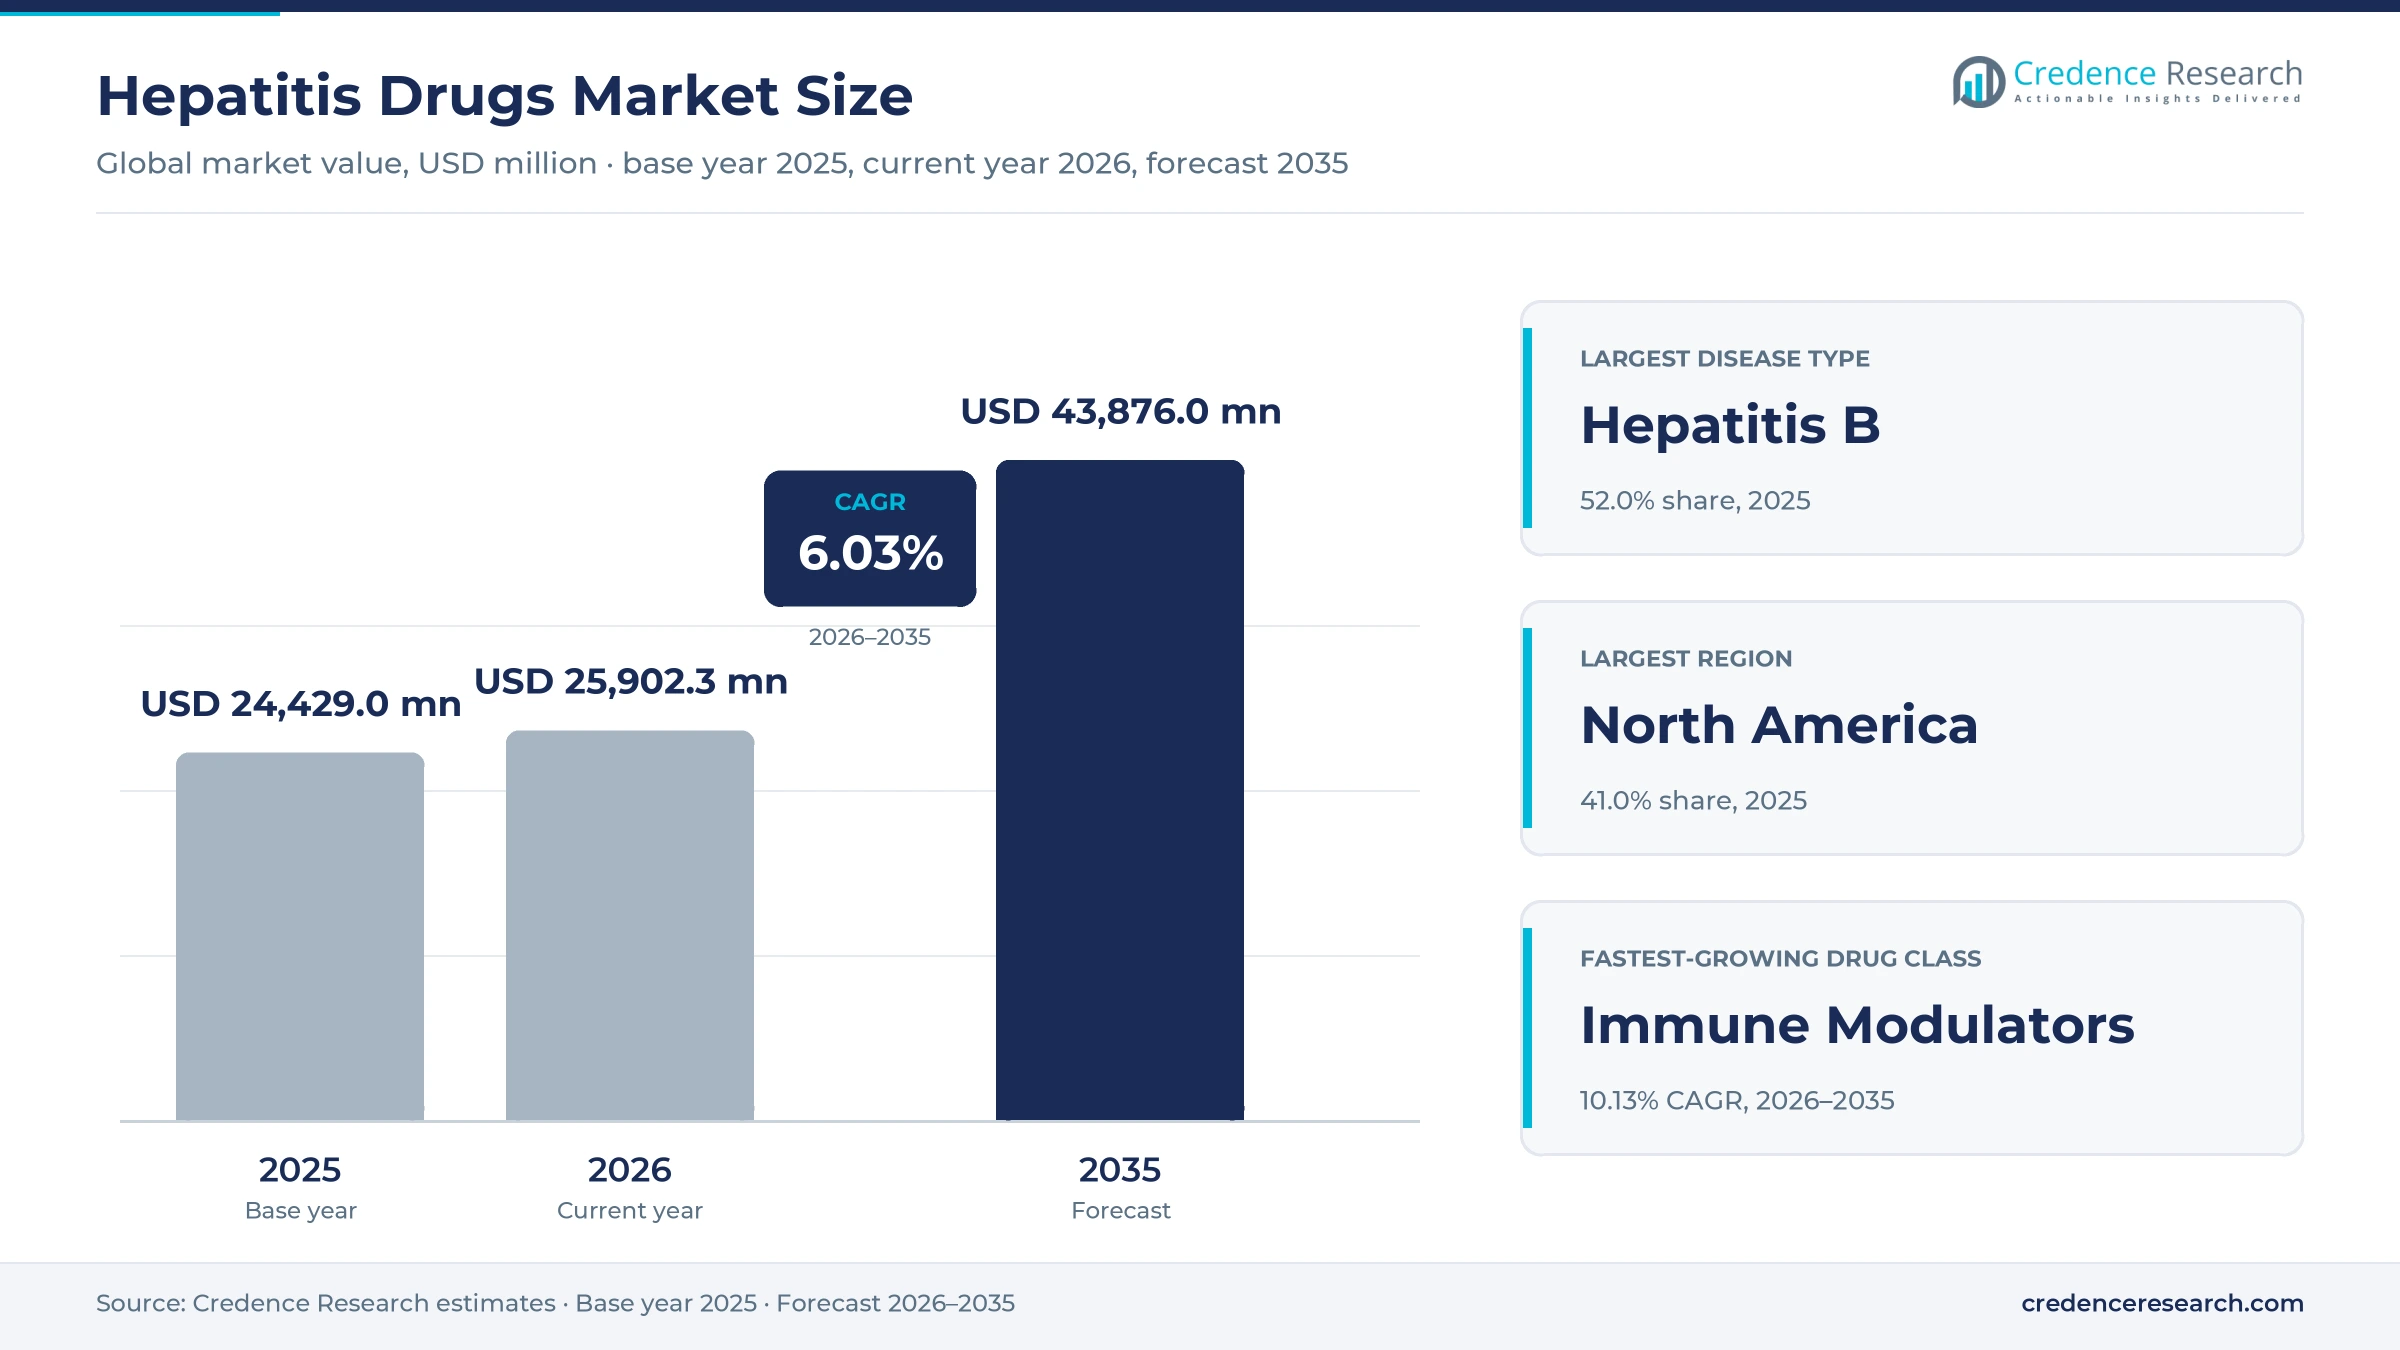
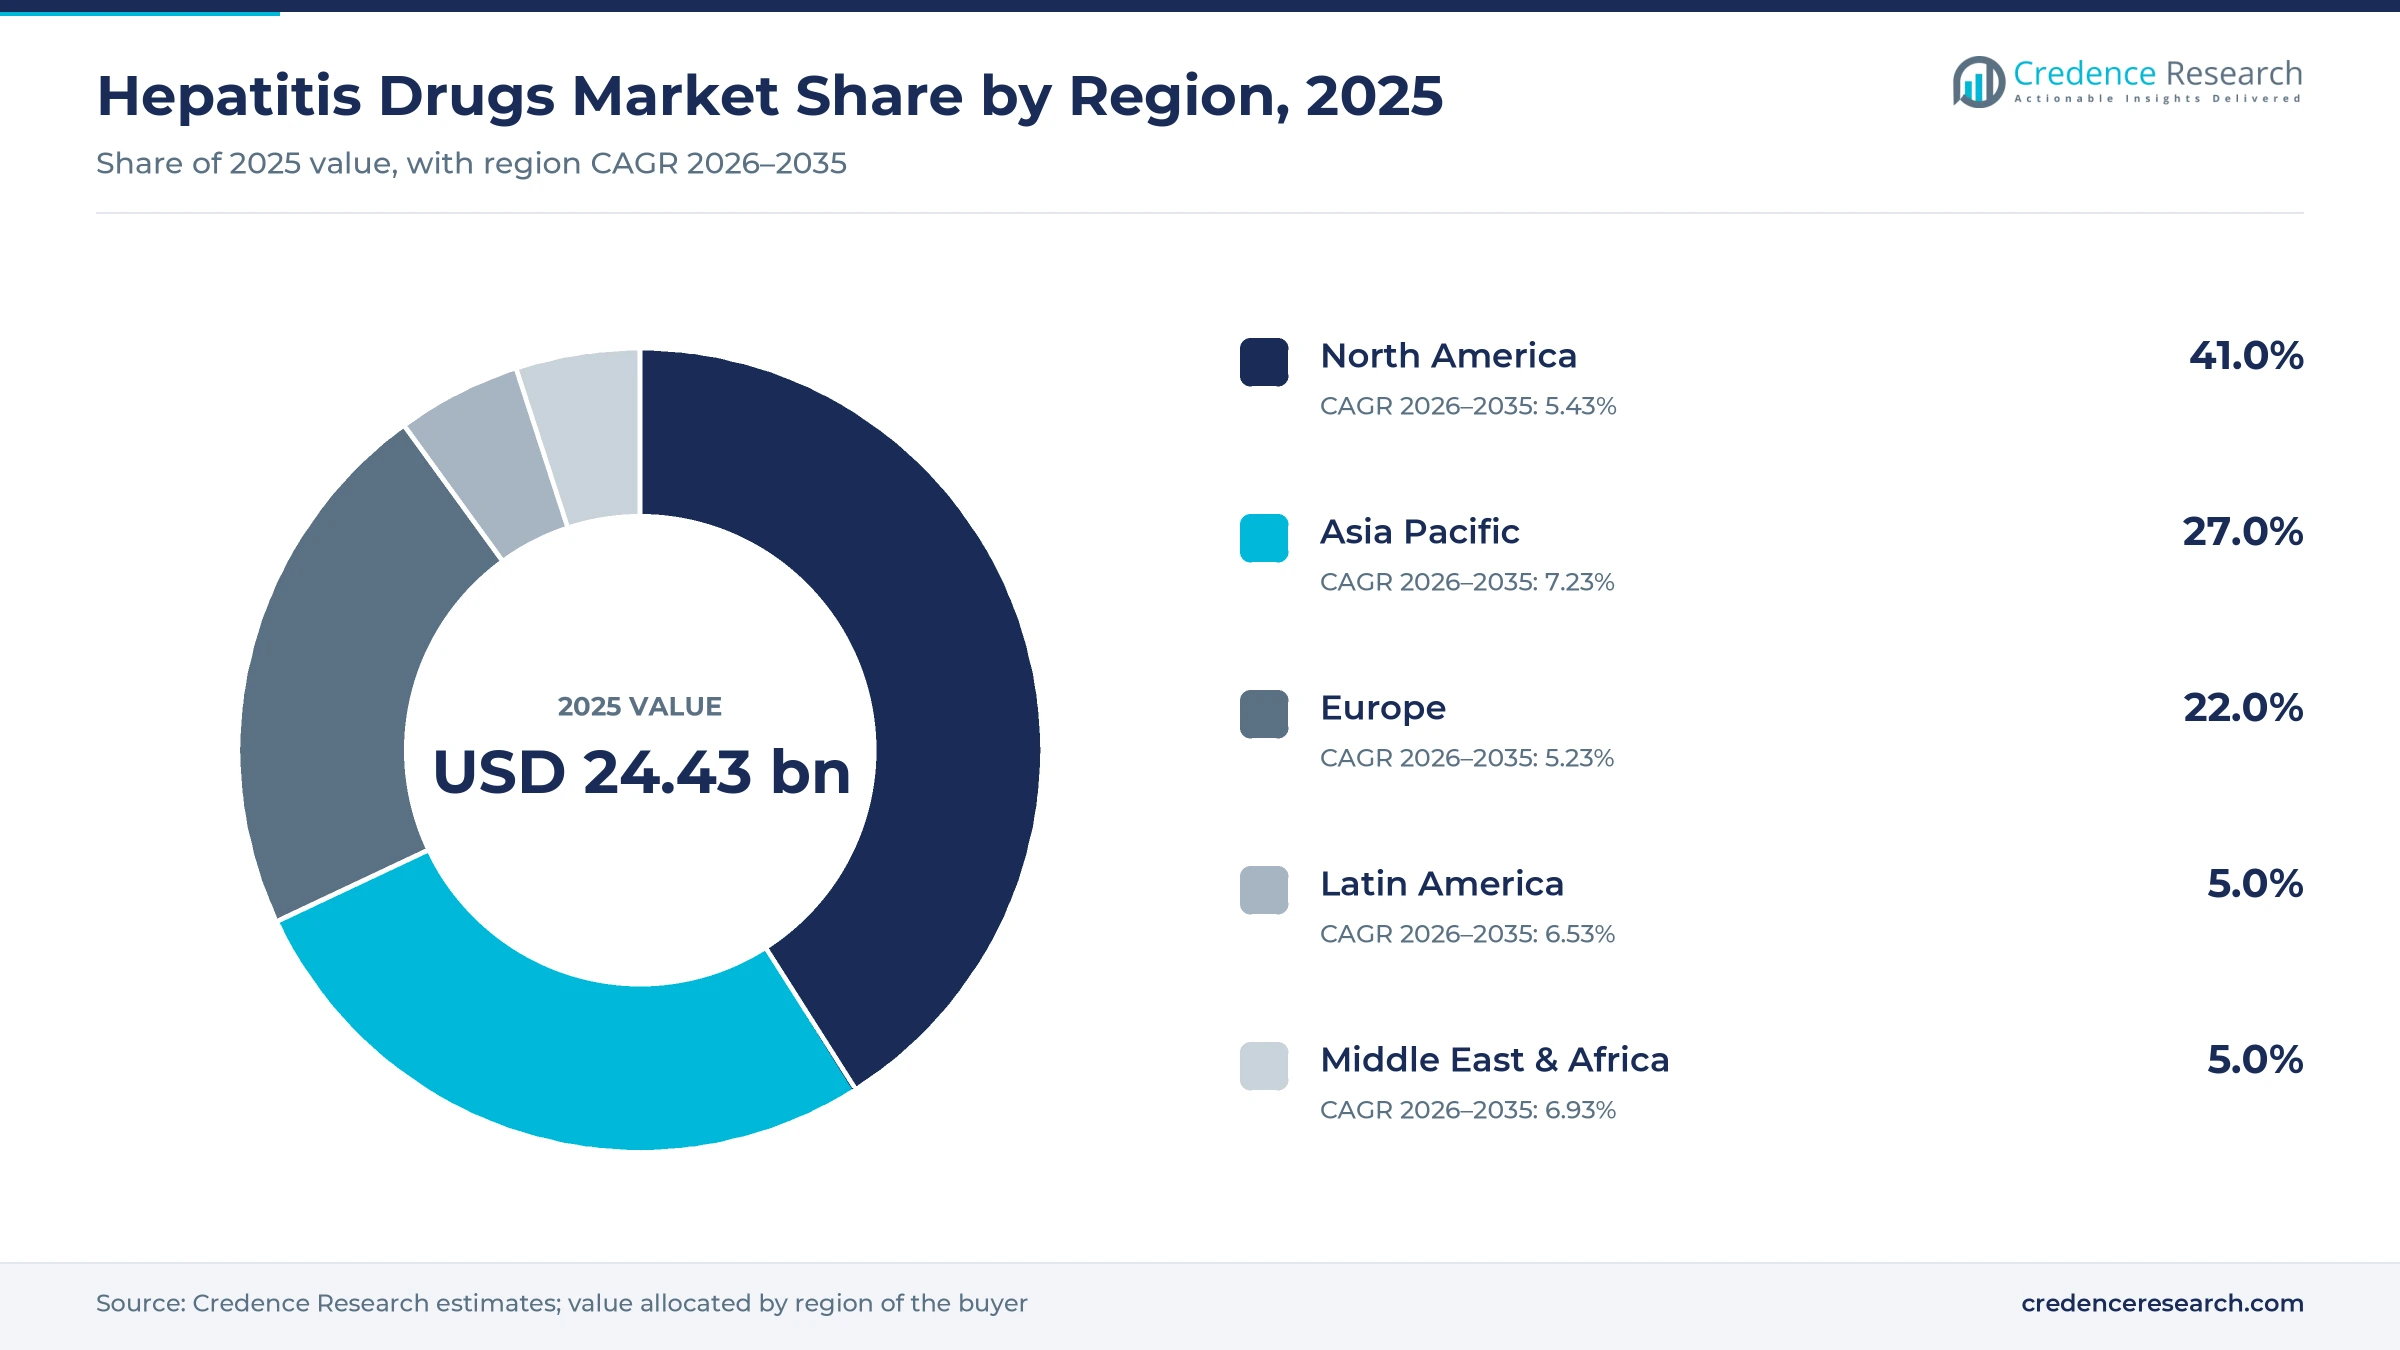
The global hepatitis drugs market was valued at USD 24.43 billion in 2025 and is projected to increase from USD 25.90 billion in 2026 to USD 43.88 billion by 2035, registering a CAGR of 6.03% during 2026–2035. Demand comes from the 254 million people living with chronic hepatitis B, most of whom need daily antiviral tablets for years, and from 50 million people with hepatitis C who can be cured with short oral courses. North America held the largest regional share, 41.0% in 2025, on high branded prices and broad insurance coverage for curative regimens. Asia Pacific is the fastest-growing region at 7.23% a year, as China, India and other high-burden countries expand testing and treatment. The main change is the arrival of functional cure candidates for hepatitis B, led by an antisense medicine under FDA priority review, while generic direct-acting antivirals keep pushing hepatitis C prices lower.
Which antiviral treatments count toward total value?
The market counts manufacturer revenue from prescription medicines used to treat chronic and acute viral hepatitis. It covers nucleoside and nucleotide analogues such as tenofovir and entecavir, direct-acting antiviral regimens for hepatitis C, peginterferon and newer immune modulators and antiviral agents for hepatitis B and hepatitis D. Buyers include hospital, retail and online pharmacies, public health programs and private insurers.
The scope excludes vaccines, diagnostic tests, liver transplant services and medicines used only to manage complications such as ascites or liver cancer. Value flows from originators and generic makers through wholesalers and pharmacies to patients, with public tenders setting prices in many low- and middle-income countries.
Hepatitis Drugs Market Insights
- The hepatitis drugs market grows from USD 24.43 billion in 2025 to USD 43.88 billion by 2035, a 6.03% CAGR over 2026–2035, as hepatitis B treatment widens and functional cure agents reach patients.
- North America held 41.0% of global hepatitis drug value in 2025, backed by branded antiviral prices and broad insurance coverage for curative regimens.
- Hepatitis B led disease types with 52.0% of 2025 value, because most patients take daily antiviral tablets for many years.
- The FDA accepted bepirovirsen for priority review in April 2026, with a target action date of Oct. 26, 2026, for chronic hepatitis B.
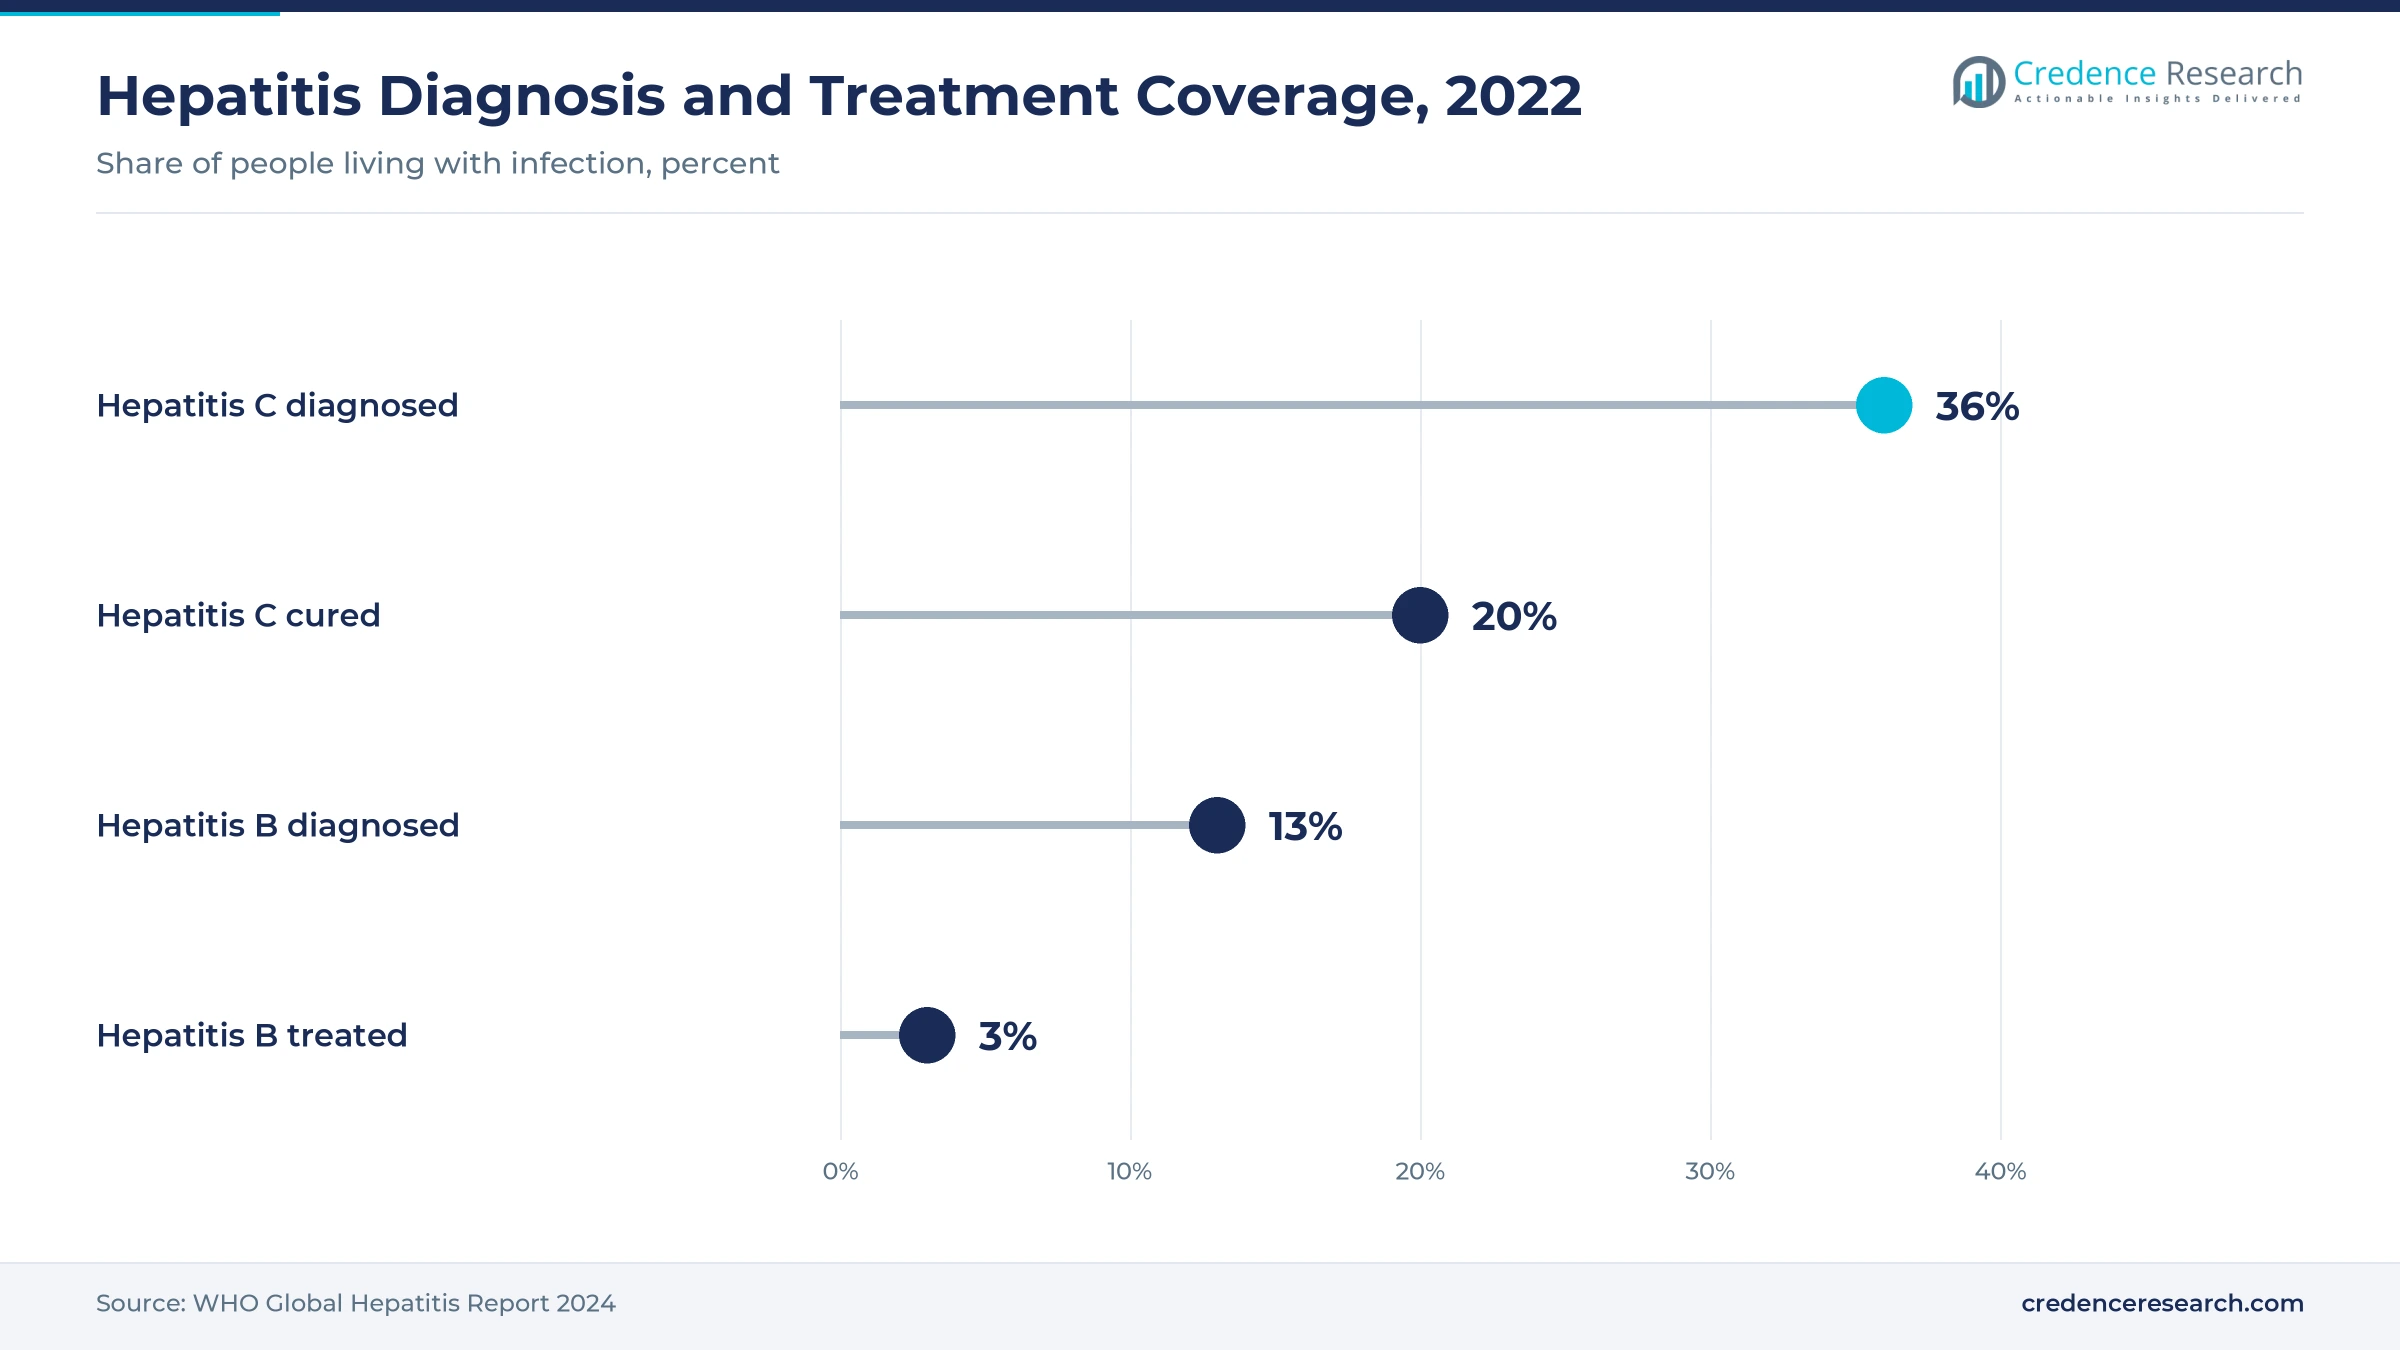
- WHO data show only 13% of people with hepatitis B were diagnosed and about 3% treated in 2022, leaving a large untreated pool.
Hepatitis B and nucleoside analogues hold most value
Why does hepatitis B hold the largest share?
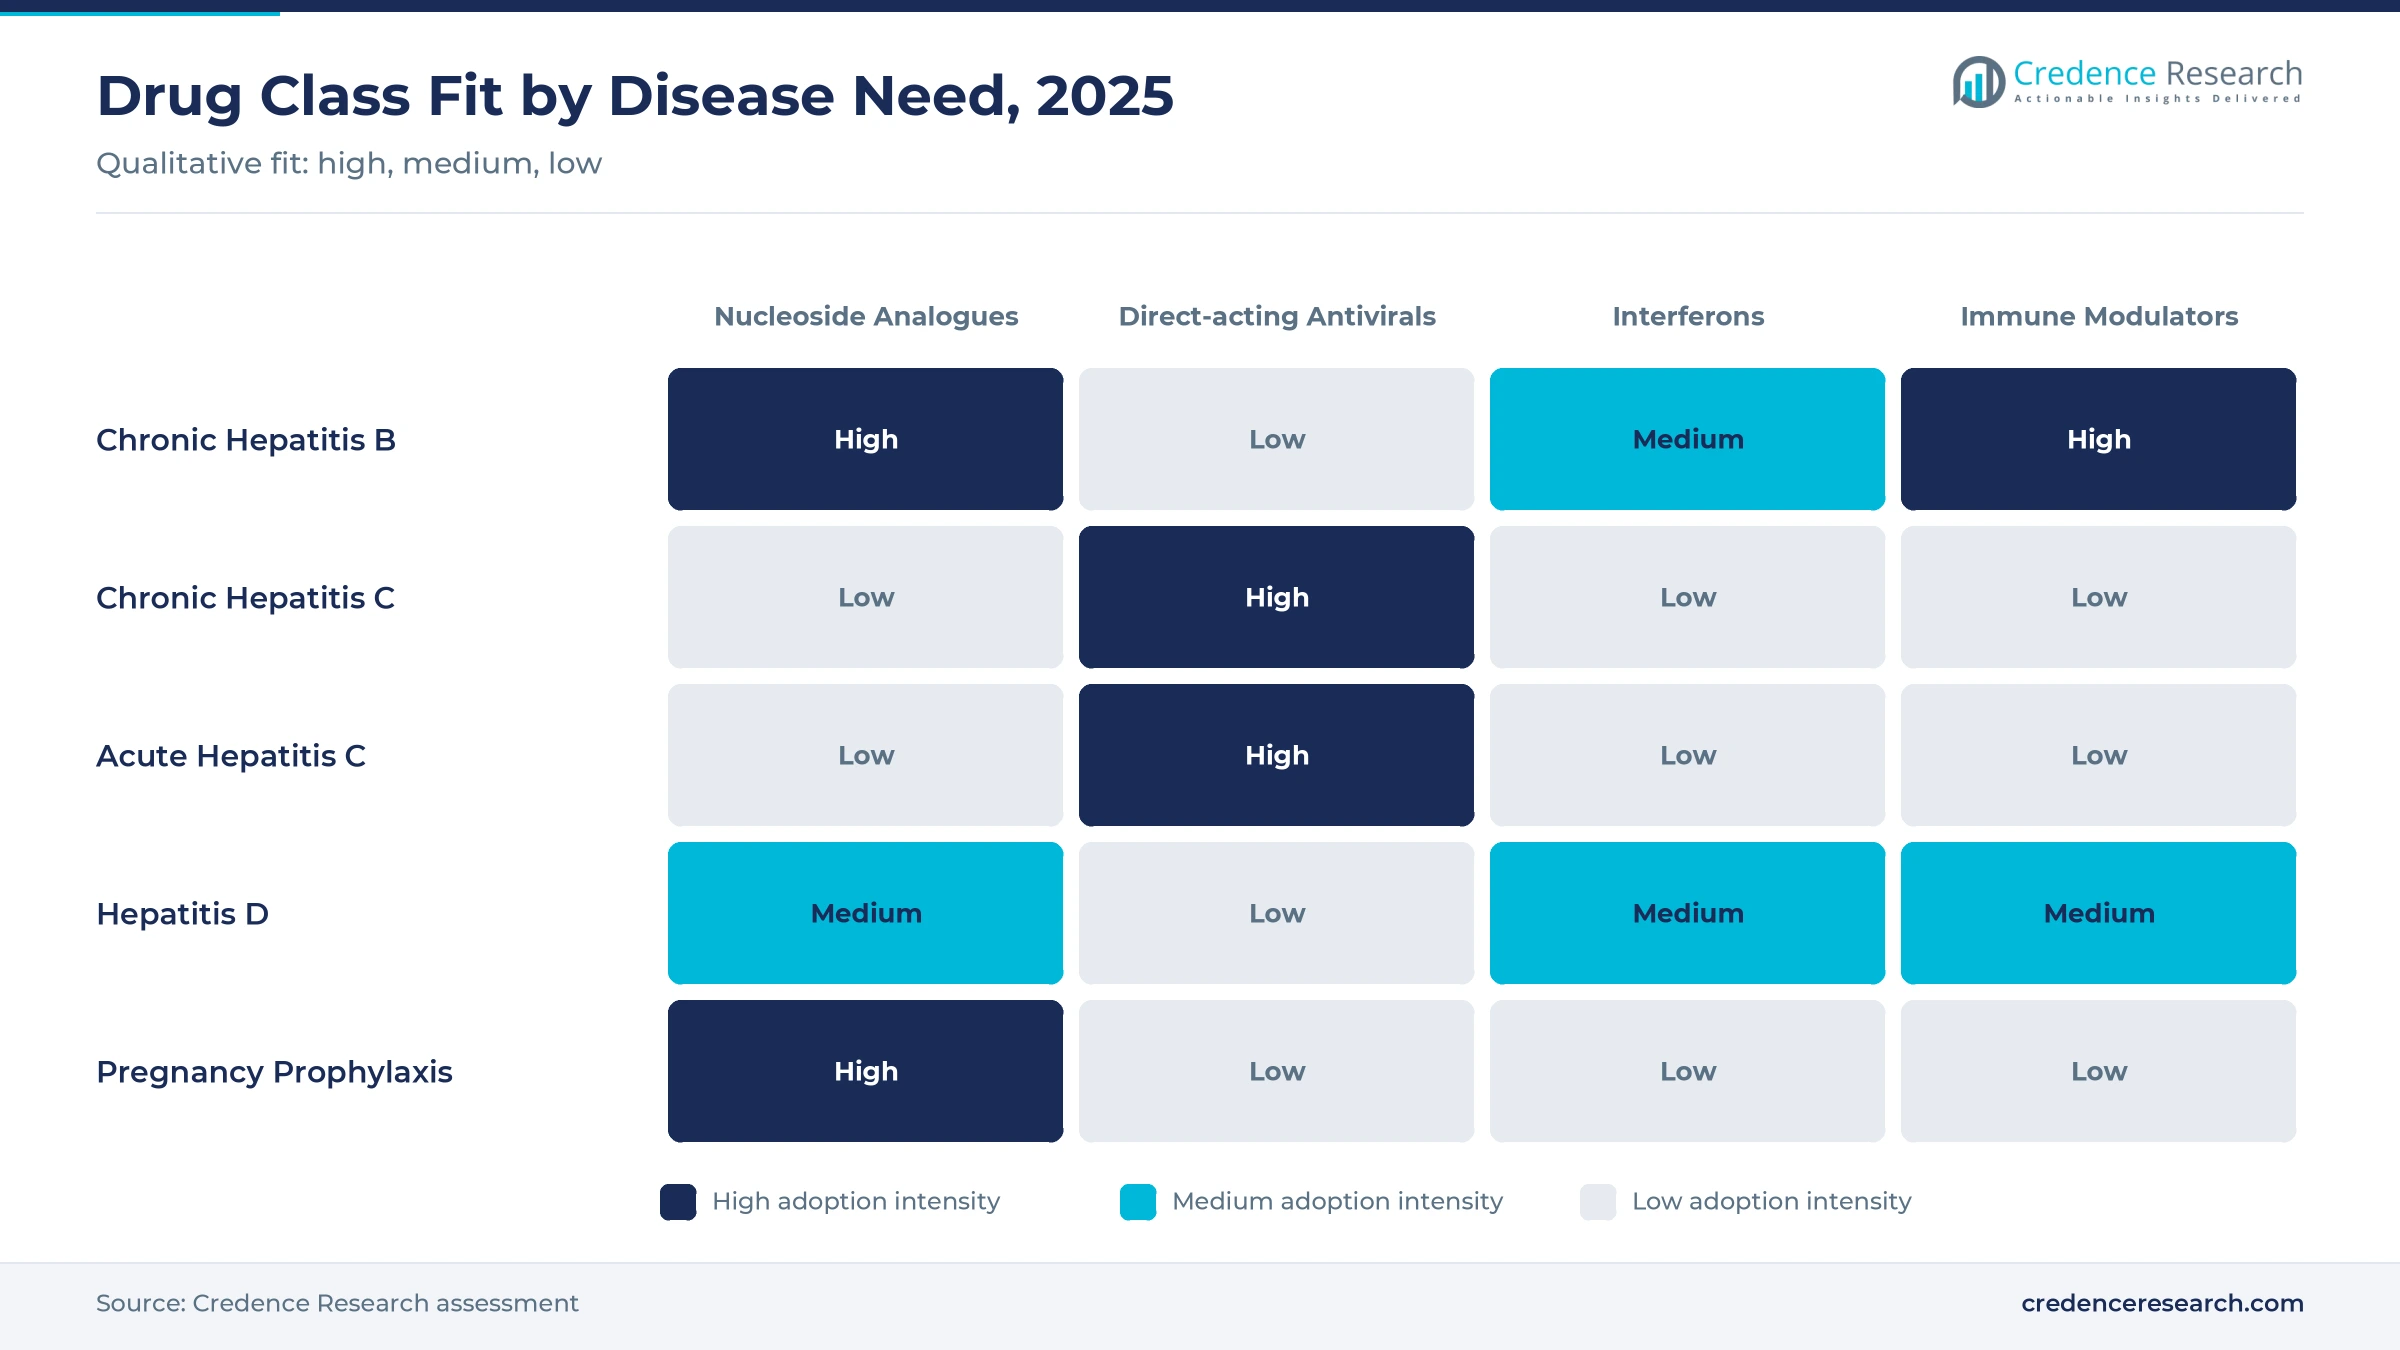
Based on disease type, the market is categorized into hepatitis B, hepatitis C and other hepatitis. Hepatitis B led with 52.0% of 2025 value, because chronic infection usually requires daily suppressive therapy for many years. Other Hepatitis grows fastest at 8.40% a year, as treatments for hepatitis D move through late-stage trials. Hepatitis C value grows more slowly, because short curative courses and generic regimens reduce spending per patient.
How do antiviral classes divide value?
Based on drug class, the market is categorized into direct-acting antivirals, interferons, nucleoside and nucleotide analogues, and immune modulators. Nucleoside and Nucleotide Analogues led with 44.0% of 2025 value, because tenofovir and entecavir remain first-line hepatitis B therapy. Immune Modulators grow fastest at 10.13% a year, as functional cure candidates such as bepirovirsen, counted in this group, approach approval. Interferons continue to lose share as doctors move patients to oral treatment.
Where do patients fill antiviral prescriptions?
Based on distribution channel, the market is categorized into hospital pharmacy, retail pharmacy, online pharmacy and others. Retail Pharmacy led with 45.0% of 2025 value, because patients refill long-term hepatitis B tablets at community pharmacies. Online Pharmacy grows fastest at 7.94% a year, as insurers and patients use mail-order and digital pharmacies for specialty courses and monthly refills.
| Segment Group | Leading Sub-segment | Share, 2025 | Fastest-growing Sub-segment | CAGR, 2026–2035 |
|---|---|---|---|---|
| By Disease Type | Hepatitis B | 52.0% | Other Hepatitis | 8.40% |
| By Drug Class | Nucleoside and Nucleotide Analogues | 44.0% | Immune Modulators | 10.13% |
| By Distribution Channel | Retail Pharmacy | 45.0% | Online Pharmacy | 7.94% |
Request a Free Sample
Fill in your details and we'll send you a free sample report.
- Sample data tables & charts
- Research methodology
Wider testing, new guidelines and functional cure trials
How does a large undiagnosed population sustain demand?
Viral hepatitis remains a leading infectious cause of death, and most infected people have not yet been diagnosed. WHO data released in April 2024 show that viral hepatitis deaths rose to 1.3 million in 2022, with hepatitis B causing 83% of them. Only 13% of people with hepatitis B and 36% of people with hepatitis C had been diagnosed by the end of 2022, and just 20% of people with hepatitis C had been cured. As a result, every new testing campaign moves patients into long-term treatment or curative therapy.
Why do new WHO guidelines widen treatment eligibility?
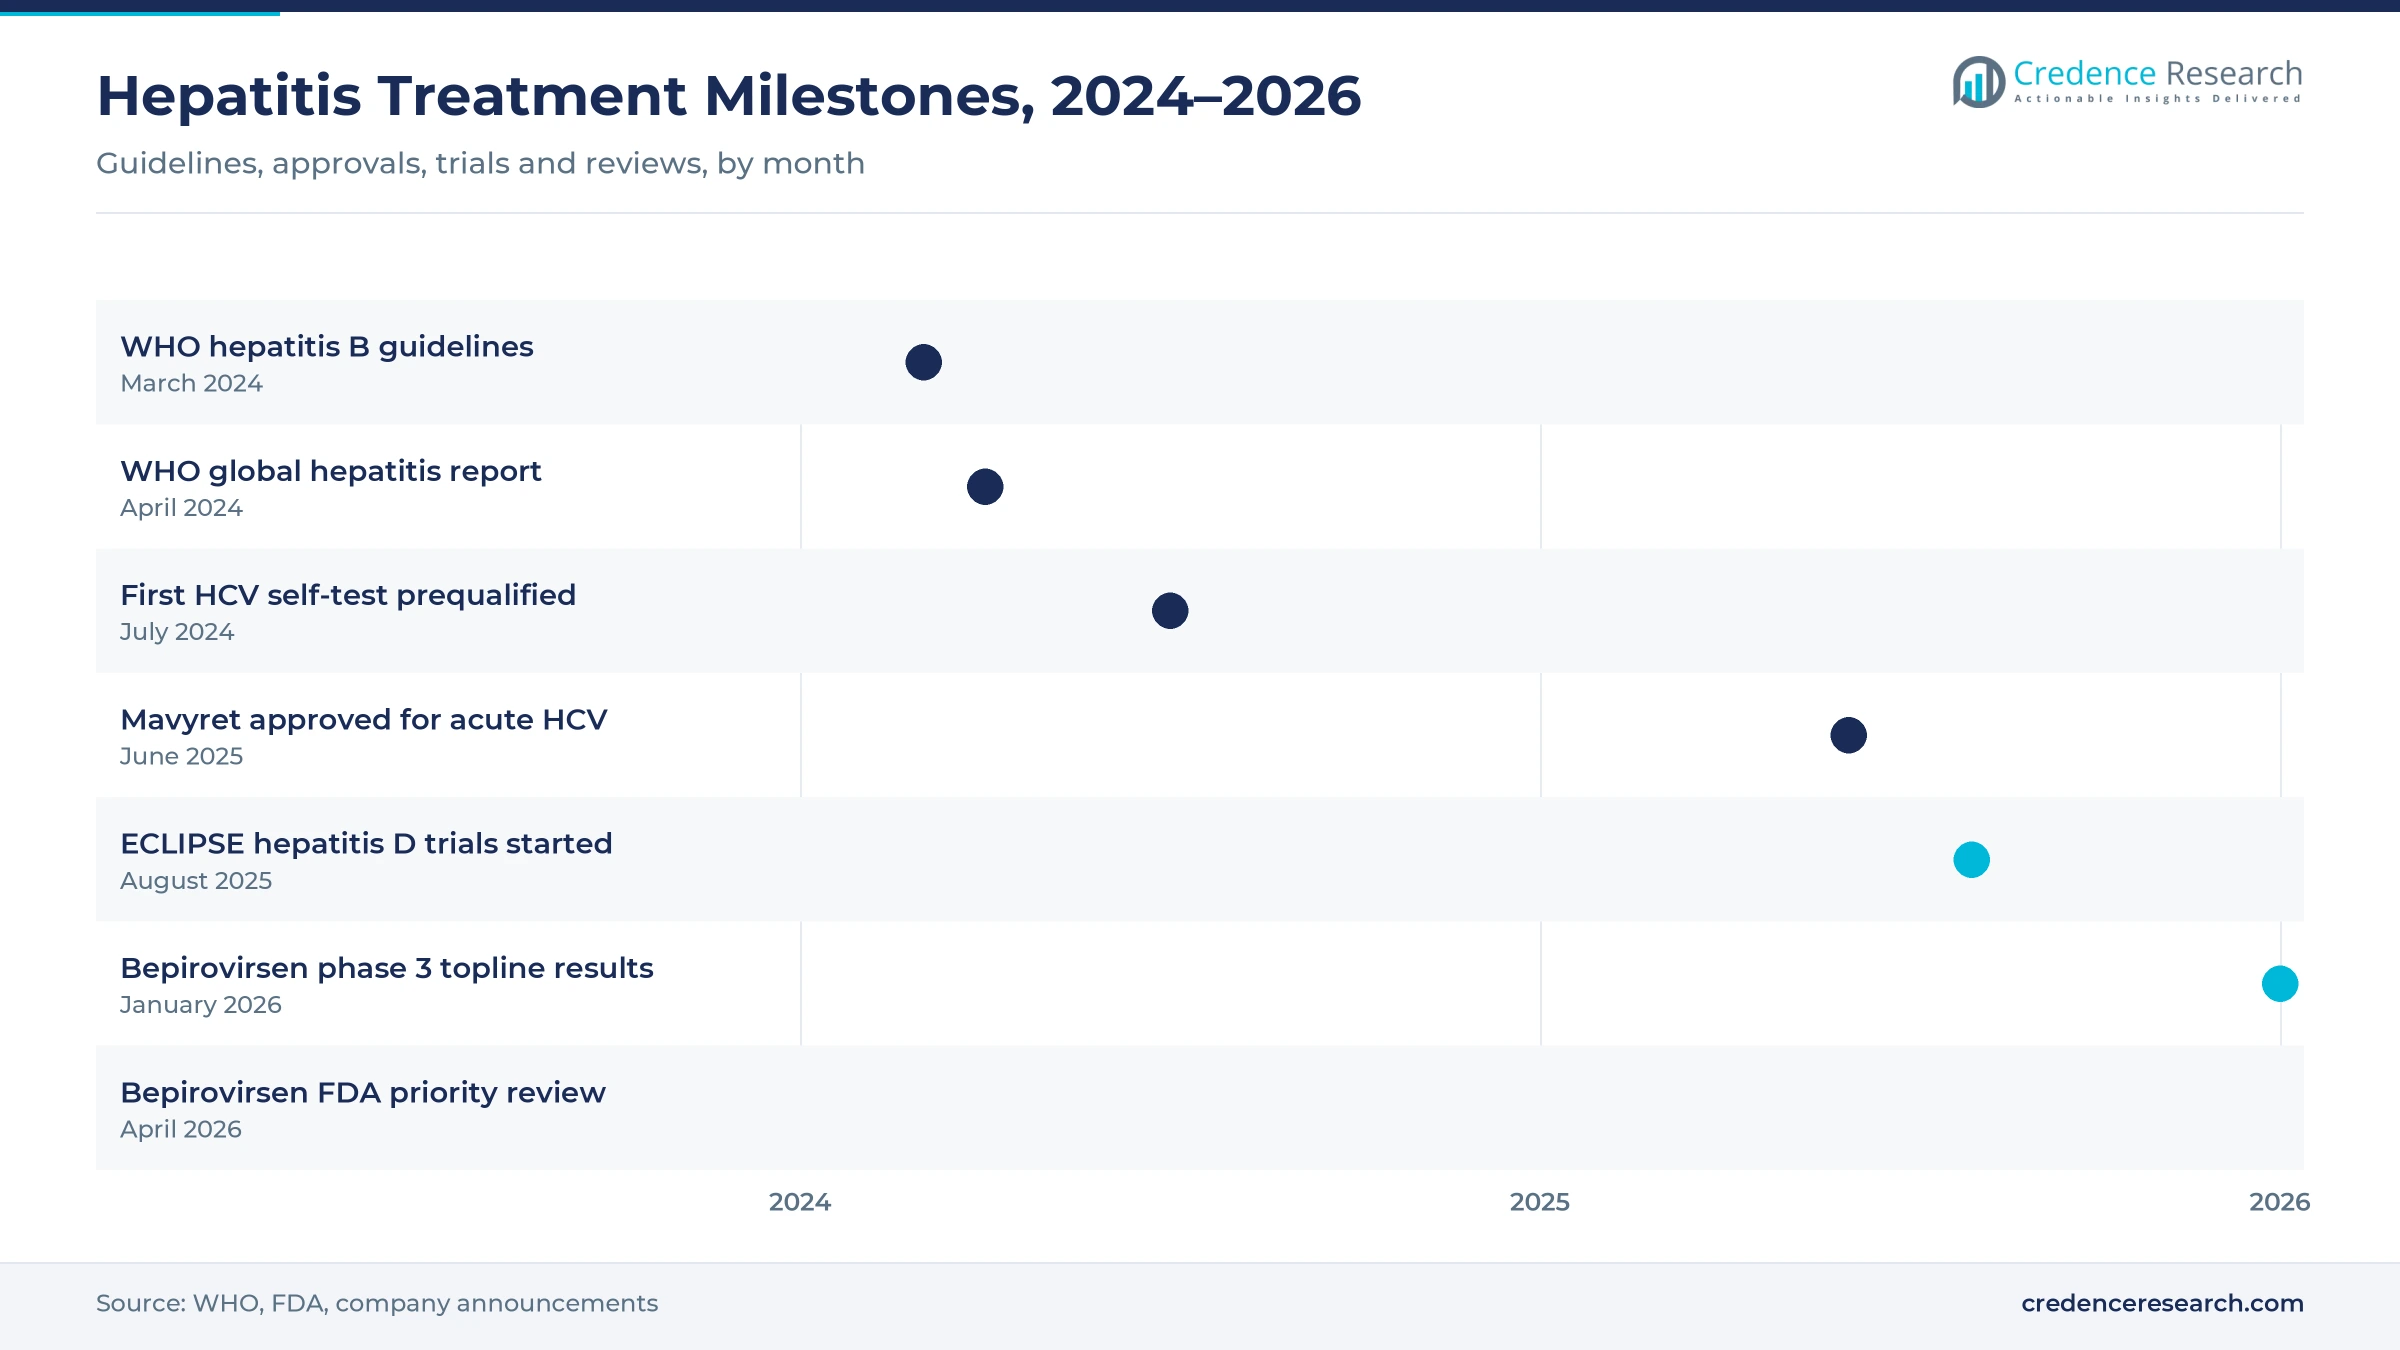
Treatment rules for hepatitis B have long been complex, which kept many eligible patients off therapy. On March 29, 2024, WHO published updated hepatitis B guidelines with simplified treatment criteria for adults and adolescents and wider antiviral prophylaxis for pregnant women. These changes let primary care workers start therapy without specialist tests in many settings. In turn, more patients in high-burden countries become eligible for daily tenofovir or entecavir, which lifts generic volume in the hepatitis drugs market through the decade.
How do functional cure trials attract investment?
Current hepatitis B tablets suppress the virus but rarely clear it, so patients often take them for life. In May 2026, pooled phase 3 B-Well data showed that 19% of patients on bepirovirsen reached functional cure versus 0% on standard care alone. In April 2026, GSK and Ionis announced FDA priority review with an action date of Oct. 26, 2026, and the medicine is also under review in the EU, China and Japan. A finite cure would add a premium branded class to the market.
Why does acute hepatitis C treatment add patients?
Doctors once waited months to see whether acute hepatitis C infections cleared without treatment, which delayed care. In June 2025, the FDA approved an expanded indication for AbbVie's Mavyret in acute hepatitis C, making it the first treatment for this stage with an 8-week course. The approval allows immediate treatment after diagnosis, which helps stop onward transmission among people who inject drugs. This change adds new patients to the direct-acting antiviral pool and supports demand for hepatitis drugs in U.S. outreach programs.
Functional cure, delta virus agents and acute HCV care
Why is functional cure research gaining ground?
Research is shifting from lifelong viral suppression toward finite treatment that clears hepatitis B surface antigen. Bepirovirsen, an antisense medicine, met its primary endpoint in two phase 3 trials that enrolled over 1,800 patients across 29 countries. Response was higher in patients with low baseline antigen levels, where 26% reached functional cure. This shift points to a new branded segment that could raise spending per treated patient after 2026.
How are hepatitis D treatments emerging?
Hepatitis D is the most severe form of chronic viral hepatitis, yet the U.S. still has no approved treatment for it. In August 2025, Vir Biotechnology initiated all trials in its ECLIPSE registrational program for tobevibart plus elebsiran, including a head-to-head study against bulevirtide. The combination holds FDA Breakthrough Therapy and EMA PRIME status. As a result, other hepatitis becomes the fastest-growing disease group through 2035.
Where is the opening in high-burden countries?
High-burden countries offer a large opening for low-cost generic suppliers, because ten countries carry nearly two-thirds of the global hepatitis B and C burden. WHO sets a benchmark price of USD 2.4 a month for generic tenofovir and USD 60 for a 12-week sofosbuvir and daclatasvir course. Indian makers such as Dr. Reddy's, Zydus and Aprazer supply these regimens at scale. Public programs in India, Pakistan and Egypt can therefore treat far more patients within fixed budgets.
Can wider testing and digital pharmacy add volume?
Simpler testing creates an opening to find more patients outside hospitals and specialist clinics. In July 2024, WHO announced it had prequalified the first hepatitis C self-test, which lets people test at home before seeking confirmatory care. Linked services such as HIV testing programs already reach many of the same high-risk groups. Patients diagnosed through these routes can then receive treatment through e-pharmacy services that deliver medicine to the home.
Low diagnosis, price erosion and stigma limit uptake
How does low diagnosis limit treated volume?
Most people with chronic hepatitis feel well for years, so they rarely seek testing until the liver is damaged. WHO data show that only about 3% of people with hepatitis B received antiviral therapy by the end of 2022. Without diagnosis, millions of eligible patients never fill a prescription, which holds market volume well below the size of the infected population. Integrating testing into primary care and antenatal services is the main way to close this gap.
Why does generic price erosion reduce value?
Generic tenofovir and direct-acting antivirals have pushed prices down sharply in most low- and middle-income countries. Only 7 of 26 reporting countries paid at or below the WHO benchmark for tenofovir, and only 4 of 24 did so for a hepatitis C course. As tenders push more countries toward these benchmarks, spending per patient keeps falling. This erosion holds hepatitis C value growth well below patient growth in many markets.
What keeps hepatitis C value from rising?
Hepatitis C is curable in most patients within 8 to 12 weeks, so every successful course removes a patient from the treatment pool. WHO reports that 12.5 million people had been cured by the end of 2022, which leaves a smaller and harder to reach group. Remaining patients often include people who inject drugs and people in prison, who need outreach services. Because of these limits, hepatitis C sales depend on new screening programs.
Why do safety and access gaps slow uptake?
Long-term antiviral therapy needs regular monitoring, and stopping hepatitis B tablets can cause severe flares of liver disease. Clinics must track liver tests and viral load, which strains services in rural areas. Only about one third of African Region countries offer free public testing and treatment, according to WHO. These gaps keep many patients untreated even where low-cost generic medicines are available.
North America leads while Asia Pacific grows fastest
| Region | Value, 2025 (USD billion) | Share, 2025 | CAGR, 2026–2035 |
|---|---|---|---|
| North America | 10.02 | 41.0% | 5.43% |
| Asia Pacific | 6.60 | 27.0% | 7.23% |
| Europe | 5.37 | 22.0% | 5.23% |
| Latin America | 1.22 | 5.0% | 6.53% |
| Middle East & Africa | 1.22 | 5.0% | 6.93% |
North America leads on branded antiviral prices
North America held a 41.0% share of 2025 value and grows at 5.43% a year through 2035. The U.S. leads spending, because branded hepatitis C regimens and hepatitis B tablets carry higher prices than in other regions. Insurers and Medicaid programs cover curative treatment, and the acute hepatitis C approval in 2025 adds new patients. A possible bepirovirsen approval in late 2026 could add a premium hepatitis B option, while liver cancer screening brings more chronic patients into specialist care.
Asia Pacific grows on testing and treatment programs
Asia Pacific held a 27.0% share of 2025 value and is the fastest-growing region at 7.23% a year. China, India, Indonesia, the Philippines and Vietnam are among the ten countries that carry nearly two-thirds of the global burden. Wider screening and simpler WHO treatment rules bring more hepatitis B patients onto daily therapy. Japan and South Korea add value through branded medicines and early access to new agents.
Europe balances new agents and tight budgets
Europe held a 22.0% share of 2025 value and grows at 5.23% a year, the slowest pace among the five regions. Germany, France, Italy, Spain and the U.K. account for most demand, and bulevirtide is already used for hepatitis D in parts of the region. Bepirovirsen is under EMA review, which could add a new option. However, health technology assessment and generic substitution keep prices below U.S. levels.
Latin America relies on public programs
Latin America held a 5.0% share of 2025 value and grows at 6.53% a year through 2035. Brazil and Mexico lead demand through national programs that buy generic tenofovir and hepatitis C regimens in large tenders. Budget limits slow access to newer branded agents across the region.
Middle East and Africa start from a low base
The Middle East & Africa held a 5.0% share of 2025 value and grows at 6.93% a year. The African Region accounts for 63% of new hepatitis B infections, yet treatment coverage remains low. Egypt and Gulf states lead regional spending through national testing and treatment programs.
Guidelines, approvals and trial results since 2024
| Development | Status and market relevance |
|---|---|
| In March 2024, WHO published updated hepatitis B guidelines with simplified treatment criteria and wider prophylaxis for pregnant women. | In force. Widens treatment eligibility worldwide. |
| In July 2024, WHO prequalified the first hepatitis C self-test, the OraQuick HCV self-test from OraSure Technologies. | Prequalified. Expands home testing and diagnosis. |
| In June 2025, the FDA approved an expanded indication for AbbVie's Mavyret as the first treatment for acute hepatitis C. | Approved. Allows immediate 8-week treatment after diagnosis. |
| In August 2025, Vir Biotechnology initiated all trials in its ECLIPSE registrational program for chronic hepatitis delta. | Recruiting. Could bring a new option for hepatitis D. |
| In April 2026, GSK and Ionis announced FDA priority review for bepirovirsen in chronic hepatitis B, with an Oct. 26, 2026 action date. | Under review. Also under review in the EU, China and Japan. |
Antisense, antibodies and pangenotypic regimens advance
- Antisense oligonucleotides such as bepirovirsen lower viral proteins and can lead to functional cure of hepatitis B in some patients.
- Monoclonal antibodies with siRNA such as tobevibart plus elebsiran target hepatitis D through two mechanisms in one regimen.
- Pangenotypic direct-acting antivirals such as glecaprevir with pibrentasvir cure hepatitis C across genotypes in eight weeks.
- Entry inhibitors such as bulevirtide block the virus from entering liver cells in patients with hepatitis D.
- Prodrug nucleotide analogues such as tenofovir alafenamide suppress hepatitis B with lower doses and less effect on kidneys and bone.
Need a Custom Version of This Report?
Tailor the scope, geography, or segments to your exact requirements.
- Custom geography or segment scope
- Direct access to our analyst team
Originators defend brands as generic makers widen access
Competition splits into originators of branded antivirals, developers of functional cure agents and generic makers. Gilead Sciences holds a broad hepatitis B and C portfolio that includes tenofovir alafenamide and sofosbuvir-based regimens, and AbbVie competes in hepatitis C with Mavyret. Bristol-Myers Squibb, Merck, Roche and Novartis hold older antiviral and interferon brands that now face generic competition. GlaxoSmithKline is moving into hepatitis B with bepirovirsen, and Johnson & Johnson rounds out the group of large diversified companies tracked in this report. Dr. Reddy's Laboratories, Zydus Cadila and Aprazer Healthcare supply low-cost generic tenofovir, entecavir and direct-acting antivirals to public programs in Asia, Africa and Latin America. Companies compete on cure rates, safety, pediatric labels and price, with public tenders deciding most hepatitis drugs volume. In March 2024, Gilead also announced FDA approval of Vemlidy for children aged 6 and older weighing at least 25 kg.
Companies profiled and their roles in this market
| Company | Type | Role in the market |
|---|---|---|
| Gilead Sciences | Originator | Hepatitis B tablets and sofosbuvir-based regimens |
| AbbVie Inc. | Originator | Mavyret for chronic and acute hepatitis C |
| GlaxoSmithKline | Originator | Bepirovirsen for chronic hepatitis B |
| Bristol-Myers Squibb | Originator | Entecavir and daclatasvir brands |
| Merck & Co., Inc. | Originator | Hepatitis C regimen and interferon heritage |
| Roche | Originator | Peginterferon heritage and liver disease research |
| Johnson & Johnson Services, Inc. | Diversified pharma | Infectious disease research portfolio |
| Novartis AG | Diversified pharma | Antiviral brands and generics through its legacy portfolio |
| Dr. Reddy's Laboratories | Generic maker | Generic antivirals for emerging markets |
| Zydus Cadila | Generic maker | Generic hepatitis B and C regimens |
| Aprazer Healthcare | Generic maker | Low-cost antivirals for export markets |
Functional cure agents open a new branded cycle
Credence Research's view is that functional cure agents for hepatitis B will open a new branded cycle that offsets continued price erosion in hepatitis C. The 19% functional cure rate for bepirovirsen is modest, but it gives doctors a finite option for patients with low antigen levels. Hepatitis D treatments add a smaller patient group with high value per patient. At the same time, generic makers gain volume as WHO guidelines widen eligibility in high-burden countries, so both branded and generic suppliers can grow on different measures.
How the 2025 baseline and forecast were built
The report uses 2025 as the base year and forecasts market value to 2035, with growth rates stated for 2026–2035. Market values come from the Credence Research market model, which combines treated patient numbers, typical regimen length and average selling prices by region and channel. Splits by disease type, drug class, distribution channel and region are Credence Research estimates. Sources used include WHO data and guidelines, FDA decisions and company press releases. No primary interviews or surveys were used to build the estimates in this report.
Cure-focused therapy and wider access shape 2035
By 2035, the market reaches USD 43.88 billion, with value moving toward functional cure agents for hepatitis B and new treatments for hepatitis D. Hepatitis B remains the largest disease group as more patients are diagnosed and treated. Hepatitis C value stays under pressure from generic regimens and a shrinking untreated pool. Asia Pacific gains share as screening widens in China and India. Progress toward the WHO goal of treating 80% of people with chronic infection will decide how quickly volume grows.
Frequently Asked Questions
How big is the hepatitis drugs market?
Which disease type leads the market?
Which drug class grows fastest?
Which region holds the largest share?
How many people are diagnosed and treated?
What is the status of bepirovirsen?
Who are the leading companies?
What are the main challenges?
Table of Content
Chapter 1 Market Segmentation
- 1.1 Segmentation Framework
- 1.1.1 Product and Service Classification
- 1.1.2 Application and End-Use Classification
- 1.1.3 Technology and Solution Classification
- 1.1.4 Customer and Distribution Channel Classification
- 1.1.5 Geographic Segmentation
- 1.1.6 Market Segment Definitions and Boundaries
- 1.2 By Disease Type
- 1.2.1 Hepatitis B
- 1.2.2 Hepatitis C
- 1.2.3 Other Hepatitis
- 1.3 By Drug Class
- 1.3.1 Nucleoside and Nucleotide Analogues
- 1.3.2 Direct-acting Antivirals
- 1.3.3 Interferons
- 1.3.4 Immune Modulators
Chapter 2 Introduction
- 2.1 Report Objectives and Scope
- 2.2 Product Definition and Industry Terminology
- 2.3 Market Inclusions and Exclusions
- 2.4 Research Process
- 2.4.1 Primary Research and Expert Interviews
- 2.4.2 Secondary Research and Source Review
- 2.4.3 Top-Down and Bottom-Up Estimation
- 2.4.4 Data Triangulation and Verification
- 2.5 Market Size Measurement Basis
- 2.5.1 2025: USD 24.43 billion → 2035: USD 43.88 billion
- 2.6 Historical and Forecast Reference Periods
- 2.6.1 Historical Period: 2018-2025
- 2.6.2 Base Year: 2025
- 2.6.3 Forecast Period: 2025-2035
- 2.7 Research Assumptions and Limitations
Chapter 3 Executive Summary
- 3.1 Market Snapshot and Key Findings
- 3.2 Base-Year Market Size, 2025
- 3.3 Forecast Market Size, 2035
- 3.4 Revenue and Volume Growth Outlook
- 3.5 Key Demand and Supply Indicators
- 3.6 Leading Market Segments
- 3.7 Fastest-Growing Market Opportunities
- 3.8 Regional Performance Highlights
- 3.9 Technology and Industry Transformation
- 3.10 Competitive Landscape Summary
- 3.11 Analyst View and Strategic Implications
Chapter 4 Global Hepatitis Drugs Market Trends and Developments
- 4.1 Historical Industry Development, 2018-2025
- 4.2 Recent Market Trends and Developments
- 4.3 Demand and Customer Behavior Trends
- 4.4 Technology and Product Innovation
- 4.5 Artificial Intelligence, Automation and Digitalization
- 4.6 Local Manufacturing and Supply Chain Realignment
- 4.7 Industry Partnerships, Mergers and Acquisitions
- 4.8 Sustainability and Circular Economy Developments
- 4.9 Government and Private Sector Investment Trends
- 4.10 Emerging Business Models and Commercialization
- 4.11 Industry Developments and Announcements
Chapter 5 Global Hepatitis Drugs Market Production, Supply and Demand Analysis
- 5.1 Demand Trend and Consumption Analysis, 2018-2025
- 5.2 Demand Forecast, 2025-2035
- 5.3 Production and Output Trend, 2018-2025
- 5.4 Production and Output Forecast, 2025-2035
- 5.5 Installed Capacity and Capacity Utilization
- 5.6 Company-Wise Production Plants and Statistics
- 5.6.1 Installed Production Capacity
- 5.6.2 Actual Production
- 5.6.3 Planned Capacity and Expansion Targets
- 5.7 Supply Chain Structure and Procurement Trends
- 5.8 Supply-Demand Gap and Bottlenecks
- 5.9 Import Dependence and Sourcing Structure
- 5.10 Contract Manufacturing and Outsourcing
- 5.11 Regional Supply and Demand Concentration
Chapter 6 Global Hepatitis Drugs Market Pricing Analysis
- 6.1 Pricing Structure and Measurement
- 6.2 Historical Pricing Trends, 2018-2025
- 6.3 Pricing Outlook, 2025-2035
- 6.4 Average Selling Price and Unit Economics
- 6.5 Pricing by Product and Market Segment
- 6.6 Geographic Pricing Differences
- 6.7 Key Input, Energy, Labor and Logistics Costs
- 6.8 Contract Pricing and Purchasing Models
- 6.9 Pricing Sensitivity and Competitive Positioning
- 6.10 Price, Margin and Profitability Implications
Chapter 7 Global Hepatitis Drugs Market Dynamics
- 7.1 Market Growth Drivers
- 7.1.1 Demand-Side Drivers
- 7.1.2 Technology and Innovation Drivers
- 7.1.3 Infrastructure and Investment Drivers
- 7.1.4 Regulatory and Policy Drivers
- 7.2 Market Restraints
- 7.2.1 Cost and Affordability Constraints
- 7.2.2 Technology and Adoption Barriers
- 7.2.3 Supply Chain and Operational Constraints
- 7.3 Market Challenges
- 7.3.1 Competitive Pressure and Margin Erosion
- 7.3.2 Skills, Infrastructure and Implementation Gaps
- 7.4 Emerging Market Opportunities
- 7.5 Market Dynamics Impact and Time-Horizon Assessment
Chapter 8 Global Hepatitis Drugs Value Chain Analysis
- 8.1 Industry Value Chain Overview
- 8.2 Upstream Suppliers and Critical Inputs
- 8.3 Technology and Component Providers
- 8.4 Manufacturing or Service Delivery
- 8.5 Distribution, Channel Partners and Integrators
- 8.6 Downstream Applications and End Users
- 8.7 Value Addition and Profit Pools
- 8.8 Vertical Integration and Outsourcing
- 8.9 Supplier Concentration and Risk
- 8.10 Supply Chain Localization and Resilience
Chapter 9 Global Hepatitis Drugs Market Regulations and Policies
- 9.1 Relevant Laws, Standards and Compliance Frameworks
- 9.2 Product, Service, Safety and Quality Requirements
- 9.3 Government Policies, Incentives and Subsidies
- 9.4 Imports, Exports and Trade Barriers
- 9.5 Public Procurement and Local Content Requirements
- 9.6 Environmental and Sustainability Compliance
- 9.7 Upcoming Policy Changes and Market Implications
Chapter 10 Global Hepatitis Drugs Market Hotspots and Opportunities
- 10.1 Market Opportunity Mapping and Growth Hotspots
- 10.2 High-Growth Applications and Customer Groups
- 10.3 Underserved Markets and White-Space Opportunities
- 10.4 Emerging Technology and Product Opportunities
- 10.5 New Capacity and Investment Hotspots
- 10.6 Market Entry and Expansion Opportunities
- 10.7 Distribution and Partnership Opportunities
- 10.8 Near-Term and Long-Term Commercial Potential
- 10.9 Opportunity Attractiveness and Execution Risks
Chapter 11 Global Hepatitis Drugs Market Outlook, 2025-2035
- 11.1 Market Size and Analysis
- 11.1.1 Revenue (Market Measurement: 2025: USD 24.43 billion → 2035: USD 43.88 billion)
- 11.1.2 Market Volume and Quantity Sold
- 11.1.3 Historical Market Size, 2018-2025
- 11.1.4 Base-Year Market Size, 2025
- 11.2 Market Forecast, 2025-2035
- 11.2.1 Revenue Forecast to 2035
- 11.2.2 Volume Forecast to 2035
- 11.2.3 CAGR and Year-on-Year Growth
- 11.2.4 Incremental Revenue Opportunity
- 11.3 Forecast Assumptions and Scenario Analysis
- 11.3.1 Base-Case Forecast
- 11.3.2 Optimistic and Conservative Scenarios
- 11.3.3 Technology, Pricing and Policy Sensitivities
- 11.4 Market Attractiveness and Growth Outlook
Chapter 12 Global Hepatitis Drugs Market Segmentation and Outlook
- 12.1 Segmentation Summary and Market Shares, 2025
- 12.2 Largest and Fastest-Growing Segments
- 12.3 By Disease Type - Market Size and Forecast, 2025-2035
- 12.3.1 Segment Definition and Scope
- 12.3.2 Historical Market Size, 2018-2025
- 12.3.3 Revenue Forecast, 2025-2035
- 12.3.4 Volume Forecast, 2025-2035
- 12.3.5 Base-Year Market Share, 2025
- 12.3.6 Segment CAGR and Growth Drivers
- 12.3.7 Subsegment Market Size and Forecast
- 12.3.7.1 Hepatitis B
- 12.3.7.2 Hepatitis C
- 12.3.7.3 Other Hepatitis
- 12.3.8 Subsegment Pricing and Adoption Trends
- 12.3.9 Leading Suppliers and Competition
- 12.3.10 Regional Demand and Opportunities
- 12.4 By Drug Class - Market Size and Forecast, 2025-2035
- 12.4.1 Segment Definition and Scope
- 12.4.2 Historical Market Size, 2018-2025
- 12.4.3 Revenue Forecast, 2025-2035
- 12.4.4 Volume Forecast, 2025-2035
- 12.4.5 Base-Year Market Share, 2025
- 12.4.6 Segment CAGR and Growth Drivers
- 12.4.7 Subsegment Market Size and Forecast
- 12.4.7.1 Nucleoside and Nucleotide Analogues
- 12.4.7.2 Direct-acting Antivirals
- 12.4.7.3 Interferons
- 12.4.7.4 Immune Modulators
- 12.4.8 Subsegment Pricing and Adoption Trends
- 12.4.9 Leading Suppliers and Competition
- 12.4.10 Regional Demand and Opportunities
- 12.5 Segment Growth Comparison
- 12.6 Segment Attractiveness and Priority Matrix
Chapter 13 Global Hepatitis Drugs Geographic Market Outlook, 2025-2035
- 13.1 Regional Market Size and Share, 2025
- 13.2 Regional Market Forecast, 2025-2035
- 13.3 Regional Pricing, Production and Demand Differences
- 13.4 North America
- 13.4.1 United States
- 13.4.2 Canada
- 13.4.3 Mexico
- 13.5 Europe
- 13.5.1 Germany
- 13.5.2 France
- 13.5.3 Italy
- 13.5.4 United Kingdom
- 13.5.5 Spain
- 13.5.6 Poland
- 13.5.7 Russia
- 13.5.8 Netherlands
- 13.5.9 Belgium
- 13.5.10 Sweden
- 13.5.11 Denmark
- 13.5.12 Norway
- 13.5.13 Rest of Europe
- 13.6 Asia Pacific
- 13.6.1 China
- 13.6.2 India
- 13.6.3 Japan
- 13.6.4 South Korea
- 13.6.5 Thailand
- 13.6.6 Indonesia
- 13.6.7 Vietnam
- 13.6.8 Malaysia
- 13.6.9 Australia
- 13.6.10 Rest of Asia Pacific
- 13.7 Latin America
- 13.7.1 Brazil
- 13.7.2 Argentina
- 13.7.3 Colombia
- 13.7.4 Chile
- 13.7.5 Rest of Latin America
- 13.8 Middle East
- 13.8.1 Saudi Arabia
- 13.8.2 United Arab Emirates
- 13.8.3 Turkey
- 13.8.4 Israel
- 13.8.5 Iran
- 13.8.6 Rest of the Middle East
- 13.9 Africa
- 13.9.1 South Africa
- 13.9.2 Egypt
- 13.9.3 Nigeria
- 13.9.4 Morocco
- 13.9.5 Rest of Africa
- 13.10 Regional Investment, Policy and Supply Chain Differences
- 13.11 Regional Competitive Landscape
- 13.12 Geographic Growth Hotspots
Chapter 14 Global Hepatitis Drugs Technology, Innovation and Sustainability Outlook
- 14.1 Technology Landscape and Maturity
- 14.2 Product, Process and Service Innovation
- 14.3 AI, Automation and Digital Tools in the Industry
- 14.4 Technology Adoption and Performance Benchmarking
- 14.5 Innovation Pipeline and R&D Investment
- 14.6 Patent and Intellectual Property Trends
- 14.7 Energy Efficiency and Resource Management
- 14.8 Sustainability, Recycling and Circularity
- 14.9 Technology Roadmap, 2025-2035
- 14.10 Risks of Obsolescence and Technology Substitution
Chapter 15 Global Hepatitis Drugs Market Key Strategic Imperatives
- 15.1 Growth and Market Entry Priorities
- 15.2 High-Return Products and Segments
- 15.3 Pricing, Profitability and Cost Optimization
- 15.4 Technology Investment and Product Differentiation
- 15.5 Supply Chain Localization and Resilience
- 15.6 Distribution and Customer Acquisition
- 15.7 Partnership, Acquisition and Capacity Strategy
- 15.8 Regional Expansion Priorities
- 15.9 Short-, Medium- and Long-Term Actions
Chapter 16 Competition Outlook
- 16.1 Industry Competition Characteristics
- 16.2 Market Structure and Concentration
- 16.3 Market Share and Competitive Positioning, 2025
- 16.4 Company-Wise Revenue and Product Benchmarking
- 16.5 Production and Service Capacity Benchmarking
- 16.6 Technology, Pricing and Differentiation
- 16.7 Regional Footprint and Distribution Strength
- 16.8 Mergers, Acquisitions and Strategic Alliances
- 16.9 New Entrants and Competitive Threats
- 16.10 Porter's Five Forces and Industry Attractiveness
- 16.11 Competitive Outlook, 2025-2035
Chapter 17 Company Profiles
- 17.1 Company Coverage and Selection Criteria
- 17.2 Gilead Sciences
- 17.2.1 Business Description
- 17.2.2 Company Ownership and Geographic Presence
- 17.2.3 Product and Service Portfolio
- 17.2.4 Manufacturing and Operating Footprint
- 17.2.5 Production Capacity and Expansion Plans
- 17.2.6 Financial Performance and Investment
- 17.2.7 Market Share and Competitive Position
- 17.2.8 Technology and Innovation Capabilities
- 17.2.9 Strategic Alliances or Partnerships
- 17.2.10 Recent Developments
- 17.2.11 Growth Strategy and Outlook
- 17.3 AbbVie Inc.
- 17.4 Johnson & Johnson Services, Inc.
- 17.5 Bristol-Myers Squibb
- 17.6 Merck & Co., Inc.
- 17.7 Roche
- 17.8 Aprazer Healthcare
- 17.9 GlaxoSmithKline
- 17.10 Novartis AG
- 17.11 Dr. Reddy's Laboratories
- 17.12 Zydus Cadila
- 17.13 Other Relevant Market Participants
Note: Every listed company is profiled on the structure shown under the first company. The company list is preliminary and may change based on research findings, market developments, data availability and client requirements.
Chapter 18 Disclaimer
- 18.1 Research and Forecast Disclaimer
- 18.2 Data Source and Estimation Limitations
Note: The depth of individual sections depends on data availability for this market. Volume, capacity, trade and other unit-based metrics are included where applicable.

