
Lifelong treatment and prevention sustain steady demand
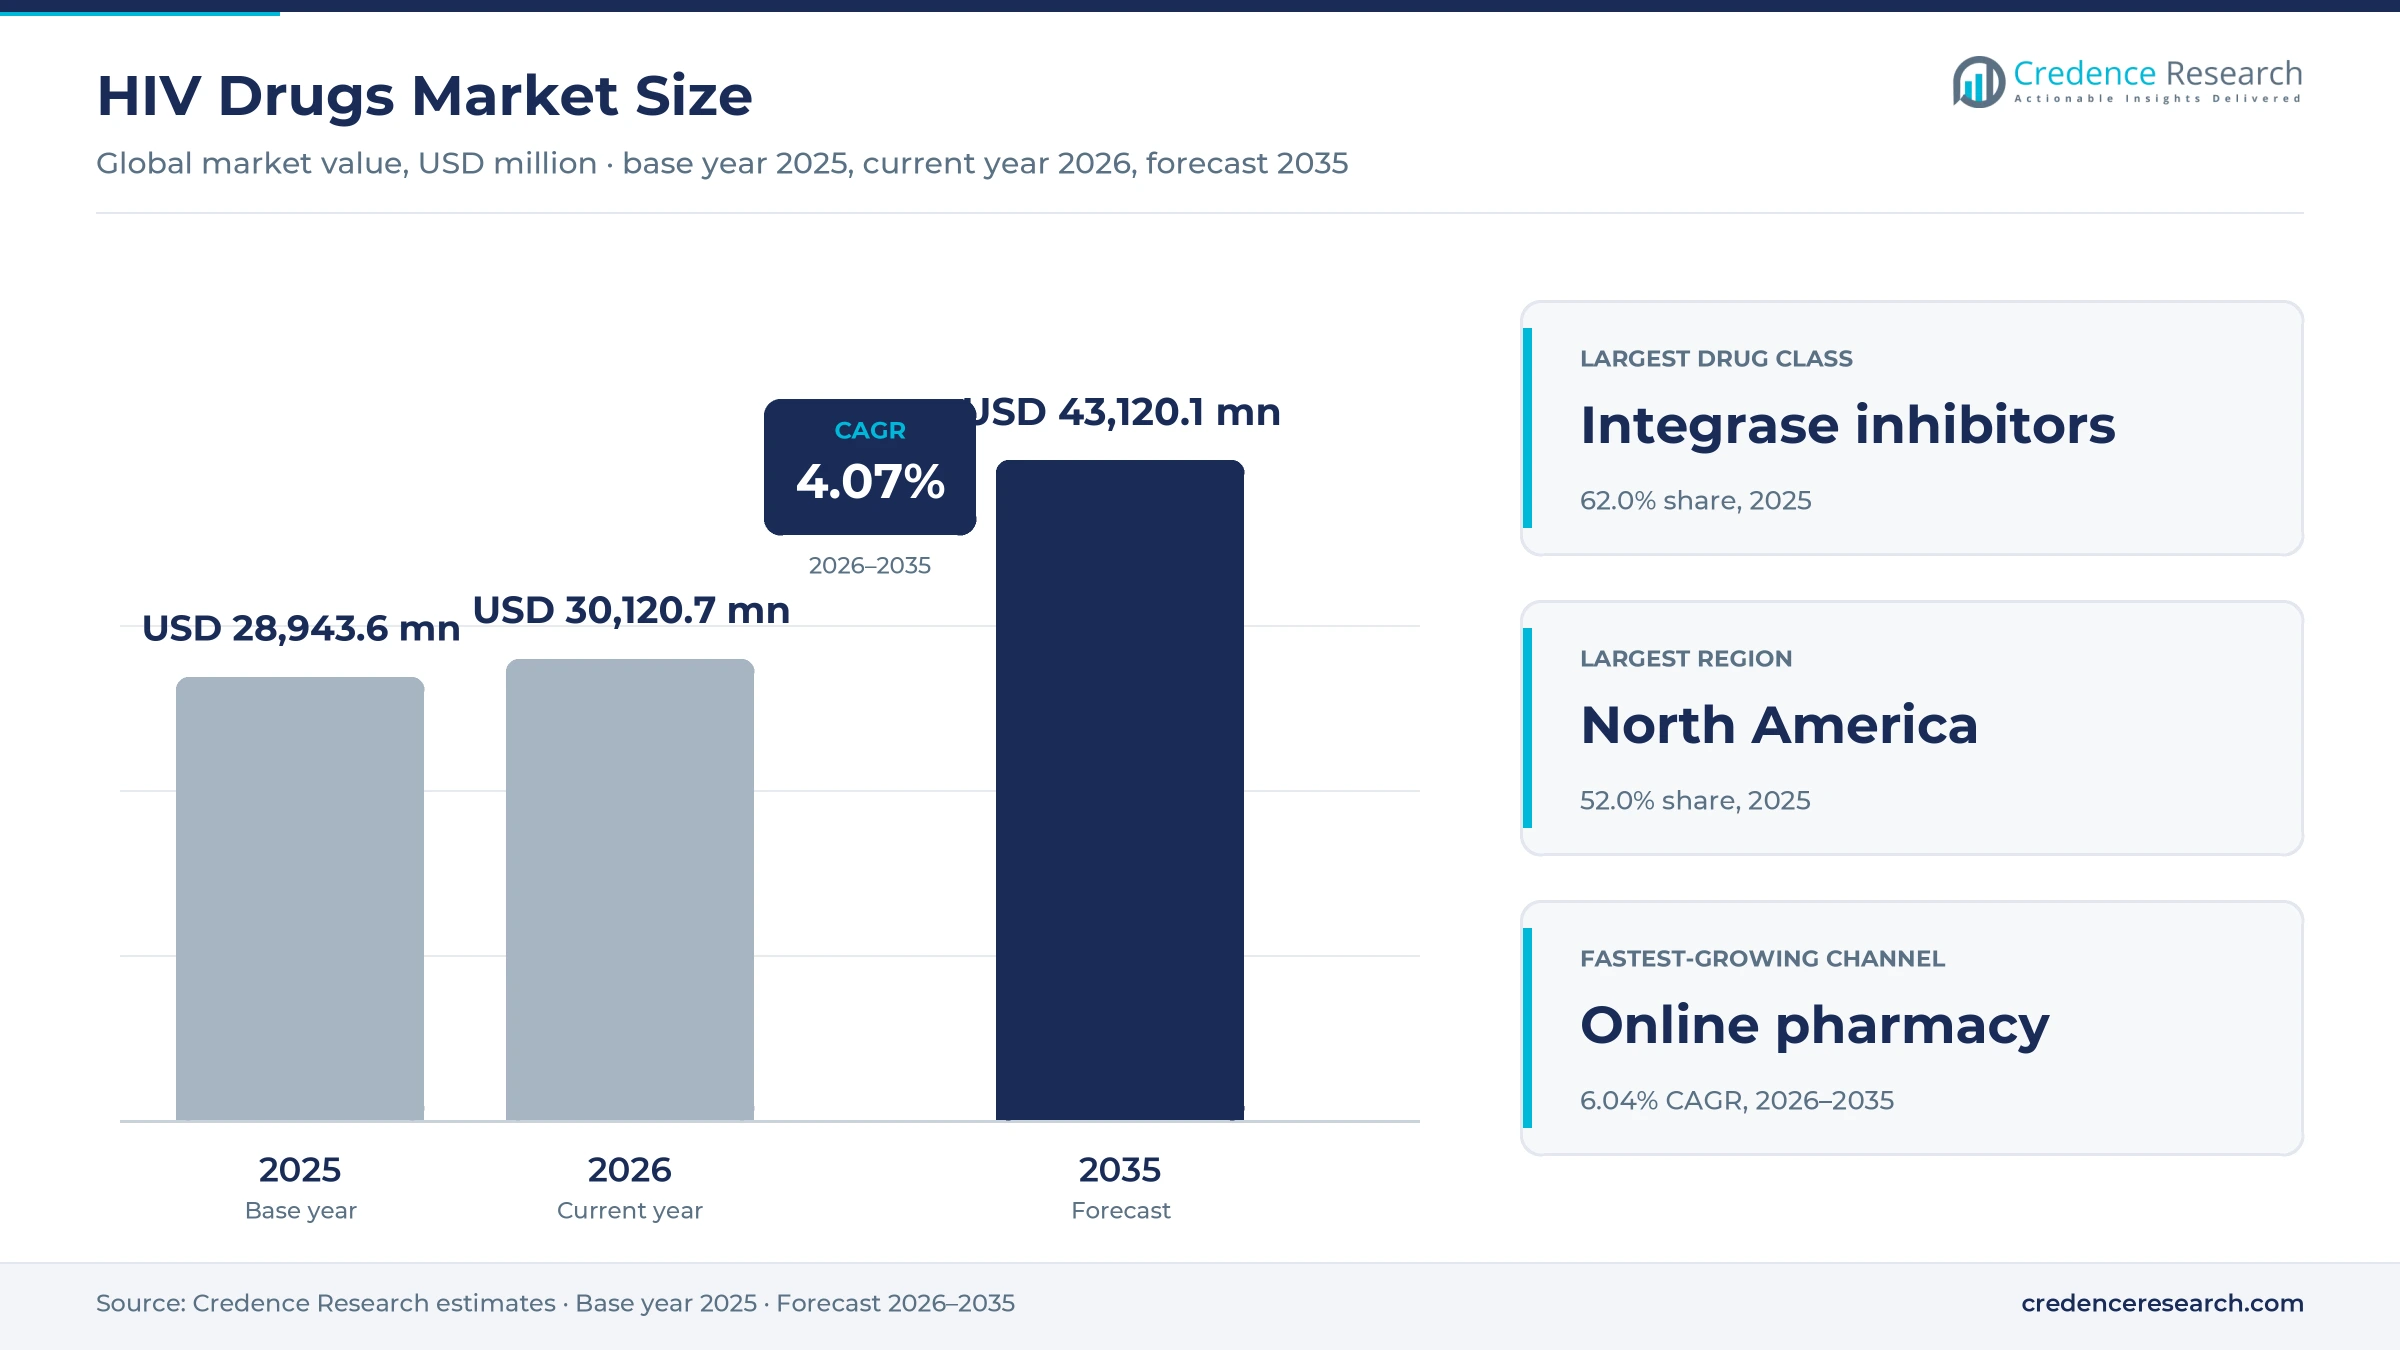
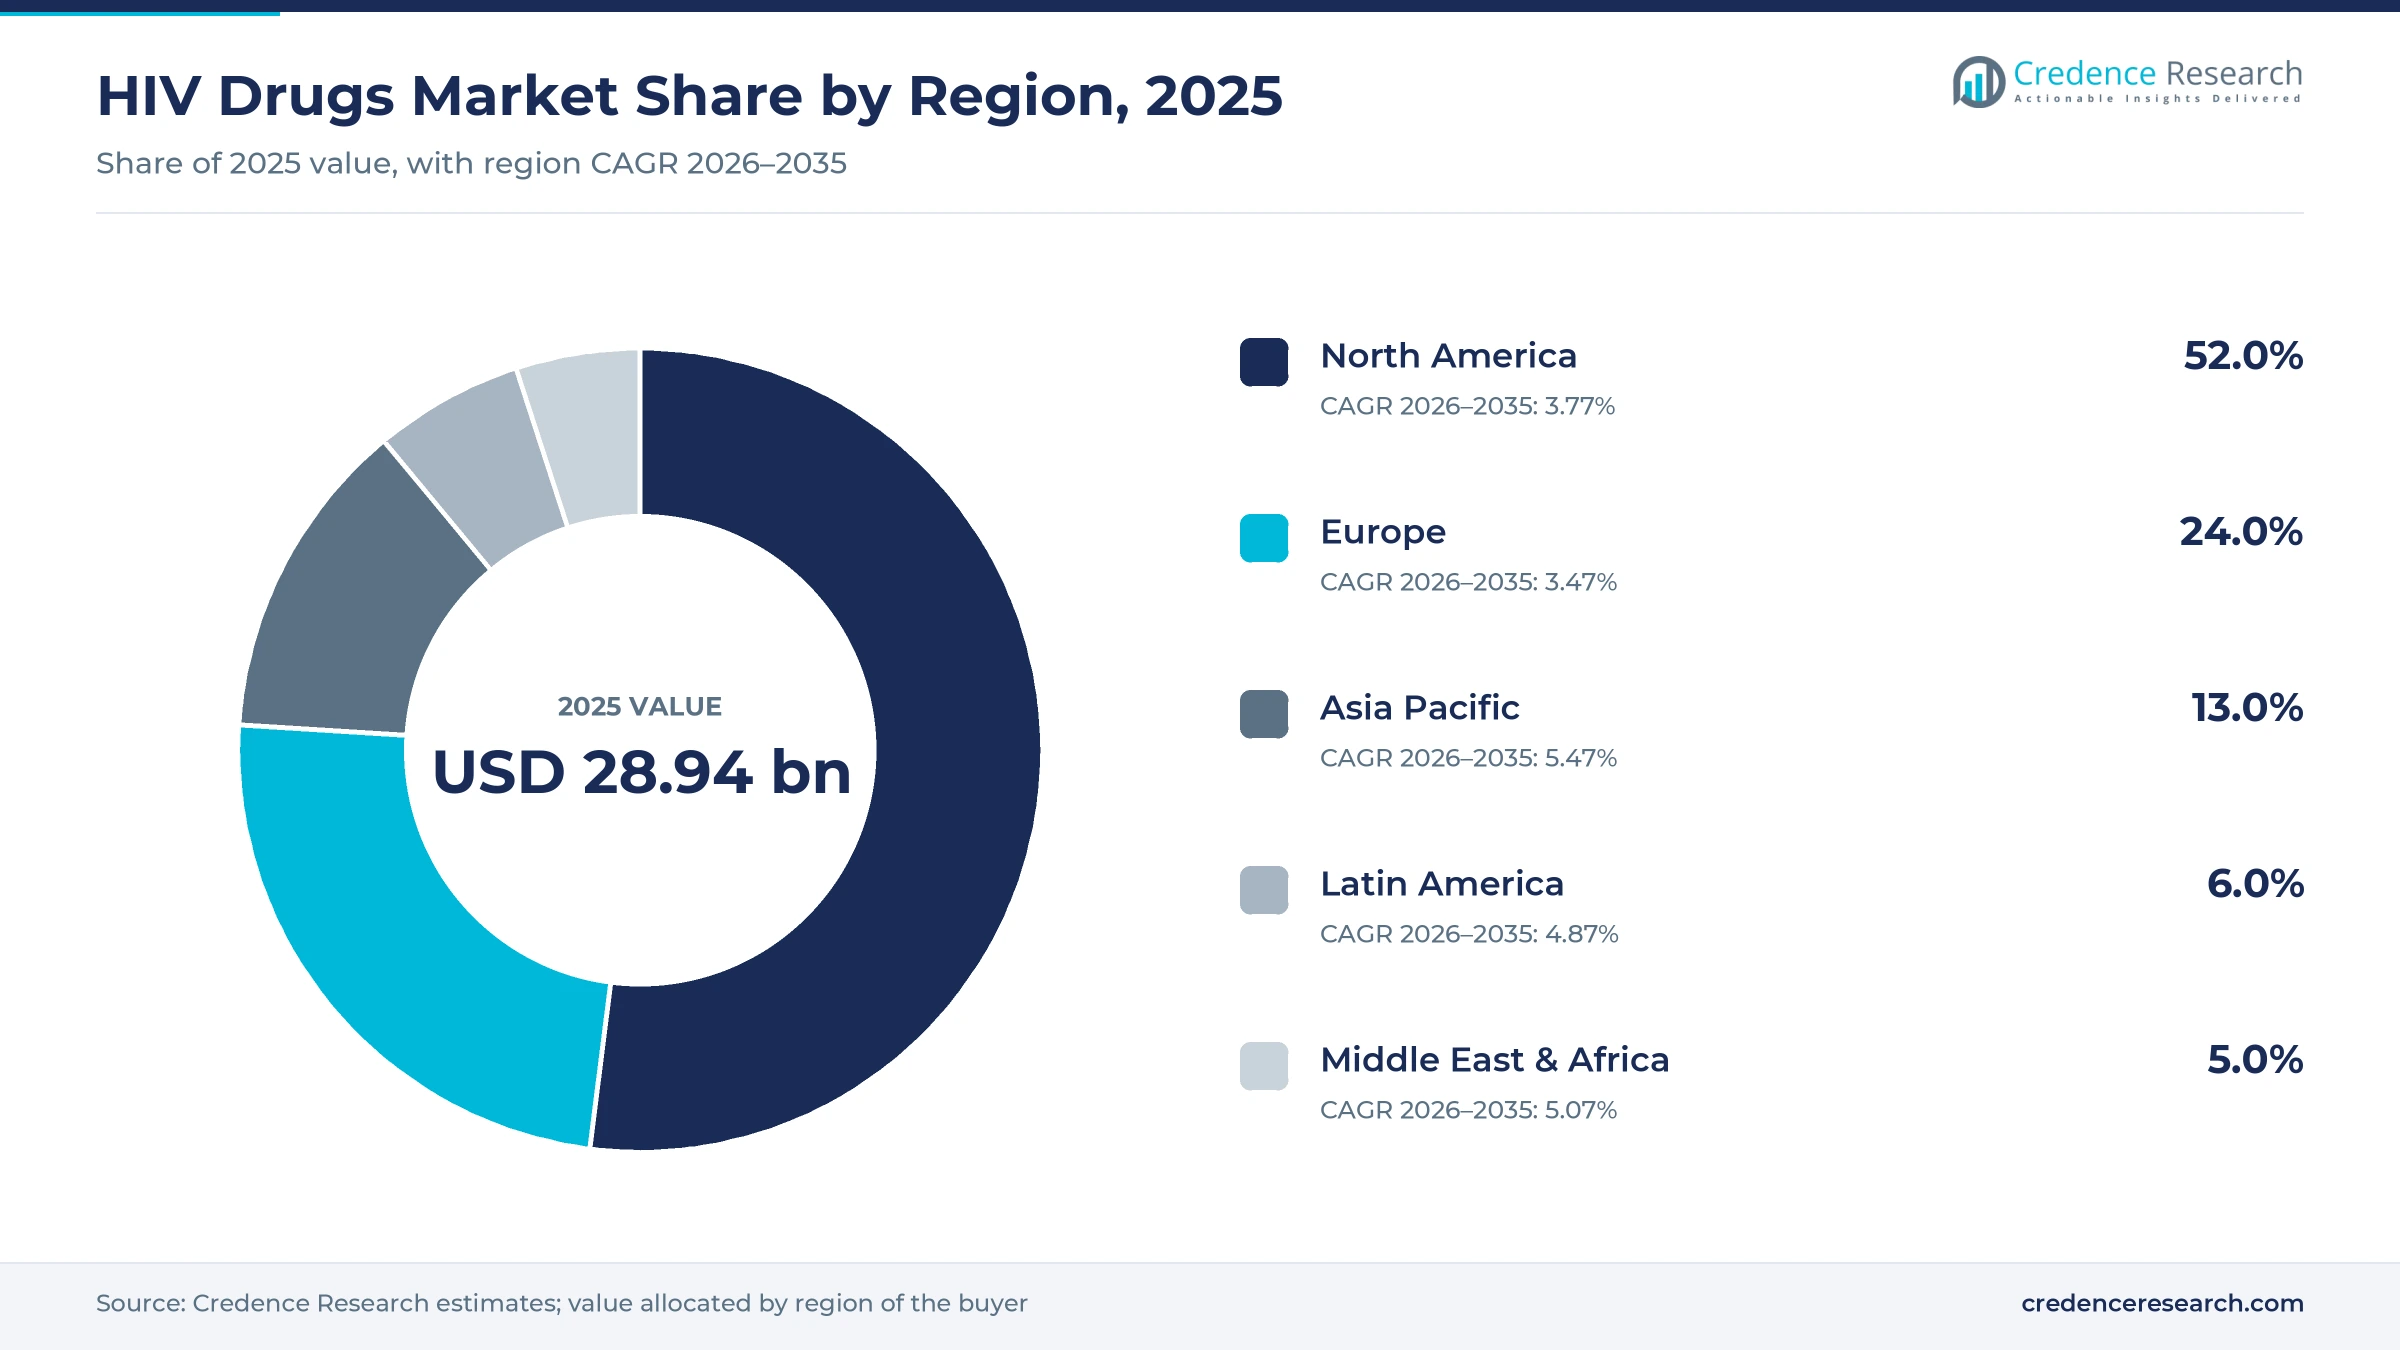
The global HIV drugs market was valued at USD 28.94 billion in 2025 and is projected to increase from USD 30.12 billion in 2026 to USD 43.12 billion by 2035, registering a CAGR of 4.07% during 2026–2035. Demand comes from the lifelong antiretroviral treatment taken by people living with HIV and from pre-exposure prophylaxis used by people at higher risk of infection. North America held the largest regional share, 52.0% in 2025, because branded single-tablet regimens and new injectables carry high list prices in the U.S. Asia Pacific is the fastest-growing region at 5.47% a year, as more people are diagnosed and started on treatment across India, China and Southeast Asia. The main technology change came in June 2025, when the U.S. Food and Drug Administration approved lenacapavir as the first twice-yearly injection for HIV prevention.
Which antiretroviral and prevention medicines are counted?
The market counts manufacturer revenue from prescription antiretroviral medicines used to treat HIV infection and to prevent it. It covers integrase inhibitors, non-nucleoside reverse transcriptase inhibitors, nucleoside backbones, protease inhibitors, capsid inhibitors and fixed-dose combinations taken as tablets or long-acting injections. Buyers include hospital, retail and online pharmacies, public insurers, national treatment programs and global procurement agencies.
The scope excludes HIV tests, viral load and resistance assays, clinic visit fees and vaccines still in research. Medicines for opportunistic infections are left out, because they treat complications rather than the virus itself. Generic antiretrovirals sold through donor tenders are counted at their actual selling prices.
HIV Drugs Market Insights
- The HIV drugs market grows from USD 28.94 billion in 2025 to USD 43.12 billion by 2035, a 4.07% CAGR over 2026–2035, as more people stay on lifelong treatment and long-acting prevention spreads.
- North America held 52.0% of global HIV drug value in 2025, reflecting high branded prices and wide use of single-tablet regimens in the U.S.
- Integrase inhibitors led drug classes with 62.0% of 2025 value, because most first-line regimens in rich and poor countries are built on this class.
- UNAIDS counted 32.1 million people on antiretroviral therapy in 2025, out of 41.0 million people living with HIV worldwide.
- In April 2026, Merck gained U.S. approval for IDVYNSO, a once-daily two-drug tablet that pairs doravirine with islatravir.
Integrase-based regimens hold most of the value
Why do integrase inhibitors hold the largest share?
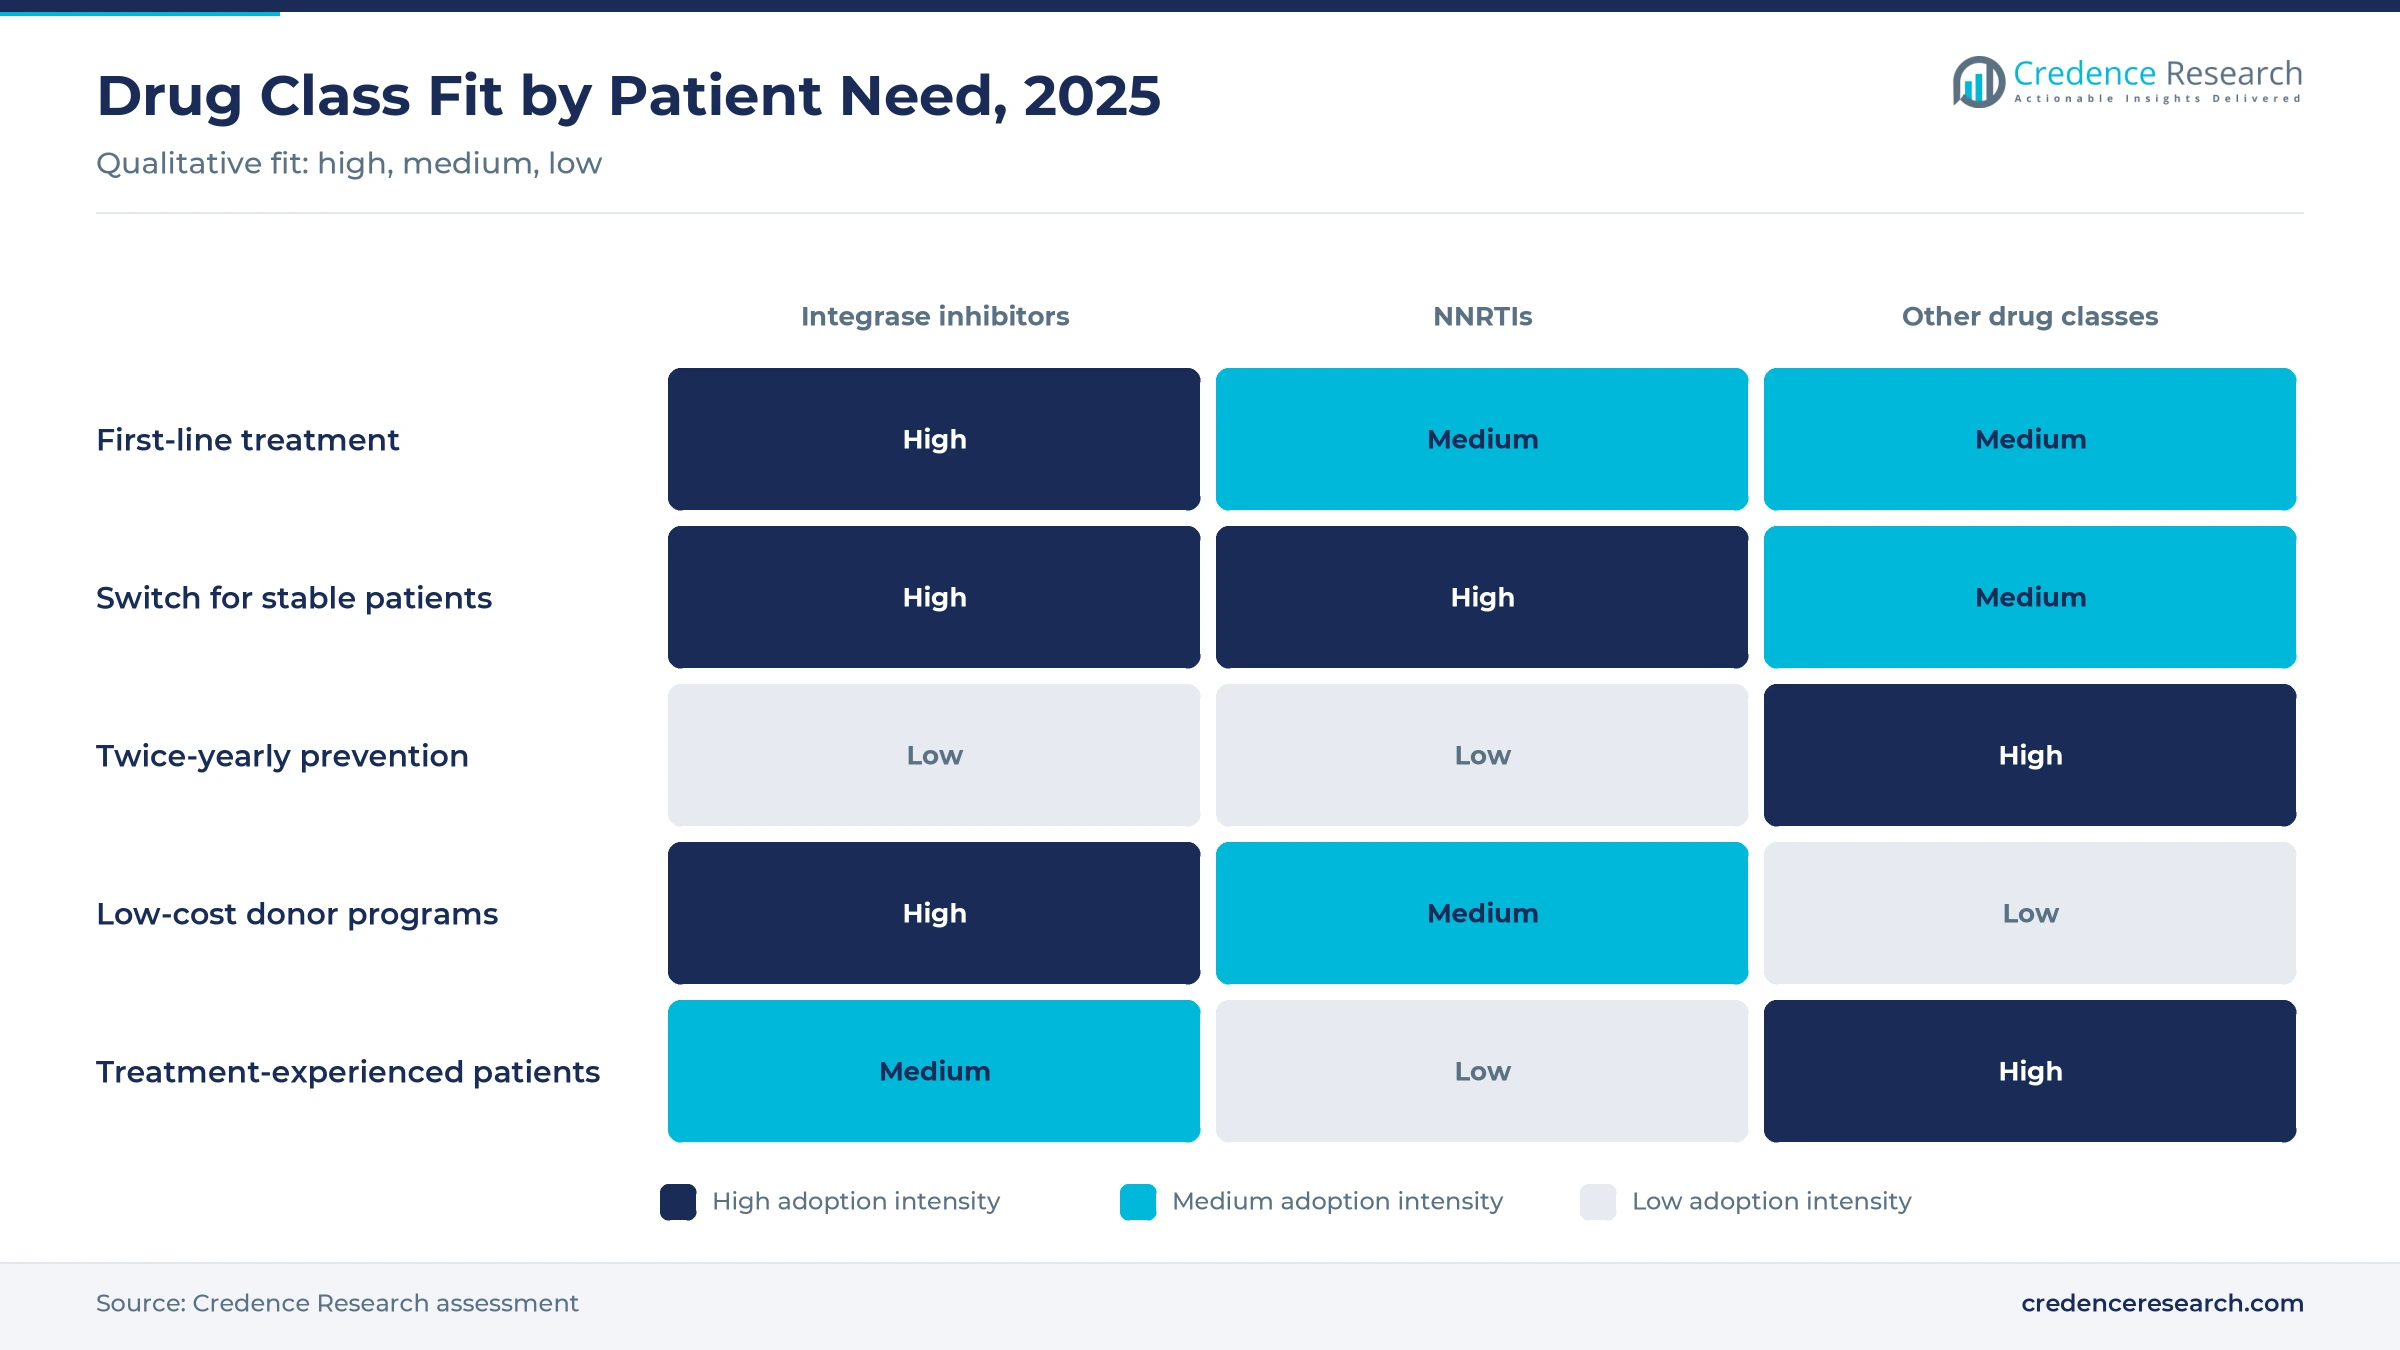
Based on drug class, the market is categorized into integrase inhibitors, non-nucleoside reverse transcriptase inhibitors and other drug classes. Integrase Inhibitors led with a 62.0% share of 2025 value, because dolutegravir and bictegravir regimens are the preferred first-line choice in most guidelines. Other Drug Classes grow fastest at 4.52% a year, as capsid inhibitors such as lenacapavir gain use in twice-yearly prevention.
Where do patients collect antiretroviral medicines?
Based on distribution channel, the market is categorized into hospital pharmacy, retail pharmacy, online pharmacy and others. Retail Pharmacy led with a 48.0% share of 2025 value, because most people on stable treatment refill monthly at community and specialty stores. Online Pharmacy grows fastest at 6.04% a year, as mail-order refills offer privacy and convenience for lifelong therapy.
| Segment Group | Leading Sub-segment | Share, 2025 | Fastest-growing Sub-segment | CAGR, 2026–2035 |
|---|---|---|---|---|
| By Drug Class | Integrase Inhibitors | 62.0% | Other Drug Classes | 4.52% |
| By Distribution Channel | Retail Pharmacy | 48.0% | Online Pharmacy | 6.04% |
Request a Free Sample
Fill in your details and we'll send you a free sample report.
- Sample data tables & charts
- Research methodology
More people on treatment and twice-yearly prevention
How does the growing treated population sustain demand?
HIV treatment is lifelong, so every person who starts therapy adds years of steady demand for antiretroviral medicines. UNAIDS counted 41.0 million people living with HIV in 2025, of whom 32.1 million were receiving antiretroviral therapy. New infections reached 1.2 million and AIDS-related deaths 570,000 in the same year. The gap of roughly nine million untreated people shows how much room remains for wider testing and linkage to care. As a result, volume keeps rising even in regions where new infections are falling.
Why does twice-yearly prevention open new demand?
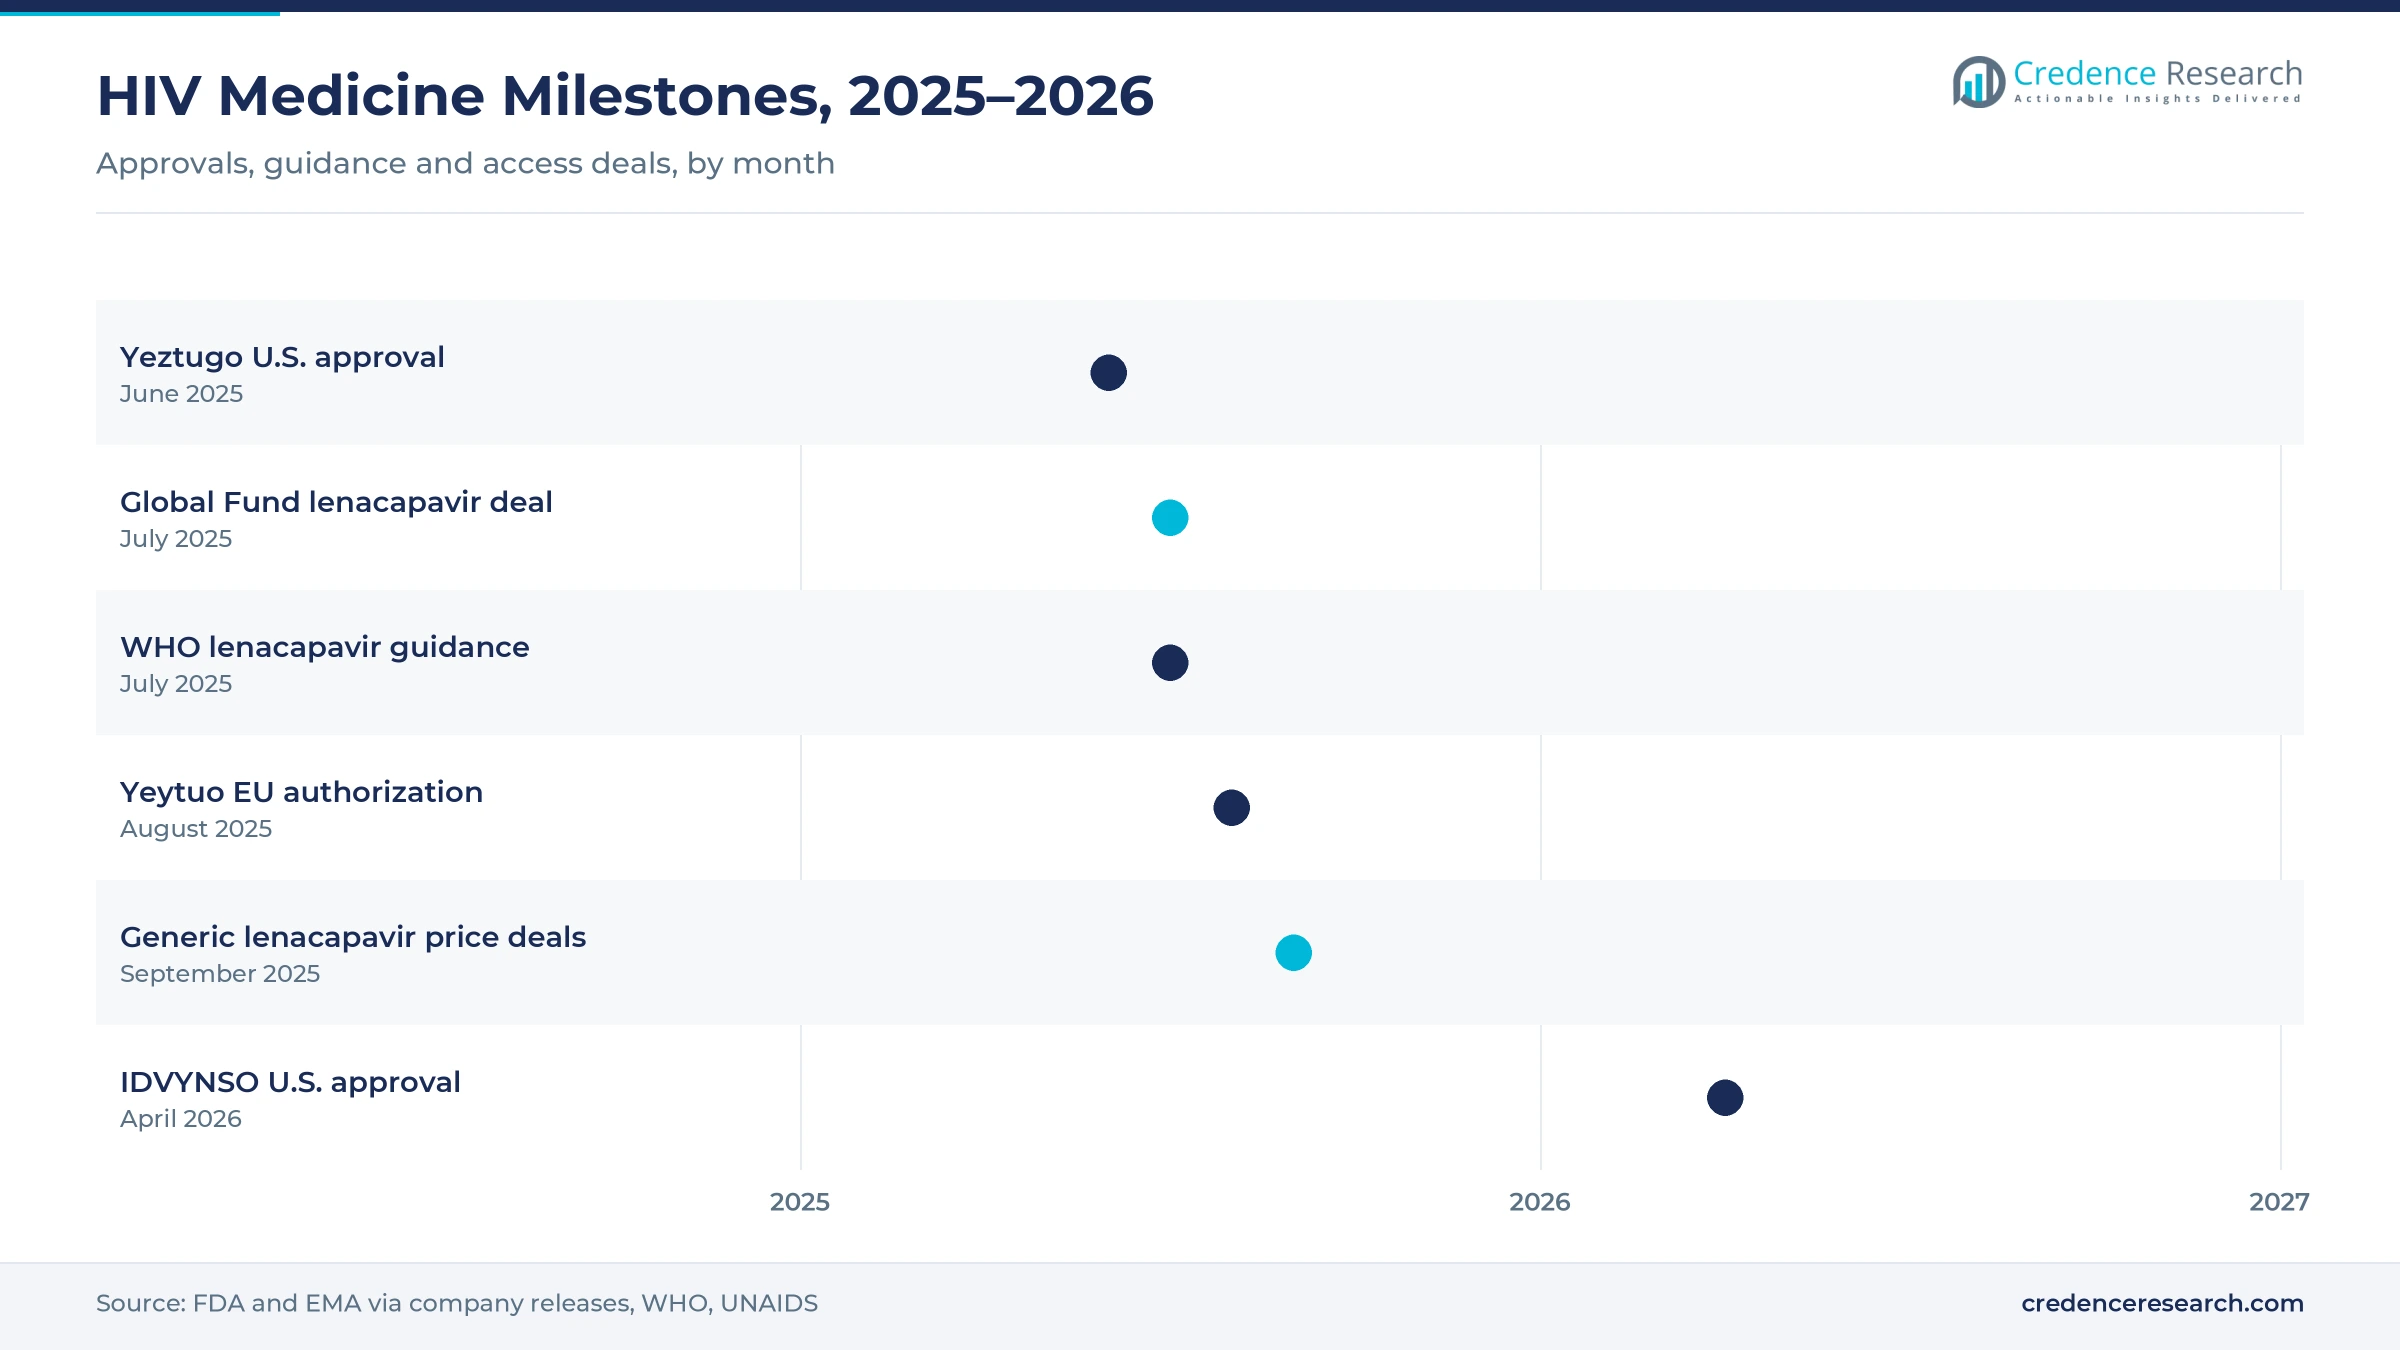
Long-acting prevention brings a new group of buyers into the market, because it serves people without HIV who want protection without a daily pill. On June 18, 2025, Gilead announced U.S. approval of Yeztugo, a twice-yearly lenacapavir injection for pre-exposure prophylaxis. In the PURPOSE 1 and PURPOSE 2 trials, at least 99.9% of participants who received the injection remained HIV negative. This result supports wider uptake among people who struggle with daily adherence. In turn, U.S. insurers gain a prevention option that needs two clinic visits a year.
How does global guidance widen access to injectables?
Public health bodies now back long-acting options, which pushes national programs to buy them. On July 14, 2025, the WHO recommended injectable lenacapavir as an additional HIV prevention option, alongside oral PrEP, injectable cabotegravir and the dapivirine ring. The WHO also backed simple rapid testing for long-acting PrEP, which allows delivery through pharmacies and telehealth. In turn, ministries of health can add injectables to national prevention plans faster. This guidance matters most in Africa, where UNAIDS data show most people living with HIV reside.
Why do simpler regimens keep patients on therapy?
Simpler regimens with fewer pills and fewer side effects help people stay on treatment for decades, which protects demand. Single-tablet regimens combine two or three medicines into one daily dose and reduce missed doses. Because stable patients often switch to newer options with better tolerability, makers can keep value despite generic competition. Wider use of antiviral treatment in older patients with other chronic conditions also favors regimens with fewer drug interactions. These patients often take heart and diabetes medicines, so switch decisions weigh interaction risks.
Long-acting injectables and tenofovir-free regimens rise
Why are long-acting injectables on the rise?
Treatment and prevention are shifting from daily tablets toward injections given every two to six months. The European Union authorized Yeytuo, the lenacapavir prevention injection, on Aug. 25, 2025, following the U.S. approval earlier that summer. Injectable cabotegravir is already used for prevention and, with rilpivirine, for treatment in several countries. This shift raises value per patient while improving adherence among young adults and people facing stigma.
How are tenofovir-free two-drug regimens emerging?
Two-drug regimens that avoid tenofovir are emerging as an option for people with kidney or bone concerns. On April 21, 2026, Merck announced U.S. approval of IDVYNSO, a once-daily tablet of doravirine and islatravir for adults whose virus is already suppressed. Doravirine is a non-nucleoside reverse transcriptase inhibitor, which gives this older class a new role in switch therapy. As a result, competition for stable patients becomes more varied.
Where is the opening in low-cost long-acting prevention?
Affordable generic injectables offer a large opening in high-burden countries, where most new infections occur. On Sept. 24, 2025, UNAIDS welcomed agreements for generic lenacapavir at about USD 40 per person per year, made by Dr. Reddy's Laboratories and Hetero Drugs. The deals fall under a voluntary license that covers 120 mainly low-income countries. In July 2025, Gilead also agreed to supply the Global Fund with lenacapavir for up to 2 million people over three years. As a result, suppliers that can scale sterile injectable output gain long tender volumes.
Can easier testing open more prevention sales?
Easier testing creates an opening, because people must confirm they are HIV negative before starting and continuing prevention. Wider use of rapid test kits at pharmacies and community sites lowers this barrier. When testing moves outside clinics, more people can start oral or injectable prophylaxis on the same day. In turn, suppliers of long-acting products gain new users who never visited a specialist. WHO data show 31.6 million people were on treatment in 2024, up from 30.3 million in 2023, which signals steady gains in linkage to care.
Donor funding gaps, generic pricing and patent expiry
How do donor funding gaps threaten treatment programs?
Many low- and middle-income countries depend on international donors to buy antiretroviral medicines, which leaves programs exposed when funding falls. In March 2025, a study by the WHO and the Burnet Institute warned that donor cuts could cause between 4.43 million and 10.75 million additional infections by 2030. Treatment interruptions caused by such cuts also raise the risk of drug resistance in affected countries. Governments respond by shifting budgets, but gaps remain in the poorest countries. As a result, procurement of newer and costlier regimens may slow where donors had paid most of the bill.
Why does generic pricing limit value growth?
Generic makers in India supply most antiretroviral volume in low-income countries at very low prices, which caps value growth. Tenders run by national programs and global agencies award contracts mainly on price. As a result, rising patient numbers in Africa and Asia add far less value than the same patients would add in the U.S. Originators focus on newer regimens to keep prices in high-income markets. However, the same tender model also lowers treatment costs, which lets programs reach more people with a fixed budget.
What does patent expiry mean for originators?
Patent expiry on major regimens exposes originators to generic entry in the U.S. and Europe, where most value sits. When a widely used tablet loses protection, payers move stable patients to cheaper copies quickly. Companies respond by switching patients to newer combinations and long-acting injections before expiry. However, this strategy depends on clear clinical advantages that payers will reimburse. Where payers see newer products as only slightly better, they favor cheaper copies and limit access to branded switches.
How do stigma and adherence gaps affect use?
Stigma still keeps many people from testing, starting treatment or collecting refills on time. Missed doses can lead to drug resistance and treatment failure, which forces costly regimen changes. Young adults, sex workers and people who inject drugs face the highest barriers in many countries. Long-acting options and private delivery channels help, but uptake depends on local outreach and funding. Online pharmacies with discreet home delivery also help some patients avoid stigma at local stores.
North America leads while Asia Pacific grows fastest
| Region | Value, 2025 (USD billion) | Share, 2025 | CAGR, 2026–2035 |
|---|---|---|---|
| North America | 15.05 | 52.0% | 3.77% |
| Europe | 6.95 | 24.0% | 3.47% |
| Asia Pacific | 3.76 | 13.0% | 5.47% |
| Latin America | 1.74 | 6.0% | 4.87% |
| Middle East & Africa | 1.45 | 5.0% | 5.07% |
North America leads on branded single-tablet regimens
North America held a 52.0% share of 2025 value and grows at 3.77% a year through 2035. The U.S. dominates spending, because most patients use branded single-tablet regimens and new injectables at high list prices. The June 2025 approval of twice-yearly lenacapavir for prevention adds a new source of demand. However, generic entry for older regimens holds value growth below the global rate. Federal programs such as Medicaid and the Ryan White program fund treatment for many lower-income patients, which keeps volume stable across the decade.
Europe balances public funding and price controls
Europe held a 24.0% share of 2025 value and grows at 3.47% a year, the slowest pace among the five regions. Public health systems fund lifelong treatment and prevention, and the European Union authorized lenacapavir for prevention in August 2025. However, national price negotiations and generic substitution keep value growth modest across Germany, France, Italy, Spain and the U.K. Long-acting injections still gain ground in clinics that serve younger adults and people who want to avoid daily tablets.
Asia Pacific grows on wider diagnosis and treatment
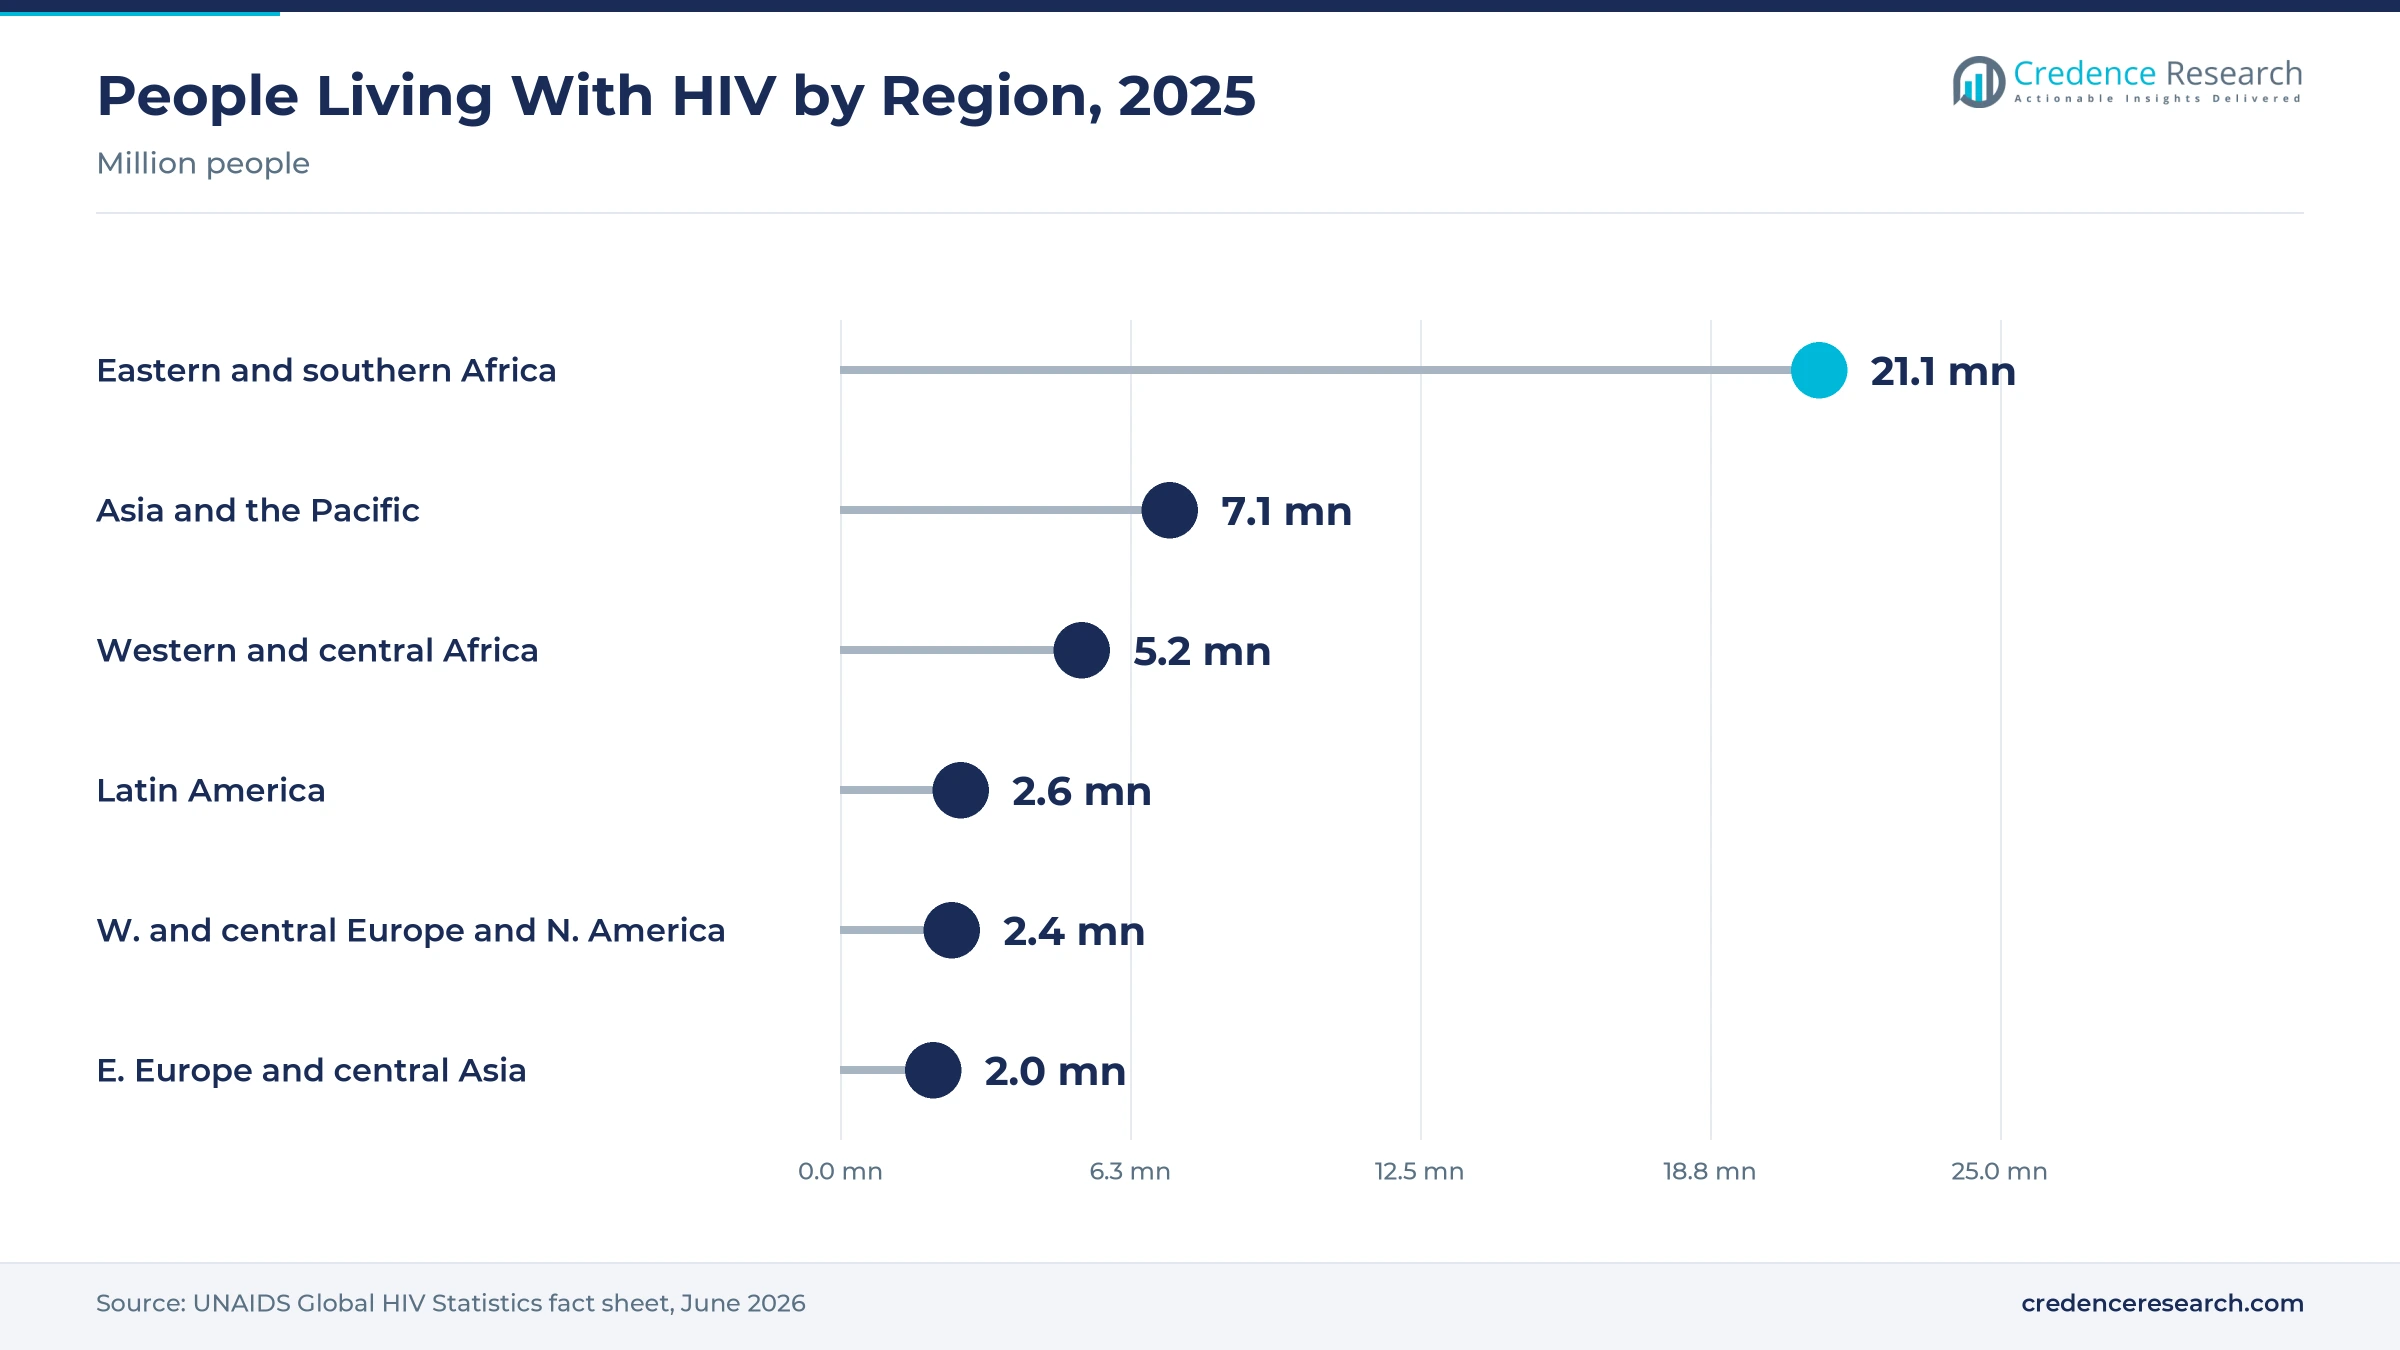
Asia Pacific held a 13.0% share of 2025 value and is the fastest-growing region at 5.47% a year. UNAIDS counted 7.1 million people living with HIV in Asia and the Pacific in 2025, many still not on treatment. India supplies generic regimens worldwide, while China, Thailand and Vietnam expand public programs. As diagnosis improves, treatment volume rises faster than in any other region. Because most patients receive low-cost generic regimens, value per patient stays far below levels seen in North America and Europe.
Latin America expands public treatment programs
Latin America held a 6.0% share of 2025 value and grows at 4.87% a year through 2035. UNAIDS counted 2.6 million people living with HIV in Latin America in 2025. Brazil and Mexico run large public programs that buy both generic and branded medicines through national tenders.
Africa holds most patients but little value
The Middle East & Africa held a 5.0% share of 2025 value and grows at 5.07% a year. Eastern and southern Africa alone had 21.1 million people living with HIV in 2025, but low generic prices keep value small. Donor-funded injectable pre-exposure prophylaxis could lift spending in South Africa, Kenya and Uganda.
Approvals, guidance and access deals since 2025
| Development | Status and market relevance |
|---|---|
| In June 2025, Gilead Sciences announced U.S. approval of Yeztugo, a twice-yearly lenacapavir injection for HIV pre-exposure prophylaxis. | Approved. First prevention option offering six months of protection per dose. |
| In July 2025, the WHO recommended injectable lenacapavir as an additional HIV prevention option. | Published. Also backs simplified rapid testing for long-acting PrEP. |
| In July 2025, Gilead Sciences finalized an agreement with the Global Fund to supply lenacapavir for up to two million people over three years. | Agreed. Supplied at no profit in mainly low- and lower-middle-income countries. |
| In August 2025, the European Union authorized Yeytuo, the lenacapavir prevention injection from Gilead Sciences. | Approved. Valid across the European Union for adults and adolescents. |
| In April 2026, Merck announced U.S. approval of IDVYNSO, a once-daily tablet of doravirine and islatravir. | Approved. Switch option for adults whose virus is already suppressed. |
Capsid inhibitors and two-drug regimens reshape care
- Capsid inhibitors block the shell that protects the virus, which allows dosing as rarely as twice a year with lenacapavir.
- Long-acting injections replace daily tablets with doses every two to six months, which helps people who struggle with adherence.
- Two-drug regimens use fewer medicines than classic three-drug therapy, which lowers lifetime exposure to side effects.
- Single-tablet regimens combine a complete treatment in one daily pill, which simplifies refills and reduces missed doses.
- Pediatric formulations such as dispersible dolutegravir tablets allow accurate dosing in infants, and in June 2026 the FDA granted priority review to extend Tivicay PD to newborns, with an Aug. 25, 2026 target date.
Need a Custom Version of This Report?
Tailor the scope, geography, or segments to your exact requirements.
- Custom geography or segment scope
- Direct access to our analyst team
Originators compete on regimens while generics win tenders
Competition in HIV medicines is led by a small group of originators that compete on complete regimens rather than single molecules. Gilead Sciences Inc. leads with bictegravir-based single tablets and the lenacapavir franchise, while ViiV Healthcare, with GSK PLC, competes through dolutegravir regimens and long-acting cabotegravir. Merck Sharp & Dohme Corp. targets switch patients with doravirine-based tablets, and Janssen Pharmaceuticals Inc. supplies rilpivirine and darunavir products. Bristol-Myers Squibb Company, AbbVie Inc., Boehringer Ingelheim International GmbH and F. Hoffmann-La Roche AG hold older brands that still serve treatment-experienced patients. Mylan N.V. and other generic makers supply low-cost tablets to donor programs and public tenders. Because generic pricing caps value in poor countries, originators compete on longer dosing intervals, fewer side effects and access deals that secure long-term volume.
Companies profiled and their roles in this market
| Company | Type | Role in the market |
|---|---|---|
| Gilead Sciences Inc. | Originator | Bictegravir regimens and lenacapavir for prevention |
| ViiV Healthcare | HIV specialist | Dolutegravir regimens and long-acting cabotegravir |
| GSK PLC | Diversified pharma | Majority partner behind ViiV Healthcare products |
| Merck Sharp & Dohme Corp. | Originator | Doravirine and the IDVYNSO switch regimen |
| Janssen Pharmaceuticals Inc. | Originator | Rilpivirine and darunavir products |
| Bristol-Myers Squibb Company | Originator | Legacy antiretroviral brands |
| AbbVie Inc. | Originator | Protease inhibitor products |
| Boehringer Ingelheim International GmbH | Originator | Older non-nucleoside and protease brands |
| F. Hoffmann-La Roche AG | Originator | Legacy HIV medicines |
| Mylan N.V. | Generics | Low-cost tablets for donor and public programs |
Long-acting options, not new patients, set the pace
Credence Research's view is that long-acting options, rather than rising patient numbers, will set the growth pace in HIV medicines through 2035. Integrase inhibitors keep most of the value, but twice-yearly prevention and new switch regimens shift spending toward fewer, higher-priced doses. Donor funding gaps and generic tenders limit value in Africa and Asia, even as treatment volume grows. Companies that pair new products with access deals and simple testing are best placed, while generic makers gain share in volume terms through low-cost injectables.
How the 2025 baseline and forecast were built
The report uses 2025 as the base year and forecasts market value to 2035, with growth rates stated for 2026–2035. Market values come from the Credence Research market model, which combines people on treatment and prevention, regimen mix, average selling prices and the split between branded and generic supply by region. Splits by drug class, distribution channel and region are Credence Research estimates. Sources used include UNAIDS and WHO statistics and guidance, regulator decisions in the U.S. and Europe, and company announcements. No primary interviews or surveys were used to build the estimates in this report.
Twice-yearly options and wider access shape 2035
By 2035, the HIV drugs market reaches USD 43.12 billion, with more people treated and protected through fewer doses each year. Integrase inhibitors remain the largest drug class, while capsid inhibitors and other new classes take a growing share of prevention. Online pharmacies gain refill orders from patients who value privacy. Generic lenacapavir could reach millions in Africa and Asia, which would raise volume far faster than value. Originators that extend dosing intervals and protect their switch markets keep the highest prices in North America and Europe.
Frequently Asked Questions
How big is the HIV drugs market?
Which drug class leads the market?
Which drug class grows fastest?
Which region holds the largest share?
How many people receive HIV treatment?
What did the FDA approve in June 2025?
Who are the leading companies?
What are the main challenges?
Table of Content
Chapter 1 Market Segmentation
- 1.1 Segmentation Framework
- 1.1.1 Product and Service Classification
- 1.1.2 Application and End-Use Classification
- 1.1.3 Technology and Solution Classification
- 1.1.4 Customer and Distribution Channel Classification
- 1.1.5 Geographic Segmentation
- 1.1.6 Market Segment Definitions and Boundaries
- 1.2 By Drug Class
- 1.2.1 Integrase Inhibitors
- 1.2.2 Non-Nucleoside Reverse Transcriptase Inhibitors
- 1.2.3 Other Drug Classes
Chapter 2 Introduction
- 2.1 Report Objectives and Scope
- 2.2 Product Definition and Industry Terminology
- 2.3 Market Inclusions and Exclusions
- 2.4 Research Process
- 2.4.1 Primary Research and Expert Interviews
- 2.4.2 Secondary Research and Source Review
- 2.4.3 Top-Down and Bottom-Up Estimation
- 2.4.4 Data Triangulation and Verification
- 2.5 Market Size Measurement Basis
- 2.5.1 2025: USD 28.94 billion → 2035: USD 43.12 billion
- 2.6 Historical and Forecast Reference Periods
- 2.6.1 Historical Period: 2018-2025
- 2.6.2 Base Year: 2025
- 2.6.3 Forecast Period: 2025-2035
- 2.7 Research Assumptions and Limitations
Chapter 3 Executive Summary
- 3.1 Market Snapshot and Key Findings
- 3.2 Base-Year Market Size, 2025
- 3.3 Forecast Market Size, 2035
- 3.4 Revenue and Volume Growth Outlook
- 3.5 Key Demand and Supply Indicators
- 3.6 Leading Market Segments
- 3.7 Fastest-Growing Market Opportunities
- 3.8 Regional Performance Highlights
- 3.9 Technology and Industry Transformation
- 3.10 Competitive Landscape Summary
- 3.11 Analyst View and Strategic Implications
Chapter 4 Global HIV Drugs Market Trends and Developments
- 4.1 Historical Industry Development, 2018-2025
- 4.2 Recent Market Trends and Developments
- 4.3 Demand and Customer Behavior Trends
- 4.4 Technology and Product Innovation
- 4.5 Artificial Intelligence, Automation and Digitalization
- 4.6 Local Manufacturing and Supply Chain Realignment
- 4.7 Industry Partnerships, Mergers and Acquisitions
- 4.8 Sustainability and Circular Economy Developments
- 4.9 Government and Private Sector Investment Trends
- 4.10 Emerging Business Models and Commercialization
- 4.11 Industry Developments and Announcements
Chapter 5 Global HIV Drugs Market Production, Supply and Demand Analysis
- 5.1 Demand Trend and Consumption Analysis, 2018-2025
- 5.2 Demand Forecast, 2025-2035
- 5.3 Production and Output Trend, 2018-2025
- 5.4 Production and Output Forecast, 2025-2035
- 5.5 Installed Capacity and Capacity Utilization
- 5.6 Company-Wise Production Plants and Statistics
- 5.6.1 Installed Production Capacity
- 5.6.2 Actual Production
- 5.6.3 Planned Capacity and Expansion Targets
- 5.7 Supply Chain Structure and Procurement Trends
- 5.8 Supply-Demand Gap and Bottlenecks
- 5.9 Import Dependence and Sourcing Structure
- 5.10 Contract Manufacturing and Outsourcing
- 5.11 Regional Supply and Demand Concentration
Chapter 6 Global HIV Drugs Market Pricing Analysis
- 6.1 Pricing Structure and Measurement
- 6.2 Historical Pricing Trends, 2018-2025
- 6.3 Pricing Outlook, 2025-2035
- 6.4 Average Selling Price and Unit Economics
- 6.5 Pricing by Product and Market Segment
- 6.6 Geographic Pricing Differences
- 6.7 Key Input, Energy, Labor and Logistics Costs
- 6.8 Contract Pricing and Purchasing Models
- 6.9 Pricing Sensitivity and Competitive Positioning
- 6.10 Price, Margin and Profitability Implications
Chapter 7 Global HIV Drugs Market Dynamics
- 7.1 Market Growth Drivers
- 7.1.1 Demand-Side Drivers
- 7.1.2 Technology and Innovation Drivers
- 7.1.3 Infrastructure and Investment Drivers
- 7.1.4 Regulatory and Policy Drivers
- 7.2 Market Restraints
- 7.2.1 Cost and Affordability Constraints
- 7.2.2 Technology and Adoption Barriers
- 7.2.3 Supply Chain and Operational Constraints
- 7.3 Market Challenges
- 7.3.1 Competitive Pressure and Margin Erosion
- 7.3.2 Skills, Infrastructure and Implementation Gaps
- 7.4 Emerging Market Opportunities
- 7.5 Market Dynamics Impact and Time-Horizon Assessment
Chapter 8 Global HIV Drugs Value Chain Analysis
- 8.1 Industry Value Chain Overview
- 8.2 Upstream Suppliers and Critical Inputs
- 8.3 Technology and Component Providers
- 8.4 Manufacturing or Service Delivery
- 8.5 Distribution, Channel Partners and Integrators
- 8.6 Downstream Applications and End Users
- 8.7 Value Addition and Profit Pools
- 8.8 Vertical Integration and Outsourcing
- 8.9 Supplier Concentration and Risk
- 8.10 Supply Chain Localization and Resilience
Chapter 9 Global HIV Drugs Market Regulations and Policies
- 9.1 Relevant Laws, Standards and Compliance Frameworks
- 9.2 Product, Service, Safety and Quality Requirements
- 9.3 Government Policies, Incentives and Subsidies
- 9.4 Imports, Exports and Trade Barriers
- 9.5 Public Procurement and Local Content Requirements
- 9.6 Environmental and Sustainability Compliance
- 9.7 Upcoming Policy Changes and Market Implications
Chapter 10 Global HIV Drugs Market Hotspots and Opportunities
- 10.1 Market Opportunity Mapping and Growth Hotspots
- 10.2 High-Growth Applications and Customer Groups
- 10.3 Underserved Markets and White-Space Opportunities
- 10.4 Emerging Technology and Product Opportunities
- 10.5 New Capacity and Investment Hotspots
- 10.6 Market Entry and Expansion Opportunities
- 10.7 Distribution and Partnership Opportunities
- 10.8 Near-Term and Long-Term Commercial Potential
- 10.9 Opportunity Attractiveness and Execution Risks
Chapter 11 Global HIV Drugs Market Outlook, 2025-2035
- 11.1 Market Size and Analysis
- 11.1.1 Revenue (Market Measurement: 2025: USD 28.94 billion → 2035: USD 43.12 billion)
- 11.1.2 Market Volume and Quantity Sold
- 11.1.3 Historical Market Size, 2018-2025
- 11.1.4 Base-Year Market Size, 2025
- 11.2 Market Forecast, 2025-2035
- 11.2.1 Revenue Forecast to 2035
- 11.2.2 Volume Forecast to 2035
- 11.2.3 CAGR and Year-on-Year Growth
- 11.2.4 Incremental Revenue Opportunity
- 11.3 Forecast Assumptions and Scenario Analysis
- 11.3.1 Base-Case Forecast
- 11.3.2 Optimistic and Conservative Scenarios
- 11.3.3 Technology, Pricing and Policy Sensitivities
- 11.4 Market Attractiveness and Growth Outlook
Chapter 12 Global HIV Drugs Market Segmentation and Outlook
- 12.1 Segmentation Summary and Market Shares, 2025
- 12.2 Largest and Fastest-Growing Segments
- 12.3 By Drug Class - Market Size and Forecast, 2025-2035
- 12.3.1 Segment Definition and Scope
- 12.3.2 Historical Market Size, 2018-2025
- 12.3.3 Revenue Forecast, 2025-2035
- 12.3.4 Volume Forecast, 2025-2035
- 12.3.5 Base-Year Market Share, 2025
- 12.3.6 Segment CAGR and Growth Drivers
- 12.3.7 Subsegment Market Size and Forecast
- 12.3.7.1 Integrase Inhibitors
- 12.3.7.2 Non-Nucleoside Reverse Transcriptase Inhibitors
- 12.3.7.3 Other Drug Classes
- 12.3.8 Subsegment Pricing and Adoption Trends
- 12.3.9 Leading Suppliers and Competition
- 12.3.10 Regional Demand and Opportunities
- 12.4 Segment Growth Comparison
- 12.5 Segment Attractiveness and Priority Matrix
Chapter 13 Global HIV Drugs Geographic Market Outlook, 2025-2035
- 13.1 Regional Market Size and Share, 2025
- 13.2 Regional Market Forecast, 2025-2035
- 13.3 Regional Pricing, Production and Demand Differences
- 13.4 North America
- 13.4.1 United States
- 13.4.2 Canada
- 13.4.3 Mexico
- 13.5 Europe
- 13.5.1 Germany
- 13.5.2 France
- 13.5.3 Italy
- 13.5.4 United Kingdom
- 13.5.5 Spain
- 13.5.6 Poland
- 13.5.7 Russia
- 13.5.8 Netherlands
- 13.5.9 Belgium
- 13.5.10 Sweden
- 13.5.11 Denmark
- 13.5.12 Norway
- 13.5.13 Rest of Europe
- 13.6 Asia Pacific
- 13.6.1 China
- 13.6.2 India
- 13.6.3 Japan
- 13.6.4 South Korea
- 13.6.5 Thailand
- 13.6.6 Indonesia
- 13.6.7 Vietnam
- 13.6.8 Malaysia
- 13.6.9 Australia
- 13.6.10 Rest of Asia Pacific
- 13.7 Latin America
- 13.7.1 Brazil
- 13.7.2 Argentina
- 13.7.3 Colombia
- 13.7.4 Chile
- 13.7.5 Rest of Latin America
- 13.8 Middle East
- 13.8.1 Saudi Arabia
- 13.8.2 United Arab Emirates
- 13.8.3 Turkey
- 13.8.4 Israel
- 13.8.5 Iran
- 13.8.6 Rest of the Middle East
- 13.9 Africa
- 13.9.1 South Africa
- 13.9.2 Egypt
- 13.9.3 Nigeria
- 13.9.4 Morocco
- 13.9.5 Rest of Africa
- 13.10 Regional Investment, Policy and Supply Chain Differences
- 13.11 Regional Competitive Landscape
- 13.12 Geographic Growth Hotspots
Chapter 14 Global HIV Drugs Technology, Innovation and Sustainability Outlook
- 14.1 Technology Landscape and Maturity
- 14.2 Product, Process and Service Innovation
- 14.3 AI, Automation and Digital Tools in the Industry
- 14.4 Technology Adoption and Performance Benchmarking
- 14.5 Innovation Pipeline and R&D Investment
- 14.6 Patent and Intellectual Property Trends
- 14.7 Energy Efficiency and Resource Management
- 14.8 Sustainability, Recycling and Circularity
- 14.9 Technology Roadmap, 2025-2035
- 14.10 Risks of Obsolescence and Technology Substitution
Chapter 15 Global HIV Drugs Market Key Strategic Imperatives
- 15.1 Growth and Market Entry Priorities
- 15.2 High-Return Products and Segments
- 15.3 Pricing, Profitability and Cost Optimization
- 15.4 Technology Investment and Product Differentiation
- 15.5 Supply Chain Localization and Resilience
- 15.6 Distribution and Customer Acquisition
- 15.7 Partnership, Acquisition and Capacity Strategy
- 15.8 Regional Expansion Priorities
- 15.9 Short-, Medium- and Long-Term Actions
Chapter 16 Competition Outlook
- 16.1 Industry Competition Characteristics
- 16.2 Market Structure and Concentration
- 16.3 Market Share and Competitive Positioning, 2025
- 16.4 Company-Wise Revenue and Product Benchmarking
- 16.5 Production and Service Capacity Benchmarking
- 16.6 Technology, Pricing and Differentiation
- 16.7 Regional Footprint and Distribution Strength
- 16.8 Mergers, Acquisitions and Strategic Alliances
- 16.9 New Entrants and Competitive Threats
- 16.10 Porter's Five Forces and Industry Attractiveness
- 16.11 Competitive Outlook, 2025-2035
Chapter 17 Company Profiles
- 17.1 Company Coverage and Selection Criteria
- 17.2 ViiV Healthcare
- 17.2.1 Business Description
- 17.2.2 Company Ownership and Geographic Presence
- 17.2.3 Product and Service Portfolio
- 17.2.4 Manufacturing and Operating Footprint
- 17.2.5 Production Capacity and Expansion Plans
- 17.2.6 Financial Performance and Investment
- 17.2.7 Market Share and Competitive Position
- 17.2.8 Technology and Innovation Capabilities
- 17.2.9 Strategic Alliances or Partnerships
- 17.2.10 Recent Developments
- 17.2.11 Growth Strategy and Outlook
- 17.3 Gilead Sciences Inc.
- 17.4 GSK PLC
- 17.5 Merck Sharp & Dohme Corp.
- 17.6 Bristol-Myers Squibb Company
- 17.7 Janssen Pharmaceuticals Inc.
- 17.8 Boehringer Ingelheim International GmbH
- 17.9 AbbVie Inc.
- 17.10 F. Hoffmann-La Roche AG
- 17.11 Mylan N.V.
- 17.12 Other Relevant Market Participants
Note: Every listed company is profiled on the structure shown under the first company. The company list is preliminary and may change based on research findings, market developments, data availability and client requirements.
Chapter 18 Disclaimer
- 18.1 Research and Forecast Disclaimer
- 18.2 Data Source and Estimation Limitations
Note: The depth of individual sections depends on data availability for this market. Volume, capacity, trade and other unit-based metrics are included where applicable.

