
Hotel Revenue Management System Market Overview:
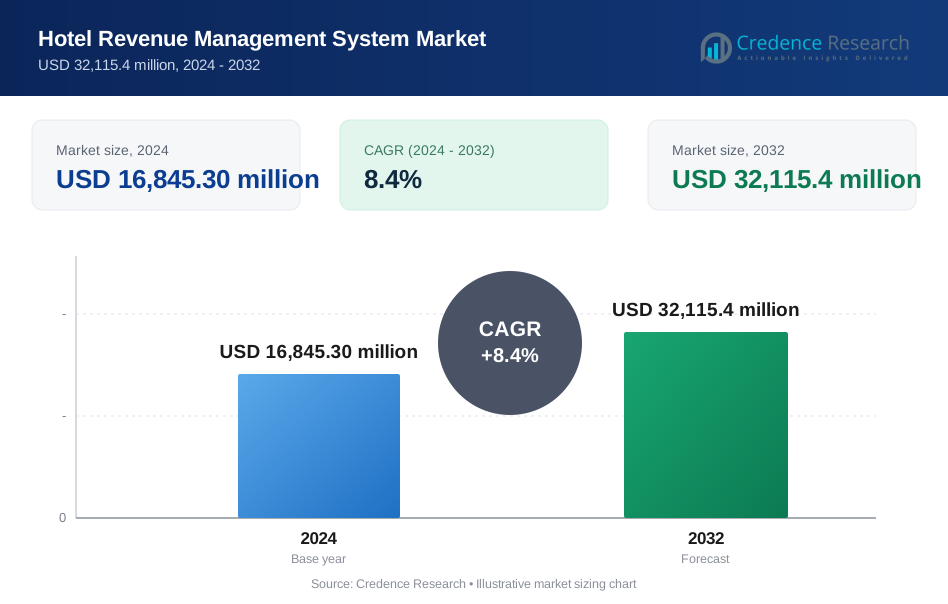
The Hotel Revenue Management System (RMS) market is experiencing strong growth as hotels increasingly rely on data-driven tools to optimize pricing, occupancy, and overall profitability. The market size was valued at USD 16,845.30 million in 2024 and is anticipated to reach USD 32,115.4 million by 2032, expanding at a CAGR of 8.4% during the forecast period.
| REPORT ATTRIBUTE | DETAILS |
|---|---|
| Historical Period | 2020-2023 |
| Base Year | 2024 |
| Forecast Period | 2025-2032 |
| Hotel Revenue Management System Market Size 2024 | USD 16,845.30 million |
| Hotel Revenue Management System Market, CAGR | 8.4% |
| Hotel Revenue Management System Market Size 2032 | USD 32,115.4 million |
Hotel Revenue Management System Market Insights
- Market growth is primarily driven by the shift toward data-driven decision-making, increasing adoption of cloud-based hospitality software, and growing pressure on hotels to maximize RevPAR amid fluctuating demand and high operational costs, with room revenue management remaining the dominant application segment.
- Key market trends include rapid adoption of AI- and machine-learning-based RMS platforms, expansion into non-room revenue streams such as event spaces and food & beverage, and strong uptake of cloud-based deployment, which holds the dominant segment share due to scalability and lower implementation costs.
- The competitive landscape features established players focusing on platform integration, advanced analytics, and multi-property management capabilities, while smaller vendors target independent and mid-sized hotels through flexible pricing and modular solutions.
- Regionally, North America leads with ~38% market share, followed by Europe at ~27% and Asia-Pacific at ~23%, while cloud-based solutions dominate deployment share and large hotels and resorts account for the highest end-user adoption.
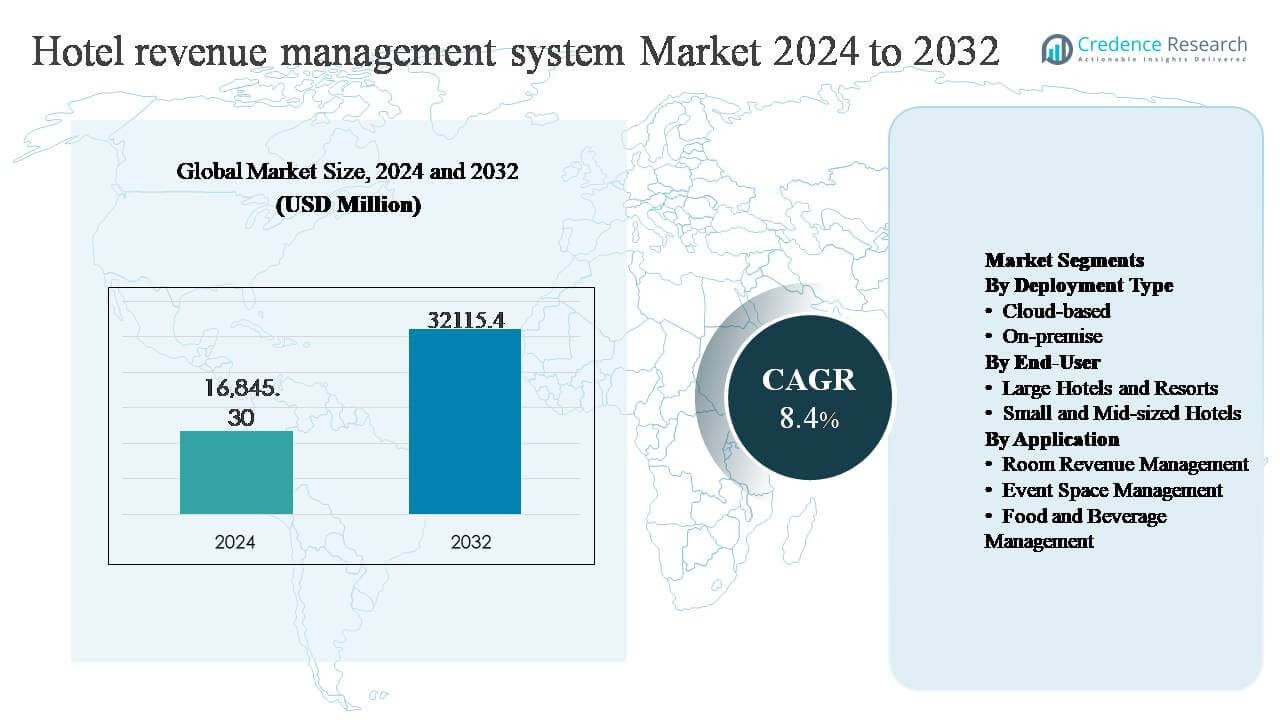
Hotel Revenue Management System Market Segmentation Analysis:
By Deployment Type:
The deployment type segment is led by cloud-based hotel revenue management systems, which account for the dominant market share due to their scalability, lower upfront costs, and ease of integration with property management systems, channel managers, and OTAs. Cloud-based solutions enable real-time data access, centralized control across multiple properties, and frequent software updates without operational disruption, making them especially attractive to multi-property operators. In contrast, on-premise systems maintain relevance among hotels with strict data governance needs, but higher capital expenditure and maintenance complexity continue to limit their adoption compared to cloud-based platforms.
- For instance, Oracle’s Hospitality platform is utilized by approximately 40,000 hotel properties globally. Within this portfolio, the modern OPERA Cloud PMS has seen rapid adoption, with over 13,000 properties now migrated to the cloud as of mid-2025.
By End-User:
Large hotels and resorts represent the dominant sub-segment by market share, driven by their complex room inventories, multiple revenue streams, and need for advanced demand forecasting across diverse customer segments. These establishments leverage sophisticated RMS tools to optimize pricing, manage group bookings, and maximize RevPAR at scale. However, small and mid-sized hotels are emerging as a fast-growing segment, supported by affordable cloud-based solutions tailored to limited operational resources. Drivers include rising competition, increasing reliance on online bookings, and the need to improve occupancy and pricing accuracy without large revenue management teams.
- For instance, Marriott International deploys enterprise-grade revenue management platforms across more than 8,700 properties and approximately 1.6 million rooms worldwide, enabling centralized pricing and forecasting models that ingest historical booking data, forward reservations, and real-time demand signals to support daily pricing decisions at scale.
By Application:
Room revenue management holds the dominant market share within the application segment, as room bookings remain the primary revenue source for most hotels. Demand-based dynamic pricing, inventory optimization, and competitor rate intelligence strongly drive adoption in this area. Event space management is gaining traction among business hotels and resorts by optimizing pricing and utilization of conference and banquet facilities. Meanwhile, food and beverage management is expanding steadily as hotels use RMS analytics to forecast demand, reduce waste, and improve margins across restaurants, bars, and catering operations.
Key Growth Drivers
Rising Adoption of Data-Driven Pricing and Demand Forecasting
Hotels are increasingly adopting revenue management systems to replace manual pricing practices with data-driven decision-making. RMS platforms integrate historical booking data, real-time demand signals, competitor rates, and market events to generate accurate forecasts and optimal pricing recommendations. This capability is critical as booking windows shorten and price sensitivity increases across leisure and business travel segments. Hotels benefit from improved revenue per available room, better inventory utilization, and reduced revenue leakage. The growing complexity of distribution channels, including direct bookings, OTAs, and metasearch platforms, further accelerates RMS adoption as hotels seek centralized control and consistent pricing strategies.
- For instance, Amadeus’ Demand360® and integrated RMS solutions aggregate over 30 million new travel shopping records daily from global distribution systems and booking sources, providing hotels with near real-time visibility into future demand trends and competitive positioning.
Expansion of Cloud-Based Hospitality Technology Ecosystems
The rapid shift toward cloud-based hospitality software strongly drives the RMS market. Cloud deployment enables faster implementation, lower upfront investment, and seamless integration with property management systems, channel managers, customer relationship management tools, and accounting platforms. This ecosystem approach allows hotels to unify operational and commercial data, improving pricing accuracy and responsiveness. Multi-property hotel groups benefit from centralized revenue oversight, while independent hotels gain access to advanced capabilities previously limited to large chains. The availability of subscription-based pricing models further supports adoption, particularly among small and mid-sized hotels seeking scalable and cost-efficient revenue optimization tools.
- For instance, Infor Hospitality’s cloud-based HMS and RMS suite supports multi-property operators by enabling centralized revenue oversight across portfolios spanning hundreds to thousands of rooms per deployment, while independent hotels benefit from enterprise-grade forecasting and pricing tools delivered via subscription-based cloud access without dedicated IT teams.
Growing Focus on Profitability Optimization Beyond Occupancy
Hotels are shifting strategic focus from maximizing occupancy to optimizing total profitability across rooms and ancillary services. Revenue management systems enable this transition by supporting dynamic pricing, length-of-stay controls, and segmentation-based rate optimization. RMS tools also help hotels align pricing strategies with demand patterns, seasonality, and customer booking behavior. As operating costs rise due to labor shortages, energy prices, and inflation, hotels increasingly rely on RMS platforms to protect margins and improve forecasting accuracy. This profitability-centric approach positions RMS as a critical component of modern hotel financial strategy.
Key Trends & Opportunities
Integration of Artificial Intelligence and Machine Learning
Artificial intelligence and machine learning are transforming hotel revenue management by enhancing forecast accuracy and automating pricing decisions. Modern RMS platforms use algorithms to analyze large data sets, detect demand patterns, and adapt rates in near real time. This reduces dependency on manual intervention and enables faster response to market changes. AI-driven recommendations also support personalized pricing strategies based on customer behavior and booking history. As hotels seek greater efficiency and precision, the integration of advanced analytics presents strong growth opportunities for RMS providers.
- For instance, Revinate applies machine learning across its guest data and revenue intelligence platforms by unifying CRM, booking, and engagement data from over 12,000 hotels worldwide, managing guest profiles that collectively exceed hundreds of millions of individual records.
Expansion into Non-Room Revenue Management
Hotels are increasingly applying revenue management principles beyond guestrooms to event spaces, food and beverage outlets, and ancillary services. RMS platforms are evolving to support pricing optimization for conference rooms, banquets, and catering operations, especially in business hotels and resorts. This trend creates new revenue streams and improves asset utilization across the property. The ability to forecast demand and optimize pricing for non-room assets represents a significant opportunity for vendors to differentiate offerings and increase system adoption.
- For instance, Shiji supports non-room monetization by combining its cloud POS layer (Infrasys) with enterprise guest and operational data across a global footprint of over 90,000 hotels, enabling hotels to connect outlet-level transactions and reservation patterns to forward-looking planning for meetings and F&B service periods.
Key Challenges
High Implementation Complexity and Integration Barriers
Despite strong benefits, RMS implementation can be complex, particularly for hotels operating legacy systems. Integration challenges with existing PMS, booking engines, and financial systems often delay deployment and increase costs. Data inconsistencies and poor data quality further limit system effectiveness, reducing confidence in pricing recommendations. Smaller hotels with limited IT expertise face additional hurdles, slowing adoption and increasing reliance on third-party vendors for system maintenance and optimization.
Skill Gaps and Resistance to Automated Decision-Making
The effectiveness of revenue management systems depends on skilled personnel capable of interpreting data and trusting system recommendations. Many hotels face talent shortages in revenue management and analytics, limiting their ability to fully leverage RMS capabilities. Resistance to automated pricing decisions remains a challenge, particularly in traditionally managed properties where manual control is preferred. Overcoming this cultural and operational resistance requires training, change management, and clear demonstration of return on investment, which can slow adoption cycles.
Regional Analysis
North America:
North America dominates the Hotel Revenue Management System market, accounting for approximately 38% of global market share. The region benefits from early adoption of advanced hospitality technologies, a high concentration of large hotel chains, and strong reliance on data-driven pricing strategies. Hotels across the U.S. and Canada actively deploy cloud-based RMS platforms integrated with PMS and channel management systems to optimize RevPAR and manage complex distribution networks. High penetration of online bookings, mature OTA ecosystems, and strong demand for AI-driven forecasting tools continue to support sustained market leadership in this region.
Europe:
Europe holds an estimated 27% market share, supported by a well-established hospitality industry and strong presence of international hotel brands. Revenue management adoption is driven by intense competition in key tourism markets such as France, Germany, the U.K., Spain, and Italy. Hotels increasingly use RMS platforms to manage seasonal demand fluctuations, dynamic pricing, and multi-channel distribution. Regulatory focus on data protection has sustained demand for both cloud-based and on-premise deployments. The region also benefits from growing business travel recovery and expansion of revenue optimization beyond room pricing.
Asia-Pacific:
Asia-Pacific represents around 23% of the global market share and is the fastest-growing regional market. Rapid expansion of hotels across China, India, Southeast Asia, and Australia is driving demand for scalable revenue management solutions. Rising domestic and international tourism, increasing digital booking penetration, and strong adoption of cloud-based hospitality software support market growth. Independent and mid-sized hotels are increasingly deploying RMS tools to compete with global chains. The region’s growing focus on profitability optimization and smart hotel technologies further accelerates adoption across emerging and developed economies.
Latin America:
Latin America accounts for approximately 7% of the global Hotel Revenue Management System market. Growth is driven by increasing tourism investments, expansion of branded hotels, and modernization of hospitality infrastructure across Brazil, Mexico, and Colombia. Hotels in the region are gradually shifting from manual pricing to automated revenue optimization tools to improve occupancy and pricing accuracy. Cloud-based RMS adoption is gaining traction due to lower upfront costs and ease of deployment. However, adoption remains moderate compared to developed regions due to budget constraints and uneven digital maturity.
Middle East & Africa:
The Middle East & Africa region holds close to 5% market share, supported by strong hospitality investments in the Gulf Cooperation Council countries. Luxury hotels, resorts, and large-scale tourism projects in the UAE and Saudi Arabia drive RMS adoption to manage premium pricing and high-value inventories. Event-driven demand, international travel hubs, and mega tourism developments support advanced revenue management usage. In Africa, adoption remains limited but growing, supported by rising international tourism and increasing penetration of cloud-based hotel management platforms.
Hotel Revenue Management System Market Segmentations:
By Deployment Type
- Cloud-based
- On-premise
By End-User
- Large Hotels and Resorts
- Small and Mid-sized Hotels
By Application
- Room Revenue Management
- Event Space Management
- Food and Beverage Management
By Geography
- North America
- U.S.
- Canada
- Mexico
- Europe
- Germany
- France
- U.K.
- Italy
- Spain
- Rest of Europe
- Asia Pacific
- China
- Japan
- India
- South Korea
- South-east Asia
- Rest of Asia Pacific
- Latin America
- Brazil
- Argentina
- Rest of Latin America
- Middle East & Africa
- GCC Countries
- South Africa
- Rest of the Middle East and Africa
Competitive Landscape
The competitive landscape of the Hotel Revenue Management System market is characterized by the presence of global hospitality technology providers and specialized revenue optimization vendors competing on analytics capability, system integration, and scalability. Leading players focus on delivering cloud-based, AI-driven platforms that integrate seamlessly with property management systems, channel managers, and booking engines. Competition intensifies as vendors enhance machine learning algorithms, real-time pricing automation, and multi-property management features to serve large hotel chains and growing independent hotels. Strategic partnerships with PMS providers, continuous product upgrades, and expansion into non-room revenue management strengthen market positioning. Additionally, vendors increasingly differentiate through user-friendly interfaces, configurable dashboards, and advanced forecasting accuracy. The market remains moderately consolidated, with established providers maintaining strong brand presence while emerging players target niche segments and regional markets through flexible pricing models and tailored solutions.
Key Player Analysis
- Duetto Research
- Oracle Corporation
- Shiji Group
- Revinate
- Amadeus IT Group SA
- SAS Institute Inc.
- Infor, Inc.
Recent Developments
- In June 17, 2025, Duetto introduced The Revenue & Profit Operating System (RP-OS), a next-generation revenue management platform that unifies pricing, forecasting, reporting, group business optimization, and profit insights into a single system designed to help revenue teams unify revenue streams across transient, group, and ancillary services with advanced automation and AI algorithms.
- In February 14, 2025, Infor announced the release of a new AI-powered Revenue Management Solution (RMS) for the hospitality industry that leverages artificial intelligence and machine learning to enhance pricing strategies, automate revenue decisions, provide multi-dimensional pricing controls, and unify revenue optimization across rooms, event spaces, and other hotel revenue centers.
Report Coverage
The research report offers an in-depth analysis based on Deployment type, End-User, Application and Geography. It details leading market players, providing an overview of their business, product offerings, investments, revenue streams, and key applications. Additionally, the report includes insights into the competitive environment, SWOT analysis, current market trends, as well as the primary drivers and constraints. Furthermore, it discusses various factors that have driven market expansion in recent years. The report also explores market dynamics, regulatory scenarios, and technological advancements that are shaping the industry. It assesses the impact of external factors and global economic changes on market growth. Lastly, it provides strategic recommendations for new entrants and established companies to navigate the complexities of the market.
Future Outlook
- Hotel revenue management systems will increasingly rely on artificial intelligence and machine learning to deliver real-time, automated pricing decisions.
- Cloud-based platforms will continue to dominate as hotels prioritize scalability, flexibility, and lower total cost of ownership.
- Revenue management will expand beyond rooms to include event spaces, food and beverage, and ancillary services.
- Integration with property management, customer relationship, and distribution systems will become more seamless and standardized.
- Personalized pricing based on guest behavior and booking patterns will gain wider acceptance across hotel segments.
- Small and mid-sized hotels will accelerate adoption as solutions become more affordable and user-friendly.
- Multi-property and centralized revenue management capabilities will strengthen among global hotel chains.
- Predictive demand forecasting will improve accuracy through enhanced data inputs and real-time market signals.
- Mobile and dashboard-driven decision tools will support faster revenue strategy adjustments by hotel teams.
- Revenue management systems will play a critical role in improving profitability amid rising operating costs and competitive pressure.
Request a Free Sample
Fill in your details and we'll send you a free sample report.
- Sample data tables & charts
- Research methodology
Need a Custom Version of This Report?
Tailor the scope, geography, or segments to your exact requirements.
- Custom geography or segment scope
- Direct access to our analyst team
Frequently Asked Questions
What is the current market size for the Hotel Revenue Management System market, and what is its projected size in 2032?
At what Compound Annual Growth Rate is the Hotel Revenue Management System market projected to grow between 2024 and 2032?
Which Hotel Revenue Management System segment held the largest share in 2024?
What are the primary factors fueling the growth of the Hotel Revenue Management System market?
Who are the leading companies in the Hotel Revenue Management System market?
Which region commanded the largest share of the Hotel Revenue Management System market in 2024?
Table of Content
Chapter 1. Report Introduction
- 1.1 Report Description & Purpose
- 1.1.1 Report Title & Market Definition
- 1.1.2 Unique Selling Propositions (USP) & Key Differentiators
- 1.1.3 Value Proposition for Stakeholders
- 1.2 Research Objectives
- 1.2.1 Market Sizing Objectives (Volume & Revenue)
- 1.2.2 Segmentation Objectives
- 1.2.3 Competitive Intelligence Objectives
- 1.2.4 Forecast & Scenario Objectives
- 1.3 Report Scope
- 1.3.1 Hotel Revenue Management System Scope – Types & Subtypes Covered
- 1.3.2 Geographic Scope – Regions & Countries Covered
- 1.3.3 Historical Period, Base Year & Forecast Period (2024; forecast to 2032)
- 1.3.4 Inclusions & Exclusions
- 1.4 HS Code & Classification Framework
- 1.5 Currency, Units & Pricing Basis
- 1.6 Target Stakeholders
- 1.7 Limitations & Assumptions
Chapter 2. Executive Summary
- 2.1 Global Hotel Revenue Management System Market Snapshot
- 2.1.1 Market Size – Historical (2024) & Forecast (2024-2032) (2024: USD 16,845.30 million → 2032: USD 32,115.4 million)
- 2.1.2 Volume & Revenue – Global Totals
- 2.1.3 Key Market Highlights – Top Five Facts
- 2.2 Hotel Revenue Management System Market Segmentation Snapshot
- 2.2.1 Market Split by Region – 2024 vs. 2032
- 2.3 Competitive Snapshot
- 2.3.1 Top 10 Players by Revenue Share – 2024
- 2.3.2 Top 10 Players by Volume Share – 2024
- 2.3.3 Recent Strategic Developments (18-Month Summary)
- 2.4 Key Investment Highlights & Strategic Conclusions
Chapter 3. Hotel Revenue Management System Market Dynamics & Industry Analysis
- 3.1 Market Overview & Context
- 3.1.1 Hotel Revenue Management System Market Position in the Broader Automotive Value Chain
- 3.1.2 OEM vs. Replacement Market Dynamics
- 3.1.3 Market Maturity & Development Stage by Region
- 3.2 Hotel Revenue Management System Market Drivers
- 3.3 Hotel Revenue Management System Market Restraints & Challenges
- 3.4 Hotel Revenue Management System Market Opportunities
- 3.5 Porter's Five Forces Analysis
- 3.5.1 Threat of New Entrants
- 3.5.2 Bargaining Power of Suppliers
- 3.5.3 Bargaining Power of Buyers
- 3.5.4 Threat of Substitutes
- 3.5.5 Competitive Rivalry – Intensity Assessment
- 3.6 Hotel Revenue Management System Value Chain Analysis
- 3.6.1 Upstream – Raw Material/Input Suppliers
- 3.6.1.1 Raw Material/Input 1
- 3.6.1.2 Raw Material/Input 2
- 3.6.1.3 Raw Material/Input 3
- 3.6.2 Midstream – Production/Manufacturing/Service Delivery
- 3.6.2.1 Production/Process Overview
- 3.6.2.2 Key Facility Locations & Capacity by Manufacturer
- 3.6.3 Downstream – Distribution & End Consumer
- 3.6.3.1 Primary Channel – B2B/OEM
- 3.6.3.2 Secondary Channels – Dealer, Retail, Online, Direct
- 3.6.4 Value Chain Profitability Analysis
- 3.6.1 Upstream – Raw Material/Input Suppliers
- 3.7 PESTEL Analysis
- 3.7.1 Political Factors
- 3.7.2 Economic Factors
- 3.7.3 Social Factors
- 3.7.4 Technological Factors
- 3.7.5 Environmental Factors
- 3.7.6 Legal Factors
- 3.8 Hotel Revenue Management System Supply Chain Analysis
- 3.8.1 Raw Material/Input Supply Risk Assessment
- 3.8.2 Manufacturing Concentration Risk (Geographic Exposure)
- 3.8.3 Trade Disruption Impact Analysis
- 3.9 Regulatory & Policy Landscape
Note: The regulatory and policy landscape section covers regulations based on their applicability to the market, Hotel Revenue Management System category, geography, and scope of the study. Only regulatory frameworks with a material impact on operations, compliance, trade, sustainability, or market access are analyzed in detail.
Chapter 4. Key Investment Pockets & Opportunity Analysis
- 4.1 Hotel Revenue Management System Market Attractiveness Analysis
- 4.1.1 By Region – Investment Attractiveness Matrix (Volume × CAGR)
- 4.2 Absolute Revenue Growth Opportunity
- 4.2.1 By Region – Absolute USD Growth Through 2032
- 4.3 Incremental Volume Opportunity
- 4.3.1 By Region – Incremental Volume Through 2032
- 4.3.2 Segment – Incremental Volume
- 4.4 Emerging Submarket Opportunity Deep Dive (Subject to Applicability)
- 4.5 Emerging Market Opportunity Scorecards
- 4.5.1 United States
- 4.5.2 Europe
- 4.5.3 Asia
- 4.5.4 Middle East & Africa
Note: Emerging Market Opportunity Scorecards will be included based on relevance and strategic importance. Regions listed are indicative and may vary depending on data availability and market dynamics.
Chapter 5. Hotel Revenue Management System Import-Export Analysis & Trade Flows
- 5.1 Global Trade Overview
- 5.1.1 Global Export Value by Country (2024)
- 5.1.2 Global Export Volume by Country (2024)
- 5.1.3 Global Import Value by Country (2024)
- 5.1.4 Global Import Volume by Country (2024)
- 5.1.5 Net Trade Balance by Country (2024)
- 5.2 Export Analysis – Segment
- 5.2.1 Type 1 (HS Code)
- 5.2.2 Type 2 (HS Code)
- 5.2.3 Type 3 (HS Code)
- 5.2.4 Type 4 (HS Code)
- 5.2.5 Type 5 (HS Code)
- 5.3 Import Analysis – Segment
- 5.3.1 Type 1 (HS Code)
- 5.3.2 Type 2 (HS Code)
- 5.3.3 Type 3 (HS Code)
- 5.3.4 Type 4 (HS Code)
- 5.3.5 Type 5 (HS Code)
- 5.4 Average Unit Trade Prices
- 5.4.1 Average Export Price – Segment & Country
- 5.4.2 Average Import Price – Segment & Source Country
- 5.4.3 Price Trends (2024)
- 5.5 Key Trade Route Analysis
- 5.5.1 Trade Route 1
- 5.5.2 Trade Route 2
- 5.5.3 Trade Route 3
- 5.5.4 Trade Route 4
- 5.5.5 Trade Route 5
- 5.6 Trade Policy Impact Assessment
- 5.6.1 US Anti-Dumping & Section 301 Tariffs
- 5.6.2 EU Customs Union Impact
- 5.6.3 Major Free Trade Agreements
- 5.6.4 USMCA Rules of Origin
Note: Trade policy analysis will be included only where relevant to the Hotel Revenue Management System market.
Chapter 6. Competitive Landscape & Company Benchmarking
- 6.1 Hotel Revenue Management System Market Concentration & Structure
- 6.1.1 Herfindahl-Hirschman Index (HHI) – vs. 2024
- 6.1.2 Tier 1, Tier 2 & Tier 3 Market Structure
- 6.1.3 Global, Regional & Local Player Dynamics
- 6.2 Hotel Revenue Management System Market Share Analysis – 2024
- 6.2.1 Global Revenue Share by Company
- 6.2.2 Global Volume Share by Company
- 6.2.3 Regional Revenue Share
- 6.2.4 Market Share Evolution ( vs. 2024)
- 6.2.5 OEM Segment Share by Company
- 6.2.6 Replacement Segment Share by Company
- 6.3 Production/Delivery Capacity & Facility Analysis
- 6.3.1 Global Installed Capacity
- 6.3.2 Capacity Utilization Rates
- 6.3.3 Production/Output Volume
- 6.3.4 Facility Locations & Capacity Map
- 6.3.5 Planned Capacity Additions
- 6.4 Hotel Revenue Management System Competitive Benchmarking Matrix
- 6.4.1 Revenue, Volume, CAGR & Profitability Comparison
- 6.4.2 Channel Revenue Mix
- 6.4.3 Geographic Revenue Exposure
- 6.4.4 R&D Intensity
- 6.4.5 Sustainability Maturity
- 6.5 Strategic Developments in Hotel Revenue Management System (Last 24 Months)
- 6.5.1 Mergers, Acquisitions & Divestments
- 6.5.2 New Hotel Revenue Management System Launches
- 6.5.3 Facility Expansions
- 6.5.4 Strategic Alliances, Joint Ventures & Partnerships
- 6.5.5 Distribution Expansion & Market Entry
- 6.5.6 Sustainability & ESG Initiatives
- 6.6 Competitive Strategy Mapping
- 6.6.1 Leader, Challenger, Follower & Niche Classification
- 6.6.2 Pricing Strategy Comparison
- 6.6.3 Channel Strategy Matrix
Note: Strategic developments are included based on their materiality and the availability of reliable information.
Chapter 7. Global Hotel Revenue Management System Market – By Distribution Channel
- 7.1 Segment Overview
- 7.1.1 Volume & Revenue Split by Channel (2024 & 2032)
- 7.1.2 Channel Mix Evolution (2024-2032)
Chapter 8. Regional Market Analysis – Global Overview
- 8.1 Global Regional Overview
- 8.1.1 Regional Volume Share
- 8.1.2 Regional Revenue Share
- 8.1.3 Regional Volume by Region
- 8.1.4 Regional Revenue by Region
- 8.1.5 Regional Forecast Through 2032
- 8.2 Cross-Regional Segment Analysis
- 8.2.1 By Distribution Channel
- 8.2.2 By Brand/Price Tier
Chapter 9. North America Hotel Revenue Management System Market
- 9.1 United States
- 9.2 Canada
- 9.3 Mexico
Chapter 10. Europe Hotel Revenue Management System Market
- 10.1 Germany
- 10.2 France
- 10.3 Italy
- 10.4 United Kingdom
- 10.5 Spain
- 10.6 Poland
- 10.7 Russia
- 10.8 Netherlands
- 10.9 Belgium
- 10.10 Sweden
- 10.11 Denmark
- 10.12 Norway
- 10.13 Rest of Europe
Chapter 11. Asia Pacific Hotel Revenue Management System Market
- 11.1 China
- 11.2 India
- 11.3 Japan
- 11.4 South Korea
- 11.5 Thailand
- 11.6 Indonesia
- 11.7 Vietnam
- 11.8 Malaysia
- 11.9 Australia
- 11.10 Rest of Asia Pacific
Chapter 12. Latin America Hotel Revenue Management System Market
- 12.1 Brazil
- 12.2 Argentina
- 12.3 Colombia
- 12.4 Chile
- 12.5 Rest of Latin America
Chapter 13. Middle East Hotel Revenue Management System Market
- 13.1 Saudi Arabia
- 13.2 United Arab Emirates
- 13.3 Turkey
- 13.4 Israel
- 13.5 Iran
- 13.6 Rest of the Middle East
Chapter 14. Africa Hotel Revenue Management System Market
- 14.1 South Africa
- 14.2 Egypt
- 14.3 Nigeria
- 14.4 Morocco
- 14.5 Rest of Africa
Chapter 15. Hotel Revenue Management System Company Profiles
- 15.1 [Company 01]
- 15.1.1 Company Overview
- 15.1.2 Key Management Personnel
- 15.1.3 Products & Services Portfolio
- 15.1.4 Financial Performance
- 15.1.5 Key Market Focus & Geographic Presence
- 15.1.6 Recent Developments & Strategic Initiatives
Note: The company profile list is preliminary and may change based on research findings, market developments, data availability, and client requirements.
Chapter 16. Appendices
- Appendix A – List of Abbreviations & Acronyms
- Appendix B – Industry Classification Code Reference – Full Series
- Appendix C – Production & Capacity Data Tables
- Appendix D – End-Use & Demand Base Tables
- Appendix E – Consumption & Replacement Rate Assumptions
- Appendix F – ASP Reference Tables
- Appendix G – Manufacturing & Facility Database
- Appendix H – Import-Export Data Tables
- Appendix I – Regulatory Summary Tables
- Appendix J – Primary Research Participant List (Anonymized)
- Appendix K – Primary Research Questionnaire Framework
- Appendix L – Data Sources & Bibliography
- Appendix M – Market Size Divergence & Source Comparison
Chapter 17. Research Methodology
- 17.1 Research Framework & Philosophy
- 17.2 Secondary Research – Sources, Hierarchy & Data Extraction
- 17.3 Data Modeling – Bottom-Up & Top-Down Market Sizing
- 17.4 Primary Research – Stakeholder Framework, LOI & Sample Sizes
- 17.5 Forecast Methodology – Regression, Scenario & Sensitivity Analysis
- 17.6 Quality Control – Four-Layer Validation Framework
- 17.7 Limitations & Standard Assumptions
- 17.8 Disclaimer
