
Packaged food and drink demand shifts toward emerging Asia
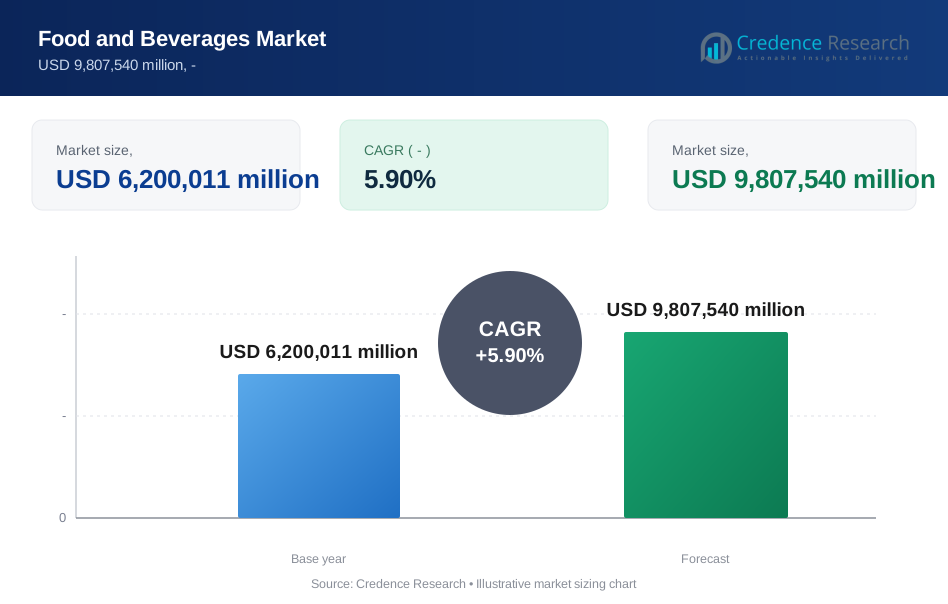
The global food and beverages market was valued at USD 6,565.81 billion in 2025 and is projected to increase from USD 6,953.19 billion in 2026 to USD 11,647.91 billion by 2035, registering a CAGR of 5.90% during 2026–2035. Demand comes from rising protein intake in lower-income countries, larger online grocery baskets and steady spending on packaged staples across Asia. Asia Pacific held the largest regional share, 37.0% in 2025, helped by China and India, while Middle East & Africa is the fastest-growing region at 7.08% a year from a smaller base. Input costs remain the main commercial pressure, since the FAO Food Price Index averaged 127.2 points in 2025, 4.3% above 2024. On the regulatory side, U.S. manufacturers must remove FD&C Red No. 3 from foods by Jan. 15, 2027, which is forcing reformulation across confectionery and bakery ranges. Large deals are also redrawing the industry, including the $36 billion purchase of Kellanova by Mars completed in December 2025.
How big is the food and beverage industry and what does it include?
This report counts sales of processed and packaged food, soft drinks, alcoholic drinks, dairy, bakery, meat, poultry and seafood at manufacturer level, with buyers reached through supermarkets, hypermarkets, online stores and traditional shops. Syrups, seasonings, oils and pet food sit in the Others category, because they share plants and routes to market with mainstream grocery items.
Restaurant margins and unprocessed farm produce sold loose are excluded from the value, so this estimate sits below measures of total food spending. The value chain runs from farm and ingredient suppliers through processors and bottlers to retailers, and pricing power differs sharply along that chain depending on the commodity and the strength of the brand.
Food and Beverages Market Insights
- The market grows from USD 6,565.81 billion in 2025 to USD 11,647.91 billion by 2035, a 5.90% annual rate carried by emerging-market volume more than by price.
- Asia Pacific led with 37.0% of 2025 value, and China reported grain, oil and food retail sales up 9.3% that year.
- Meat, poultry and seafood held 24.0% of 2025 value, while Brazil alone shipped 3.50 million tons of beef abroad in 2025, according to Abiec.
- Online grocery reached about one-fifth of U.S. grocery spending and supplied close to 75% of dollar growth in 2025, according to FMI.
- Deals worth $36 billion for Kellanova and $18 billion for JDE Peet's show large groups buying scale in snacks and coffee rather than building it.
Meat leads by value while frozen and online grow fastest
Why animal protein leads and frozen formats grow fastest
Based on type, the market is categorized into meat, poultry and seafood, bakery and confectionery, non-alcoholic beverages, dairy food, alcoholic beverages, frozen, canned and dried food, and others. Meat, Poultry and Seafood led with 24.0% of 2025 value because animal protein carries high unit prices, and the OECD-FAO Outlook of July 2025 projects per capita animal-source food intake up 24% in lower middle-income countries by 2034. Frozen, Canned and Dried Food grows fastest at 6.85% a year, as 40% of shoppers now use frozen items daily or every few days, up from 35% in 2019, according to the February 2026 Power of Frozen study from AFFI and FMI.
Why conventional dominates while organic outpaces it
Based on nature, the market is categorized into conventional and organic products. Conventional led with 97.5% of 2025 value because organic remains a small niche even in its strongest country, where Switzerland reached a 12.3% share of food sales, according to FiBL and IFOAM in February 2026. Organic grows fastest at 7.85% a year, as worldwide organic retail sales reached 145.0 billion euros in 2024, up 6.9 billion euros in one year. The United States accounted for 60.4 billion euros of that total, ahead of Germany and China, so growth is still concentrated in a few wealthy markets.
Why stores keep the lead as online baskets grow
Based on distribution channels, the market is categorized into supermarkets, hypermarkets, e-commerce and others, which include convenience and traditional shops. Supermarkets led with 38.0% of 2025 value because food purchases remain largely store-led, even though nearly 94% of U.S. grocery shoppers bought through both routes in 2025, according to FMI. E-commerce grows fastest at 8.90% a year, as a July 2025 USDA report found India's online grocery sales rising about 18% a year from 2021 to 2025. In response, retailers are widening grocery delivery options to retain frequent shoppers.
| Segment Group | Leading Sub-segment | Share, 2025 | Fastest-growing Sub-segment | CAGR, 2026–2035 |
|---|---|---|---|---|
| By Type | Meat, Poultry and Seafood | 24.0% | Frozen, Canned and Dried Food | 6.85% |
| By Nature | Conventional | 97.5% | Organic | 7.85% |
| By Distribution Channels | Supermarkets | 38.0% | E-commerce | 8.90% |
Request a Free Sample
Fill in your details and we'll send you a free sample report.
- Sample data tables & charts
- Research methodology
Protein, Asian retail and online baskets lift sales
Protein demand rises fastest in lower-income countries
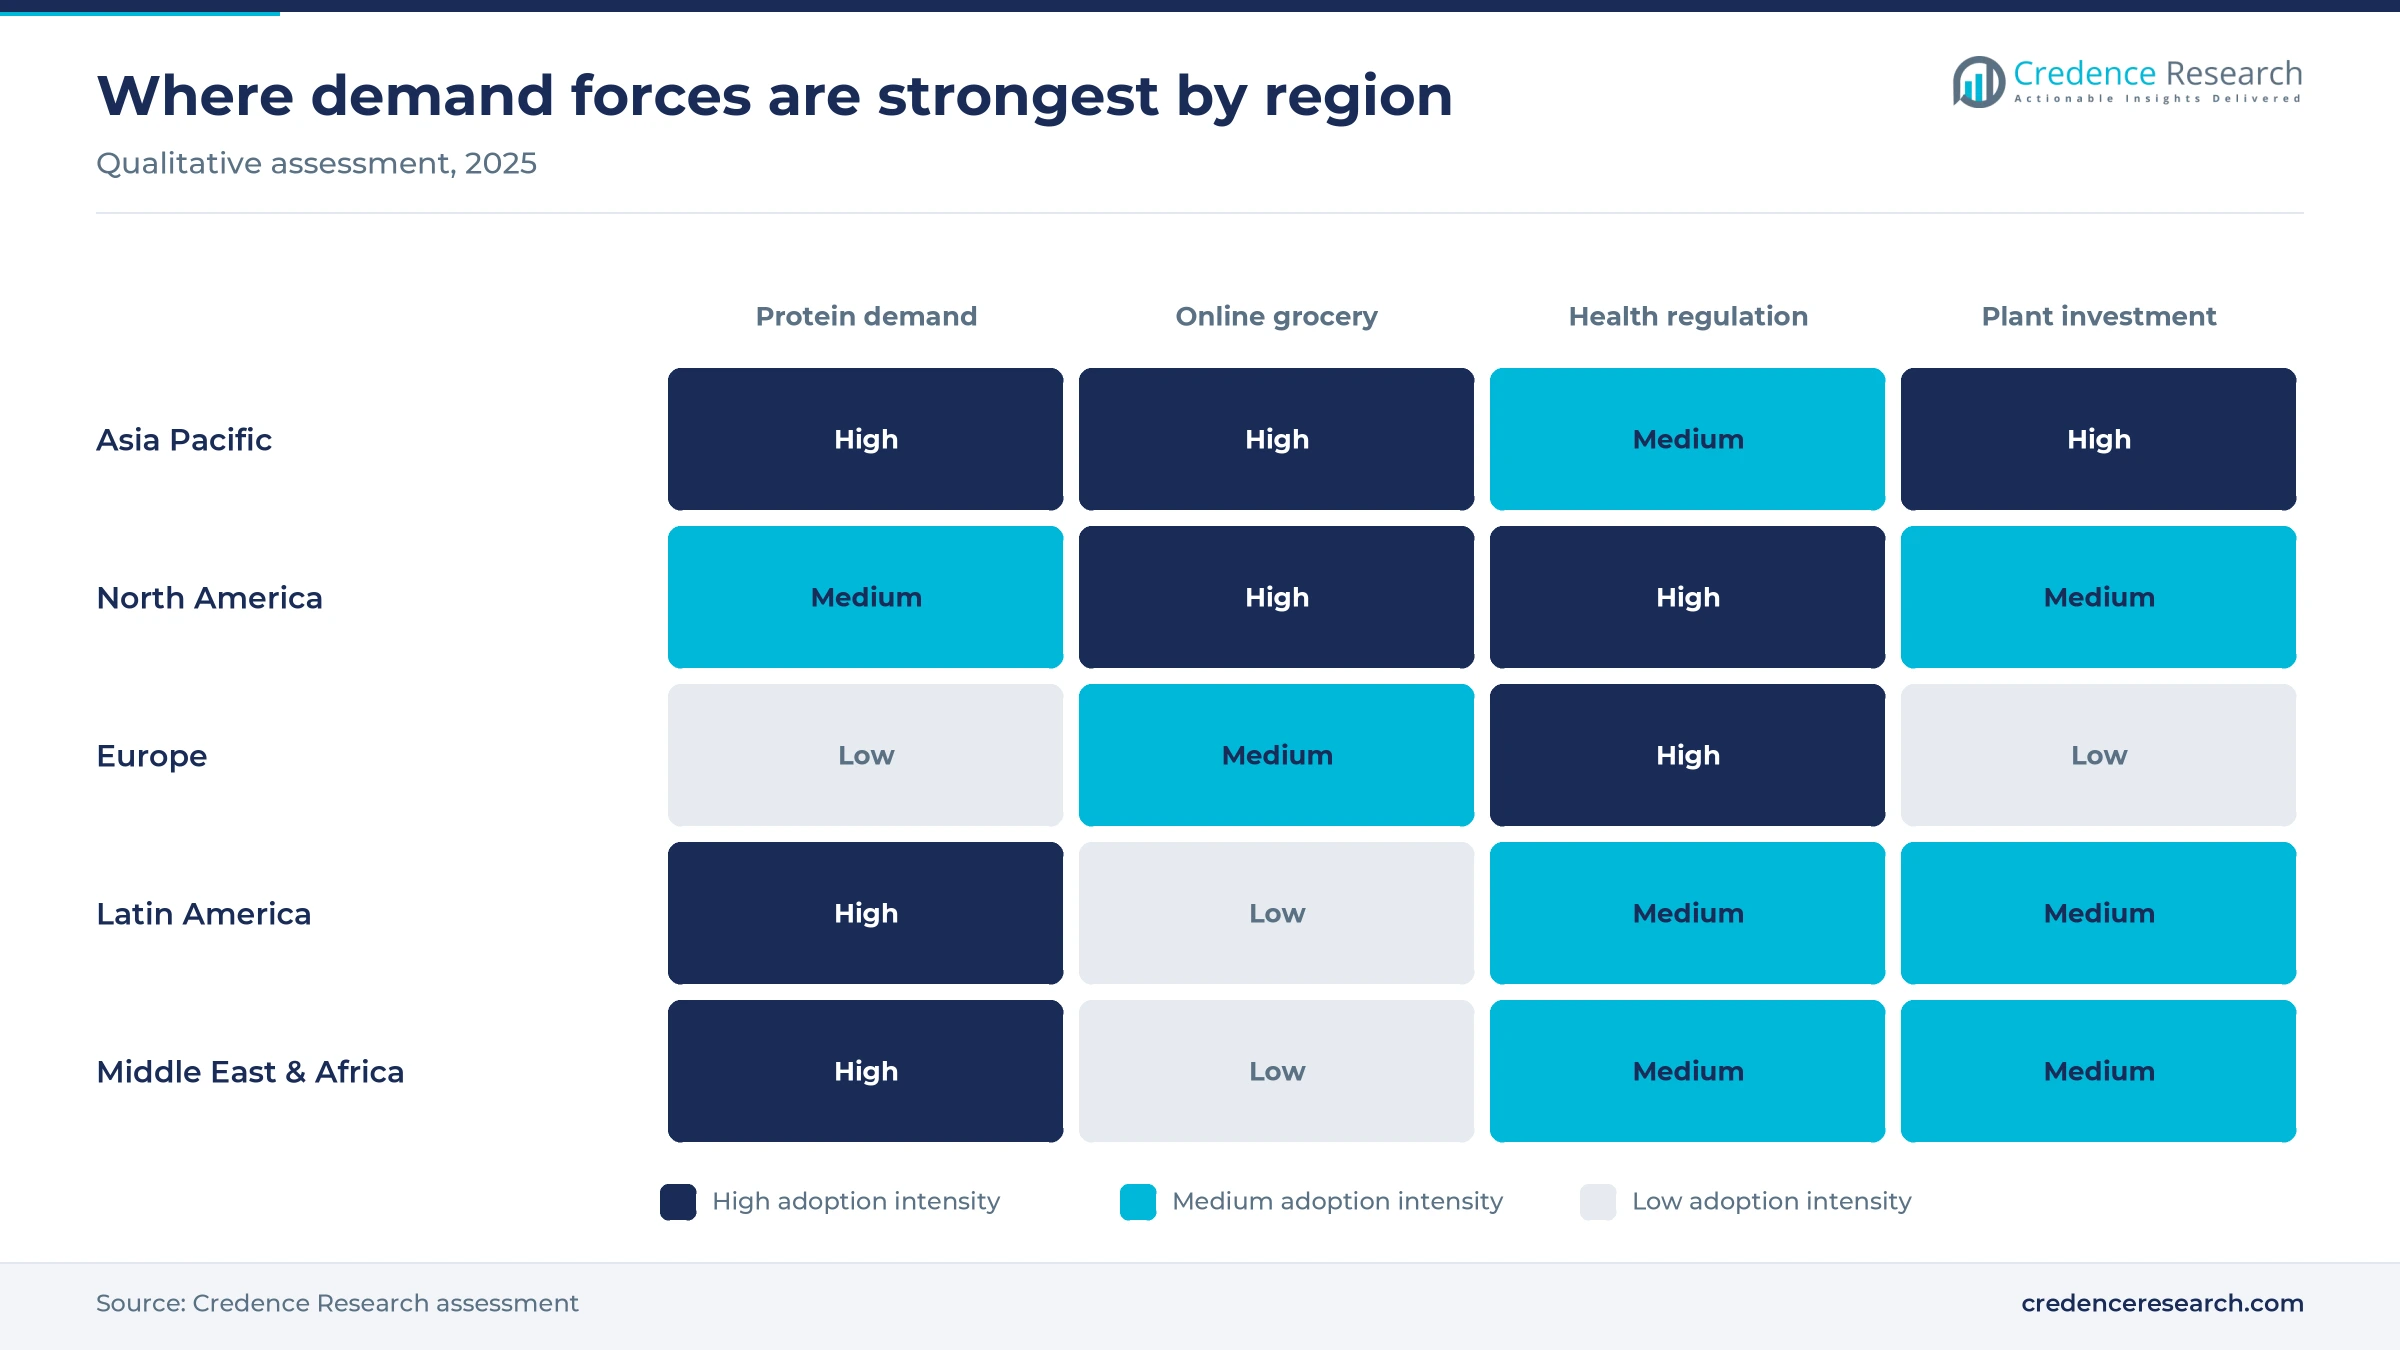
Rising protein intake is the largest volume driver, because new consumers in lower-income countries are still far below recommended levels. The OECD-FAO Agricultural Outlook, published in July 2025, projects global per capita consumption of animal-source foods up 6% by 2034 and output of meat, dairy and eggs up 17%. The same outlook puts intake at just 143 kilocalories a day in low-income countries, against 364 in middle-income countries, which shows the room left for growth. Supply is responding, since Brazil exported 3.50 million tons of beef in 2025, up 20.9%, according to Abiec. As a result, Meat, Poultry and Seafood holds 24.0% of 2025 value, and processed meat lines gain as cold chains extend.
Asian retail spending and new plants expand capacity
Asian retail spending supports growth even while Western volumes are flat, and manufacturers are adding capacity to follow it. China's National Bureau of Statistics reported grain, oil and food retail sales of 2,399.1 billion yuan in 2025, up 9.3%, well ahead of the 3.7% rise in total retail sales. In India, PepsiCo said in May 2026 that it would invest up to Rs 5,700 crore, about $665 million, by 2030 in plants across Madhya Pradesh, Assam and Tamil Nadu, according to PotatoPro. These commitments favor local sourcing and regional snack formats rather than imported brands. In turn, Asia Pacific grows at 6.78% a year in the food and beverages market, faster than North America or Europe.
Online grocery baskets add most new retail dollars
Online grocery now adds most of the new retail dollars in the United States, and that shift changes how brands win shelf space. According to FMI, The Food Industry Association, online accounted for about one-fifth of grocery spending and close to 75% of dollar growth in 2025, while in-store sales stayed relatively stable. Its April 2026 release projects online sales of $452 billion by 2028, an 11.6% annual rate. Online food sales rose nearly 19% in 2025, so the channel is no longer limited to shelf-stable goods. In India, a July 2025 USDA report valued online grocery at $8.8 billion in 2024, with Swiggy Instamart, Blinkit and Zepto controlling over 85% of quick commerce. Consequently, E-commerce grows fastest at 8.90% a year in this report.
Large deals move capital into snacks, coffee and yogurt
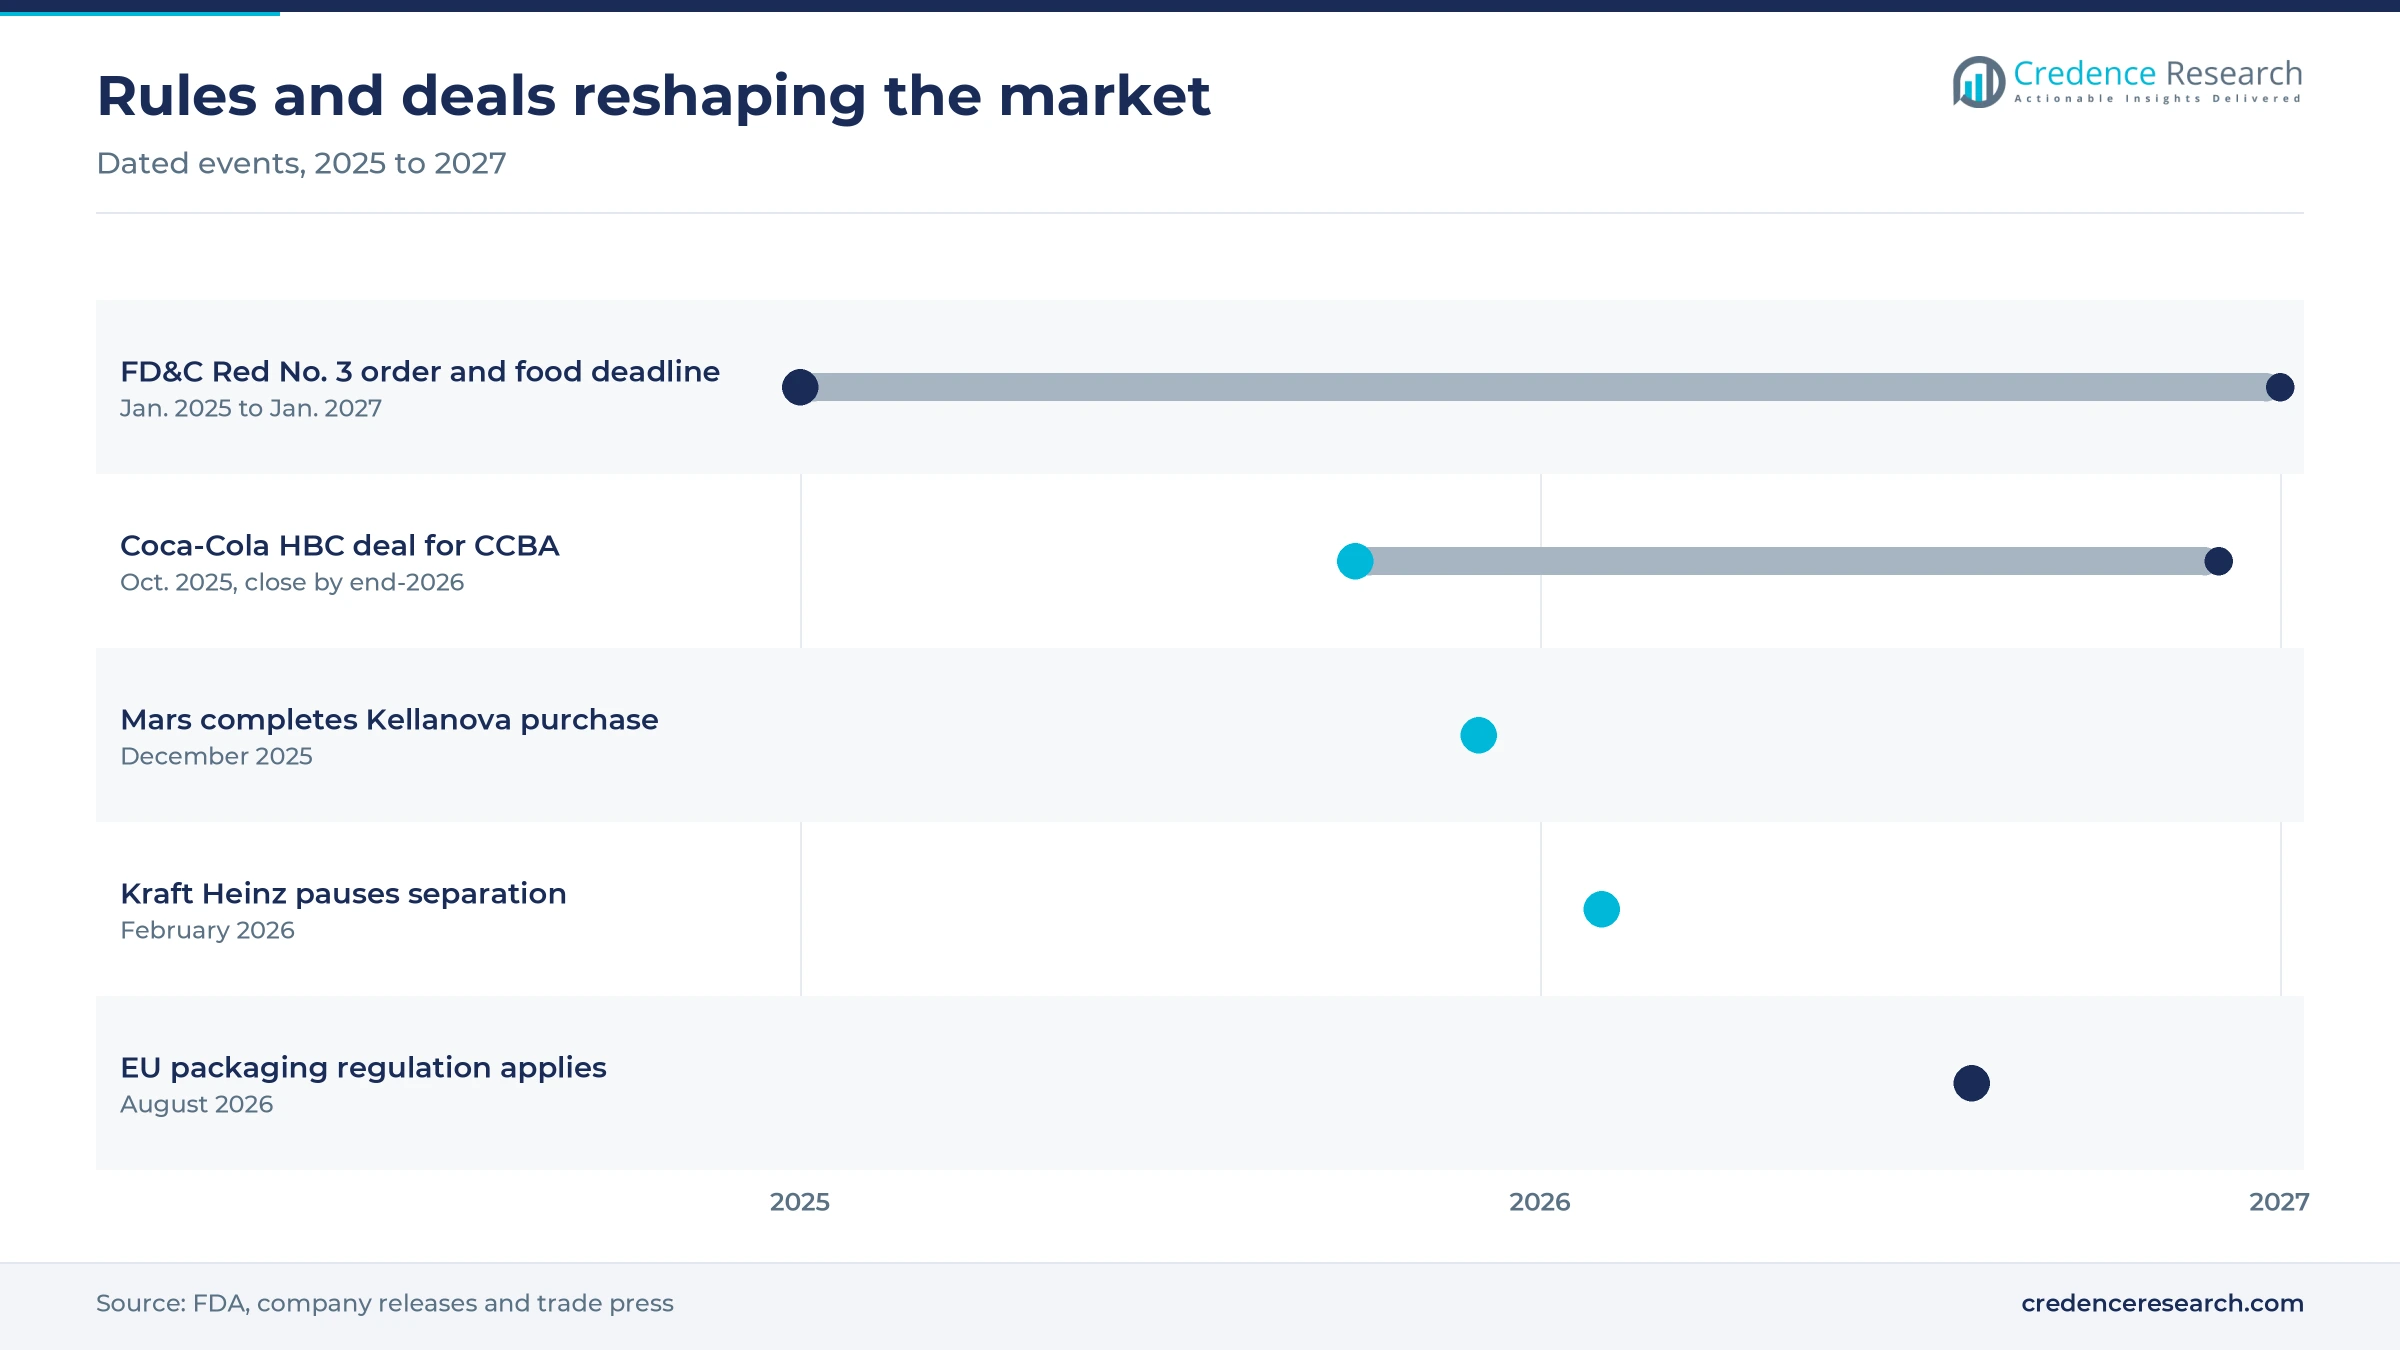
Large acquisitions are moving capital into categories with stronger brands and better margins, which supports marketing and distribution spending in those lines. Mars completed its $36 billion acquisition of Kellanova in December 2025, adding Pringles and Cheez-It to its snacking arm, according to Consumer Goods Technology. Keurig Dr Pepper then acquired 96.22% of JDE Peet's by April 2026 in an $18 billion transaction, according to FoodNavigator. The same FoodNavigator review lists Ferrero's $3.1 billion purchase of WK Kellogg and a pending Danone deal for MADE Group and the rest of its Australian yogurt venture with Saputo, worth about $1.4 billion combined. These buyers can spread ingredient, media and logistics costs across wider ranges, which raises the scale needed to compete.
Protein claims, no-alcohol drinks and frozen reshape ranges
Shift toward protein claims and less processed products
Product development is shifting toward protein and away from highly processed snacks, a change led by U.S. policy and weight-loss medication. The Dietary Guidelines for Americans released in January 2026 set a daily target of 1.2 to 1.6 grams of protein per kilogram of body weight and urge people to avoid highly processed packaged items, according to New Food Magazine. Separately, a Cornell University study found that households cut grocery spending by about 6% within six months of starting GLP-1 drugs, and savory snack purchases fell 11%. Fresh produce and yogurt purchases gained modestly in that same study. As a result, the pressure to rework portions and add protein falls hardest on bakery, snack and confectionery lines in North America.
Rise of no-alcohol drinks as alcohol volumes fall
The beverage market is moving toward lower-alcohol and no-alcohol choices, and the latest volume data show this clearly. The International Organisation of Vine and Wine reported in May 2026 that global wine consumption fell 2.7% to 208 million hectoliters in 2025. German beer sales fell 6.0% to about 7.8 billion liters that year, according to Destatis, while alcohol-free beer and mixed drinks passed 10% of German retail turnover for the first time, according to Inside.Beer. China showed similar caution, with beverages retail up only 1.0% and tobacco and liquor up 2.7%, according to its statistics bureau. PepsiCo's $1.95 billion purchase of Poppi, reported by FoodBev Media, shows where large groups see the next soft drink growth. Alcoholic beverages therefore grow slower than non-alcoholic beverages in the Credence Research model.
Opportunity in organic ranges for mid-income shoppers
Organic offers an opening for manufacturers that can narrow the price gap, because sales are growing but remain highly concentrated. Europe alone reached 58.7 billion euros of organic retail sales in 2024, up 4.1%, according to FiBL, with Germany at 17.0 billion euros and France at 12.2 billion euros. China reached 15.5 billion euros in 2024, which shows demand outside the traditional Western base. Swiss shoppers spend 481 euros a person each year, far above any other country, which indicates the distance that other markets could still travel. Consequently, Organic grows at 7.85% a year in this report, and private-label organic ranges offer retailers a practical way to reach middle-income shoppers.
Opportunity in frozen meals built around waste reduction
Frozen ranges offer an opening because shoppers increasingly treat them as everyday ingredients rather than as back-up meals. The Power of Frozen in Retail study, released by AFFI and FMI in February 2026, found that 30% of shoppers plan to buy more frozen food in the coming months. It also found that 37% use frozen products to reduce food waste, and 71% are looking for items they have not bought before. Three in four consumers combine fresh and frozen ingredients in the same meal, which favors vegetables, proteins and sauces over complete dinners. Growth in the wider frozen category also rewards cold storage investment. Therefore Frozen, Canned and Dried Food grows fastest in this report, at 6.85% a year.
Input costs, dye rules and health taxes squeeze margins
Vegetable oil, dairy and coffee costs squeeze margins
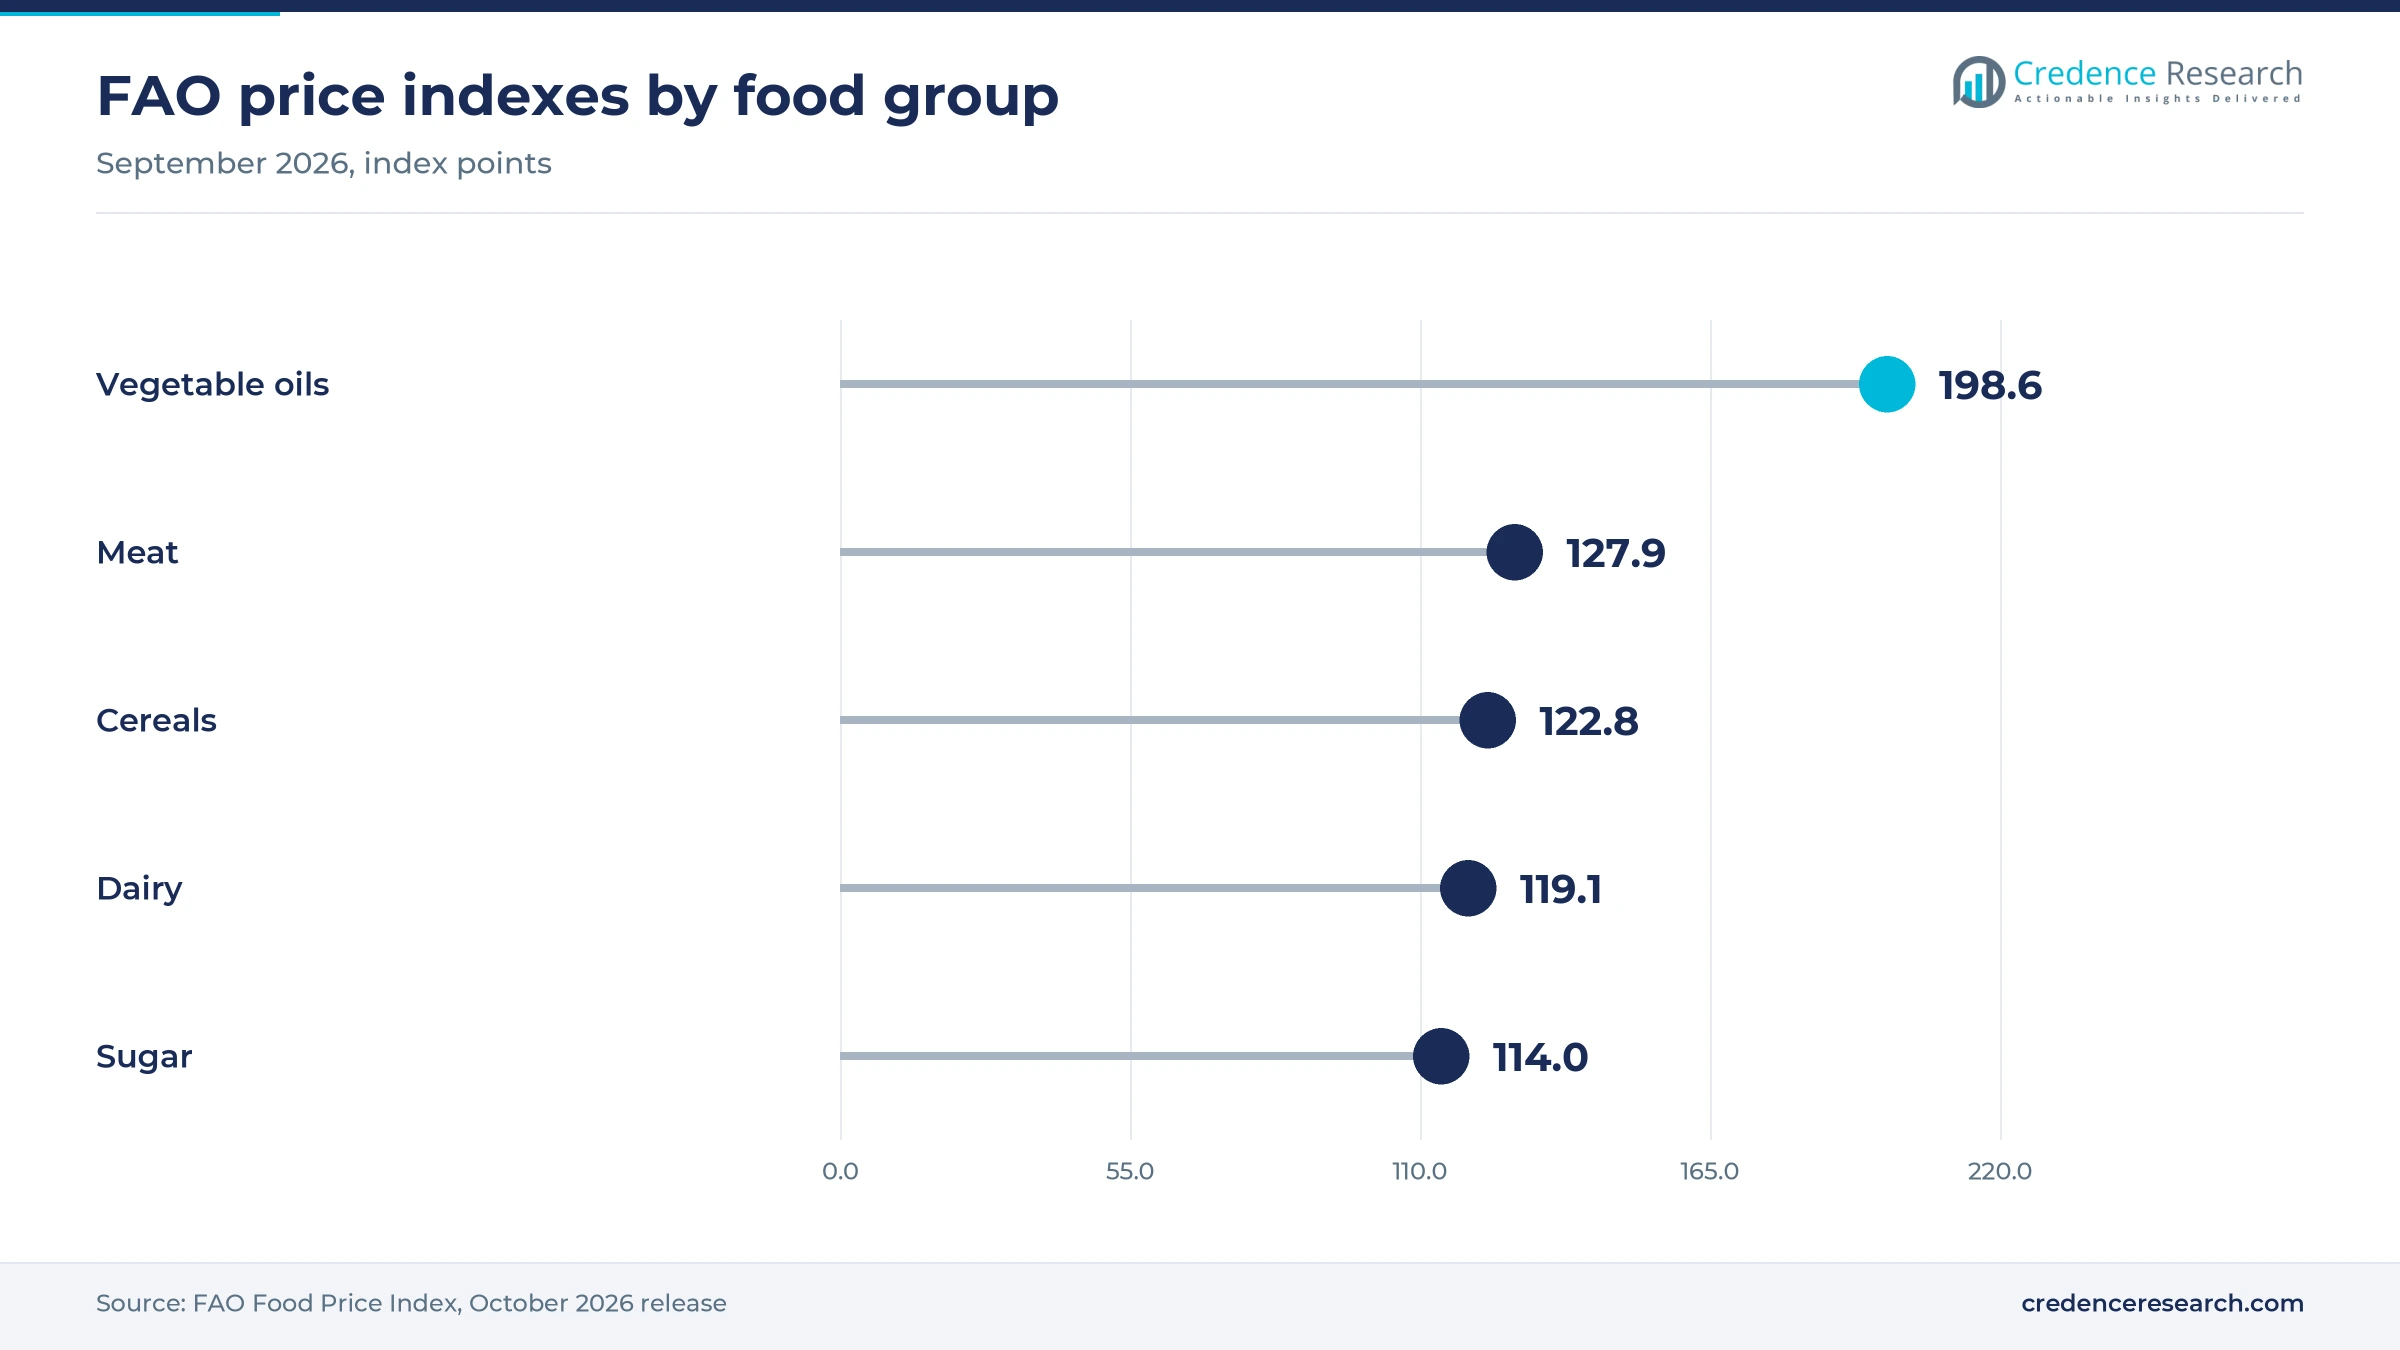
Ingredient volatility is the most immediate margin problem, because some key inputs rose sharply even while cereals eased. FAO data show vegetable oils up 17.1% and dairy up 13.2% in 2025, and the FAO vegetable oil index stood at 198.6 points in September 2026, 18.3% above a year earlier, although dairy was then 19.1% below its year-earlier level. The World Bank projected arabica coffee prices up about 50% in 2025. Bakery, snack and coffee producers are most exposed, and those lacking pricing power lose margin first. Many of them respond with hedging, smaller packs and reformulated recipes.
Dye removal deadlines force costly reformulation
Regulation is forcing costly recipe work, particularly in confectionery, bakery and colored beverages sold in the United States. The FDA revoked authorization for FD&C Red No. 3 in January 2025, with a Jan. 15, 2027, deadline for foods, and its July 2025 letter asked companies to finish sooner. Manufacturers must find stable natural colors, retest shelf life and redesign labels, which takes time and raises ingredient bills. Smaller producers carry the heaviest burden, so many rely on supplier-developed color systems to reduce the risk.
Health taxes spread across drinks and alcohol
Health taxes threaten beverage volumes and lift retail prices in many countries, and the WHO is pressing governments to raise them further. Its January 2026 reports found that at least 116 countries tax sugar-sweetened beverages and at least 167 tax alcoholic drinks. However, many high-sugar products, including 100% fruit juices, remain outside these taxes, so further rules are possible. Soft drink makers face the largest exposure, and they typically respond by reducing sugar, shrinking packs or moving into zero-sugar ranges.
EU packaging rules add paperwork and redesign costs
Packaging regulation adds cost for every exporter selling into Europe, because compliance now applies at the product level. The EU Packaging and Packaging Waste Regulation applied from Aug. 12, 2026, according to The National Law Review, and it requires a conformity assessment and an EU Declaration of Conformity. Technical files must be retained for five years for single-use formats and ten for reusable ones. Makers of soft drink packaging and their customers must therefore document materials more closely, which particularly burdens small exporters.
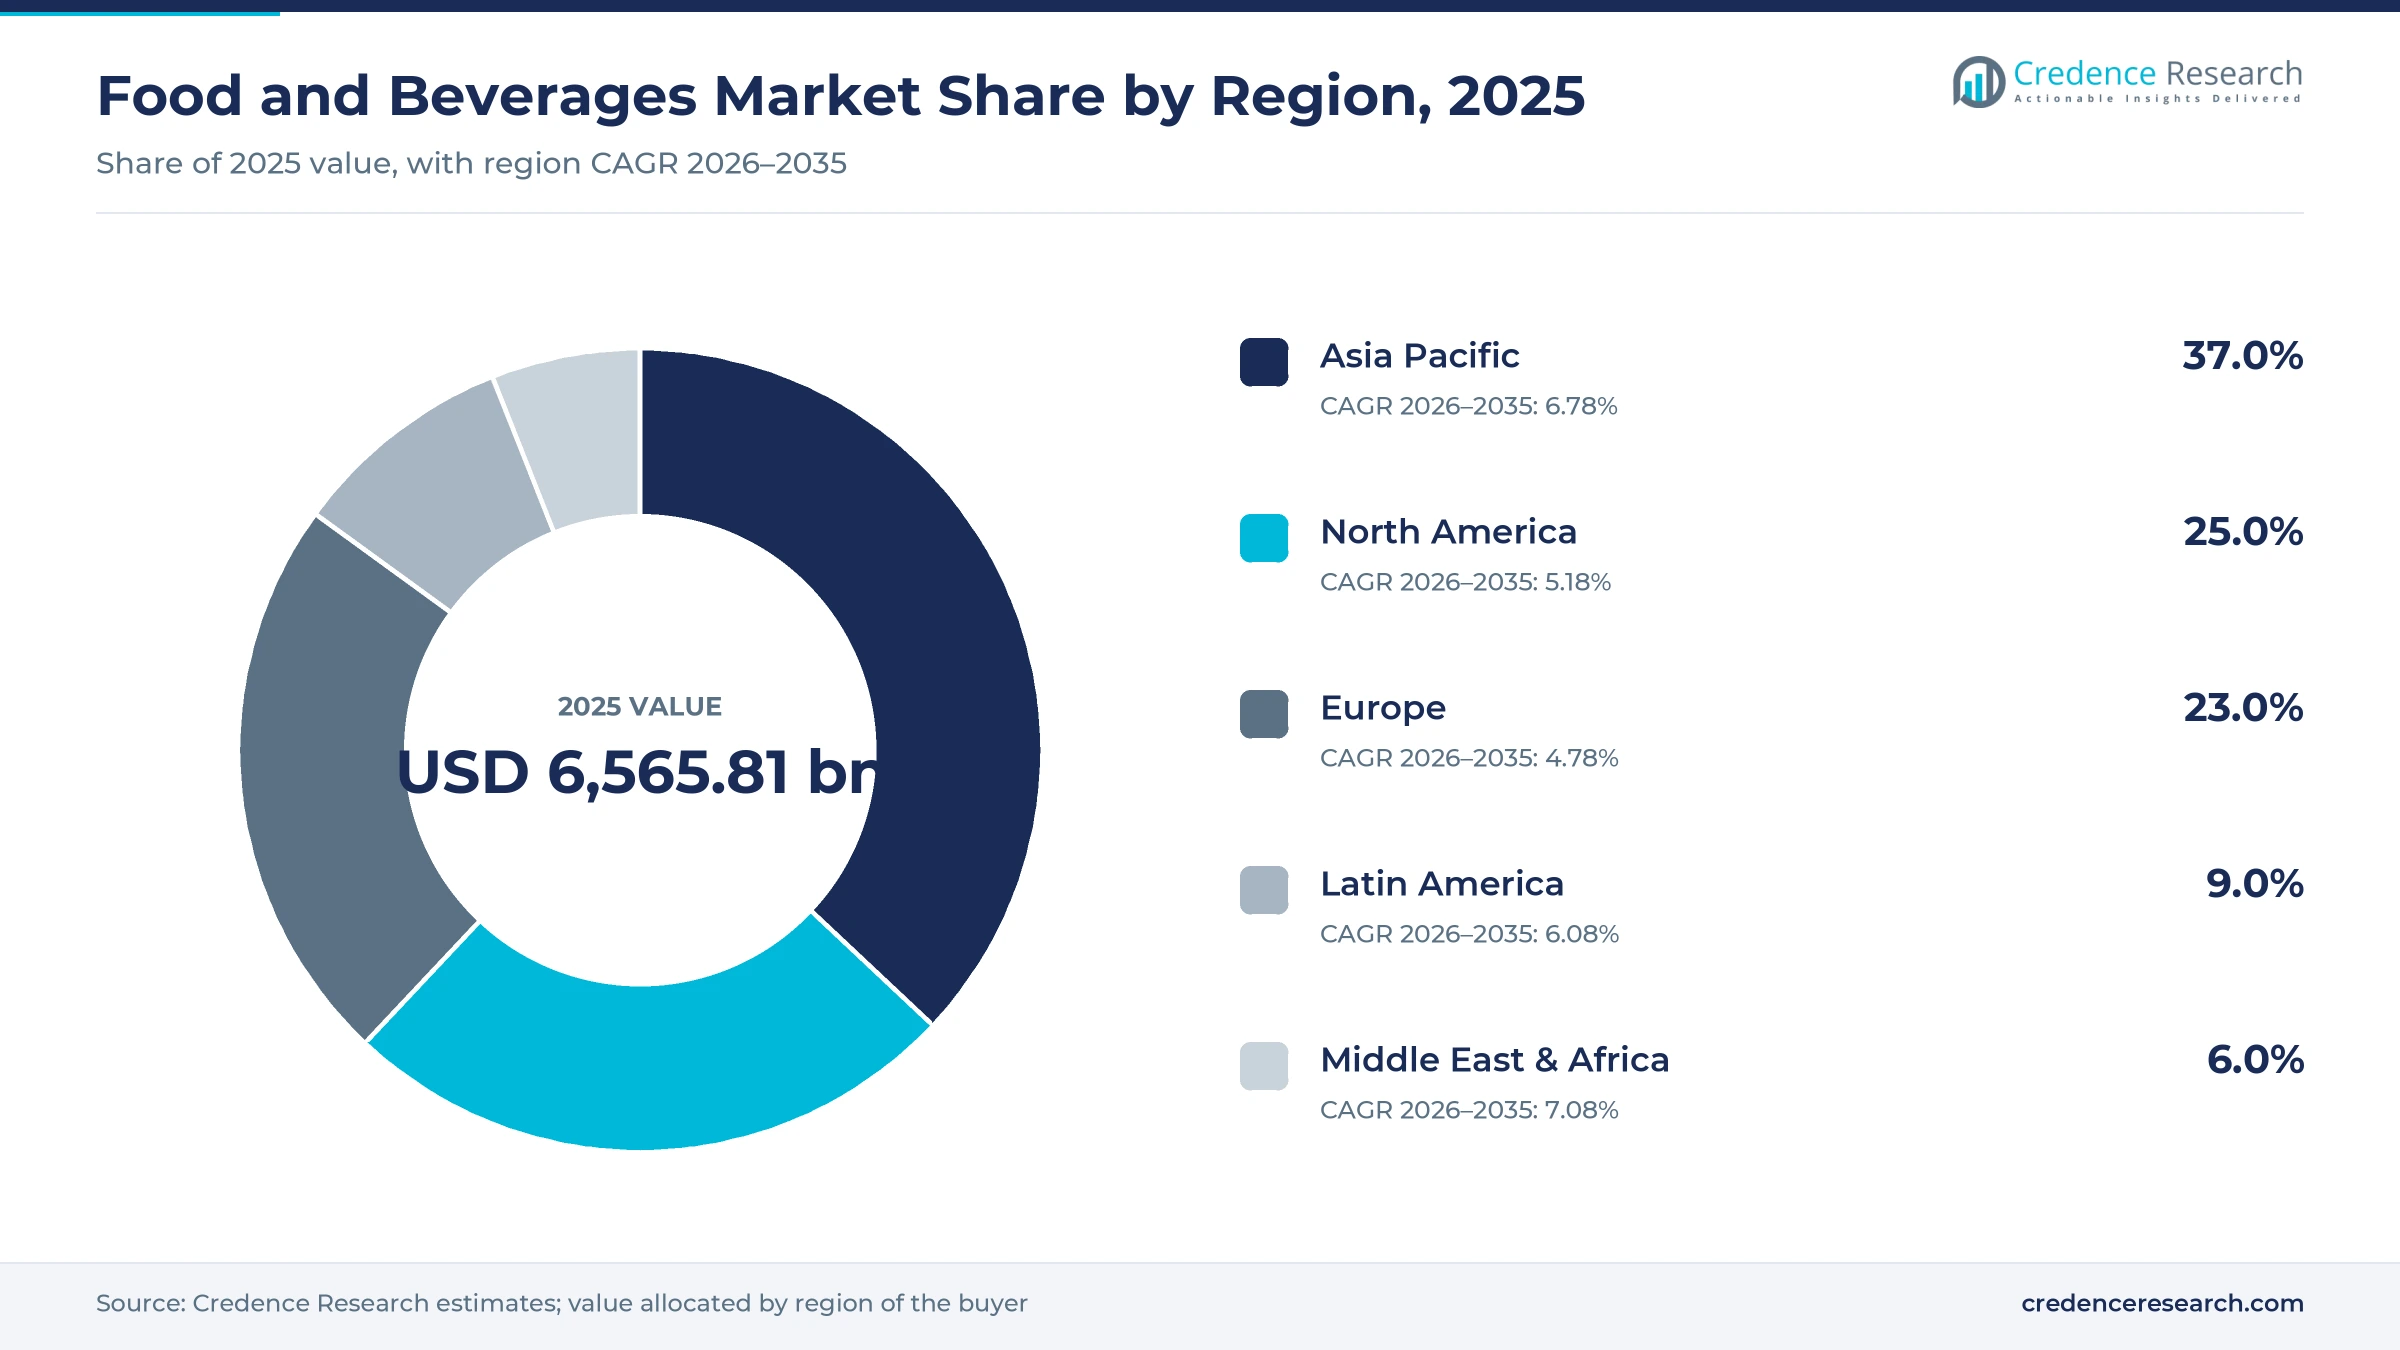
Asia Pacific leads as Middle East & Africa grows fastest
| Region | Value, 2025 (USD billion) | Share, 2025 | CAGR, 2026–2035 |
|---|---|---|---|
| Asia Pacific | 2,429.35 | 37.0% | 6.78% |
| North America | 1,641.45 | 25.0% | 5.18% |
| Europe | 1,510.14 | 23.0% | 4.78% |
| Latin America | 590.92 | 9.0% | 6.08% |
| Middle East & Africa | 393.95 | 6.0% | 7.08% |
Asia Pacific leads on China retail and India plants
Asia Pacific held 37.0% of 2025 value and grows at 6.78% a year, the largest share by a clear margin. China drives the regional total, with total retail sales of 50,120.2 billion yuan in 2025, up 3.7%, and beverage retail sales of 329.5 billion yuan, up 1.0%, according to its statistics bureau. India adds new capacity through commitments such as the PepsiCo plants in Assam and Tamil Nadu. Lower middle-income countries in the region should therefore supply much of the added volume through 2035.
North America keeps value through U.S. food spending
North America held 25.0% of 2025 value and grows at 5.18% a year, a mature rate led by mix and price. USDA Economic Research Service data, published in June 2026, put U.S. food spending at $2.51 trillion in 2025, with $1.10 trillion at home and $1.41 trillion away from home. However, Tyson Foods closed its Lexington, Nebraska, beef plant in January 2026, costing upwards of 3,000 local jobs, according to Meatingplace, after citing lower cattle supplies.
Europe stays large but grows slowest of the five
Europe held 23.0% of 2025 value and grows at 4.78% a year, the slowest rate among the five regions. FoodDrinkEurope reports €1.5 trillion in EU industry turnover, 4.8 million jobs and €190 billion in exports outside the EU, in its Data and Trends 2026 report. That turnover includes sales between companies, so it exceeds the manufacturer value counted here. Growth depends on premium, organic and private-label ranges because populations are flat, and exporters also carry new packaging compliance duties that apply across all member states.
Latin America grows on beef exports and staples
Latin America held 9.0% of 2025 value and grows at 6.08% a year, supported by protein exports and local staples. Brazil earned $18.03 billion from beef exports in 2025, up about 40.1%, with China buying 1.68 million tons, according to Abiec data. USDA data also show that food takes about 22.5% of consumer spending on average in Argentina, Colombia and Mexico, so buyers remain sensitive to price. Consequently, value packs and regional brands hold strong positions across most grocery categories in the region.
Middle East & Africa grows fastest from a small base
Middle East & Africa held 6.0% of 2025 value and grows at 7.08% a year, the fastest regional rate. USDA data show that food takes over 50% of consumer spending in Nigeria and Kenya, so packaged sales depend on affordable formats. In October 2025, Coca-Cola HBC announced the acquisition of 75% of Coca-Cola Beverages Africa, which operates in 14 countries. However, SOFI 2025 counted about 307 million Africans facing hunger in 2024, which limits how quickly packaged spending can spread.
Megadeals and new plants redraw the industry map
| Development | Status and market relevance |
|---|---|
| In December 2025, Mars finalized its $36 billion acquisition of Kellanova, adding Pringles, Cheez-It and Kellogg's brands, according to Consumer Goods Technology. | Completed; creates a larger global snacking group |
| In December 2025, Unilever completed the demerger of The Magnum Ice Cream Company, listed in Amsterdam, London and New York, according to FoodBev Media. | Completed; narrows Unilever's food portfolio |
| In February 2026, Kraft Heinz paused its planned split into two companies and committed $600 million to marketing and research, according to RTÉ. | Separation paused under new chief executive Steve Cahillane |
| In April 2026, Keurig Dr Pepper held 96.22% of JDE Peet's after its $18 billion offer, according to FoodNavigator. | Completed; a split into beverage and coffee companies is planned |
| In May 2026, PepsiCo announced up to Rs 5,700 crore of Indian investment by 2030, covering concentrates and snacks plants, according to PotatoPro. | Planned; adds capacity in three Indian states |
Reformulation and retail data change how products sell
- Natural color systems replace synthetic dyes in candy, bakery and drinks, and the FDA has asked manufacturers to complete Red No. 3 work before the 2027 deadline.
- Retail sales data now tracks online and in-store baskets together, which matters because nearly 94% of U.S. grocery shoppers used both routes in 2025.
- Frozen supply chains support ranges that shoppers use to limit waste, and that benefit was cited by 37% of shoppers in the 2026 AFFI and FMI study.
- Portion and protein redesign responds to GLP-1 use, because treated households bought 11% fewer savory snacks in the Cornell University study.
Need a Custom Version of This Report?
Tailor the scope, geography, or segments to your exact requirements.
- Custom geography or segment scope
- Direct access to our analyst team
Global groups narrow portfolios around stronger brands
Competition in the food and beverages market centers on brand strength, retail access and the scale needed to absorb volatile input costs. Large groups are simplifying rather than simply expanding, and FoodBev Media reports that Nestlé intends to cut its brands from over 400 to about 150. Unilever has already separated ice cream and agreed to sell its food business to McCormick for $15.7 billion, a deal expected to close by mid-2027 at the latest, according to FoodNavigator. Coca-Cola is reducing direct bottling exposure in Africa, while Keurig Dr Pepper and Mars are buying scale in coffee and snacks. Tyson Foods faces a different problem, since its U.S. beef business depends on a cattle herd at a 70-year low, according to Fox Business. Consequently, buyers should expect fewer but stronger global brands, with regional producers competing on price and local tastes.
Companies profiled and their roles in this market
| Company | Type | Role in the market |
|---|---|---|
| Nestlé S.A. | Diversified food group | Fuel for Growth program aims to reduce brands from over 400 to about 150 |
| PepsiCo, Inc. | Snacks and beverages | Bought Poppi and plans Indian snacks and concentrates plants through 2030 |
| The Coca-Cola Company | Beverages | Selling a controlling stake in Coca-Cola Beverages Africa to Coca-Cola HBC |
| Unilever | Consumer goods and foods | Demerged ice cream and agreed to sell its food business to McCormick |
| Danone S.A. | Dairy and nutrition | Buying MADE Group and full ownership of its Australian yogurt venture |
| Tyson Foods, Inc. | Meat and poultry | Closed its Lexington, Nebraska, beef plant in January 2026 as cattle supplies fell |
| Mars, Inc. | Snacks and confectionery | Owner of Kellanova brands including Pringles and Cheez-It since December 2025 |
| The Kraft Heinz Company | Packaged food | Paused its separation and funded a $600 million U.S. recovery plan |
| Keurig Dr Pepper | Coffee and soft drinks | Acquired JDE Peet's and plans two separately listed companies |
| Ferrero Group | Confectionery and cereals | Completed the $3.1 billion purchase of WK Kellogg Co |
Growth depends on mix and volume more than on pricing
Credence Research's view is that the food and beverages market now grows through mix and emerging-market volume rather than through broad price increases. Mature regions face flat populations, health taxes and GLP-1 use, while China and India still add retail spending and plants. Winners should be groups with strong protein, frozen and non-alcoholic ranges, plus enough scale to absorb oil and dairy swings. Companies that rely on highly processed snacks or synthetic colors have the most recipe work ahead. The most assumption-heavy estimate here is the type split, because official statistics rarely report manufacturer value by category across all countries.
How Credence Research sized this global market
The report uses 2025 as the base year and 2035 as the forecast year. Market values come from the Credence Research model, with the earlier 2024 estimate carried to 2025 at its own growth rate and compared with a top-down check of food spending and industry turnover statistics. Regional and segment splits are Credence Research estimates drawn from public data published by FAO, OECD, USDA, the China National Bureau of Statistics, WHO, FiBL, trade associations and company announcements. No interviews or surveys were conducted for this edition of the report.
Emerging-market volumes drive the path to 2035
The food and beverages market is expected to reach USD 11,647.91 billion by 2035, growing at 5.90% a year over 2026–2035. Food and beverage industry growth should come mainly from Asia Pacific and Africa, where protein and packaged staples still have room to expand. However, the path depends on oil, dairy and coffee costs, and FAO's overall index stood at 136.0 points in September 2026, above its 2025 average. Further health taxes and tighter ingredient rules could also slow volumes in mature regions, so product mix should matter more than price over the decade.
Frequently Asked Questions
How big is the food and beverage market?
How large is the U.S. food and beverage market?
What is the food and beverage industry growth rate?
What are the key food and beverage industry statistics?
What does beverage market analysis show for 2026?
What are the main food and beverage market trends?
Which region leads the food and beverage market?
Who are the key players in the food and beverage market?
Table of Content
Chapter 1 Market Segmentation
- 1.1 Segmentation Framework
- 1.1.1 Product and Service Classification
- 1.1.2 Application and End-Use Classification
- 1.1.3 Technology and Solution Classification
- 1.1.4 Customer and Distribution Channel Classification
- 1.1.5 Geographic Segmentation
- 1.1.6 Market Segment Definitions and Boundaries
- 1.2 By Type
- 1.2.1 Meat, Poultry and Seafood
- 1.2.2 Bakery & Confectionery
- 1.2.3 Non-alcoholic Beverages
- 1.2.4 Dairy Food
- 1.2.5 Alcoholic Beverages
- 1.2.6 Frozen, Canned and Dried Food
- 1.2.7 Others
- 1.3 By Nature
- 1.3.1 Conventional
- 1.3.2 Organic
Chapter 2 Introduction
- 2.1 Report Objectives and Scope
- 2.2 Product Definition and Industry Terminology
- 2.3 Market Inclusions and Exclusions
- 2.4 Research Process
- 2.4.1 Primary Research and Expert Interviews
- 2.4.2 Secondary Research and Source Review
- 2.4.3 Top-Down and Bottom-Up Estimation
- 2.4.4 Data Triangulation and Verification
- 2.5 Market Size Measurement Basis
- 2.5.1 2025: USD 6,565.81 billion → 2035: USD 11,647.91 billion
- 2.6 Historical and Forecast Reference Periods
- 2.6.1 Historical Period: 2018-2025
- 2.6.2 Base Year: 2025
- 2.6.3 Forecast Period: 2025-2035
- 2.7 Research Assumptions and Limitations
Chapter 3 Executive Summary
- 3.1 Market Snapshot and Key Findings
- 3.2 Base-Year Market Size, 2025
- 3.3 Forecast Market Size, 2035
- 3.4 Revenue and Volume Growth Outlook
- 3.5 Key Demand and Supply Indicators
- 3.6 Leading Market Segments
- 3.7 Fastest-Growing Market Opportunities
- 3.8 Regional Performance Highlights
- 3.9 Technology and Industry Transformation
- 3.10 Competitive Landscape Summary
- 3.11 Analyst View and Strategic Implications
Chapter 4 Global Food and Beverages Market Trends and Developments
- 4.1 Historical Industry Development, 2018-2025
- 4.2 Recent Market Trends and Developments
- 4.3 Demand and Customer Behavior Trends
- 4.4 Technology and Product Innovation
- 4.5 Artificial Intelligence, Automation and Digitalization
- 4.6 Local Manufacturing and Supply Chain Realignment
- 4.7 Industry Partnerships, Mergers and Acquisitions
- 4.8 Sustainability and Circular Economy Developments
- 4.9 Government and Private Sector Investment Trends
- 4.10 Emerging Business Models and Commercialization
- 4.11 Industry Developments and Announcements
Chapter 5 Global Food and Beverages Market Production, Supply and Demand Analysis
- 5.1 Demand Trend and Consumption Analysis, 2018-2025
- 5.2 Demand Forecast, 2025-2035
- 5.3 Production and Output Trend, 2018-2025
- 5.4 Production and Output Forecast, 2025-2035
- 5.5 Installed Capacity and Capacity Utilization
- 5.6 Company-Wise Production Plants and Statistics
- 5.6.1 Installed Production Capacity
- 5.6.2 Actual Production
- 5.6.3 Planned Capacity and Expansion Targets
- 5.7 Supply Chain Structure and Procurement Trends
- 5.8 Supply-Demand Gap and Bottlenecks
- 5.9 Import Dependence and Sourcing Structure
- 5.10 Contract Manufacturing and Outsourcing
- 5.11 Regional Supply and Demand Concentration
Chapter 6 Global Food and Beverages Market Pricing Analysis
- 6.1 Pricing Structure and Measurement
- 6.2 Historical Pricing Trends, 2018-2025
- 6.3 Pricing Outlook, 2025-2035
- 6.4 Average Selling Price and Unit Economics
- 6.5 Pricing by Product and Market Segment
- 6.6 Geographic Pricing Differences
- 6.7 Key Input, Energy, Labor and Logistics Costs
- 6.8 Contract Pricing and Purchasing Models
- 6.9 Pricing Sensitivity and Competitive Positioning
- 6.10 Price, Margin and Profitability Implications
Chapter 7 Global Food and Beverages Market Dynamics
- 7.1 Market Growth Drivers
- 7.1.1 Demand-Side Drivers
- 7.1.2 Technology and Innovation Drivers
- 7.1.3 Infrastructure and Investment Drivers
- 7.1.4 Regulatory and Policy Drivers
- 7.2 Market Restraints
- 7.2.1 Cost and Affordability Constraints
- 7.2.2 Technology and Adoption Barriers
- 7.2.3 Supply Chain and Operational Constraints
- 7.3 Market Challenges
- 7.3.1 Competitive Pressure and Margin Erosion
- 7.3.2 Skills, Infrastructure and Implementation Gaps
- 7.4 Emerging Market Opportunities
- 7.5 Market Dynamics Impact and Time-Horizon Assessment
Chapter 8 Global Food and Beverages Value Chain Analysis
- 8.1 Industry Value Chain Overview
- 8.2 Upstream Suppliers and Critical Inputs
- 8.3 Technology and Component Providers
- 8.4 Manufacturing or Service Delivery
- 8.5 Distribution, Channel Partners and Integrators
- 8.6 Downstream Applications and End Users
- 8.7 Value Addition and Profit Pools
- 8.8 Vertical Integration and Outsourcing
- 8.9 Supplier Concentration and Risk
- 8.10 Supply Chain Localization and Resilience
Chapter 9 Global Food and Beverages Market Regulations and Policies
- 9.1 Relevant Laws, Standards and Compliance Frameworks
- 9.2 Product, Service, Safety and Quality Requirements
- 9.3 Government Policies, Incentives and Subsidies
- 9.4 Imports, Exports and Trade Barriers
- 9.5 Public Procurement and Local Content Requirements
- 9.6 Environmental and Sustainability Compliance
- 9.7 Upcoming Policy Changes and Market Implications
Chapter 10 Global Food and Beverages Market Hotspots and Opportunities
- 10.1 Market Opportunity Mapping and Growth Hotspots
- 10.2 High-Growth Applications and Customer Groups
- 10.3 Underserved Markets and White-Space Opportunities
- 10.4 Emerging Technology and Product Opportunities
- 10.5 New Capacity and Investment Hotspots
- 10.6 Market Entry and Expansion Opportunities
- 10.7 Distribution and Partnership Opportunities
- 10.8 Near-Term and Long-Term Commercial Potential
- 10.9 Opportunity Attractiveness and Execution Risks
Chapter 11 Global Food and Beverages Market Outlook, 2025-2035
- 11.1 Market Size and Analysis
- 11.1.1 Revenue (Market Measurement: 2025: USD 6,565.81 billion → 2035: USD 11,647.91 billion)
- 11.1.2 Market Volume and Quantity Sold
- 11.1.3 Historical Market Size, 2018-2025
- 11.1.4 Base-Year Market Size, 2025
- 11.2 Market Forecast, 2025-2035
- 11.2.1 Revenue Forecast to 2035
- 11.2.2 Volume Forecast to 2035
- 11.2.3 CAGR and Year-on-Year Growth
- 11.2.4 Incremental Revenue Opportunity
- 11.3 Forecast Assumptions and Scenario Analysis
- 11.3.1 Base-Case Forecast
- 11.3.2 Optimistic and Conservative Scenarios
- 11.3.3 Technology, Pricing and Policy Sensitivities
- 11.4 Market Attractiveness and Growth Outlook
Chapter 12 Global Food and Beverages Market Segmentation and Outlook
- 12.1 Segmentation Summary and Market Shares, 2025
- 12.2 Largest and Fastest-Growing Segments
- 12.3 By Type - Market Size and Forecast, 2025-2035
- 12.3.1 Segment Definition and Scope
- 12.3.2 Historical Market Size, 2018-2025
- 12.3.3 Revenue Forecast, 2025-2035
- 12.3.4 Volume Forecast, 2025-2035
- 12.3.5 Base-Year Market Share, 2025
- 12.3.6 Segment CAGR and Growth Drivers
- 12.3.7 Subsegment Market Size and Forecast
- 12.3.7.1 Meat, Poultry and Seafood
- 12.3.7.2 Bakery & Confectionery
- 12.3.7.3 Non-alcoholic Beverages
- 12.3.7.4 Dairy Food
- 12.3.7.5 Alcoholic Beverages
- 12.3.7.6 Frozen, Canned and Dried Food
- 12.3.7.7 Others
- 12.3.8 Subsegment Pricing and Adoption Trends
- 12.3.9 Leading Suppliers and Competition
- 12.3.10 Regional Demand and Opportunities
- 12.4 By Nature - Market Size and Forecast, 2025-2035
- 12.4.1 Segment Definition and Scope
- 12.4.2 Historical Market Size, 2018-2025
- 12.4.3 Revenue Forecast, 2025-2035
- 12.4.4 Volume Forecast, 2025-2035
- 12.4.5 Base-Year Market Share, 2025
- 12.4.6 Segment CAGR and Growth Drivers
- 12.4.7 Subsegment Market Size and Forecast
- 12.4.7.1 Conventional
- 12.4.7.2 Organic
- 12.4.8 Subsegment Pricing and Adoption Trends
- 12.4.9 Leading Suppliers and Competition
- 12.4.10 Regional Demand and Opportunities
- 12.5 Segment Growth Comparison
- 12.6 Segment Attractiveness and Priority Matrix
Chapter 13 Global Food and Beverages Geographic Market Outlook, 2025-2035
- 13.1 Regional Market Size and Share, 2025
- 13.2 Regional Market Forecast, 2025-2035
- 13.3 Regional Pricing, Production and Demand Differences
- 13.4 North America
- 13.4.1 United States
- 13.4.2 Canada
- 13.4.3 Mexico
- 13.5 Europe
- 13.5.1 Germany
- 13.5.2 France
- 13.5.3 Italy
- 13.5.4 United Kingdom
- 13.5.5 Spain
- 13.5.6 Poland
- 13.5.7 Russia
- 13.5.8 Netherlands
- 13.5.9 Belgium
- 13.5.10 Sweden
- 13.5.11 Denmark
- 13.5.12 Norway
- 13.5.13 Rest of Europe
- 13.6 Asia Pacific
- 13.6.1 China
- 13.6.2 India
- 13.6.3 Japan
- 13.6.4 South Korea
- 13.6.5 Thailand
- 13.6.6 Indonesia
- 13.6.7 Vietnam
- 13.6.8 Malaysia
- 13.6.9 Australia
- 13.6.10 Rest of Asia Pacific
- 13.7 Latin America
- 13.7.1 Brazil
- 13.7.2 Argentina
- 13.7.3 Colombia
- 13.7.4 Chile
- 13.7.5 Rest of Latin America
- 13.8 Middle East
- 13.8.1 Saudi Arabia
- 13.8.2 United Arab Emirates
- 13.8.3 Turkey
- 13.8.4 Israel
- 13.8.5 Iran
- 13.8.6 Rest of the Middle East
- 13.9 Africa
- 13.9.1 South Africa
- 13.9.2 Egypt
- 13.9.3 Nigeria
- 13.9.4 Morocco
- 13.9.5 Rest of Africa
- 13.10 Regional Investment, Policy and Supply Chain Differences
- 13.11 Regional Competitive Landscape
- 13.12 Geographic Growth Hotspots
Chapter 14 Global Food and Beverages Technology, Innovation and Sustainability Outlook
- 14.1 Technology Landscape and Maturity
- 14.2 Product, Process and Service Innovation
- 14.3 AI, Automation and Digital Tools in the Industry
- 14.4 Technology Adoption and Performance Benchmarking
- 14.5 Innovation Pipeline and R&D Investment
- 14.6 Patent and Intellectual Property Trends
- 14.7 Energy Efficiency and Resource Management
- 14.8 Sustainability, Recycling and Circularity
- 14.9 Technology Roadmap, 2025-2035
- 14.10 Risks of Obsolescence and Technology Substitution
Chapter 15 Global Food and Beverages Market Key Strategic Imperatives
- 15.1 Growth and Market Entry Priorities
- 15.2 High-Return Products and Segments
- 15.3 Pricing, Profitability and Cost Optimization
- 15.4 Technology Investment and Product Differentiation
- 15.5 Supply Chain Localization and Resilience
- 15.6 Distribution and Customer Acquisition
- 15.7 Partnership, Acquisition and Capacity Strategy
- 15.8 Regional Expansion Priorities
- 15.9 Short-, Medium- and Long-Term Actions
Chapter 16 Competition Outlook
- 16.1 Industry Competition Characteristics
- 16.2 Market Structure and Concentration
- 16.3 Market Share and Competitive Positioning, 2025
- 16.4 Company-Wise Revenue and Product Benchmarking
- 16.5 Production and Service Capacity Benchmarking
- 16.6 Technology, Pricing and Differentiation
- 16.7 Regional Footprint and Distribution Strength
- 16.8 Mergers, Acquisitions and Strategic Alliances
- 16.9 New Entrants and Competitive Threats
- 16.10 Porter's Five Forces and Industry Attractiveness
- 16.11 Competitive Outlook, 2025-2035
Chapter 17 Company Profiles
- 17.1 Company Coverage and Selection Criteria
- 17.2 Nestlé S.A.
- 17.2.1 Business Description
- 17.2.2 Company Ownership and Geographic Presence
- 17.2.3 Product and Service Portfolio
- 17.2.4 Manufacturing and Operating Footprint
- 17.2.5 Production Capacity and Expansion Plans
- 17.2.6 Financial Performance and Investment
- 17.2.7 Market Share and Competitive Position
- 17.2.8 Technology and Innovation Capabilities
- 17.2.9 Strategic Alliances or Partnerships
- 17.2.10 Recent Developments
- 17.2.11 Growth Strategy and Outlook
- 17.3 PepsiCo, Inc.
- 17.4 The Coca-Cola Company
- 17.5 Unilever
- 17.6 Danone S.A.
- 17.7 Tyson Foods, Inc.
- 17.8 Mars, Inc.
- 17.9 The Kraft Heinz Company
- 17.10 Keurig Dr Pepper
- 17.11 Ferrero Group
- 17.12 Other Relevant Market Participants
Note: Every listed company is profiled on the structure shown under the first company. The company list is preliminary and may change based on research findings, market developments, data availability and client requirements.
Chapter 18 Disclaimer
- 18.1 Research and Forecast Disclaimer
- 18.2 Data Source and Estimation Limitations
Note: The depth of individual sections depends on data availability for this market. Volume, capacity, trade and other unit-based metrics are included where applicable.

