Store fees on game sales, not total player spending
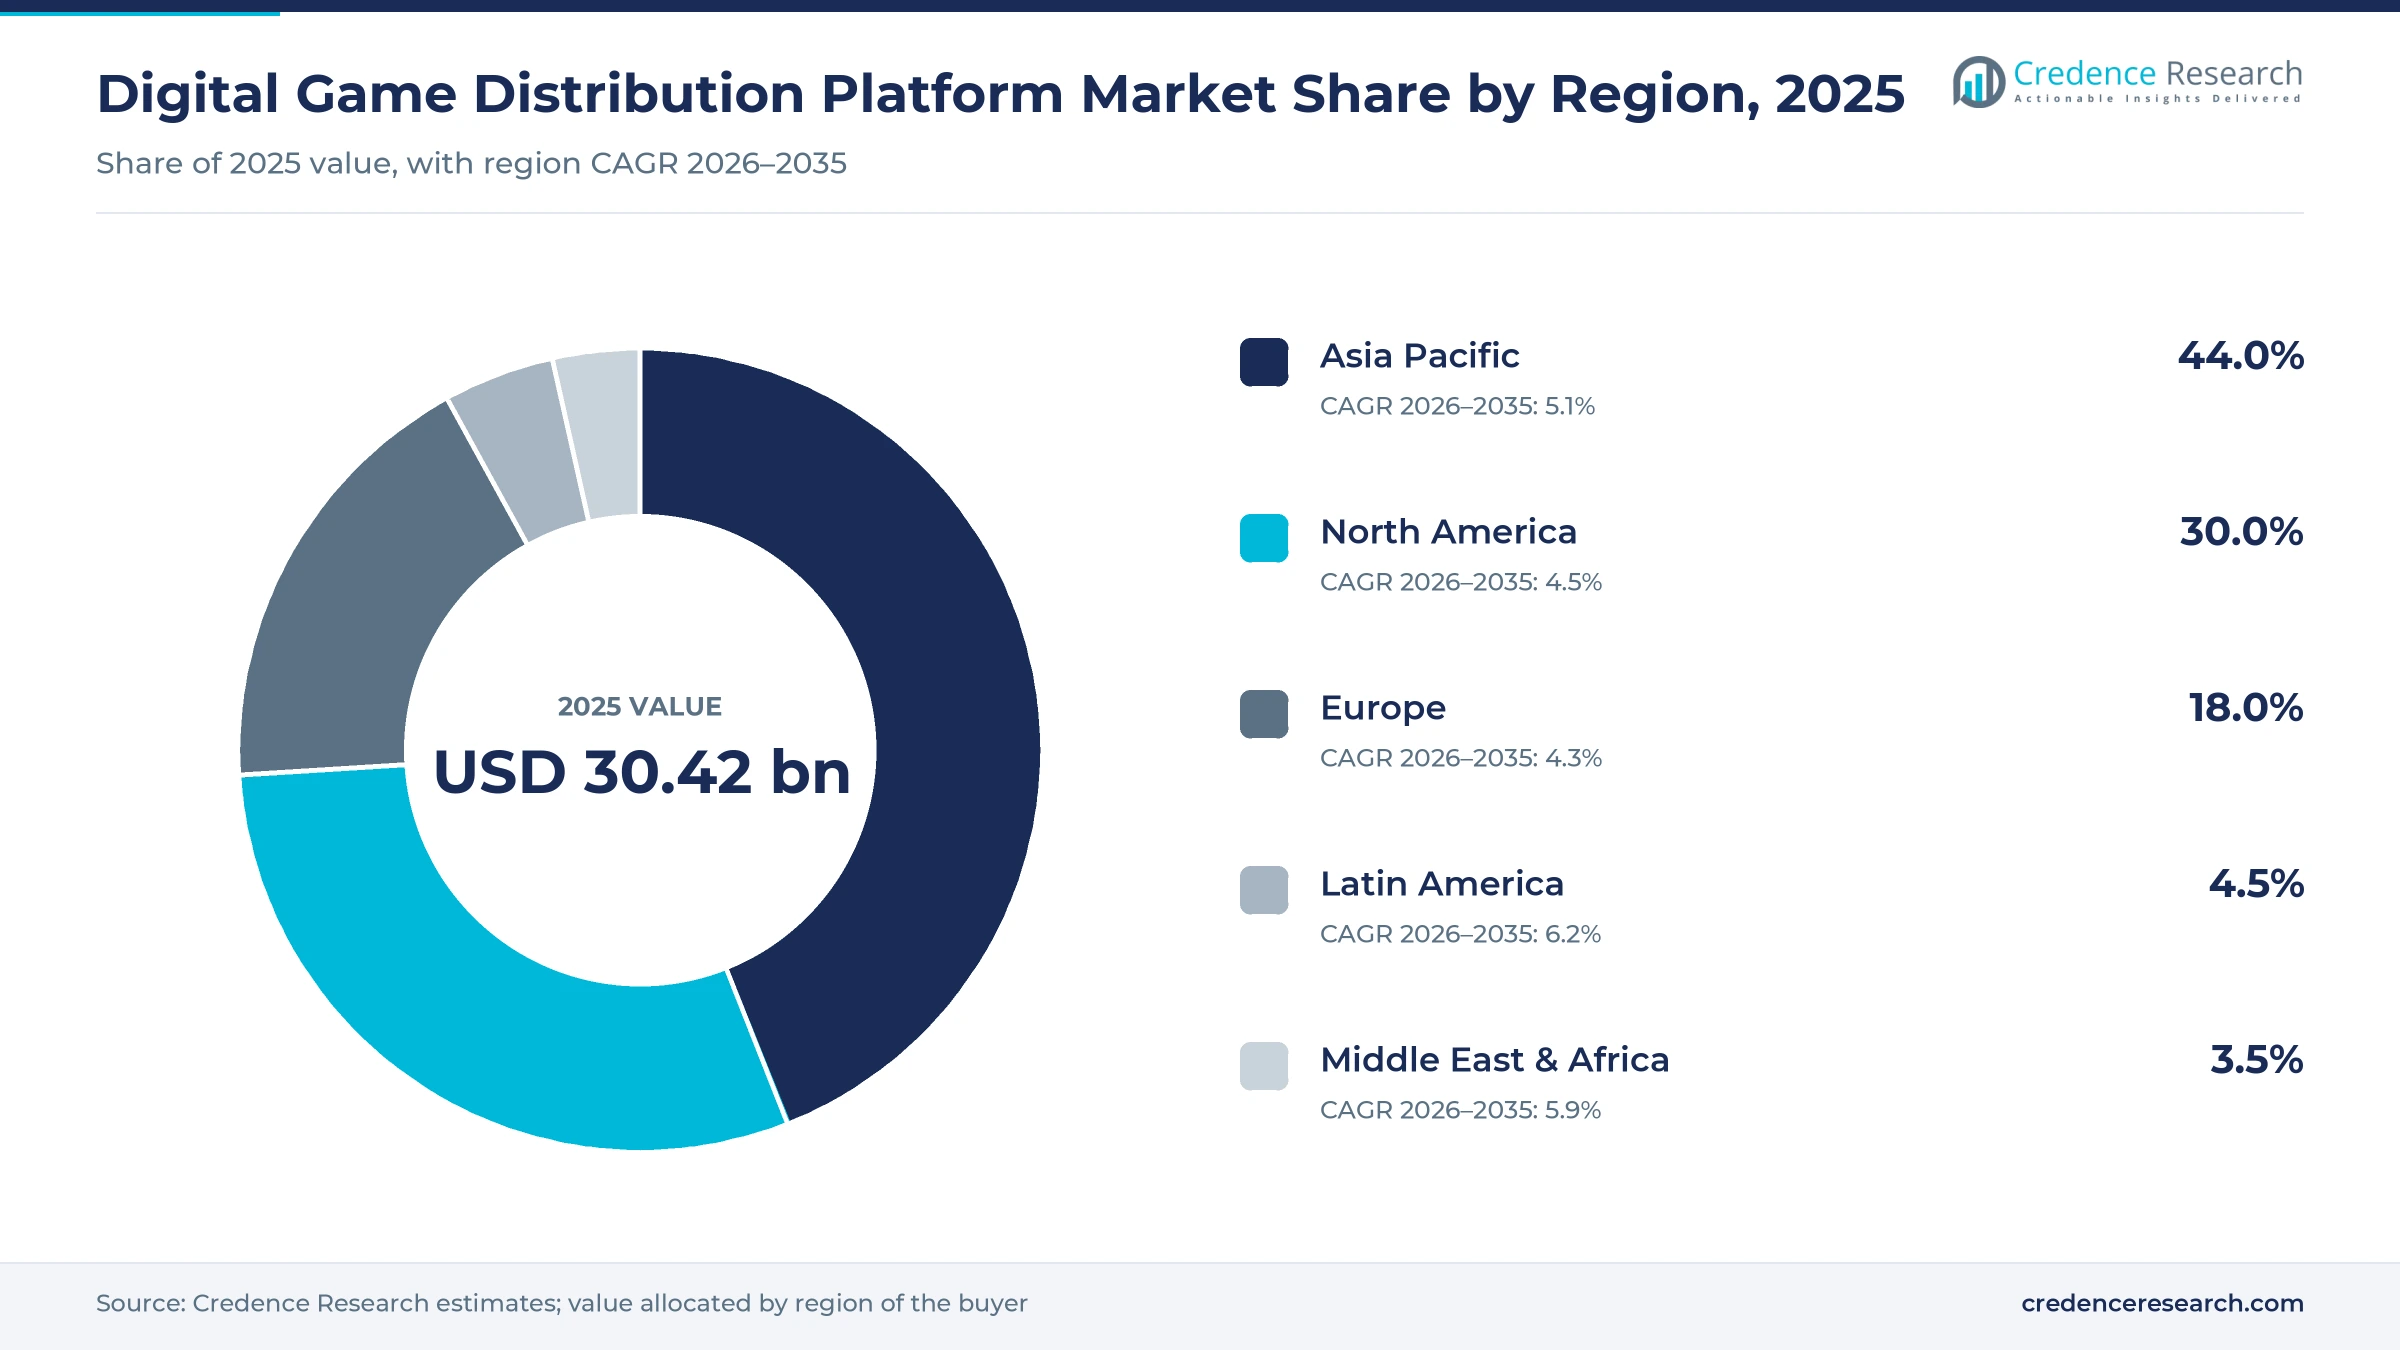
The global digital game distribution platform market was valued at USD 30.42 billion in 2025 and is projected to increase from USD 31.90 billion in 2026 to USD 48.85 billion by 2035, registering a CAGR of 4.85% during 2026–2035. Revenue is the commission or platform fee that storefront operators keep when players buy third-party games, add-ons and in-game currency through mobile app stores, console stores and PC launchers, plus the part of subscription income they retain after paying outside publishers. Asia Pacific held the largest regional share, 44.0% in 2025, because China, Japan and South Korea combine very large mobile audiences with frequent in-game purchases. Latin America is the fastest-growing region at 6.2% a year, from a small base of paying players. The most important commercial change is fee compression, since court rulings in the United States and new rules in the EU and Japan now let developers route payments around the default store. Operators that earn their fee through reach and service rather than control of the only store are best placed to keep their margins.
Store-retained fees define the value, not consumer spending
The market counts the revenue that operators of game storefronts retain from transactions, which is the commission on premium game sales, add-ons and in-game purchases plus the part of subscription income retained after paying outside publishers. It covers mobile app stores such as the Apple App Store and Google Play, console stores run by Sony, Microsoft and Nintendo, and PC storefronts such as Steam, the Epic Games Store and GOG. Consumer spending on games is several times larger, because developers and publishers keep most of each sale, typically 70% to 88%.
Sales of a store owner's own titles, such as Sony first-party games on the PlayStation Store or Valve games on Steam, are excluded, as are physical retail sales, gray-market key resale and hardware, so publisher-owned stores count only the fees they earn on other companies' games. The value chain runs from developers and publishers through payment processing, content delivery and storefront curation to the player, and each store operator's margin depends on how much of that chain it controls.
Digital Game Distribution Platform Market Insights
- The digital game distribution platform market was valued at USD 30.42 billion in 2025 and reaches USD 48.85 billion by 2035 at a 4.85% CAGR.
- Asia Pacific held 44.0% of 2025 value, because China alone reported 683 million players and record domestic game sales revenue in 2025.
- Mobile stores held 65.5% of 2025 value, because in-game purchases on phones generate the largest pool of fee-bearing transactions in the industry.
- Valve said it paid out 76% of revenue across non-Valve games on Steam in 2025, which implies an effective store fee of about 24%.
- Fee caps are spreading, as Google set a 20% standard Play Store rate and 10% on subscriptions in March 2026, rolling out worldwide by Sept. 30, 2027.
Mobile stores lead while PC storefronts grow fastest
Phones generate the most fees while PC stores add fastest
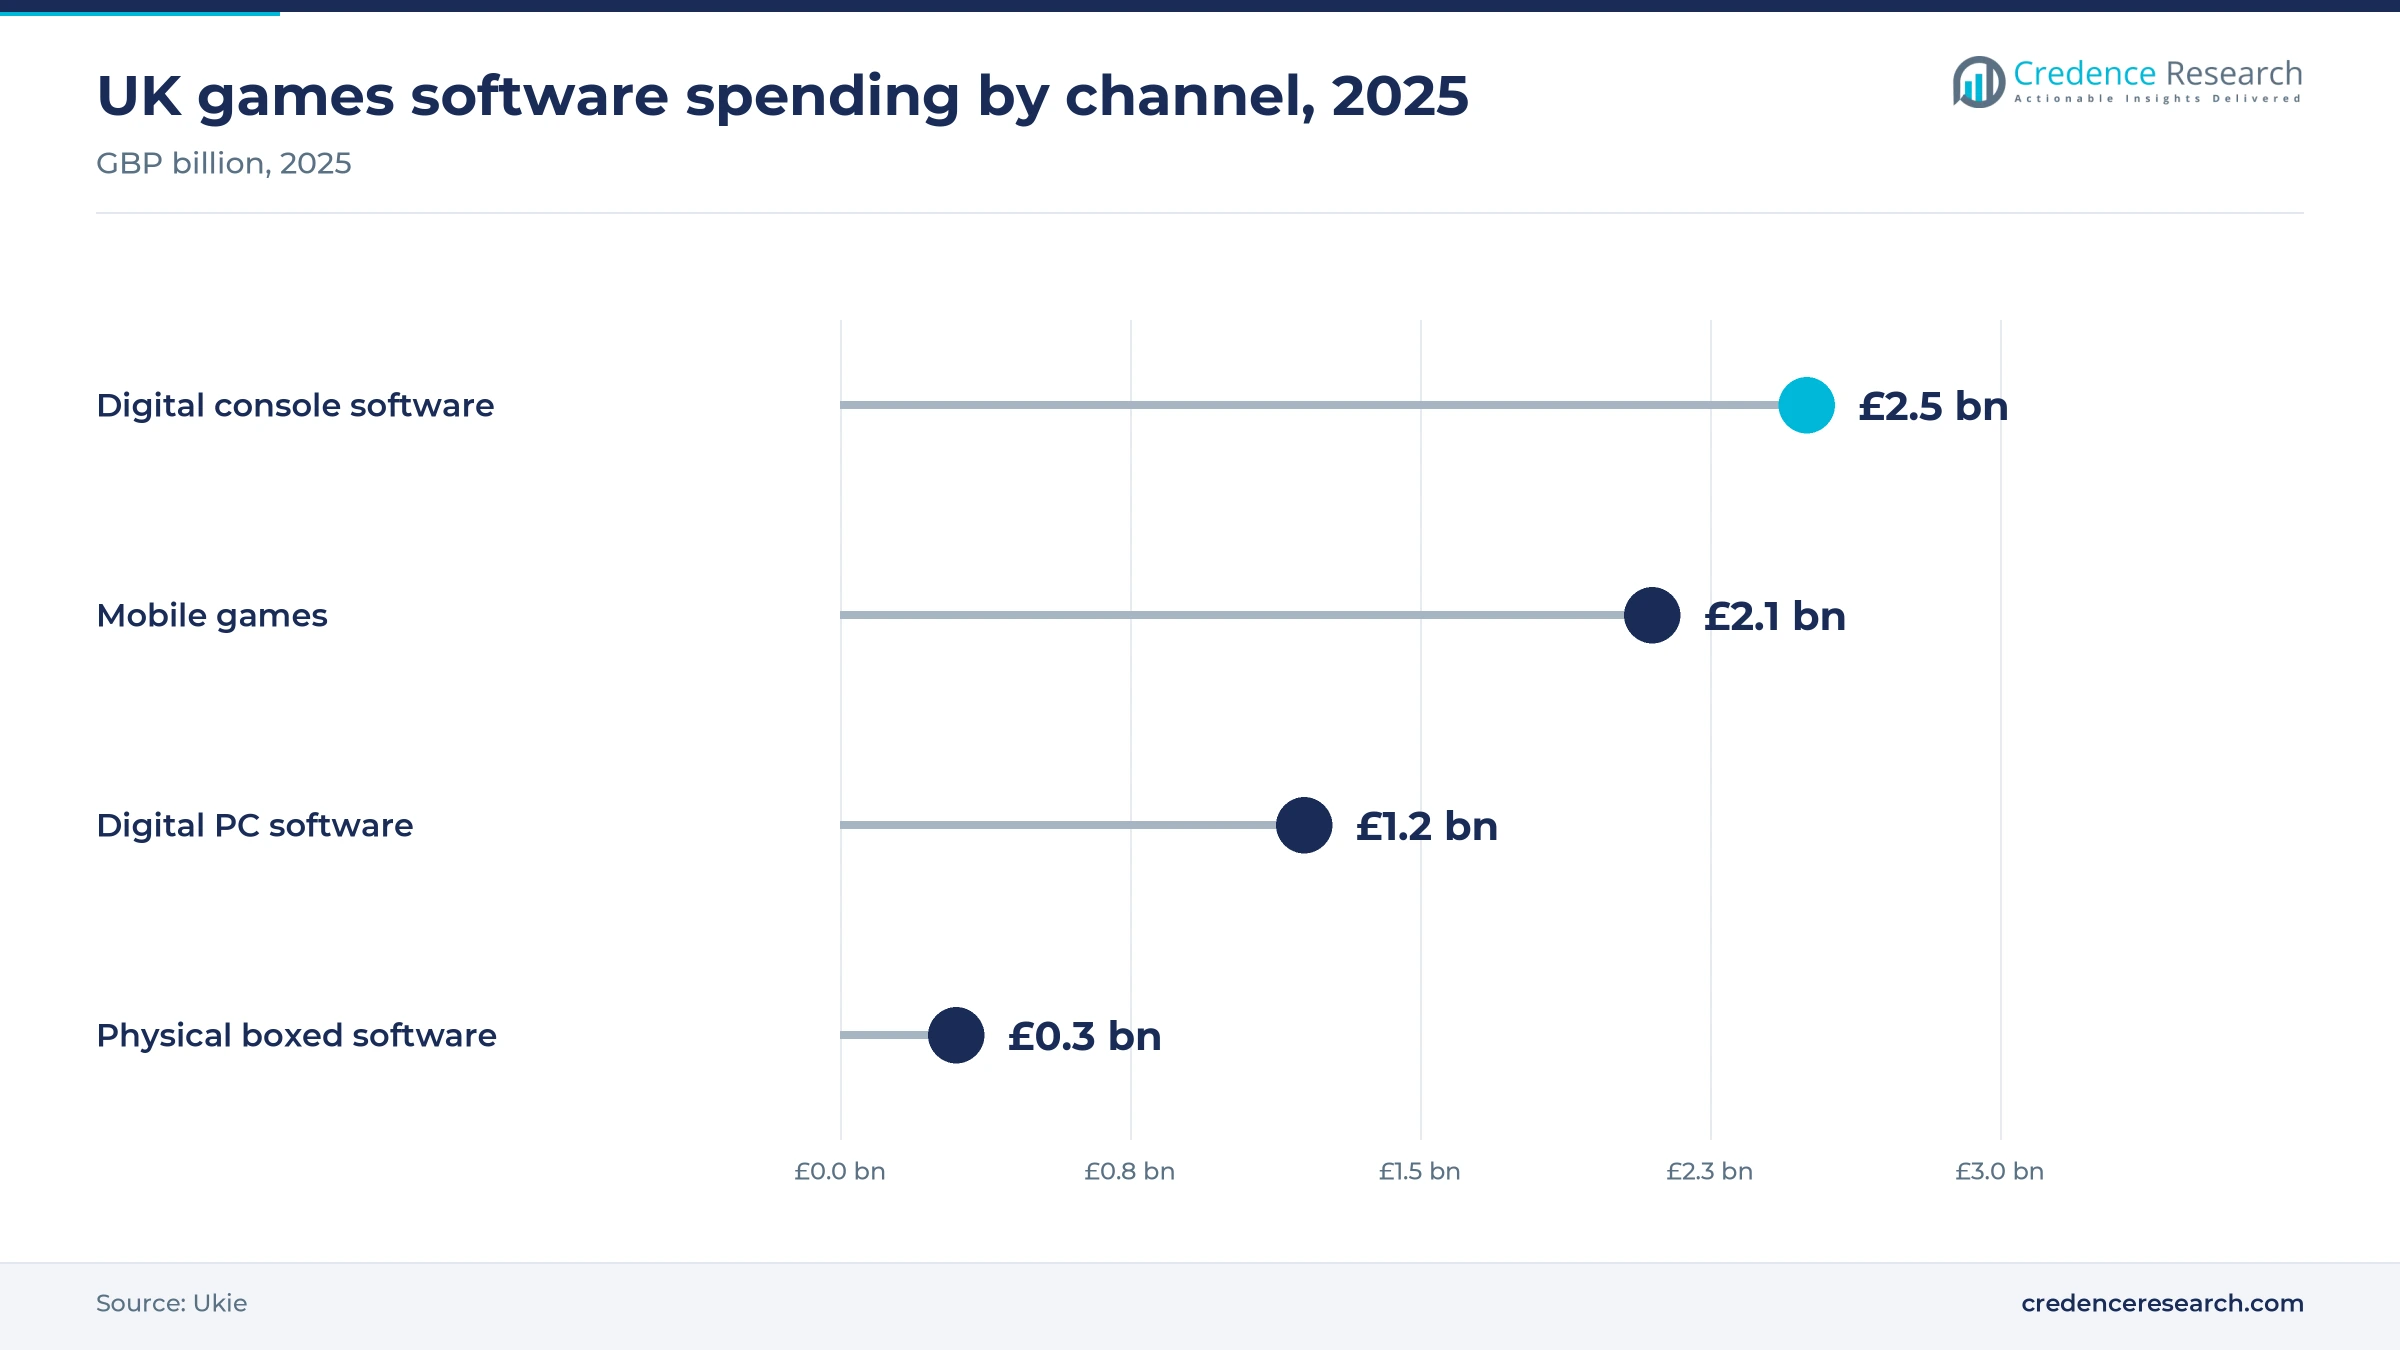
Based on type, the market is categorized into PC, console and mobile. Mobile led with 65.5% of 2025 value because phones carry the largest volume of small in-game purchases, and U.K. mobile game spending alone rose 8% to £2.1 billion in 2025, according to Ukie. PC grows fastest at 6.5% as storefront competition widens the paying PC base, and Epic reported a record 78 million monthly active users on its store in December 2025. Console sits between the two, with high fee rates per sale but fewer buyers than mobile.
In-game purchases lead while subscriptions grow fastest
Based on revenue model, the market is categorized into free-to-play, pay-to-play and subscription. Free-to-play titles led with 66.0% of 2025 value because stores take a share of every in-game currency sale, and the largest free-to-play titles depend on mobile store access, as the return of Fortnite to the U.S. App Store in May 2025 showed. Subscription grows fastest at 6.8% as platform holders raise prices and bundle catalogs, with Microsoft lifting Game Pass Ultimate to USD 29.99 a month in October 2025 and adding EA Play and Ubisoft+ Classics to the tier.
Device owners keep most fees as independent stores gain
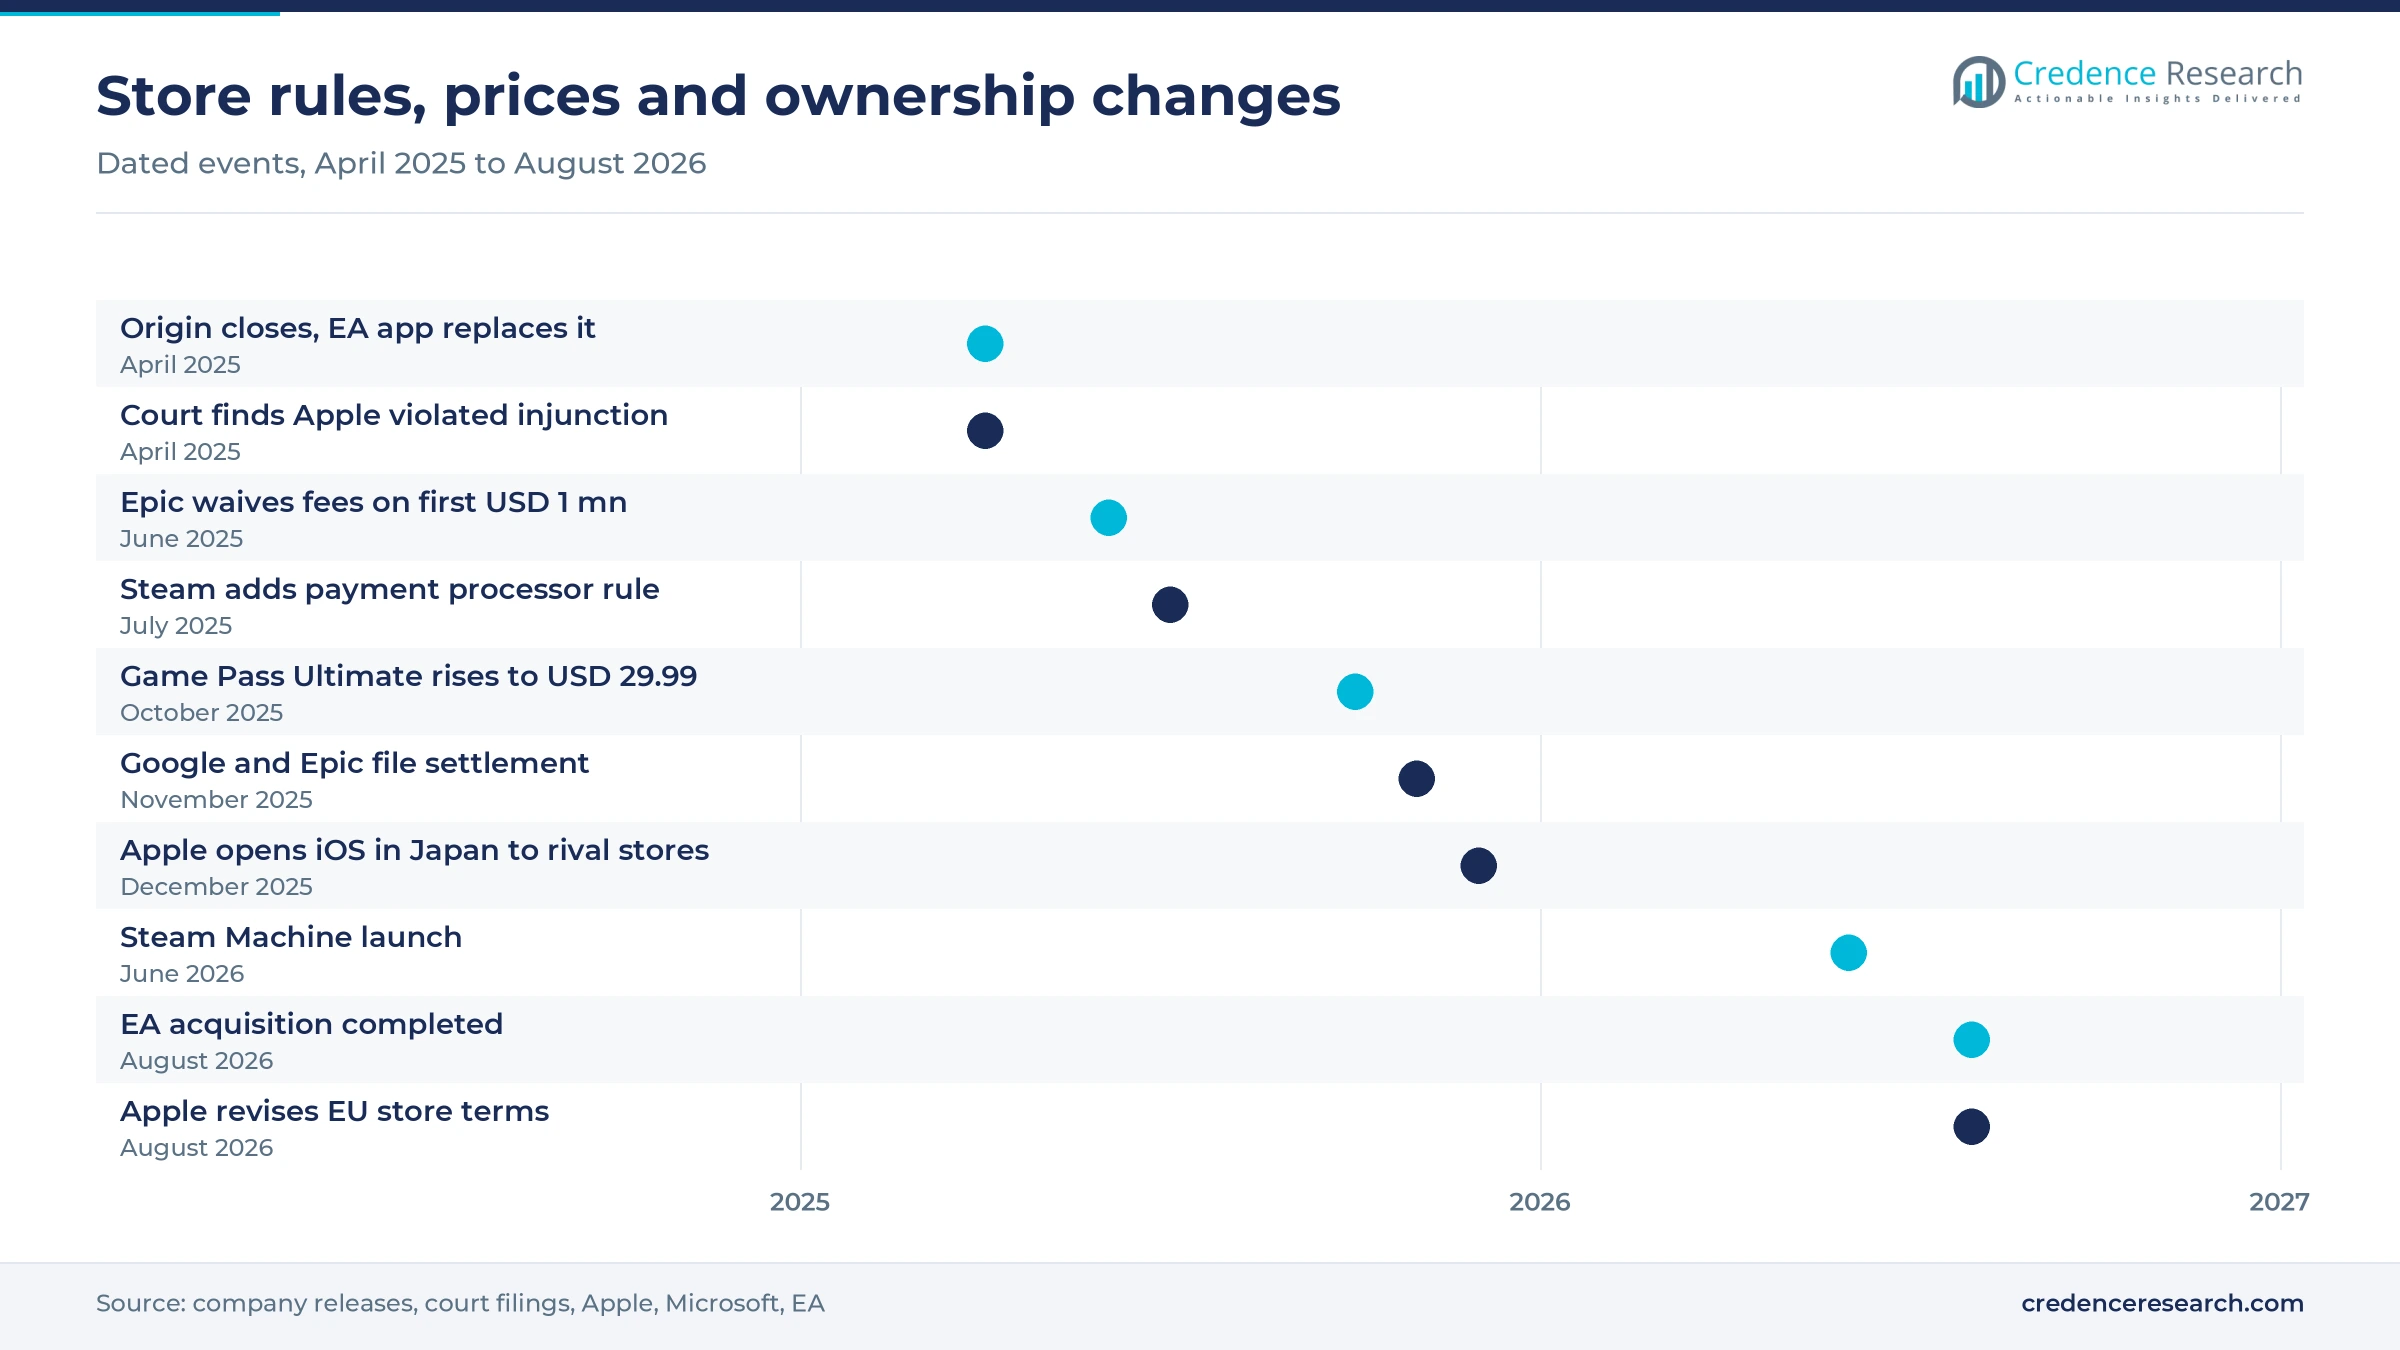
Based on storefront owner, the market is categorized into platform holders, independent storefronts and publisher-owned storefronts. Platform holders led with 85.0% of 2025 value because the company that controls a device or operating system also runs its default store, and even apps installed from rival EU marketplaces pay Apple a 5% Core Technology Commission under its August 2026 terms. Independent storefronts grow fastest at 6.7% as Epic said player spending on third-party PC games in its store rose 57% to USD 400 million in 2025. Publisher stores trail, and EA retired Origin on April 17, 2025, in favor of the EA app.
| Segment Group | Leading Sub-segment | Share, 2025 | Fastest-growing Sub-segment | CAGR, 2026–2035 |
|---|---|---|---|---|
| By Type | Mobile | 65.5% | PC | 6.5% |
| By Revenue Model | Free-to-Play | 66.0% | Subscription | 6.8% |
| By Storefront Owner | Platform Holders | 85.0% | Independent Storefronts | 6.7% |
Store fees run from 30% down to 12% and lower
Store fees are a percentage of each transaction, and the rate falls as a title's sales rise or as regulators step in. Steam keeps a sliding share, and Valve said it paid out 76% of revenue across non-Valve games in 2025, an effective fee near 24%. Epic undercuts that at 12% and waives its fee on a product's first USD 1 million each year. For large publishers, the threat to move volume to a cheaper store keeps steady pressure on rates. Subscriptions work differently, because the platform sets a monthly price and pays publishers for catalog access, so the Game Pass rise to USD 29.99 lifts retained revenue only if catalog payments grow more slowly.
| Store and fee basis | Typical price or fee | Basis |
|---|---|---|
| Steam revenue share | 30% up to USD 10 mn per title, 25% up to USD 50 mn, 20% above | Valve, tiers introduced December 2018 |
| Epic Games Store | 12% standard, 0% on the first USD 1 mn per product each year | Epic, from June 2025 |
| Google Play, settlement terms | 20% standard, 10% subscriptions, optional 5% billing fee | Google via Engadget, March 2026 |
| Apple App Store, EU terms | 5% Core Technology Commission, 15% on purchase links, 20% on alternative in-app payment | Apple terms reported by MacRumors, August 2026 |
| Xbox Game Pass Ultimate | USD 29.99 a month, up from USD 19.99 | Microsoft, Oct. 1, 2025 |
Request a Free Sample
Fill in your details and we'll send you a free sample report.
- Sample data tables & charts
- Research methodology
PC engagement and console downloads lift store volume
Record Steam usage widens the base of paying PC players
PC storefront revenue rises with time spent in the launcher, because engaged players buy more games, add-ons and in-game items through it. Steam set a record of 43.5 million concurrent users on Oct. 11, 2026, according to SteamDB data reported by GamesRadar, up from 42.7 million in March 2026. Valve said its users downloaded 100 exabytes of games and updates in 2025, against about 80 exabytes in 2024. The same Valve review showed peak concurrency growing by about 3.4 million a year over five years. This growth favors the store with the largest installed library, and it raises the cost for rivals that must buy reach with free games and exclusives.
Console buyers now download most full games
Console store revenue grows as players move from discs to downloads, since a download passes through the platform holder's store while a disc shares its margin with the retailer. Sony reported a full-game digital download ratio of 85% for PlayStation in the fourth quarter of fiscal 2025 and about 78% across the year. Nintendo reported a digital sales ratio of 82.6% for April to June 2026, although most of that is Nintendo's own software, so the fee-bearing part is the third-party share of eShop sales. In the United Kingdom, digital console software spending rose 9% to almost £2.5 billion in 2025, according to Ukie. Each point of digital share moves margin from retailers to Sony, Microsoft and Nintendo, which squeezes boxed-game chains first.
New store-linked hardware extends reach beyond the desk
Hardware that boots straight into a storefront widens the audience each store can sell to. Valve set a June 30, 2026 launch for the Steam Machine at USD 1,049 for the 512 GB model without a controller, according to Gematsu, bringing the Steam store to living-room screens. The ASUS-built ROG Xbox Ally handhelds, which boot into the Xbox app, were set to launch globally on Oct. 16, 2025, according to Xbox Wire. Nintendo had sold 23.68 million Switch 2 consoles by June 30, 2026, each tied to the Nintendo eShop. Store operators that also shape the hardware set the defaults and win repeat purchases, while PC launchers without a device of their own depend on these partners.
Large Asian audiences keep mobile store volumes high
Asia sets the scale for mobile store fees because its largest markets combine hundreds of millions of players with frequent small purchases. China's game industry reported record domestic sales revenue of 350.79 billion yuan in 2025, up 7.68%, according to the China Game Industry Report cited by Shanghai Daily, a figure for player spending of which stores keep only a share. The domestic player base also reached a record 683 million people. Chinese self-developed games also earned USD 20.46 billion overseas, with the United States taking 32.31% of that total, so Chinese titles feed fees in Western stores as well. Apple, Google and Chinese Android channel stores gain the most.
Direct payments and new mobile stores reshape fees
Developers are shifting toward direct payments and lower fees
Developers are shifting toward their own payment systems to keep more of each sale, which pushes stores to compete on fees. Epic said 35% of third-party player hours on its store in 2025 were in games using developers' own payment systems, up from about one in eight hours through 2023, according to GamesBeat. Epic charges nothing on sales made through a developer's own payment system, according to the same report. Google's March 2026 terms, set out in the challenges, likewise price billing apart from distribution for the first time on Android. Online payment gateways that handle game checkouts gain from this split, while stores that bundle payment with distribution lose pricing power.
Launchers are shifting toward aggregated libraries across stores
PC platforms are shifting toward aggregated libraries that show games from several stores in one place, so the launcher a player opens first gains influence over the next purchase. Since Sept. 29, 2025, Microsoft says, the Xbox PC app combines Xbox and Game Pass titles with installed games from leading PC storefronts under My Library on Windows 11 PCs and handhelds. Epic said about 60% of its store users also use Steam, according to GamesBeat, so most PC players already hold accounts in more than one store. Epic also plans a cross-platform PC and mobile library for fall 2026. The store that owns the front screen wins impulse sales, while single-store launchers risk becoming background download tools.
Alternative mobile marketplaces open a new store channel
Store operators other than Apple and Google have an opening to sell games on phones as courts and regulators require both systems to accept rival marketplaces. Under the settlement filed on Nov. 4, 2025, Google agreed to neutral criteria for registering third-party app stores on Android, a policy that would run until 2032, according to Android Central. Apple opened iOS in Japan to alternative app marketplaces in December 2025 under the Mobile Software Competition Act. Epic said it plans self-publishing tools and third-party APIs for its mobile store in summer 2026. These channels compete with mobile application stores run by handset makers, and PC store operators with large catalogs and cross-platform accounts gain the most.
Rising connectivity in Africa and the Arab States opens new buyers
Stores have an opening to add paying players where internet access is still spreading, since every newly connected phone or PC is a potential store account. Only 36% of people in Africa used the internet in 2025, against 74% worldwide, according to the ITU. Internet use in the Arab States reached 70% in the same year, according to the same data. Epic plans regional storefronts for fall 2026, which would let it price and promote games for local buyers. Store operators that price in local currency and accept local payment methods gain first, although public data on how many of these accounts pay for games remain thin.
Fee caps, crowded catalogs and payment rules weigh
Court-ordered fee caps cut the take on mobile purchases
Fee compression hits mobile store operators hardest because their rates were the highest in the industry. Google and Epic first proposed caps of 9% or 20% in a Nov. 4, 2025 filing, and the March 2026 settlement set a 20% standard in-app rate, 10% on subscriptions and a separate 5% billing fee, reaching the U.S., the U.K. and the EEA by June 30, 2026 and every market by Sept. 30, 2027, according to Engadget. Each step down moves margin from Google to large mobile publishers that already process payments themselves.
Release volume makes discovery harder for smaller studios
Store growth does not reach most new titles, because release volume outpaces player attention. More than 19,000 games were released on Steam in 2025, and nearly half received fewer than 10 user reviews, according to GamingOnLinux. Small studios that cannot fund marketing carry this risk, since store placement favors titles that already sell. Stores that improve curation and wishlist tools can keep these developers from leaving for subscription deals or direct sales.
Payment processor rules can remove content from stores
Stores depend on card networks and payment processors, and those partners can limit what a store sells. In July 2025, Steam began banning games that violate the rules and standards of its payment processors and their banks, according to Engadget. Many adult-only titles were then removed from the store after the rule took effect. A single processor rule can end sales overnight for niche and adult-content developers. Larger stores with several payment routes are better placed to absorb such pressure.
Unsettled EU app store terms keep the rules uncertain
Rule changes in Europe remain unsettled, which makes long-term store investment harder to plan. Apple's August 2026 EU terms were welcomed by the European Commission but criticized by Epic as junk fees, according to MacRumors. On Sept. 10, 2026, a coalition of app developers, digital businesses and news media urged the Commission to reject the terms, according to CADE. Until the Commission rules, alternative marketplace operators cannot set their own commissions with confidence.
Asia Pacific holds the largest pool of store fees
| Region | Value, 2025 (USD billion) | Share, 2025 | CAGR, 2026–2035 |
|---|---|---|---|
| Asia Pacific | 13.38 | 44.0% | 5.1% |
| North America | 9.13 | 30.0% | 4.5% |
| Europe | 5.48 | 18.0% | 4.3% |
| Latin America | 1.37 | 4.5% | 6.2% |
| Middle East & Africa | 1.06 | 3.5% | 5.9% |
Asia Pacific leads on mobile scale as Japan opens iOS
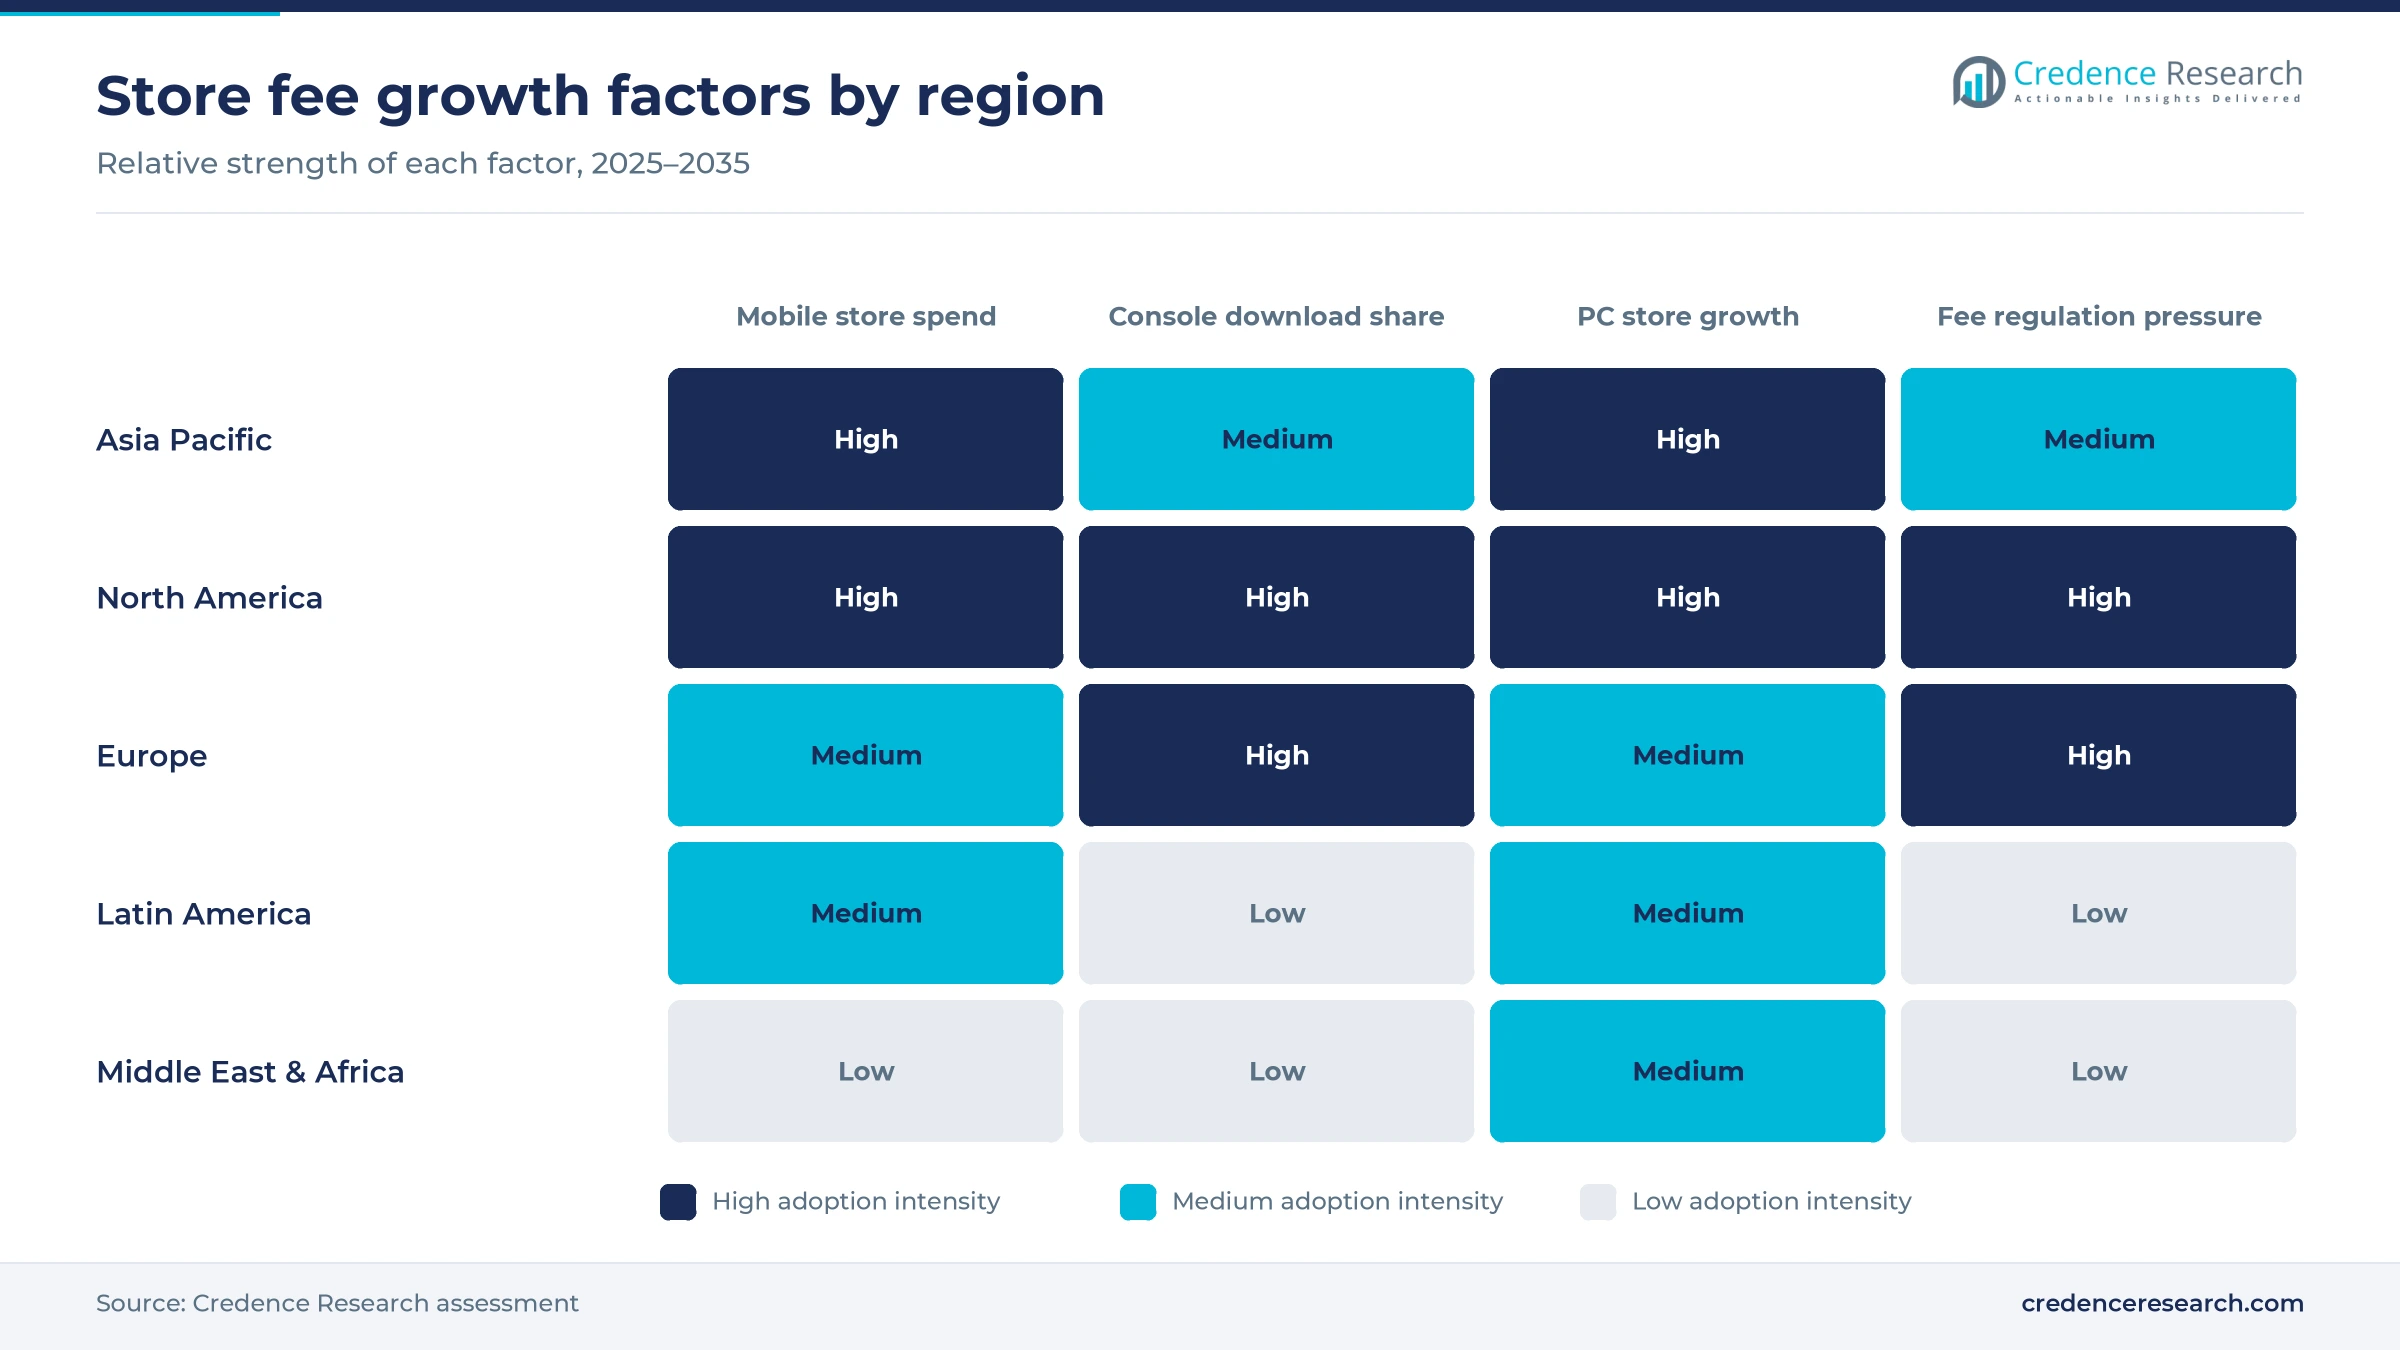
Asia Pacific held 44.0% of 2025 value and grows at 5.1% a year, the largest regional pool of store fees because of the Chinese player base described in the drivers and the commissions taken by Chinese Android channel stores. Japan changed the rules in December 2025, when Apple opened iOS in Japan to alternative app marketplaces and outside payments for digital goods. India removed a fee pool instead, banning online real-money games from Oct. 1, 2025, according to Outlook Business. Internet use in Asia-Pacific reached 77% in 2025, according to the ITU, so the region still adds connected players.
North America pays the most per player as courts cut fees
North America held 30.0% of 2025 value and grows at 4.5% a year, with high spending per player on phones, consoles and PCs. U.S. courts are reshaping store economics, and on April 30, 2025, Judge Yvonne Gonzalez Rogers found that Apple had violated her App Store injunction and referred the matter for possible criminal contempt, according to Payments Dive. Google's lower Play Store fees also roll out in the United States first. Because Valve, Microsoft and Epic are based here, U.S. rulings set the template that store operators then apply in other regions.
Europe grows slowest as EU rules compress mobile fees
Europe held 18.0% of 2025 value and grows at 4.3% a year, the slowest of any region because the EU app store terms described in the challenges compress mobile fees. The U.K. games market reached a record £8.8 billion in 2025, while boxed physical software fell to £319 million, according to Ukie, so almost all software now passes through a store. Poland is home to GOG, which CD Projekt sold to its co-founder in December 2025. European store operators compete on DRM-free and curated catalogs rather than on scale.
Latin America grows fastest from a small paying base
Latin America held 4.5% of 2025 value and grows fastest at 6.2% a year, from a small base. Brazil's legal framework for electronic games, Law 14,852, took effect in May 2024 and sets rules for making, importing and selling games in the country, according to the Chamber of Deputies. Internet use in the Americas as a whole sits between 88% and 93%, according to the ITU, so growth depends more on turning players into buyers than on new connections. Published data on store spending in the region are scarce, so this share carries more uncertainty than most.
Middle East and Africa draw Saudi capital into games
Middle East & Africa held 3.5% of 2025 value and grows at 5.9% a year. Saudi capital is moving into the supply side, and Electronic Arts completed its acquisition by a consortium of PIF, Silver Lake and Affinity Partners on Aug. 4, 2026. Connectivity remains the limit, with the internet use rates for Africa and the Arab States noted in the trends. Store spending data for the region are very limited, so this estimate rests mainly on connectivity and player-base evidence and carries the most uncertainty.
Hardware launches and ownership changes in 2025-26
| Development | Status and market relevance |
|---|---|
| In June 2026, Valve announced that the Steam Machine would launch on June 30 at USD 1,049 for the 512 GB model without a controller. | Launch date and price announced; the device brings the Steam store to living-room screens. |
| In August 2026, Electronic Arts completed its acquisition by PIF, Silver Lake and Affinity Partners, and its stock was delisted from NASDAQ. | Completed acquisition; the EA app and EA Play now sit under private ownership. |
| In December 2025, CD Projekt sold 100% of GOG to co-founder Michał Kiciński for PLN 90.7 million and signed a distribution agreement for future CD Projekt Red games. | Sale completed with a distribution deal; GOG continues as an independent DRM-free store. |
| In November 2025, Tencent completed its EUR 1.16 billion investment in Vantage Studios, the Ubisoft subsidiary behind Assassin's Creed, Far Cry and Rainbow Six. | Completed investment; it ties a major Chinese platform owner more closely to Ubisoft's largest franchises. |
Delivery, rights, payments and streaming set costs
- Content delivery networks push game files and patches to players worldwide, and the download volume Valve reported for 2025 shows why bandwidth is one of the largest store costs.
- Digital rights management ties each purchase to an account, while GOG builds its offer on DRM-free installers that players can keep and run offline.
- Payment and regional pricing systems convert prices into local currencies and payment methods, and they decide how much of each store fee goes to processors.
- Cloud streaming lets subscribers play without a download, and Game Pass Ultimate includes unlimited cloud gaming in its top tier.
Need a Custom Version of This Report?
Tailor the scope, geography, or segments to your exact requirements.
- Custom geography or segment scope
- Direct access to our analyst team
Device owners control defaults while PC stays open
Competition turns on who controls the default store on each device, the size of the catalog and the fee charged to developers. Apple and Google run the main mobile stores, and Sony, Microsoft and Nintendo run the only stores on their consoles, each tied to the console hardware they design. Valve leads PC distribution with Steam, competing on community features, a deep catalog and tools such as wishlists and user reviews. Epic Games competes with lower fees, weekly free games and Fortnite traffic. GOG competes on DRM-free sales, while Tencent's WeGame serves PC players in China, where Huawei's AppGallery and Tencent's YingYongBao lead the phone app stores that take the place of Google Play. Electronic Arts, Ubisoft and Microsoft's Battle.net run publisher stores that mainly sell their own titles. Humble Bundle sells bundles and keys that redeem on other stores, which makes it a partner and a rival to the larger PC launchers at the same time.
Platform holders own the defaults while PC stores compete openly
Supply is concentrated, because each phone and console ecosystem has one default store controlled by the device or operating system owner. Apple, Google, Sony, Microsoft and Nintendo therefore collect most store fees without competing for placement on their own hardware. PC is the open exception, yet Steam still dominates it, with about 140 million monthly active users against Epic's 78 million, according to Epic's own comparison. Entry barriers are payment infrastructure, content delivery at scale and a catalog large enough to attract players, so new entrants buy users with free games and exclusives. Margins are highest for default stores, while PC challengers accept lower fees to win catalog.
Companies profiled and their roles in this market
| Company | Type | Role in the market |
|---|---|---|
| Valve Corporation (Steam) | Independent PC storefront | Largest PC store, with tiered fees and Steam Deck and Steam Machine hardware |
| Apple (App Store) | Platform holder | Default iOS store, with rival marketplaces now allowed in the EU and Japan |
| Google (Alphabet) | Platform holder | Google Play, with fee changes and registered third-party stores under its Epic settlement |
| Sony Group (PlayStation Store) | Platform holder | PlayStation Store and PlayStation Plus for PS4 and PS5 players |
| Microsoft (Xbox, Microsoft Store and Battle.net) | Platform holder | Xbox stores, Game Pass and the Battle.net PC launcher |
| Nintendo (Nintendo eShop) | Platform holder | Nintendo eShop for Switch and Switch 2 owners |
| Epic Games (Epic Games Store) | Independent storefront | PC and mobile store with a 12% fee and weekly free games |
| Tencent (WeGame and YingYongBao) | Independent storefront | WeGame PC platform and the Tencent MyApp (YingYongBao) Android store in China |
| Huawei (AppGallery) | Platform holder | AppGallery, the default app store on Huawei phones and HarmonyOS devices in China |
| GOG | Independent PC storefront | DRM-free store, now owned by CD Projekt co-founder Michał Kiciński |
| Electronic Arts (EA app) | Publisher-owned storefront | EA app and EA Play, which replaced Origin in April 2025 |
| Ubisoft (Ubisoft Connect) | Publisher-owned storefront | Ubisoft Connect launcher and Ubisoft+ subscription |
| Humble Bundle (Ziff Davis) | Independent storefront | Bundles and game keys redeemable on other PC stores |
Reach and service, not control, will protect fees
Credence Research's view is that store revenue will grow more slowly than game spending through 2035, because the fee each store keeps is falling faster than player numbers are rising. Mobile carries most of that risk, since fee caps and direct payments now reach the United States, the EU and Japan. PC and console stores look sturdier, as engagement records on Steam and digital shares above three quarters at Sony and Nintendo keep transactions inside the store. The winners will be operators that earn their fee through reach and service, such as hardware, shared libraries and payments, rather than through control of the only door to the player.
Payout rates and fee schedules anchor the model
The report uses 2025 as the base year and forecasts to 2035. Market values in this report come from the Credence Research model. This edition replaces the previous 2024 estimate, which was smaller than the fees Steam or a single mobile store retains alone, with a bottom-up build of third-party spending on each store type multiplied by its effective fee, using Valve's disclosed 76% payout, published fee schedules and reported player spending. Segment and regional shares are Credence Research estimates based on company releases, court filings, Ukie and ITU statistics and reported industry sales data. No interviews or surveys were carried out for this edition.
Fee pressure slows store revenue more than play
Through 2035 the market keeps growing, but store fees rise more slowly than spending on games. Mobile remains the largest type, while its share slips as fee caps spread and direct web payments take a larger part of in-game purchases. PC grows fastest as Steam, Epic and the Xbox app compete for the same players and new hardware brings PC stores to living rooms. Console stores keep high digital shares and steady fee rates through the period. Latin America, Africa and the Middle East add new accounts as connectivity improves, although from small bases.
Fee rules decide whether store revenue keeps pace with play
The outcome depends mainly on how far regulators push mobile fees down and whether PC and console stores keep their rates. Wider adoption of capped mobile fees and more direct payments would hold the market near the downside case. Stable console fees, more store-linked hardware and firm subscription pricing would move it toward the upside case by 2035, while the base case assumes that mobile fee cuts are offset by higher spending on PC and console.
| Scenario | CAGR, 2026–2035 | Value, 2035 | What has to hold |
|---|---|---|---|
| Downside | 3.3% | USD 42.91 billion | Mobile fee caps spread worldwide and direct payments take a large share of in-game purchases |
| Base | 4.85% | USD 48.85 billion | Mobile fee cuts are offset by steady growth in PC and console downloads |
| Upside | 6.1% | USD 54.58 billion | Console and PC rates hold while new hardware and subscriptions add paying players |
Frequently Asked Questions
How big is the digital game distribution platform market?
Which game platforms are like Steam?
How large is the Epic Games Store compared with Steam?
How much does Steam take from game sales?
How much does a game subscription cost?
Which device type leads digital game distribution?
Which region leads the digital game distribution platform market?
How are app store rules changing for games?
Table of Content
Chapter 1 Market Segmentation
- 1.1 Segmentation Framework
- 1.1.1 Product and Service Classification
- 1.1.2 Application and End-Use Classification
- 1.1.3 Technology and Solution Classification
- 1.1.4 Customer and Distribution Channel Classification
- 1.1.5 Geographic Segmentation
- 1.1.6 Market Segment Definitions and Boundaries
- 1.2 By Type
- 1.2.1 Mobile
- 1.2.2 Console
- 1.2.3 PC
- 1.3 By Revenue Model
- 1.3.1 Free-to-Play
- 1.3.2 Pay-to-Play
- 1.3.3 Subscription
- 1.4 By Storefront Owner
- 1.4.1 Platform Holders
- 1.4.2 Independent Storefronts
- 1.4.3 Publisher-Owned Storefronts
Chapter 2 Introduction
- 2.1 Report Objectives and Scope
- 2.2 Product Definition and Industry Terminology
- 2.3 Market Inclusions and Exclusions
- 2.4 Research Process
- 2.4.1 Primary Research and Expert Interviews
- 2.4.2 Secondary Research and Source Review
- 2.4.3 Top-Down and Bottom-Up Estimation
- 2.4.4 Data Triangulation and Verification
- 2.5 Market Size Measurement Basis
- 2.5.1 2025: USD 30.42 billion → 2035: USD 48.85 billion
- 2.6 Historical and Forecast Reference Periods
- 2.6.1 Historical Period: 2018-2025
- 2.6.2 Base Year: 2025
- 2.6.3 Forecast Period: 2025-2035
- 2.7 Research Assumptions and Limitations
Chapter 3 Executive Summary
- 3.1 Market Snapshot and Key Findings
- 3.2 Base-Year Market Size, 2025
- 3.3 Forecast Market Size, 2035
- 3.4 Revenue and Volume Growth Outlook
- 3.5 Key Demand and Supply Indicators
- 3.6 Leading Market Segments
- 3.7 Fastest-Growing Market Opportunities
- 3.8 Regional Performance Highlights
- 3.9 Technology and Industry Transformation
- 3.10 Competitive Landscape Summary
- 3.11 Analyst View and Strategic Implications
Chapter 4 Global Digital Game Distribution Platform Market Trends and Developments
- 4.1 Historical Industry Development, 2018-2025
- 4.2 Recent Market Trends and Developments
- 4.3 Demand and Customer Behavior Trends
- 4.4 Technology and Product Innovation
- 4.5 Artificial Intelligence, Automation and Digitalization
- 4.6 Local Manufacturing and Supply Chain Realignment
- 4.7 Industry Partnerships, Mergers and Acquisitions
- 4.8 Sustainability and Circular Economy Developments
- 4.9 Government and Private Sector Investment Trends
- 4.10 Emerging Business Models and Commercialization
- 4.11 Industry Developments and Announcements
Chapter 5 Global Digital Game Distribution Platform Market Production, Supply and Demand Analysis
- 5.1 Demand Trend and Consumption Analysis, 2018-2025
- 5.2 Demand Forecast, 2025-2035
- 5.3 Production and Output Trend, 2018-2025
- 5.4 Production and Output Forecast, 2025-2035
- 5.5 Installed Capacity and Capacity Utilization
- 5.6 Company-Wise Production Plants and Statistics
- 5.6.1 Installed Production Capacity
- 5.6.2 Actual Production
- 5.6.3 Planned Capacity and Expansion Targets
- 5.7 Supply Chain Structure and Procurement Trends
- 5.8 Supply-Demand Gap and Bottlenecks
- 5.9 Import Dependence and Sourcing Structure
- 5.10 Contract Manufacturing and Outsourcing
- 5.11 Regional Supply and Demand Concentration
Chapter 6 Global Digital Game Distribution Platform Market Pricing Analysis
- 6.1 Pricing Structure and Measurement
- 6.2 Historical Pricing Trends, 2018-2025
- 6.3 Pricing Outlook, 2025-2035
- 6.4 Average Selling Price and Unit Economics
- 6.5 Pricing by Product and Market Segment
- 6.6 Geographic Pricing Differences
- 6.7 Key Input, Energy, Labor and Logistics Costs
- 6.8 Contract Pricing and Purchasing Models
- 6.9 Pricing Sensitivity and Competitive Positioning
- 6.10 Price, Margin and Profitability Implications
Chapter 7 Global Digital Game Distribution Platform Market Dynamics
- 7.1 Market Growth Drivers
- 7.1.1 Demand-Side Drivers
- 7.1.2 Technology and Innovation Drivers
- 7.1.3 Infrastructure and Investment Drivers
- 7.1.4 Regulatory and Policy Drivers
- 7.2 Market Restraints
- 7.2.1 Cost and Affordability Constraints
- 7.2.2 Technology and Adoption Barriers
- 7.2.3 Supply Chain and Operational Constraints
- 7.3 Market Challenges
- 7.3.1 Competitive Pressure and Margin Erosion
- 7.3.2 Skills, Infrastructure and Implementation Gaps
- 7.4 Emerging Market Opportunities
- 7.5 Market Dynamics Impact and Time-Horizon Assessment
Chapter 8 Global Digital Game Distribution Platform Value Chain Analysis
- 8.1 Industry Value Chain Overview
- 8.2 Upstream Suppliers and Critical Inputs
- 8.3 Technology and Component Providers
- 8.4 Manufacturing or Service Delivery
- 8.5 Distribution, Channel Partners and Integrators
- 8.6 Downstream Applications and End Users
- 8.7 Value Addition and Profit Pools
- 8.8 Vertical Integration and Outsourcing
- 8.9 Supplier Concentration and Risk
- 8.10 Supply Chain Localization and Resilience
Chapter 9 Global Digital Game Distribution Platform Market Regulations and Policies
- 9.1 Relevant Laws, Standards and Compliance Frameworks
- 9.2 Product, Service, Safety and Quality Requirements
- 9.3 Government Policies, Incentives and Subsidies
- 9.4 Imports, Exports and Trade Barriers
- 9.5 Public Procurement and Local Content Requirements
- 9.6 Environmental and Sustainability Compliance
- 9.7 Upcoming Policy Changes and Market Implications
Chapter 10 Global Digital Game Distribution Platform Market Hotspots and Opportunities
- 10.1 Market Opportunity Mapping and Growth Hotspots
- 10.2 High-Growth Applications and Customer Groups
- 10.3 Underserved Markets and White-Space Opportunities
- 10.4 Emerging Technology and Product Opportunities
- 10.5 New Capacity and Investment Hotspots
- 10.6 Market Entry and Expansion Opportunities
- 10.7 Distribution and Partnership Opportunities
- 10.8 Near-Term and Long-Term Commercial Potential
- 10.9 Opportunity Attractiveness and Execution Risks
Chapter 11 Global Digital Game Distribution Platform Market Outlook, 2025-2035
- 11.1 Market Size and Analysis
- 11.1.1 Revenue (Market Measurement: 2025: USD 30.42 billion → 2035: USD 48.85 billion)
- 11.1.2 Market Volume and Quantity Sold
- 11.1.3 Historical Market Size, 2018-2025
- 11.1.4 Base-Year Market Size, 2025
- 11.2 Market Forecast, 2025-2035
- 11.2.1 Revenue Forecast to 2035
- 11.2.2 Volume Forecast to 2035
- 11.2.3 CAGR and Year-on-Year Growth
- 11.2.4 Incremental Revenue Opportunity
- 11.3 Forecast Assumptions and Scenario Analysis
- 11.3.1 Base-Case Forecast
- 11.3.2 Optimistic and Conservative Scenarios
- 11.3.3 Technology, Pricing and Policy Sensitivities
- 11.4 Market Attractiveness and Growth Outlook
Chapter 12 Global Digital Game Distribution Platform Market Segmentation and Outlook
- 12.1 Segmentation Summary and Market Shares, 2025
- 12.2 Largest and Fastest-Growing Segments
- 12.3 By Type - Market Size and Forecast, 2025-2035
- 12.3.1 Segment Definition and Scope
- 12.3.2 Historical Market Size, 2018-2025
- 12.3.3 Revenue Forecast, 2025-2035
- 12.3.4 Volume Forecast, 2025-2035
- 12.3.5 Base-Year Market Share, 2025
- 12.3.6 Segment CAGR and Growth Drivers
- 12.3.7 Subsegment Market Size and Forecast
- 12.3.7.1 Mobile
- 12.3.7.2 Console
- 12.3.7.3 PC
- 12.3.8 Subsegment Pricing and Adoption Trends
- 12.3.9 Leading Suppliers and Competition
- 12.3.10 Regional Demand and Opportunities
- 12.4 By Revenue Model - Market Size and Forecast, 2025-2035
- 12.4.1 Segment Definition and Scope
- 12.4.2 Historical Market Size, 2018-2025
- 12.4.3 Revenue Forecast, 2025-2035
- 12.4.4 Volume Forecast, 2025-2035
- 12.4.5 Base-Year Market Share, 2025
- 12.4.6 Segment CAGR and Growth Drivers
- 12.4.7 Subsegment Market Size and Forecast
- 12.4.7.1 Free-to-Play
- 12.4.7.2 Pay-to-Play
- 12.4.7.3 Subscription
- 12.4.8 Subsegment Pricing and Adoption Trends
- 12.4.9 Leading Suppliers and Competition
- 12.4.10 Regional Demand and Opportunities
- 12.5 By Storefront Owner - Market Size and Forecast, 2025-2035
- 12.5.1 Segment Definition and Scope
- 12.5.2 Historical Market Size, 2018-2025
- 12.5.3 Revenue Forecast, 2025-2035
- 12.5.4 Volume Forecast, 2025-2035
- 12.5.5 Base-Year Market Share, 2025
- 12.5.6 Segment CAGR and Growth Drivers
- 12.5.7 Subsegment Market Size and Forecast
- 12.5.7.1 Platform Holders
- 12.5.7.2 Independent Storefronts
- 12.5.7.3 Publisher-Owned Storefronts
- 12.5.8 Subsegment Pricing and Adoption Trends
- 12.5.9 Leading Suppliers and Competition
- 12.5.10 Regional Demand and Opportunities
- 12.6 Segment Growth Comparison
- 12.7 Segment Attractiveness and Priority Matrix
Chapter 13 Global Digital Game Distribution Platform Geographic Market Outlook, 2025-2035
- 13.1 Regional Market Size and Share, 2025
- 13.2 Regional Market Forecast, 2025-2035
- 13.3 Regional Pricing, Production and Demand Differences
- 13.4 North America
- 13.4.1 United States
- 13.4.2 Canada
- 13.4.3 Mexico
- 13.5 Europe
- 13.5.1 Germany
- 13.5.2 France
- 13.5.3 Italy
- 13.5.4 United Kingdom
- 13.5.5 Spain
- 13.5.6 Poland
- 13.5.7 Russia
- 13.5.8 Netherlands
- 13.5.9 Belgium
- 13.5.10 Sweden
- 13.5.11 Denmark
- 13.5.12 Norway
- 13.5.13 Rest of Europe
- 13.6 Asia Pacific
- 13.6.1 China
- 13.6.2 India
- 13.6.3 Japan
- 13.6.4 South Korea
- 13.6.5 Thailand
- 13.6.6 Indonesia
- 13.6.7 Vietnam
- 13.6.8 Malaysia
- 13.6.9 Australia
- 13.6.10 Rest of Asia Pacific
- 13.7 Latin America
- 13.7.1 Brazil
- 13.7.2 Argentina
- 13.7.3 Colombia
- 13.7.4 Chile
- 13.7.5 Rest of Latin America
- 13.8 Middle East
- 13.8.1 Saudi Arabia
- 13.8.2 United Arab Emirates
- 13.8.3 Turkey
- 13.8.4 Israel
- 13.8.5 Iran
- 13.8.6 Rest of the Middle East
- 13.9 Africa
- 13.9.1 South Africa
- 13.9.2 Egypt
- 13.9.3 Nigeria
- 13.9.4 Morocco
- 13.9.5 Rest of Africa
- 13.10 Regional Investment, Policy and Supply Chain Differences
- 13.11 Regional Competitive Landscape
- 13.12 Geographic Growth Hotspots
Chapter 14 Global Digital Game Distribution Platform Technology, Innovation and Sustainability Outlook
- 14.1 Technology Landscape and Maturity
- 14.2 Product, Process and Service Innovation
- 14.3 AI, Automation and Digital Tools in the Industry
- 14.4 Technology Adoption and Performance Benchmarking
- 14.5 Innovation Pipeline and R&D Investment
- 14.6 Patent and Intellectual Property Trends
- 14.7 Energy Efficiency and Resource Management
- 14.8 Sustainability, Recycling and Circularity
- 14.9 Technology Roadmap, 2025-2035
- 14.10 Risks of Obsolescence and Technology Substitution
Chapter 15 Global Digital Game Distribution Platform Market Key Strategic Imperatives
- 15.1 Growth and Market Entry Priorities
- 15.2 High-Return Products and Segments
- 15.3 Pricing, Profitability and Cost Optimization
- 15.4 Technology Investment and Product Differentiation
- 15.5 Supply Chain Localization and Resilience
- 15.6 Distribution and Customer Acquisition
- 15.7 Partnership, Acquisition and Capacity Strategy
- 15.8 Regional Expansion Priorities
- 15.9 Short-, Medium- and Long-Term Actions
Chapter 16 Competition Outlook
- 16.1 Industry Competition Characteristics
- 16.2 Market Structure and Concentration
- 16.3 Market Share and Competitive Positioning, 2025
- 16.4 Company-Wise Revenue and Product Benchmarking
- 16.5 Production and Service Capacity Benchmarking
- 16.6 Technology, Pricing and Differentiation
- 16.7 Regional Footprint and Distribution Strength
- 16.8 Mergers, Acquisitions and Strategic Alliances
- 16.9 New Entrants and Competitive Threats
- 16.10 Porter's Five Forces and Industry Attractiveness
- 16.11 Competitive Outlook, 2025-2035
Chapter 17 Company Profiles
- 17.1 Company Coverage and Selection Criteria
- 17.2 Valve Corporation (Steam)
- 17.2.1 Business Description
- 17.2.2 Company Ownership and Geographic Presence
- 17.2.3 Product and Service Portfolio
- 17.2.4 Manufacturing and Operating Footprint
- 17.2.5 Production Capacity and Expansion Plans
- 17.2.6 Financial Performance and Investment
- 17.2.7 Market Share and Competitive Position
- 17.2.8 Technology and Innovation Capabilities
- 17.2.9 Strategic Alliances or Partnerships
- 17.2.10 Recent Developments
- 17.2.11 Growth Strategy and Outlook
- 17.3 Apple (App Store)
- 17.4 Google (Alphabet)
- 17.5 Sony Group (PlayStation Store)
- 17.6 Microsoft (Xbox, Microsoft Store and Battle.net)
- 17.7 Nintendo (Nintendo eShop)
- 17.8 Epic Games (Epic Games Store)
- 17.9 Tencent (WeGame and YingYongBao)
- 17.10 Huawei (AppGallery)
- 17.11 GOG
- 17.12 Electronic Arts (EA app)
- 17.13 Ubisoft (Ubisoft Connect)
- 17.14 Humble Bundle (Ziff Davis)
- 17.15 Other Relevant Market Participants
Note: Every listed company is profiled on the structure shown under the first company. The company list is preliminary and may change based on research findings, market developments, data availability and client requirements.
Chapter 18 Disclaimer
- 18.1 Research and Forecast Disclaimer
- 18.2 Data Source and Estimation Limitations
Note: The depth of individual sections depends on data availability for this market. Volume, capacity, trade and other unit-based metrics are included where applicable.