
Low-price packs and a GST cut widen Indian baked food demand
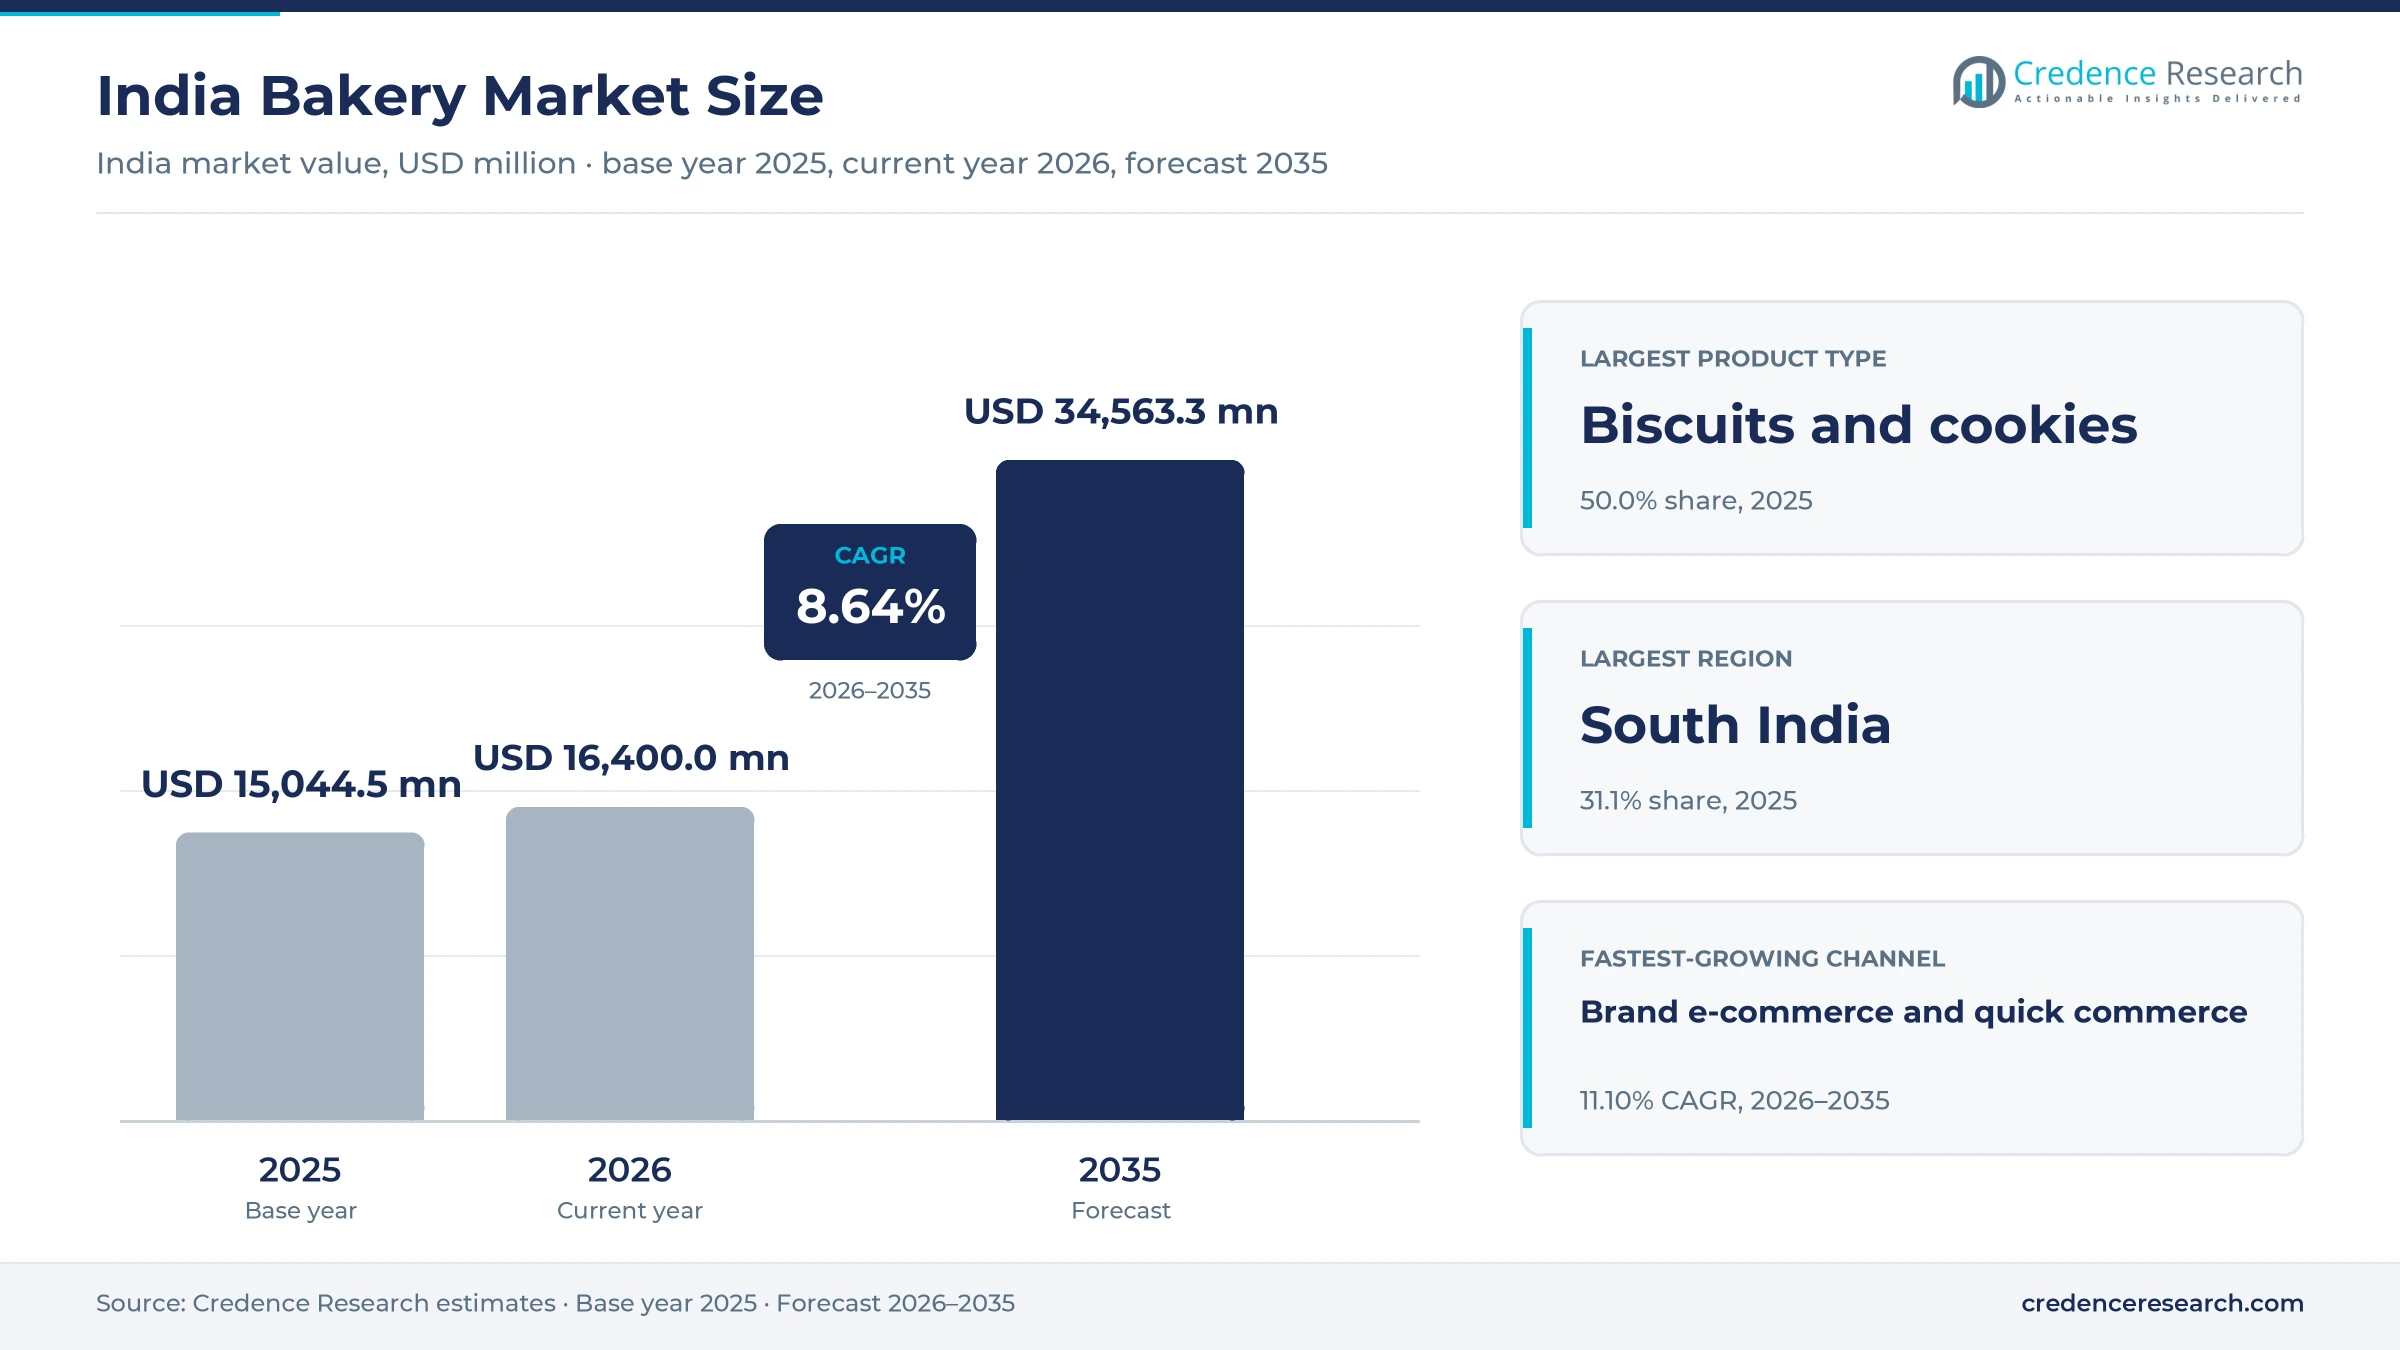
The India bakery market was valued at USD 15.04 billion in 2025 and is projected to increase from USD 16.40 billion in 2026 to USD 34.56 billion by 2035, registering a CAGR of 8.64% during 2026–2035. Demand comes from households that buy biscuits with tea, bread for breakfast and cakes for celebrations, and from offices, canteens and cafes that serve snacks every day. South India held the largest regional share, 31.1% in 2025, because high bread and rusk use and dense retail networks support steady buying. East and Central India is the fastest-growing region at 9.19% a year, as national and regional makers add plants and rural distribution. In turn, the GST rate on biscuits and pastries fell from 18% to 5% on Sept. 22, 2025, which cut shelf prices for packaged baked foods.
Which baked foods and sales channels does the estimate cover?
The estimate measures the value of biscuits and cookies, bread and buns, cakes and pastries, rusks and toasted and savoury baked products sold in India at manufacturer selling prices. It covers packaged brands, bakery chains and organized cafes selling through kirana stores, supermarkets, own outlets, e-commerce and quick commerce.
The estimate excludes home baking, flour and premixes sold to consumers, frozen dough sold to foodservice and exports of baked goods. The value chain runs from wheat millers, sugar and fat suppliers through bakeries and packaging plants to distributors, retailers and the households that buy each pack.
India Bakery Market Insights
- The India bakery market was valued at USD 15.04 billion in 2025 and is projected to reach USD 34.56 billion by 2035, registering a CAGR of 8.64% during 2026–2035.
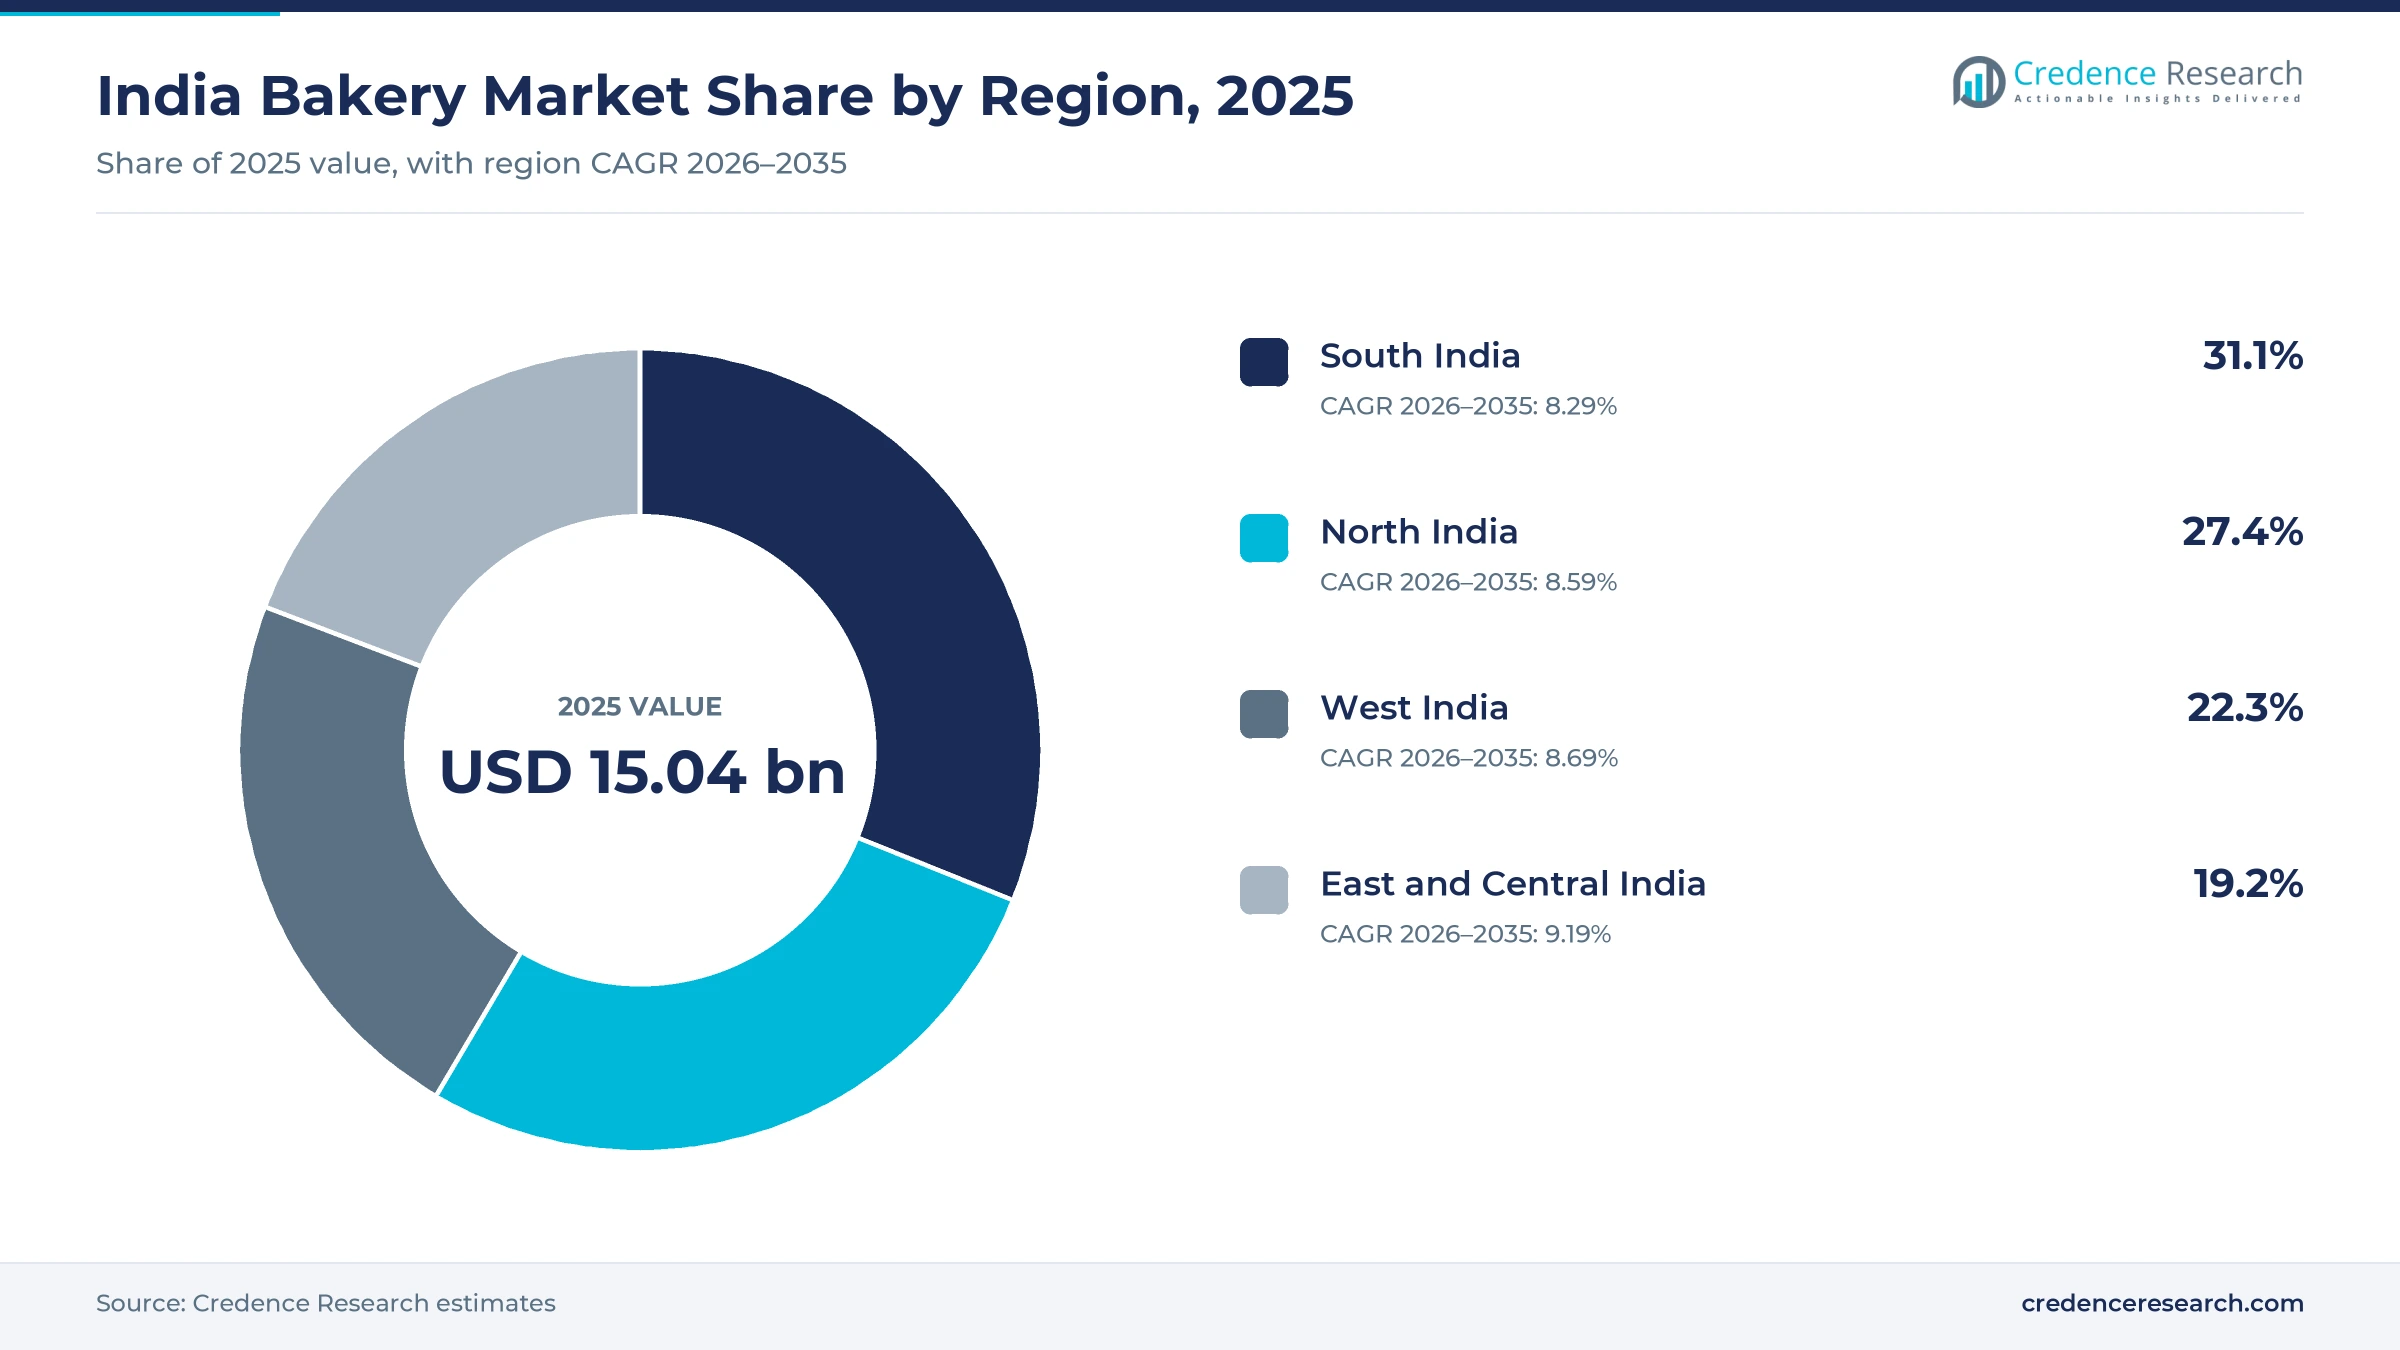
- South India held a 31.1% share of 2025 value, because households in the southern states buy bread, rusks and biscuits often through dense retail networks.
- Biscuits and cookies led with a 50.0% share of 2025 value, because low-price packs are sold in almost every kirana store across the country.
- The GST Council cut the tax rate on biscuits and pastries from 18% to 5% from Sept. 22, 2025, which lowered shelf prices for packaged baked foods.
- Brand e-commerce and quick commerce grows fastest at 11.10% a year during 2026–2035, as city shoppers order snacks and cakes for fast delivery.
Biscuits dominate as cakes and premium packs gain ground
Why do biscuits and cookies take the largest share?
Based on product type, the market is categorized into biscuits and cookies, bread and buns, cakes and pastries, rusks and toasted and savoury products. Biscuits and Cookies led with a 50.0% share of 2025 value, because low-price packs travel well and sell in almost every village shop. Cakes and Pastries grow fastest at 9.64% a year, as packaged cakes become everyday snacks.
How do value and premium packs split spending?
Based on price tier, the market is categorized into mass economy, mainstream, premium and artisanal and gourmet products. Mass Economy led with a 40.0% share of 2025 value, because most households buy small packs at fixed low prices. Artisanal and Gourmet grows fastest at 10.28% a year, as city cafes and specialty bakers sell sourdough, croissants and custom cakes.
Which eating occasions drive the most purchases?
Based on purchase occasion, the market is categorized into daily breakfast, tea-time snacking, on-the-go consumption and celebrations and gifting. Tea-Time Snacking led with a 38.0% share of 2025 value, because biscuits and rusks are eaten with tea in most homes. On-the-Go Consumption grows fastest at 9.57% a year, as commuters and students buy single-serve snacks.
How do kirana stores and quick commerce compare?
Based on distribution channel, the market is categorized into general trade and kirana, modern trade, bakery and cafe outlets, and brand e-commerce and quick commerce. General Trade and Kirana led with a 58.0% share of 2025 value, because neighborhood stores reach most households. Brand E-Commerce and Quick Commerce grows fastest at 11.10% a year, as apps deliver snacks within minutes in large cities.
| Segment Group | Leading Sub-segment | Share, 2025 | Fastest-growing Sub-segment | CAGR, 2026–2035 |
|---|---|---|---|---|
| By Product Type | Biscuits and Cookies | 50.0% | Cakes and Pastries | 9.64% |
| By Price Tier | Mass Economy | 40.0% | Artisanal and Gourmet | 10.28% |
| By Purchase Occasion | Tea-Time Snacking | 38.0% | On-the-Go Consumption | 9.57% |
| By Distribution Channel | General Trade and Kirana | 58.0% | Brand E-Commerce and Quick Commerce | 11.10% |
Request a Free Sample
Fill in your details and we'll send you a free sample report.
- Sample data tables & charts
- Research methodology
Convenience, cheaper wheat and new snacks lift volumes
How does convenience-led household buying lift demand?
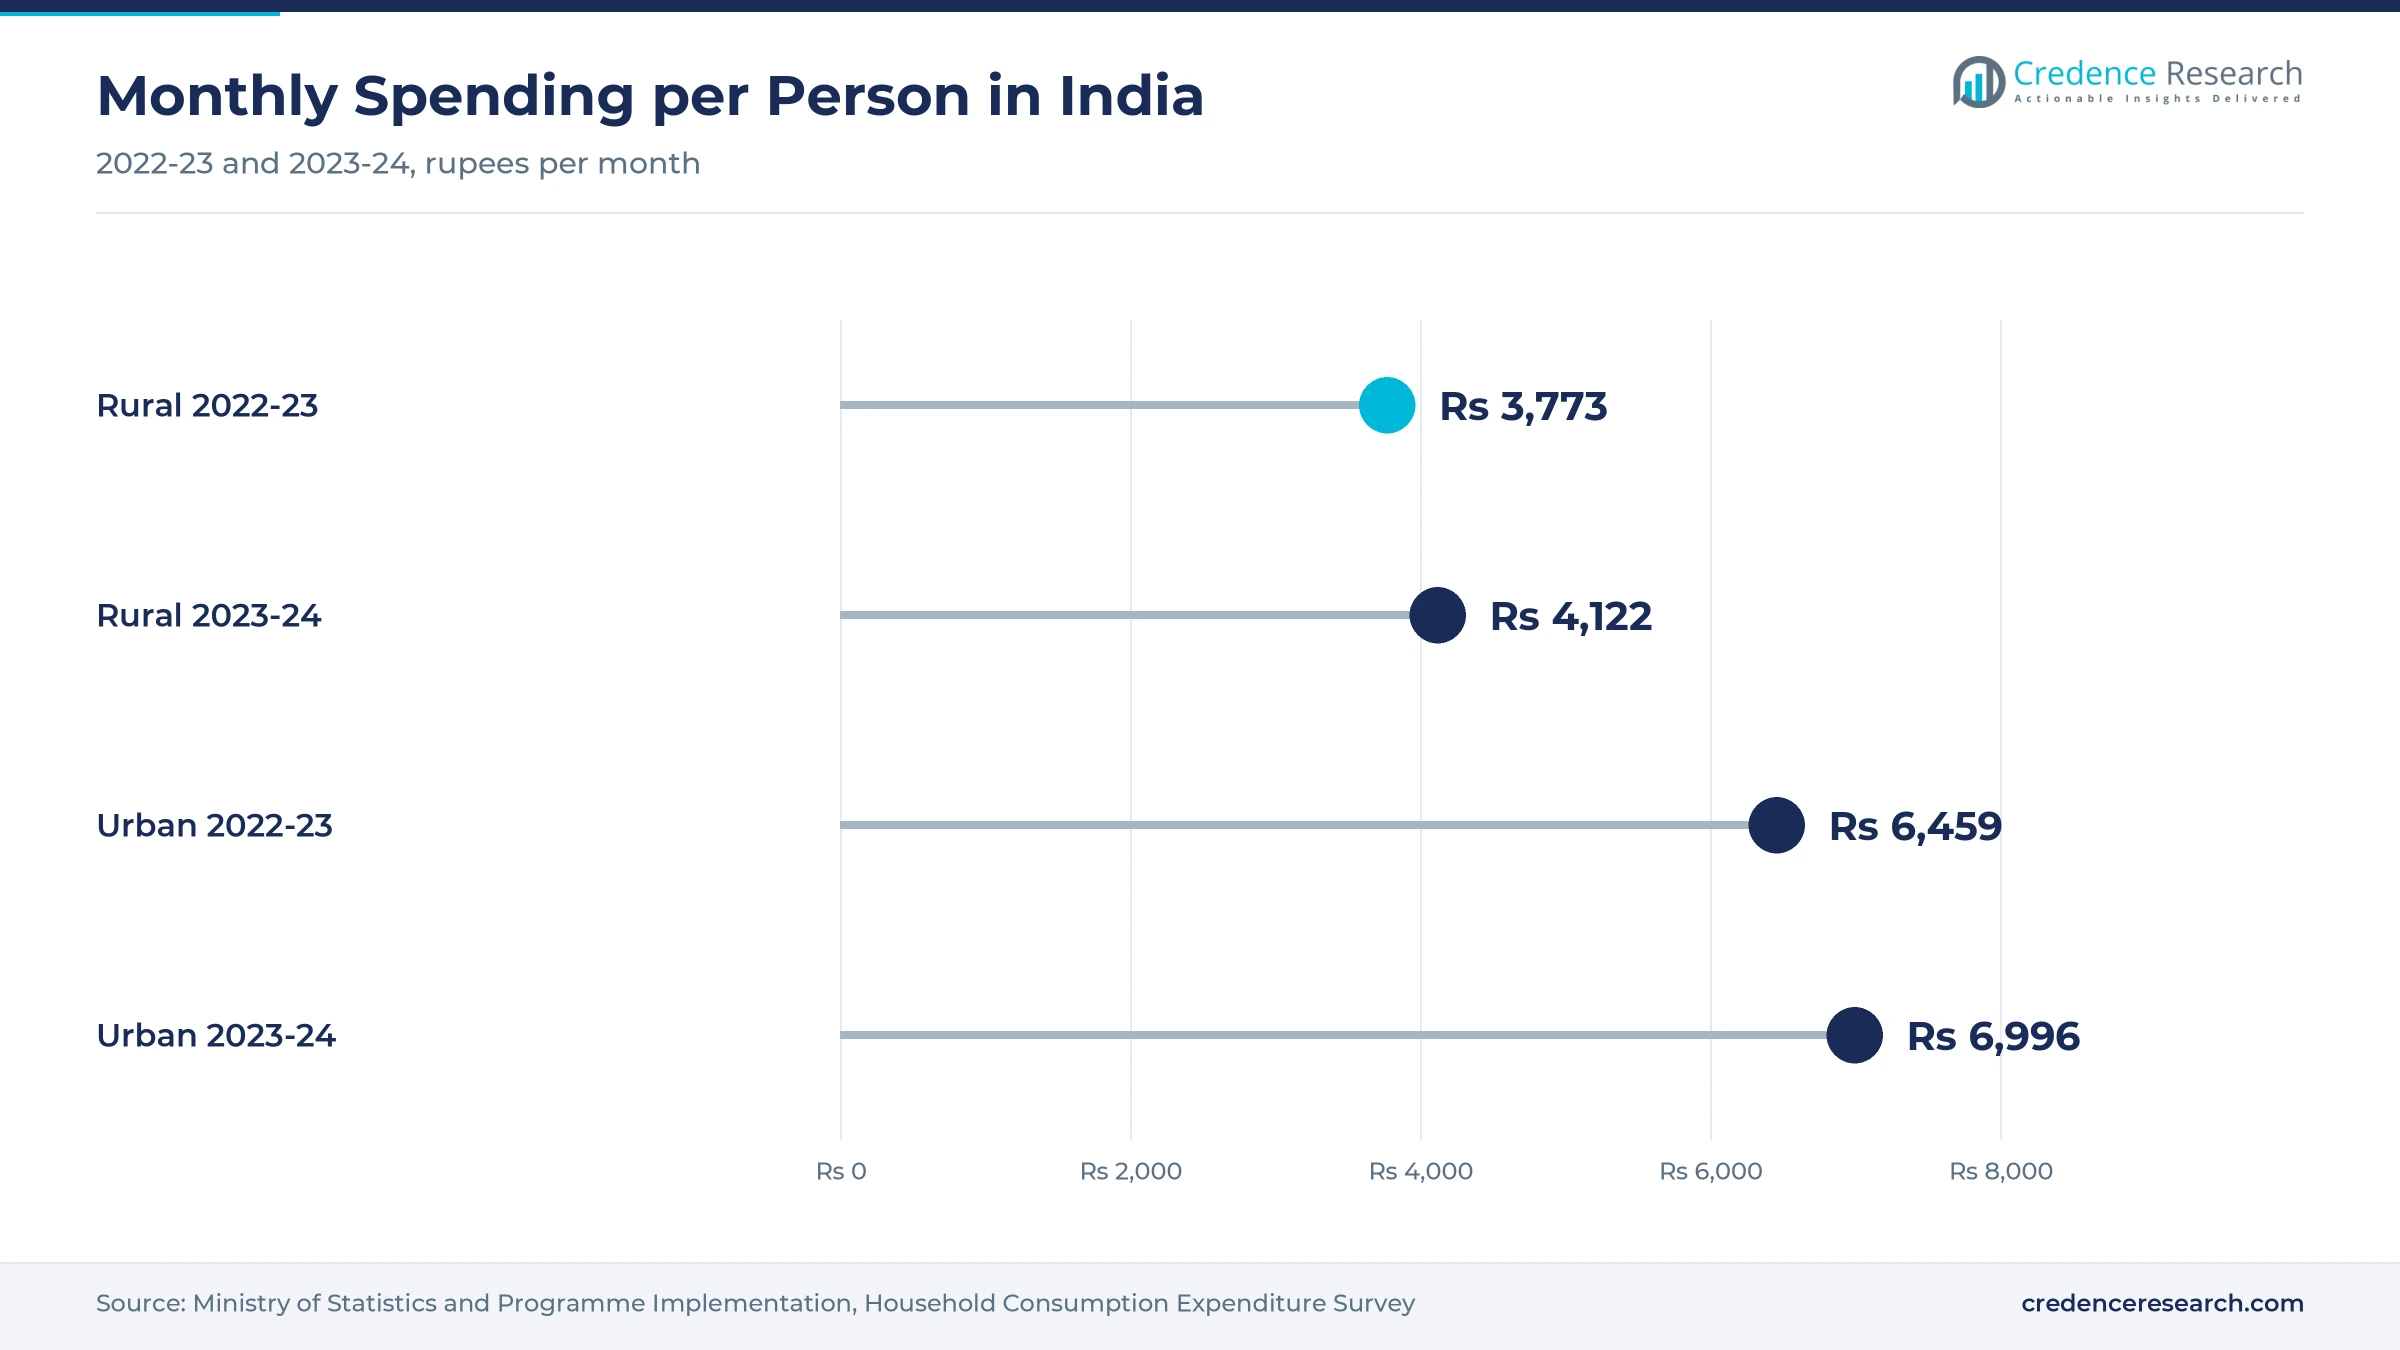
Convenience-led household consumption lifts demand, because busy families now buy ready snacks and bread rather than preparing every meal at home. Average monthly spending per person reached Rs 4,122 in rural India and Rs 6,996 in urban India in 2023-24, according to the Ministry of Statistics. Beverages and processed food took nearly 10% of rural spending and about 11% of urban spending in that survey, the largest food item in both areas. Rural spending also rose from Rs 3,773 a year earlier, which widens the base for low-price packs. As a result, tea-time snacking holds 38.0% of 2025 value, because biscuits and rusks fit daily routines.
Why does steady wheat supply and processing support help makers?
Raw material availability and processing support help makers, because wheat flour is the main input for most baked products. India produced a record 117.94 million metric tons of wheat in 2024-25, up from 113.29 million metric tons in 2023-24, according to final estimates reported by Outlook Business. Foodgrain output also reached a record 357.73 million metric tons, up about 8% from the prior year. The food processing incentive scheme, with an outlay of Rs 10,900 crore, has drawn Rs 9,207 crore of investment across 22 states and created about 3.29 lakh jobs, according to IANS. In turn, makers can expand biscuit and bread lines with more stable flour costs.
How do health and premium products widen the range?
Health focus, premiumization and product innovation widen the range, because buyers want whole grain, millet and lower-sugar options as well as richer cakes. Sales of millet-based products under the food incentive scheme rose from Rs 345.73 crore in fiscal 2023 to Rs 1,845.25 crore in fiscal 2025. Anmol Industries added lighter baked snacks, dense cakes, wafers and bite-sized treats to its range in November 2025, starting at Rs 5 a pack. Specialty bakers in large cities in large cities also add sourdough and gluten-free options for health-minded buyers who read labels closely. As a result, premium products grow at 10.28% a year during 2026–2035.
Why does the GST cut make packaged baked goods cheaper?
The GST cut makes packaged baked goods cheaper, because a lower tax rate lets makers cut prices or add grammage at fixed price points. The GST Council announced in September 2025 that biscuits and pastries would leave the 18% slab from Sept. 22, 2025, and placed Indian breads such as roti and paratha at a nil rate, according to IndBiz. Britannia said in September 2025 that it expected volume growth to rise to high single digits, and possibly double digits, after the change. The company also said that commodity costs had stabilized after three volatile years. In turn, mass economy packs keep 40.0% of 2025 value, because lower taxes protect the Rs 5 and Rs 10 packs that rural buyers prefer.
Quick commerce, millets and new plants reshape supply
How is the rise of quick commerce changing snack buying?
The rise of quick commerce is changing snack buying, because city shoppers now order biscuits, bread and cakes for delivery within minutes. Britannia said in February 2026 that quick commerce was available in more than 250 cities for its products. E-commerce and quick commerce already contribute a high single-digit share of Britannia's sales, and the company announced in February 2026 that it aims to lift that to the early-to-mid teens by fiscal 2027. Larger family packs and premium cakes sell well online, because shoppers add them to grocery baskets. Urban households also spent about 11% of monthly budgets on beverages and processed food in 2023-24. As a result, brand e-commerce and quick commerce grow at 11.10% a year during 2026–2035.
Why is the shift back to fixed price points significant?
The shift back to fixed price points is significant, because most Indian shoppers choose biscuits by coin-value packs rather than weight. Britannia said in February 2026 that roughly 60% to 65% of its portfolio sits at Rs 5 and Rs 10 price points. After the GST cut, some makers moved to odd prices such as Rs 4.45 and Rs 8.90, which won volume in some regions. Britannia returned to its traditional Rs 5 and Rs 10 packs with more grammage. In turn, the mass economy tier stays the largest pool of value, while makers compete on pack weight and taste.
Can new regional plants open eastern and central markets?
New regional plants can open eastern and central markets, because fresh and low-price baked goods are costly to ship over long distances. Anmol Industries runs seven plants, including Dankuni, Hajipur, Bhubaneswar and Guwahati, and is expanding into southern and western states. ITC laid the foundation for a Rs 1,500 crore food and packaging site in Sehore, Madhya Pradesh, in September 2023, an investment that will make Sunfeast biscuits. Bakebest Foods, a subsidiary of Mrs Bectors Food Specialities, began commercial production at Khopoli in Maharashtra on March 31, 2026, according to Investywise. As a result, eastern and central states gain wider access to packaged biscuits and cakes made at nearby plants.
Is premium and celebration baking an opening for makers?
Premium and celebration baking offers an opening for makers, because urban buyers spend more on cakes, cookies and gift boxes for birthdays and festivals. Artisanal and gourmet products grow at a faster pace than mass packs, as cafes add croissants, sourdough and custom cakes to their menus. The Khopoli plant of Bakebest Foods, commissioned in March 2026, has an installed capacity of 36,464 metric tons a year, which supports premium biscuit and cookie supply. Anmol Industries also introduced dense cakes and bite-sized treats in November 2025. Urban monthly spending per person of Rs 6,996 in 2023-24 gives city buyers room to trade up. Cafes also invest in commercial ovens to bake fresh items on site. In turn, celebrations and gifting gain value as buyers trade up to higher-priced products.
Price points, fresh shelf life and local rivals test makers
How do fixed price points squeeze margins?
Fixed price points squeeze margins, because makers cannot easily raise prices on Rs 5 and Rs 10 packs when costs rise. As a result, they cut pack weight, which can upset loyal buyers and invite rival offers. Makers respond with larger packs, new flavors and cost savings in sourcing and plants. In turn, firms with scale and efficient factories protect margins better than small bakers. This gap leaves small makers more exposed when wheat, sugar or edible oil prices rise.
Why does short shelf life limit bread and cake reach?
Short shelf life limits bread and cake reach, because fresh products spoil within days and must be delivered quickly. As a result, bread makers usually serve markets within a few hundred kilometers of each plant, which raises distribution costs. Makers respond with regional plants, better packaging and daily delivery routes. In turn, national brands rely on local partners in distant states. Rusks and biscuits travel better, which is why they dominate shipments to remote towns.
How do regional and unbranded bakers compete on price?
Regional and unbranded bakers compete on price, because small local bakeries sell fresh bread, rusks and cakes at low cost without heavy marketing spending. As a result, national brands struggle to win share in some towns and villages. Brands respond with low-price packs, wider rural distribution and regional flavors. In turn, competition keeps retail prices low across the market. This pressure is strongest for bread, where freshness matters more than brand names.
Why do health concerns pressure sugar and fat content?
Health concerns pressure sugar and fat content, because buyers and regulators pay more attention to labels, refined flour and added sugar. As a result, makers must reformulate popular products without losing taste or raising prices. Makers respond by launching whole grain, millet and lower-sugar ranges across popular brands. In turn, product development costs rise, which favors larger firms with research teams and testing kitchens.
South India leads as eastern and central states catch up
| Region | Value, 2025 (USD billion) | Share, 2025 | CAGR, 2026–2035 |
|---|---|---|---|
| South India | 4.68 | 31.1% | 8.29% |
| North India | 4.12 | 27.4% | 8.59% |
| West India | 3.35 | 22.3% | 8.69% |
| East and Central India | 2.89 | 19.2% | 9.19% |
Why do southern states buy the most baked foods?
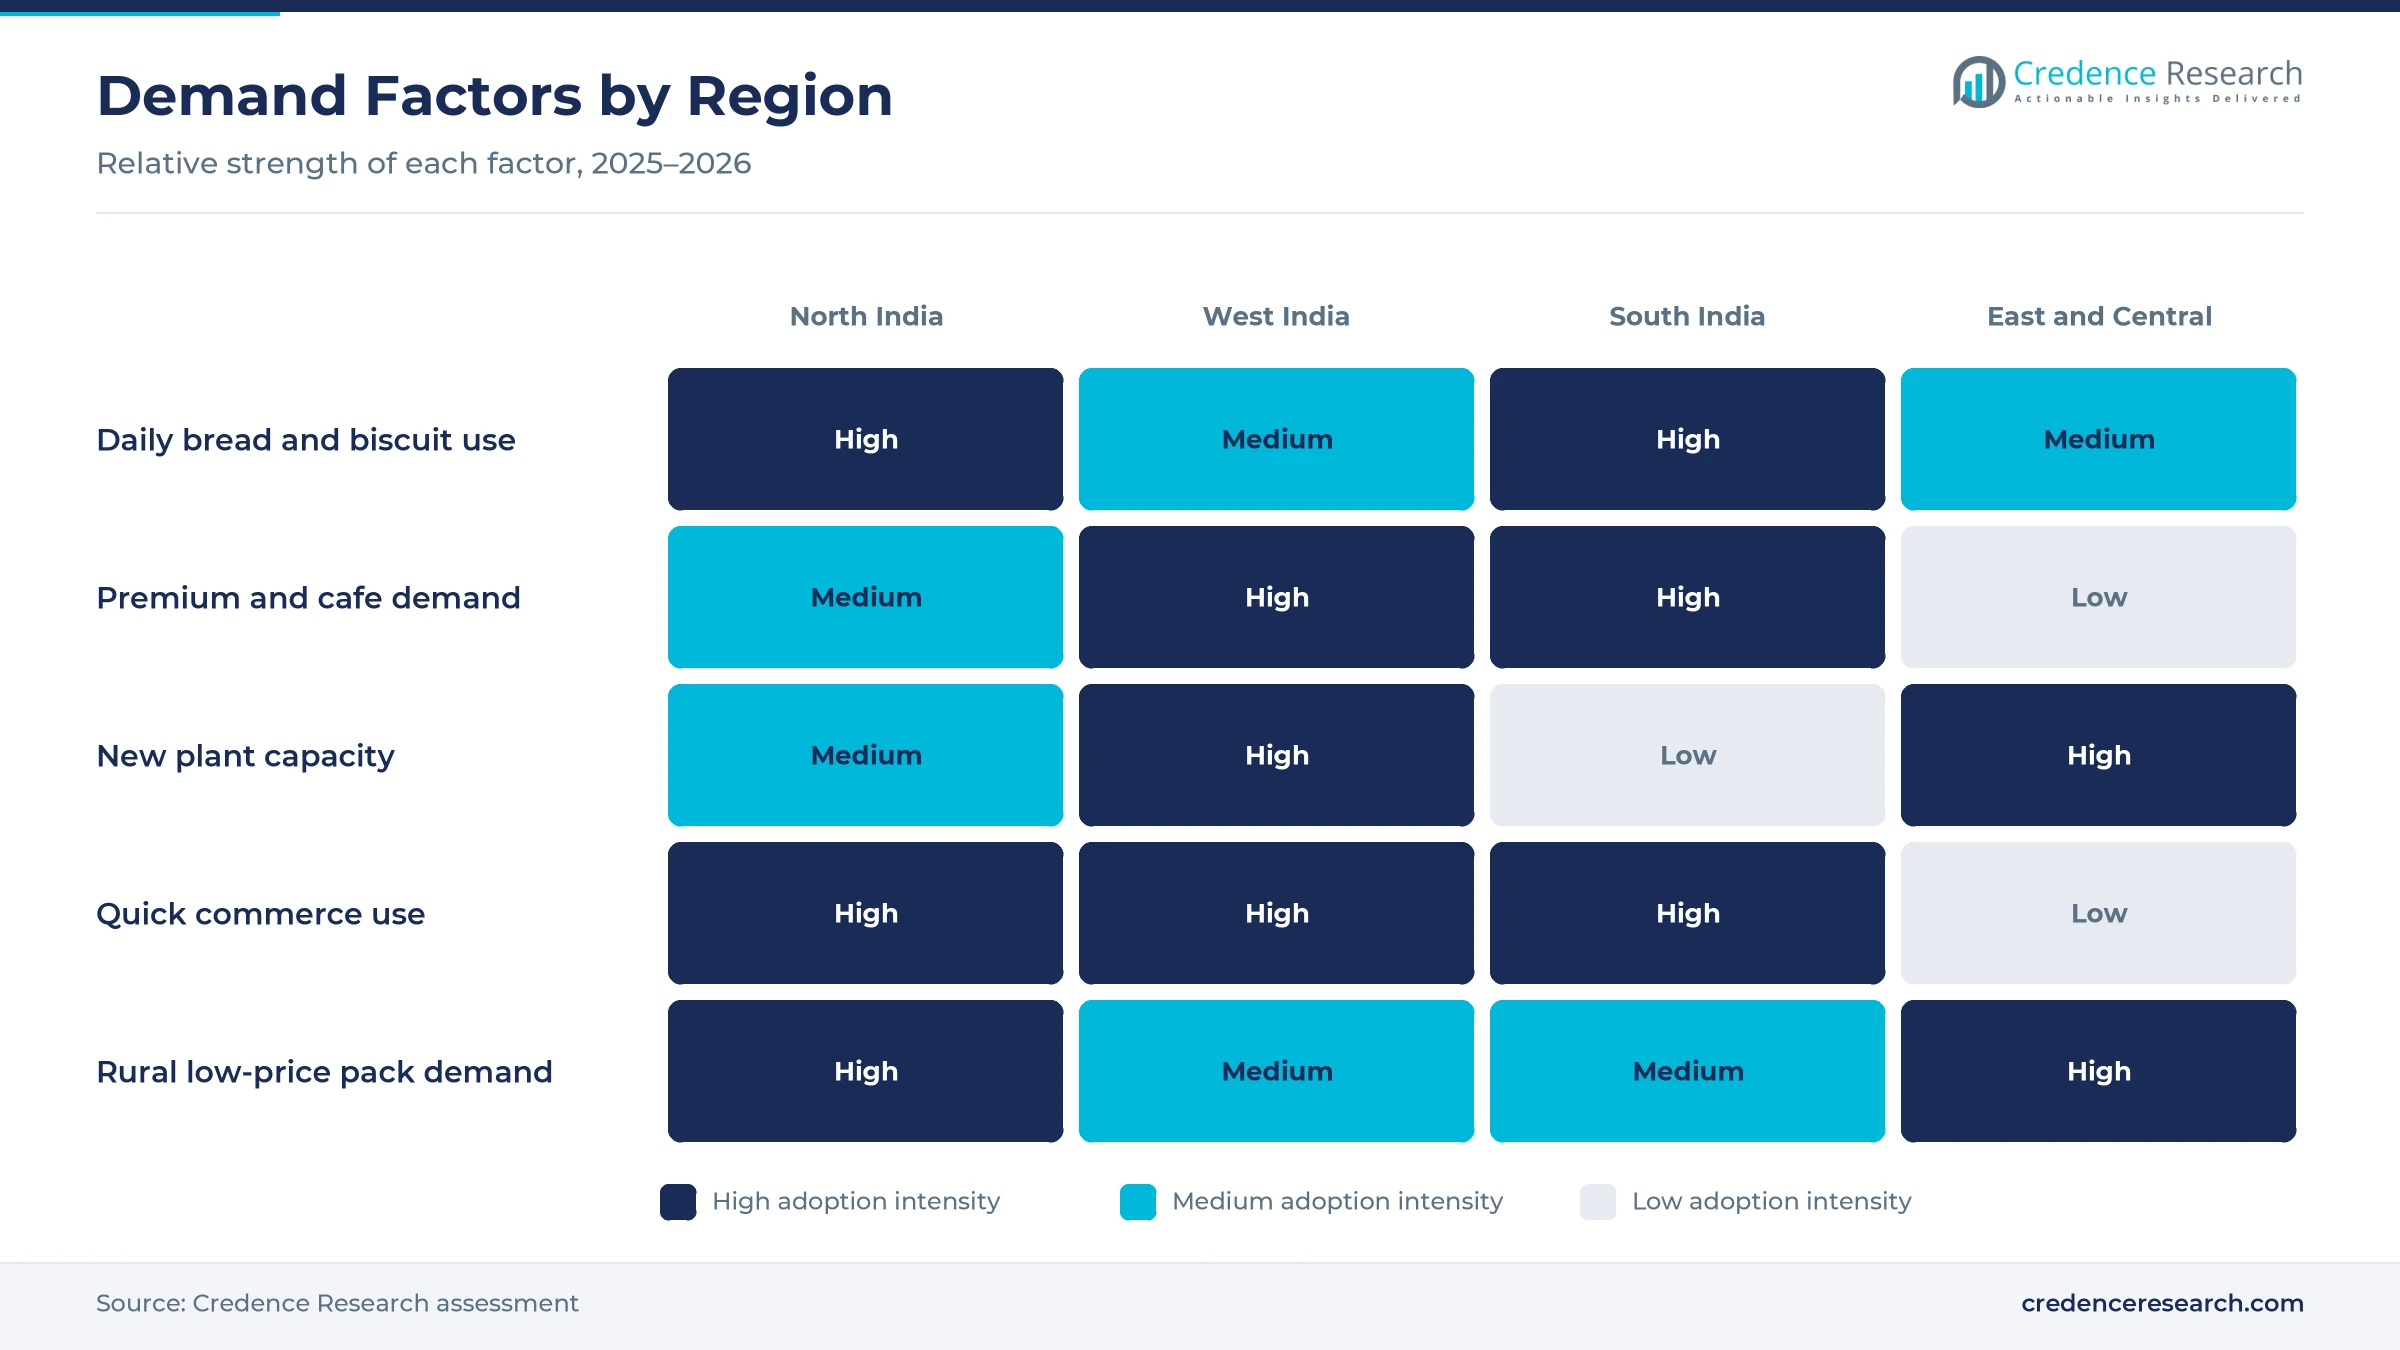
South India held a 31.1% share of 2025 value and grows at 8.29% a year, because households in the southern states buy bread, rusks and biscuits often and retail networks are dense. Urban centers such as Bengaluru, Chennai and Hyderabad also support cafes and premium bakery chains. Anmol Industries is expanding in Andhra Pradesh, Telangana and Karnataka. As a result, the region remains the largest pool of value.
How does North India sustain strong demand?
North India held a 27.4% share of 2025 value and grows at 8.59% a year, because large populations in Uttar Pradesh, Delhi and Punjab buy biscuits and bread every day. Wheat supply from northern states keeps flour close to many plants. Anmol runs plants in Greater Noida and Ghaziabad that serve the region. In turn, the region adds steady volume from both mass and premium products.
How does West India support premium products?
West India held a 22.3% share of 2025 value and grows at 8.69% a year, because Mumbai, Pune and Ahmedabad have many working consumers who buy cakes, cookies and cafe products. Bakebest Foods began production at Khopoli in Maharashtra in March 2026, adding regional supply. Quick commerce apps are also widely used by shoppers in western cities. As a result, premium and on-the-go products sell well in the region.
Why are eastern and central states catching up?
East and Central India held a 19.2% share of 2025 value and grows fastest at 9.19% a year, because rising rural incomes and new plants widen access to packaged baked foods. Anmol runs plants in Dankuni, Hajipur, Bhubaneswar and Guwahati, while ITC is building a food site in Madhya Pradesh. Low-price packs sell strongly in these states, where rural incomes are rising. In turn, the region gains share from a smaller base.
Tax, plant and product milestones from 2025 to 2026
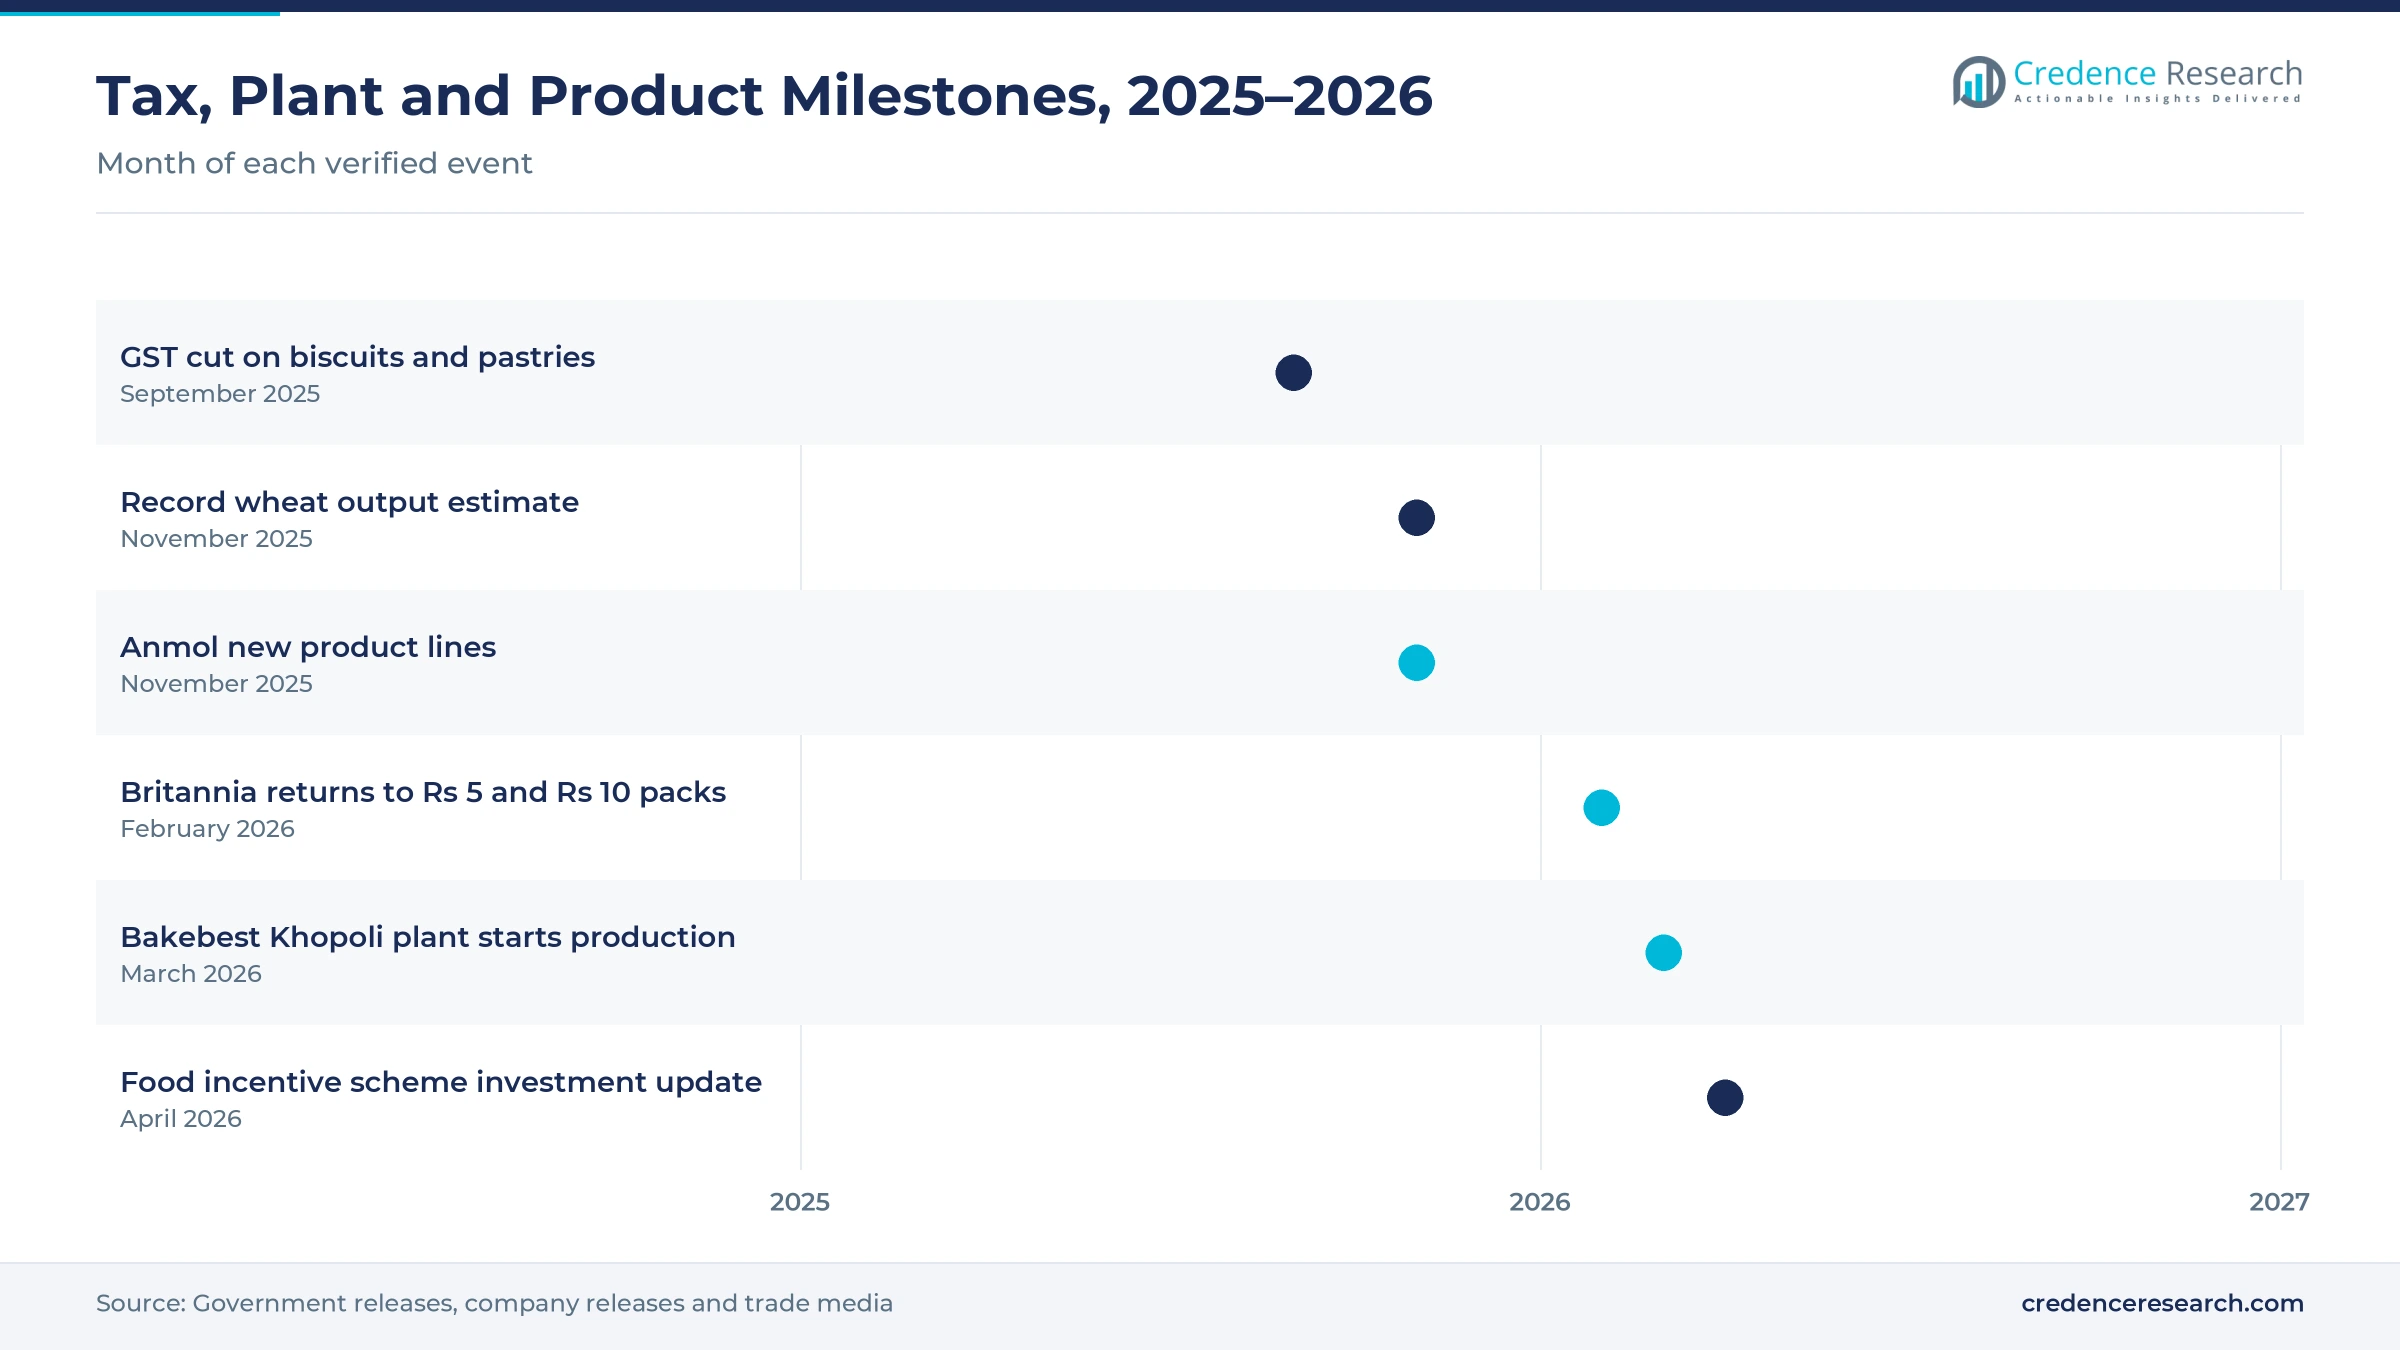
| Development | Status and market relevance |
|---|---|
| In September 2025, the GST Council cut the tax rate on biscuits and pastries from 18% to 5%, effective Sept. 22, 2025. | Lowers shelf prices for packaged baked foods |
| In November 2025, the government released final estimates showing record wheat output of 117.94 million metric tons in 2024-25. | Supports stable flour supply for bakers |
| In November 2025, Anmol Industries announced new lighter baked snacks, dense cakes and wafers while expanding into southern states. | Widens product range and regional reach |
| In February 2026, Britannia said quick commerce was available in more than 250 cities and that it had returned to Rs 5 and Rs 10 packs. | Supports online sales and fixed price points |
| In March 2026, Bakebest Foods, a Mrs. Bectors subsidiary, began commercial production at Khopoli with capacity of 36,464 metric tons a year. | Adds bakery capacity in western India |
High-speed ovens and packaging extend reach and freshness
- High-speed tunnel ovens bake large volumes of biscuits and cookies with steady quality, which lowers cost per pack for mass brands.
- Modified atmosphere packaging keeps bread and cakes fresh for longer, which lets makers reach shops farther from each plant.
- Automated mixing and forming lines control dough weight and shape, which supports exact grammage at fixed Rs 5 and Rs 10 price points.
- Demand planning software links orders from distributors, modern trade and quick commerce, which reduces stale stock and missed deliveries in busy cities.
Need a Custom Version of This Report?
Tailor the scope, geography, or segments to your exact requirements.
- Custom geography or segment scope
- Direct access to our analyst team
National biscuit brands and regional bakers compete
Competition is shaped by national biscuit brands, multinational snack makers, regional bakers and city cake chains. Britannia competes across biscuits, bread, cakes and rusks, with most of its portfolio at Rs 5 and Rs 10 price points and a growing quick commerce presence. ITC competes with Sunfeast biscuits and is building a large food site in Madhya Pradesh. Anmol Industries competes in eastern and northern India from seven plants and is moving into southern states. Mrs Bectors Food Specialities adds premium biscuit supply through its Khopoli plant in Maharashtra. Rivals compete on price points, pack weight, taste, distribution reach and new health-focused products. Because most sales pass through kirana stores, firms with wide rural distribution and efficient plants usually hold the strongest positions.
Which brands and bakers lead Indian baked food sales?
| Company | Type | Role in the market |
|---|---|---|
| Britannia Industries Limited | National packaged food maker | Keeps 60% to 65% of its portfolio at Rs 5 and Rs 10 price points |
| ITC Limited | Diversified consumer goods group | Building a Rs 1,500 crore food and packaging site in Sehore for Sunfeast biscuits |
| Anmol Industries Limited | Regional biscuit and cake maker | Runs seven plants across northern and eastern India |
| Mrs. Bectors Food Specialities Limited | Premium biscuit and bread maker | Started a 36,464-metric-ton Khopoli plant through Bakebest Foods in 2026 |
Credence Research view on Indian packaged baked foods
Credence Research's view is that Indian baked food sales will keep growing steadily because biscuits, bread and cakes fit daily routines in both rural and urban homes. Biscuits and cookies remain the largest value pool, while cakes, premium products and quick commerce add the fastest growth. The GST cut and record wheat output support prices and supply. Makers that combine low-price packs with health-focused and premium ranges should gain the most, while fixed price points and local rivals keep pressure on margins.
How the Indian baked goods estimate was built
The report uses 2025 as the base year on a calendar basis, and market values come from the Credence Research model. That model combines household spending statistics, crop output data, tax rates, incentive scheme data and company releases on plants, products and channels. Regional shares follow the client sheet, while regional growth rates, segment splits and segment growth rates are Credence Research estimates. Sources used are official statistics, government releases and company releases reported in trade media, and no interviews or surveys were used.
Premium cakes and quick commerce add growth to 2035
The India bakery market is expected to reach USD 34.56 billion by 2035, an 8.64% CAGR during 2026–2035, as more households buy packaged snacks, bread and cakes. Growth should be strongest in cakes and pastries, premium products, quick commerce and East and Central India, because these areas gain most from rising incomes, new plants and fast delivery. Lower GST rates and stable wheat supply will support prices, while fixed price points, short shelf life and local rivals could slow some makers.
Frequently Asked Questions
How big is the India bakery market?
Which product type leads Indian baked food sales?
Which region leads the Indian market?
How did the GST change affect baked goods?
Which sales channel is growing fastest?
How does wheat supply affect the market?
Who are the leading companies in the Indian market?
What are the main challenges for bakers in India?
Table of Content
Chapter 1 Market Segmentation
- 1.1 Segmentation Framework
- 1.1.1 Product and Service Classification
- 1.1.2 Application and End-Use Classification
- 1.1.3 Technology and Solution Classification
- 1.1.4 Customer and Distribution Channel Classification
- 1.1.5 Geographic Segmentation
- 1.1.6 Market Segment Definitions and Boundaries
- 1.2 By Product Type
- 1.2.1 Biscuits and Cookies
- 1.2.2 Bread and Buns
- 1.2.3 Cakes and Pastries
- 1.2.4 Rusks
- 1.2.5 Toasted and Savoury Products
- 1.3 By Price Tier
- 1.3.1 Mass Economy
- 1.3.2 Mainstream
- 1.3.3 Premium
- 1.3.4 Artisanal and Gourmet
- 1.4 By Purchase Occasion
- 1.4.1 Daily Breakfast
- 1.4.2 Tea-Time Snacking
- 1.4.3 On-the-Go Consumption
- 1.4.4 Celebrations and Gifting
Chapter 2 Introduction
- 2.1 Report Objectives and Scope
- 2.2 Product Definition and Industry Terminology
- 2.3 Market Inclusions and Exclusions
- 2.4 Research Process
- 2.4.1 Primary Research and Expert Interviews
- 2.4.2 Secondary Research and Source Review
- 2.4.3 Top-Down and Bottom-Up Estimation
- 2.4.4 Data Triangulation and Verification
- 2.5 Market Size Measurement Basis
- 2.5.1 2025: USD 15.04 billion → 2035: USD 34.56 billion
- 2.6 Historical and Forecast Reference Periods
- 2.6.1 Historical Period: 2018-2025
- 2.6.2 Base Year: 2025
- 2.6.3 Forecast Period: 2025-2035
- 2.7 Research Assumptions and Limitations
Chapter 3 Executive Summary
- 3.1 Market Snapshot and Key Findings
- 3.2 Base-Year Market Size, 2025
- 3.3 Forecast Market Size, 2035
- 3.4 Revenue and Volume Growth Outlook
- 3.5 Key Demand and Supply Indicators
- 3.6 Leading Market Segments
- 3.7 Fastest-Growing Market Opportunities
- 3.8 Regional Performance Highlights
- 3.9 Technology and Industry Transformation
- 3.10 Competitive Landscape Summary
- 3.11 Analyst View and Strategic Implications
Chapter 4 India Bakery Market Trends and Developments
- 4.1 Historical Industry Development, 2018-2025
- 4.2 Recent Market Trends and Developments
- 4.3 Demand and Customer Behavior Trends
- 4.4 Technology and Product Innovation
- 4.5 Artificial Intelligence, Automation and Digitalization
- 4.6 Local Manufacturing and Supply Chain Realignment
- 4.7 Industry Partnerships, Mergers and Acquisitions
- 4.8 Sustainability and Circular Economy Developments
- 4.9 Government and Private Sector Investment Trends
- 4.10 Emerging Business Models and Commercialization
- 4.11 Industry Developments and Announcements
Chapter 5 India Bakery Market Production, Supply and Demand Analysis
- 5.1 Demand Trend and Consumption Analysis, 2018-2025
- 5.2 Demand Forecast, 2025-2035
- 5.3 Production and Output Trend, 2018-2025
- 5.4 Production and Output Forecast, 2025-2035
- 5.5 Installed Capacity and Capacity Utilization
- 5.6 Company-Wise Production Plants and Statistics
- 5.6.1 Installed Production Capacity
- 5.6.2 Actual Production
- 5.6.3 Planned Capacity and Expansion Targets
- 5.7 Supply Chain Structure and Procurement Trends
- 5.8 Supply-Demand Gap and Bottlenecks
- 5.9 Import Dependence and Sourcing Structure
- 5.10 Contract Manufacturing and Outsourcing
- 5.11 Regional Supply and Demand Concentration
Chapter 6 India Bakery Market Pricing Analysis
- 6.1 Pricing Structure and Measurement
- 6.2 Historical Pricing Trends, 2018-2025
- 6.3 Pricing Outlook, 2025-2035
- 6.4 Average Selling Price and Unit Economics
- 6.5 Pricing by Product and Market Segment
- 6.6 Geographic Pricing Differences
- 6.7 Key Input, Energy, Labor and Logistics Costs
- 6.8 Contract Pricing and Purchasing Models
- 6.9 Pricing Sensitivity and Competitive Positioning
- 6.10 Price, Margin and Profitability Implications
Chapter 7 India Bakery Market Dynamics
- 7.1 Market Growth Drivers
- 7.1.1 Demand-Side Drivers
- 7.1.2 Technology and Innovation Drivers
- 7.1.3 Infrastructure and Investment Drivers
- 7.1.4 Regulatory and Policy Drivers
- 7.2 Market Restraints
- 7.2.1 Cost and Affordability Constraints
- 7.2.2 Technology and Adoption Barriers
- 7.2.3 Supply Chain and Operational Constraints
- 7.3 Market Challenges
- 7.3.1 Competitive Pressure and Margin Erosion
- 7.3.2 Skills, Infrastructure and Implementation Gaps
- 7.4 Emerging Market Opportunities
- 7.5 Market Dynamics Impact and Time-Horizon Assessment
Chapter 8 India Bakery Value Chain Analysis
- 8.1 Industry Value Chain Overview
- 8.2 Upstream Suppliers and Critical Inputs
- 8.3 Technology and Component Providers
- 8.4 Manufacturing or Service Delivery
- 8.5 Distribution, Channel Partners and Integrators
- 8.6 Downstream Applications and End Users
- 8.7 Value Addition and Profit Pools
- 8.8 Vertical Integration and Outsourcing
- 8.9 Supplier Concentration and Risk
- 8.10 Supply Chain Localization and Resilience
Chapter 9 India Bakery Market Regulations and Policies
- 9.1 Relevant Laws, Standards and Compliance Frameworks
- 9.2 Product, Service, Safety and Quality Requirements
- 9.3 Government Policies, Incentives and Subsidies
- 9.4 Imports, Exports and Trade Barriers
- 9.5 Public Procurement and Local Content Requirements
- 9.6 Environmental and Sustainability Compliance
- 9.7 Upcoming Policy Changes and Market Implications
Chapter 10 India Bakery Market Hotspots and Opportunities
- 10.1 Market Opportunity Mapping and Growth Hotspots
- 10.2 High-Growth Applications and Customer Groups
- 10.3 Underserved Markets and White-Space Opportunities
- 10.4 Emerging Technology and Product Opportunities
- 10.5 New Capacity and Investment Hotspots
- 10.6 Market Entry and Expansion Opportunities
- 10.7 Distribution and Partnership Opportunities
- 10.8 Near-Term and Long-Term Commercial Potential
- 10.9 Opportunity Attractiveness and Execution Risks
Chapter 11 India Bakery Market Outlook, 2025-2035
- 11.1 Market Size and Analysis
- 11.1.1 Revenue (Market Measurement: 2025: USD 15.04 billion → 2035: USD 34.56 billion)
- 11.1.2 Market Volume and Quantity Sold
- 11.1.3 Historical Market Size, 2018-2025
- 11.1.4 Base-Year Market Size, 2025
- 11.2 Market Forecast, 2025-2035
- 11.2.1 Revenue Forecast to 2035
- 11.2.2 Volume Forecast to 2035
- 11.2.3 CAGR and Year-on-Year Growth
- 11.2.4 Incremental Revenue Opportunity
- 11.3 Forecast Assumptions and Scenario Analysis
- 11.3.1 Base-Case Forecast
- 11.3.2 Optimistic and Conservative Scenarios
- 11.3.3 Technology, Pricing and Policy Sensitivities
- 11.4 Market Attractiveness and Growth Outlook
Chapter 12 India Bakery Market Segmentation and Outlook
- 12.1 Segmentation Summary and Market Shares, 2025
- 12.2 Largest and Fastest-Growing Segments
- 12.3 By Product Type - Market Size and Forecast, 2025-2035
- 12.3.1 Segment Definition and Scope
- 12.3.2 Historical Market Size, 2018-2025
- 12.3.3 Revenue Forecast, 2025-2035
- 12.3.4 Volume Forecast, 2025-2035
- 12.3.5 Base-Year Market Share, 2025
- 12.3.6 Segment CAGR and Growth Drivers
- 12.3.7 Subsegment Market Size and Forecast
- 12.3.7.1 Biscuits and Cookies
- 12.3.7.2 Bread and Buns
- 12.3.7.3 Cakes and Pastries
- 12.3.7.4 Rusks
- 12.3.7.5 Toasted and Savoury Products
- 12.3.8 Subsegment Pricing and Adoption Trends
- 12.3.9 Leading Suppliers and Competition
- 12.3.10 Regional Demand and Opportunities
- 12.4 By Price Tier - Market Size and Forecast, 2025-2035
- 12.4.1 Segment Definition and Scope
- 12.4.2 Historical Market Size, 2018-2025
- 12.4.3 Revenue Forecast, 2025-2035
- 12.4.4 Volume Forecast, 2025-2035
- 12.4.5 Base-Year Market Share, 2025
- 12.4.6 Segment CAGR and Growth Drivers
- 12.4.7 Subsegment Market Size and Forecast
- 12.4.7.1 Mass Economy
- 12.4.7.2 Mainstream
- 12.4.7.3 Premium
- 12.4.7.4 Artisanal and Gourmet
- 12.4.8 Subsegment Pricing and Adoption Trends
- 12.4.9 Leading Suppliers and Competition
- 12.4.10 Regional Demand and Opportunities
- 12.5 By Purchase Occasion - Market Size and Forecast, 2025-2035
- 12.5.1 Segment Definition and Scope
- 12.5.2 Historical Market Size, 2018-2025
- 12.5.3 Revenue Forecast, 2025-2035
- 12.5.4 Volume Forecast, 2025-2035
- 12.5.5 Base-Year Market Share, 2025
- 12.5.6 Segment CAGR and Growth Drivers
- 12.5.7 Subsegment Market Size and Forecast
- 12.5.7.1 Daily Breakfast
- 12.5.7.2 Tea-Time Snacking
- 12.5.7.3 On-the-Go Consumption
- 12.5.7.4 Celebrations and Gifting
- 12.5.8 Subsegment Pricing and Adoption Trends
- 12.5.9 Leading Suppliers and Competition
- 12.5.10 Regional Demand and Opportunities
- 12.6 Segment Growth Comparison
- 12.7 Segment Attractiveness and Priority Matrix
Chapter 13 India Bakery Geographic Market Outlook, 2025-2035
- 13.1 Domestic Market Distribution and Demand Clusters
- 13.2 State- or Province-Wise Market Size and Forecast, 2025-2035
- 13.3 City and Metropolitan Market Outlook
- 13.4 Industrial, Manufacturing and Commercial Clusters
- 13.5 Geographic Concentration of Key End Users
- 13.6 Local Pricing and Purchasing Differences
- 13.7 Domestic Production Facilities and Capacity Map
- 13.8 Local Infrastructure and Project Pipeline
- 13.9 State-Level Policy and Incentive Differences
- 13.10 Subnational Investment Hotspots and Opportunities
- 13.11 Distribution and Logistics Networks
- 13.12 Domestic Competitive Footprint
Chapter 14 India Bakery Technology, Innovation and Sustainability Outlook
- 14.1 Technology Landscape and Maturity
- 14.2 Product, Process and Service Innovation
- 14.3 AI, Automation and Digital Tools in the Industry
- 14.4 Technology Adoption and Performance Benchmarking
- 14.5 Innovation Pipeline and R&D Investment
- 14.6 Patent and Intellectual Property Trends
- 14.7 Energy Efficiency and Resource Management
- 14.8 Sustainability, Recycling and Circularity
- 14.9 Technology Roadmap, 2025-2035
- 14.10 Risks of Obsolescence and Technology Substitution
Chapter 15 India Bakery Market Key Strategic Imperatives
- 15.1 Growth and Market Entry Priorities
- 15.2 High-Return Products and Segments
- 15.3 Pricing, Profitability and Cost Optimization
- 15.4 Technology Investment and Product Differentiation
- 15.5 Supply Chain Localization and Resilience
- 15.6 Distribution and Customer Acquisition
- 15.7 Partnership, Acquisition and Capacity Strategy
- 15.8 Regional Expansion Priorities
- 15.9 Short-, Medium- and Long-Term Actions
Chapter 16 Competition Outlook
- 16.1 Industry Competition Characteristics
- 16.2 Market Structure and Concentration
- 16.3 Market Share and Competitive Positioning, 2025
- 16.4 Company-Wise Revenue and Product Benchmarking
- 16.5 Production and Service Capacity Benchmarking
- 16.6 Technology, Pricing and Differentiation
- 16.7 Regional Footprint and Distribution Strength
- 16.8 Mergers, Acquisitions and Strategic Alliances
- 16.9 New Entrants and Competitive Threats
- 16.10 Porter's Five Forces and Industry Attractiveness
- 16.11 Competitive Outlook, 2025-2035
Chapter 17 Company Profiles
- 17.1 Company Coverage and Selection Criteria
- 17.2 Britannia Industries Limited
- 17.2.1 Business Description
- 17.2.2 Company Ownership and Geographic Presence
- 17.2.3 Product and Service Portfolio
- 17.2.4 Manufacturing and Operating Footprint
- 17.2.5 Production Capacity and Expansion Plans
- 17.2.6 Financial Performance and Investment
- 17.2.7 Market Share and Competitive Position
- 17.2.8 Technology and Innovation Capabilities
- 17.2.9 Strategic Alliances or Partnerships
- 17.2.10 Recent Developments
- 17.2.11 Growth Strategy and Outlook
- 17.3 Parle Products Private Limited
- 17.4 ITC Limited
- 17.5 Mondelez India Foods Private Limited
- 17.6 Anmol Industries Limited
- 17.7 Mrs. Bectors Food Specialities Limited
- 17.8 Surya Food & Agro Limited
- 17.9 Bonn Nutrients Private Limited
- 17.10 Bimbo Bakeries India Private Limited
- 17.11 Monginis Foods Private Limited
- 17.12 Other Relevant Market Participants
Note: Every listed company is profiled on the structure shown under the first company. The company list is preliminary and may change based on research findings, market developments, data availability and client requirements.
Chapter 18 Disclaimer
- 18.1 Research and Forecast Disclaimer
- 18.2 Data Source and Estimation Limitations
Note: The depth of individual sections depends on data availability for this market. Volume, capacity, trade and other unit-based metrics are included where applicable.

