
Café habits and premium home brewing shape demand
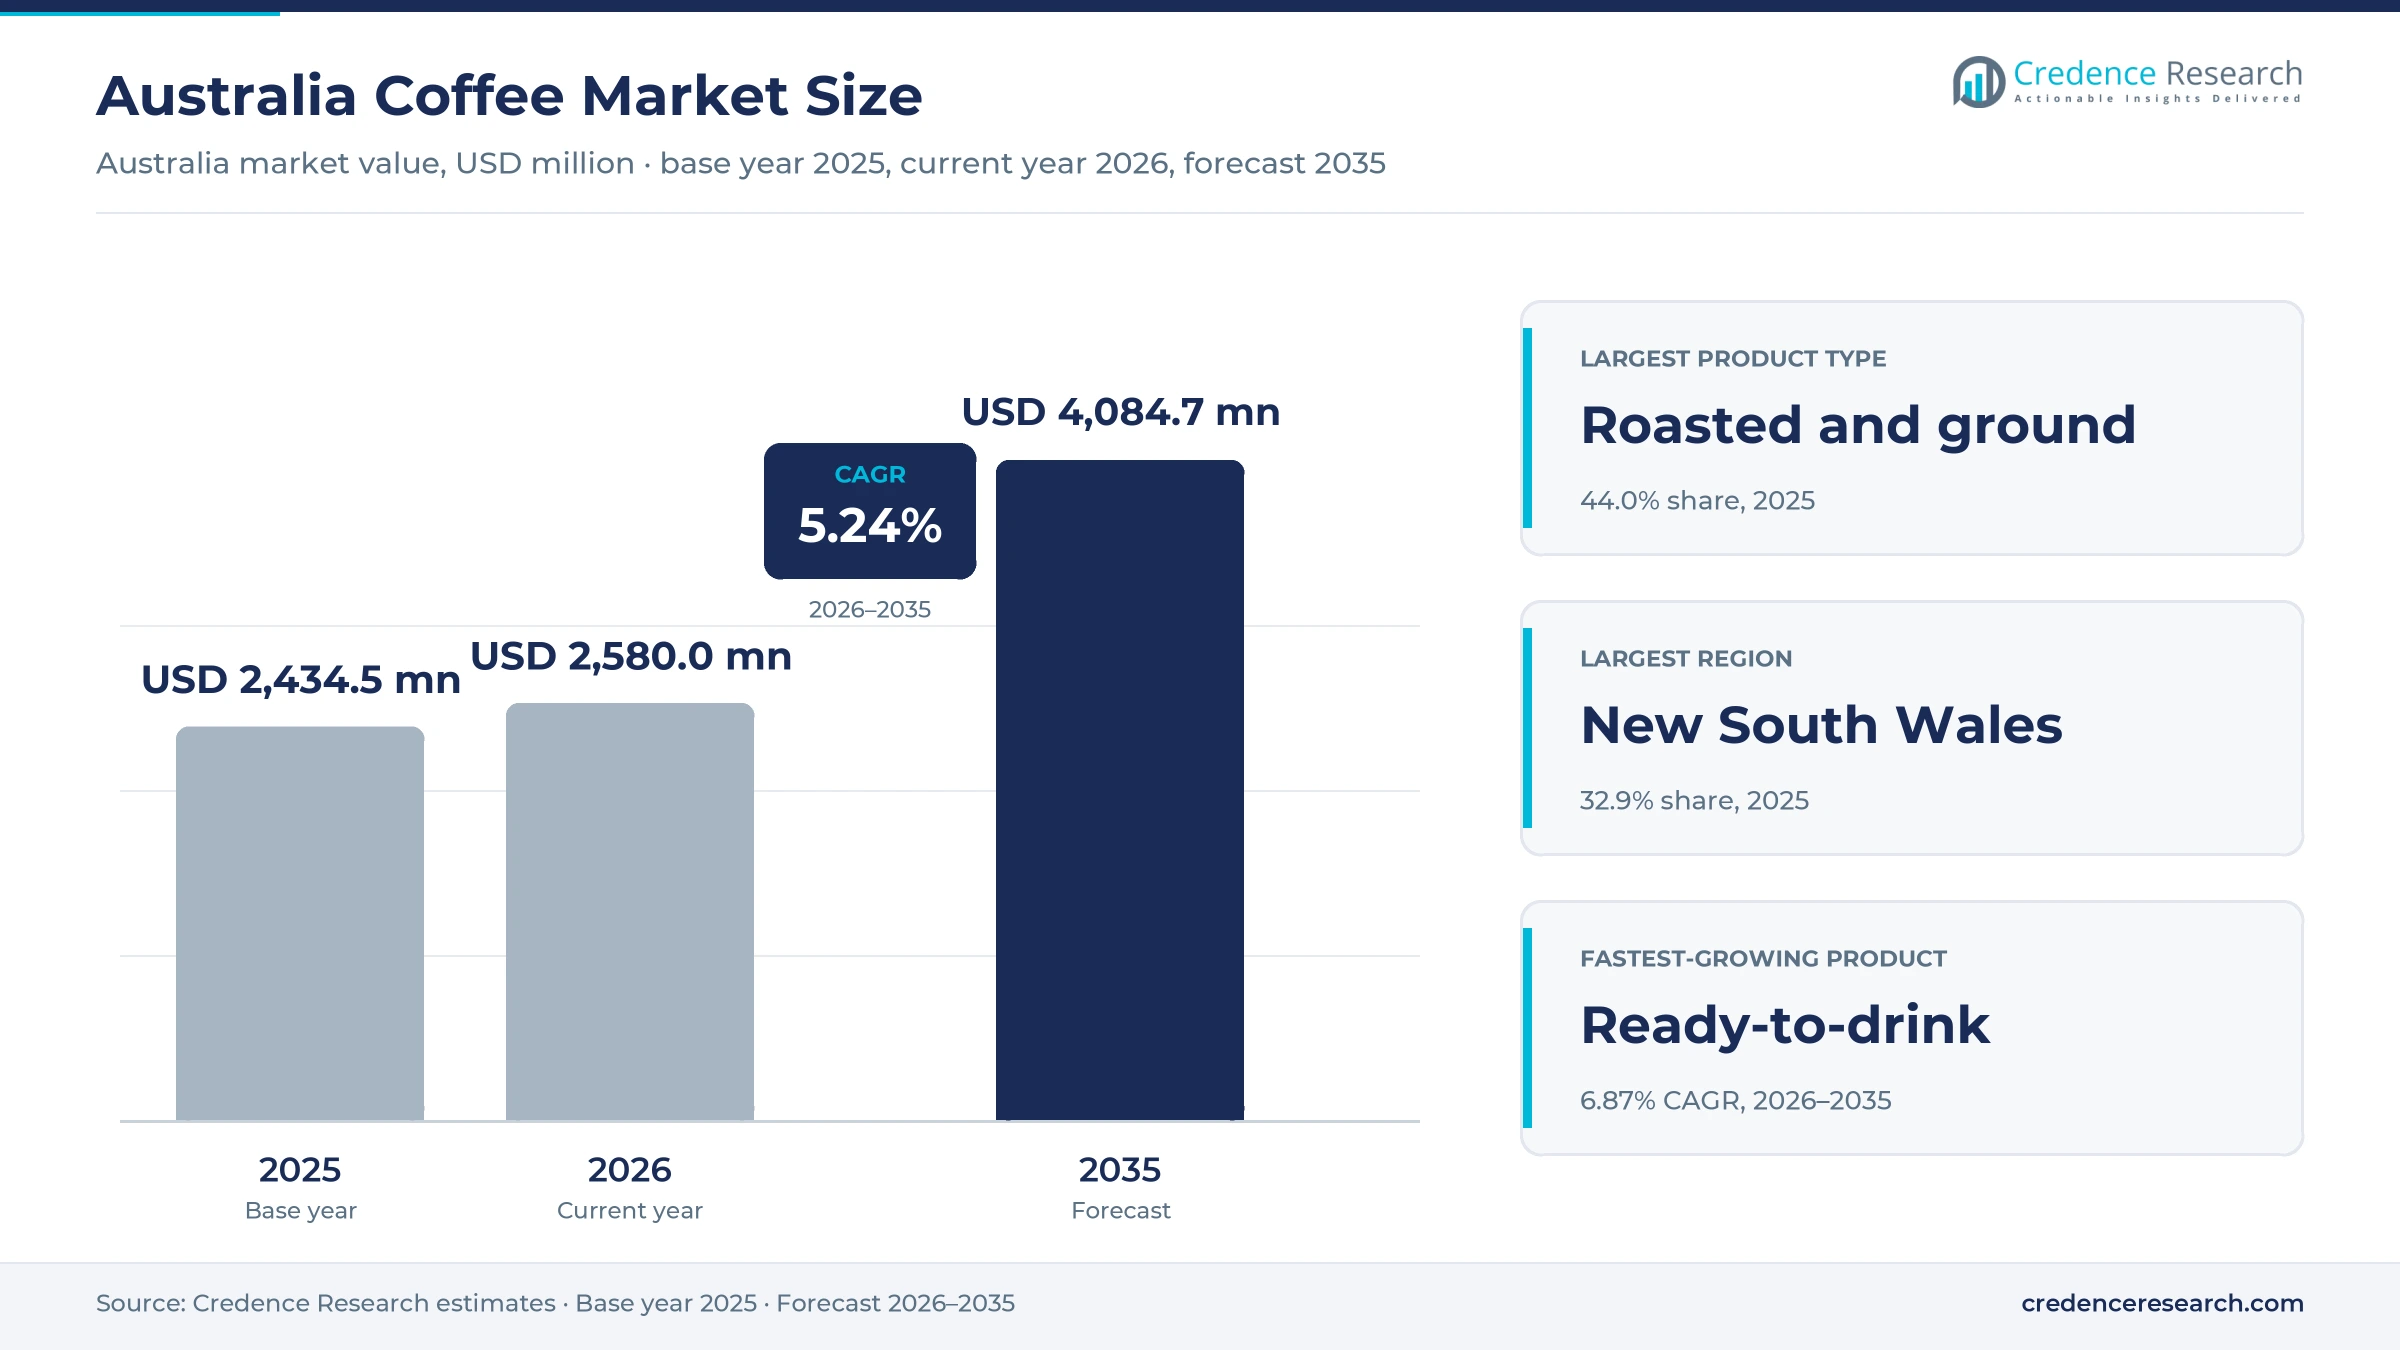
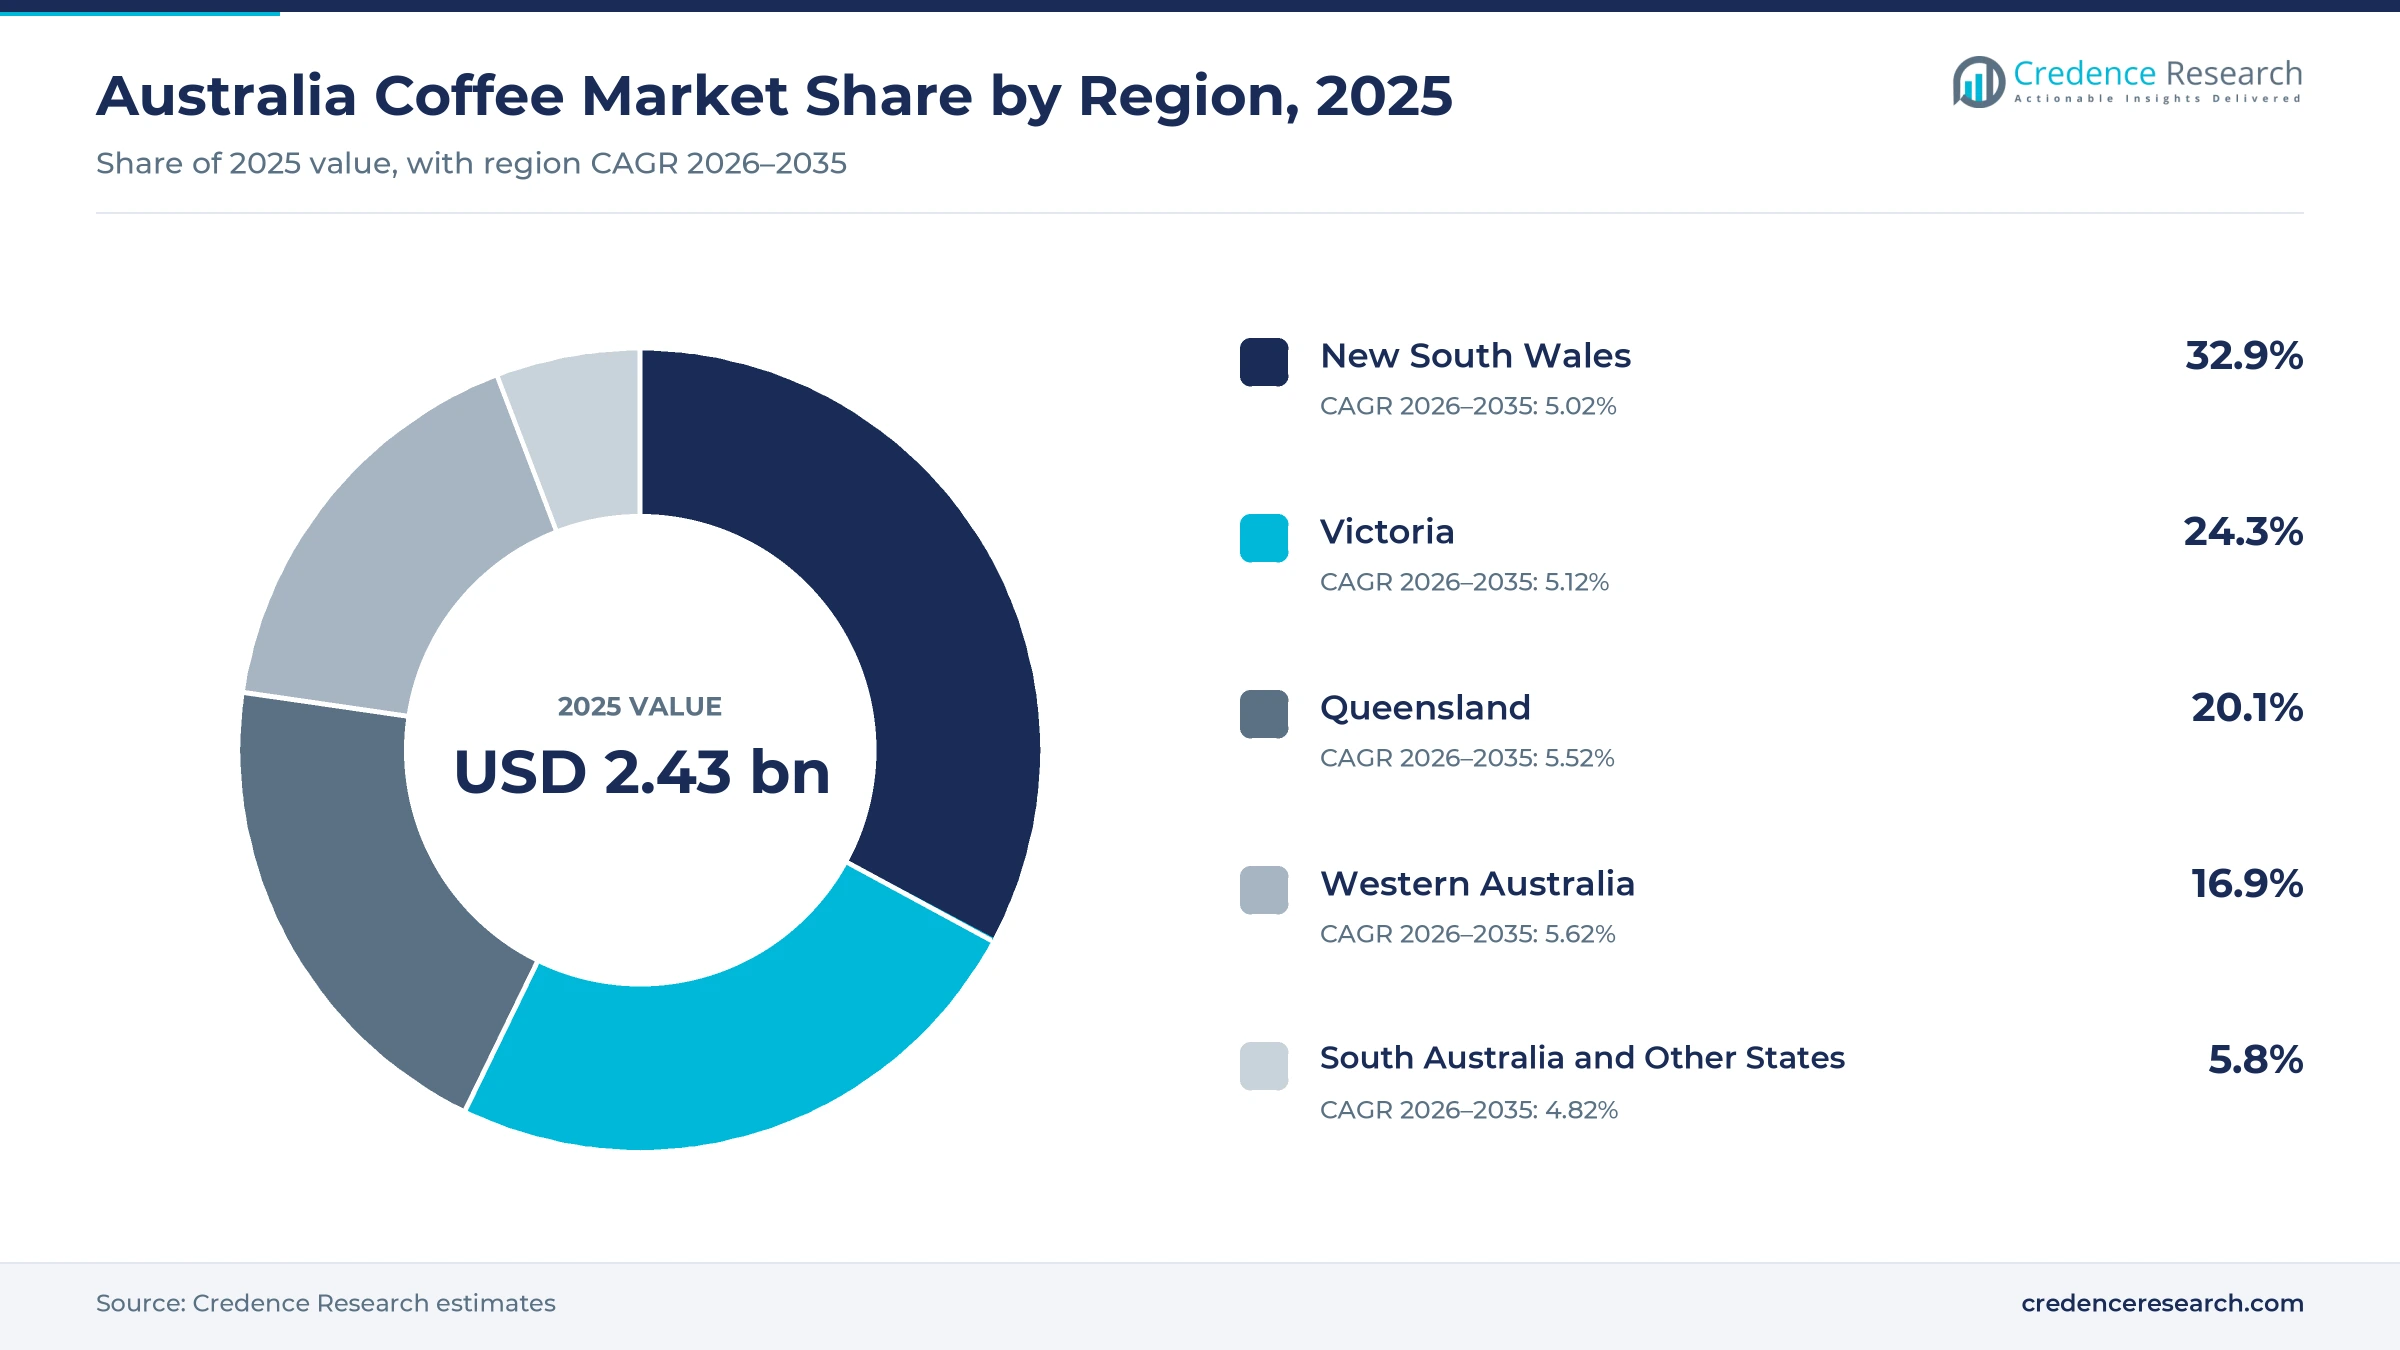
The Australia coffee market was valued at USD 2.43 billion in 2025 and is projected to increase from USD 2.58 billion in 2026 to USD 4.08 billion by 2035, registering a CAGR of 5.24% during 2026–2035. Demand comes from households that brew instant, ground and capsule products at home, and from cafés, workplaces and travel outlets that serve espresso drinks throughout the day. New South Wales held the largest regional share, 32.9% in 2025, because Sydney has the biggest population and the densest café network in the country. Western Australia is the fastest-growing region at 5.62% a year, as the state adds residents faster than any other. However, record green bean prices in early 2025 and higher café prices pushed many drinkers toward premium instant coffee and capsules at home, which changed how roasters and brand owners plan their ranges.
Which coffee products and outlets does the estimate cover?
The estimate measures the value of coffee sold in Australia, including roasted and ground coffee, instant coffee, pods and capsules and ready-to-drink coffee in cans, bottles and cartons. It counts coffee bought by households, cafés, workplaces and hospitality operators through supermarkets, foodservice suppliers, convenience stores, online stores and specialty retailers.
The estimate excludes coffee machines, grinders, milk and other café ingredients, as well as the labor and rent built into a café cup price. The value chain runs from imported green beans through local roasters, soluble coffee plants and bottlers to distributors, retailers, cafés and consumers in each state.
Australia Coffee Market Insights
- The Australia coffee market was valued at USD 2.43 billion in 2025 and is projected to reach USD 4.08 billion by 2035, registering a CAGR of 5.24% during 2026–2035.
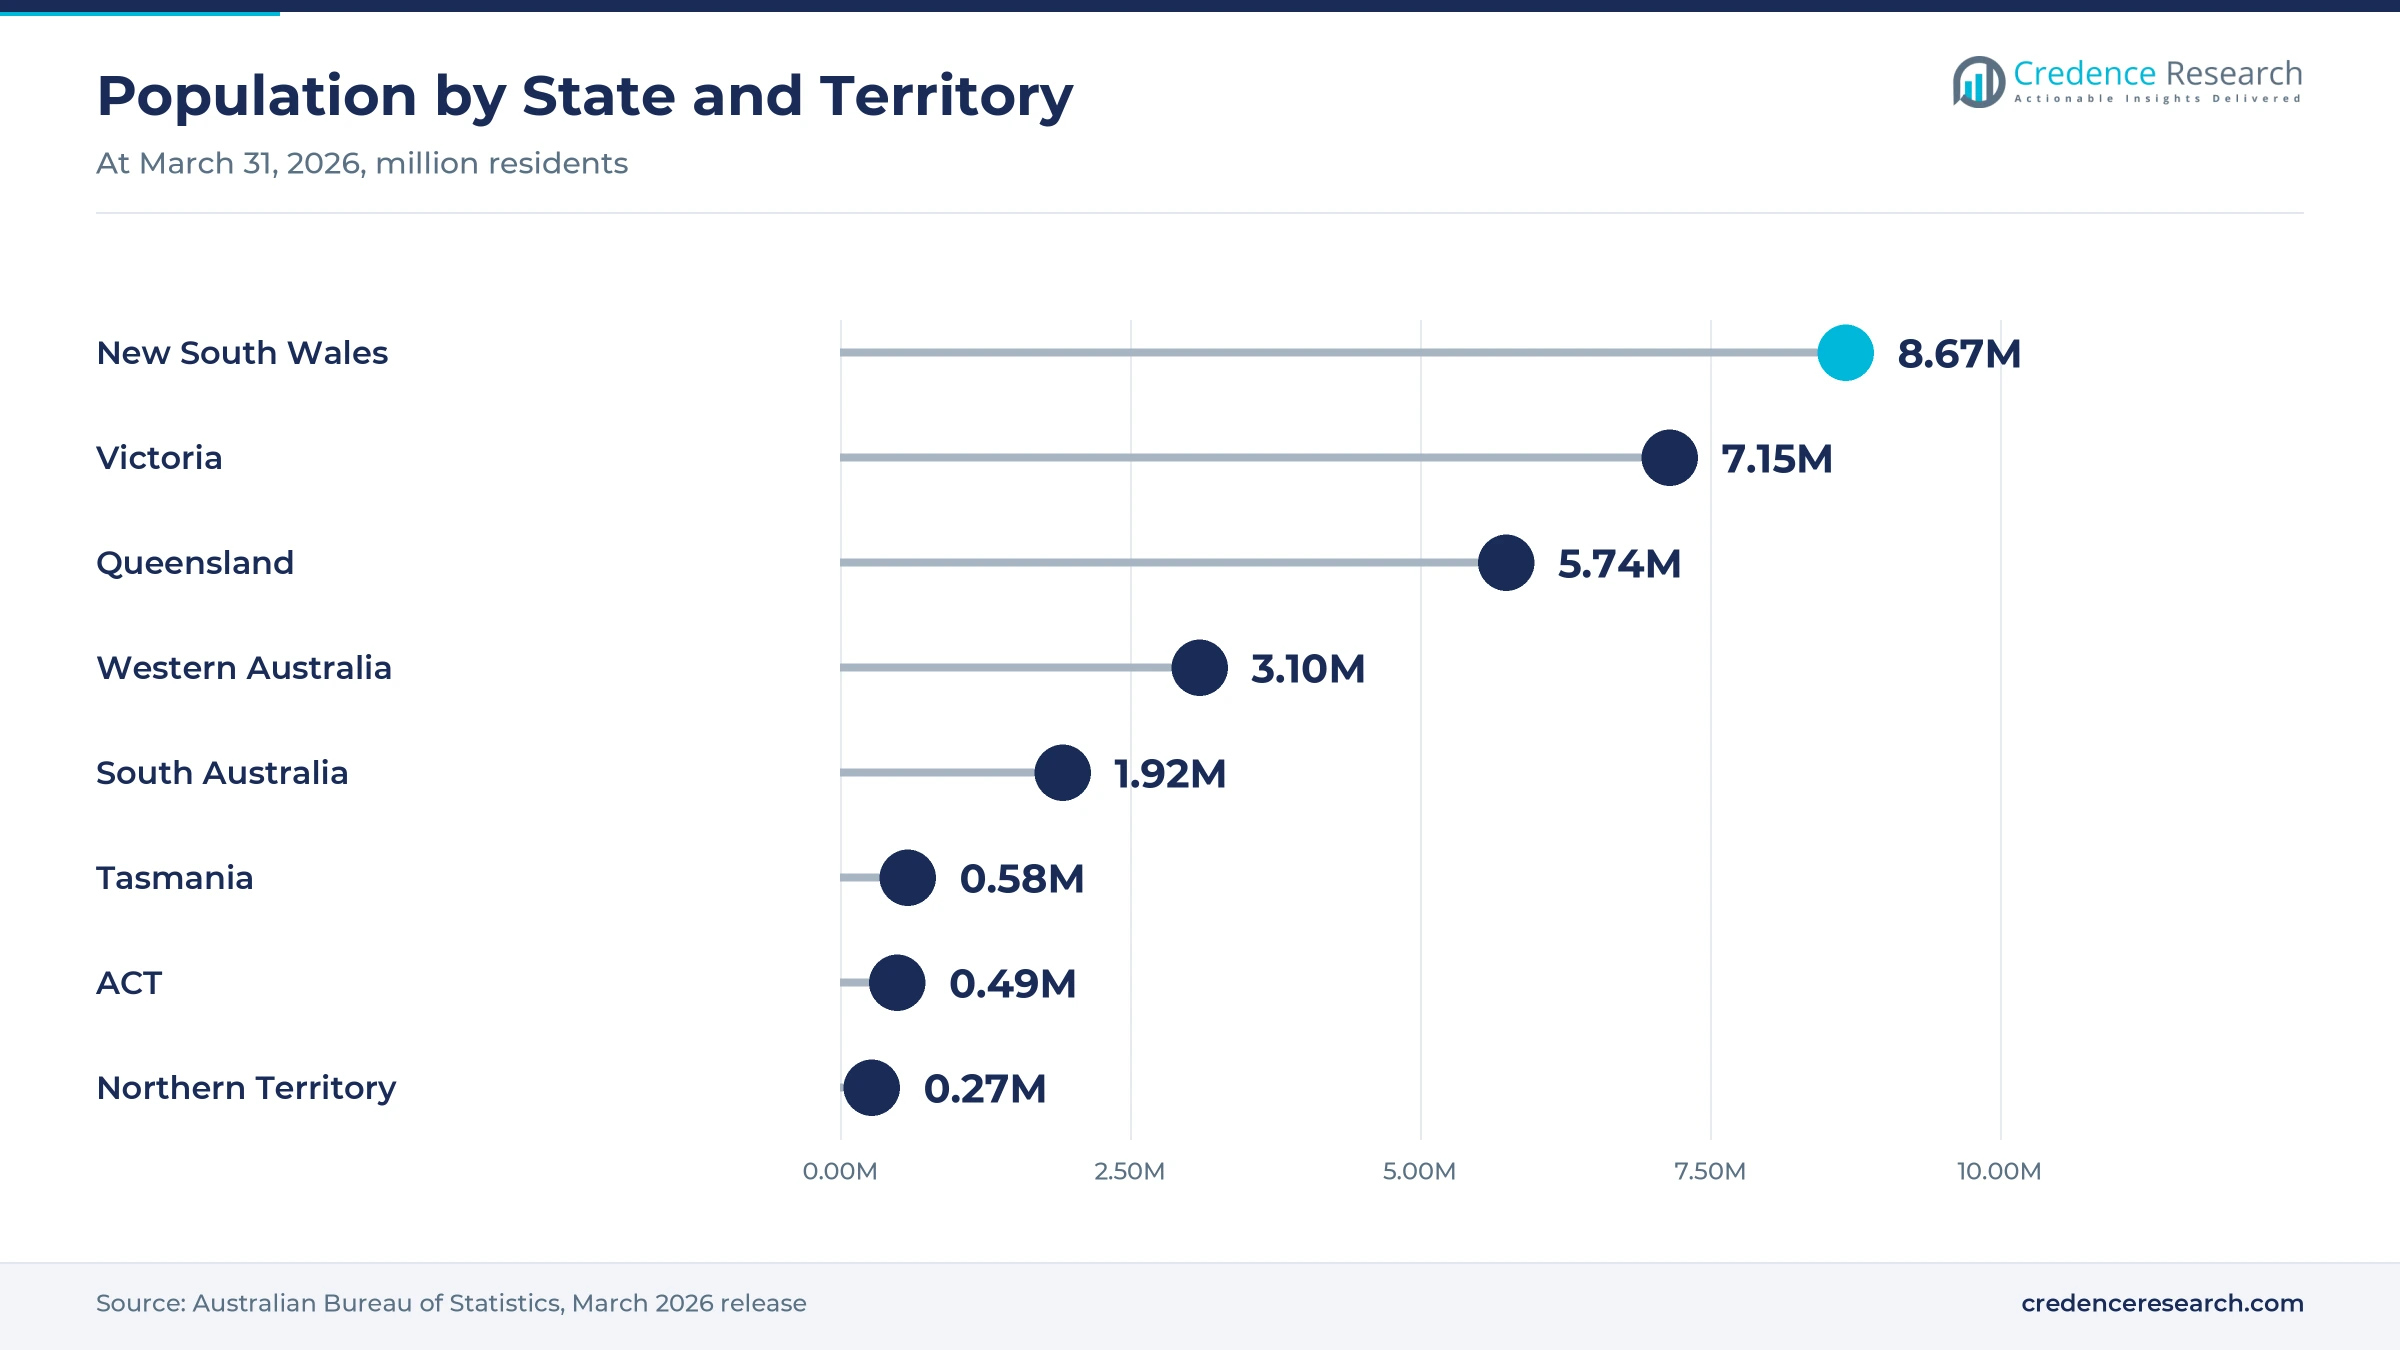
- New South Wales held a 32.9% share of 2025 value, because the state had 8.67 million residents at March 31, 2026, the most of any state.
- Roasted and ground coffee led with a 44.0% share of 2025 value, because cafés and home espresso users buy beans and ground blends every week.
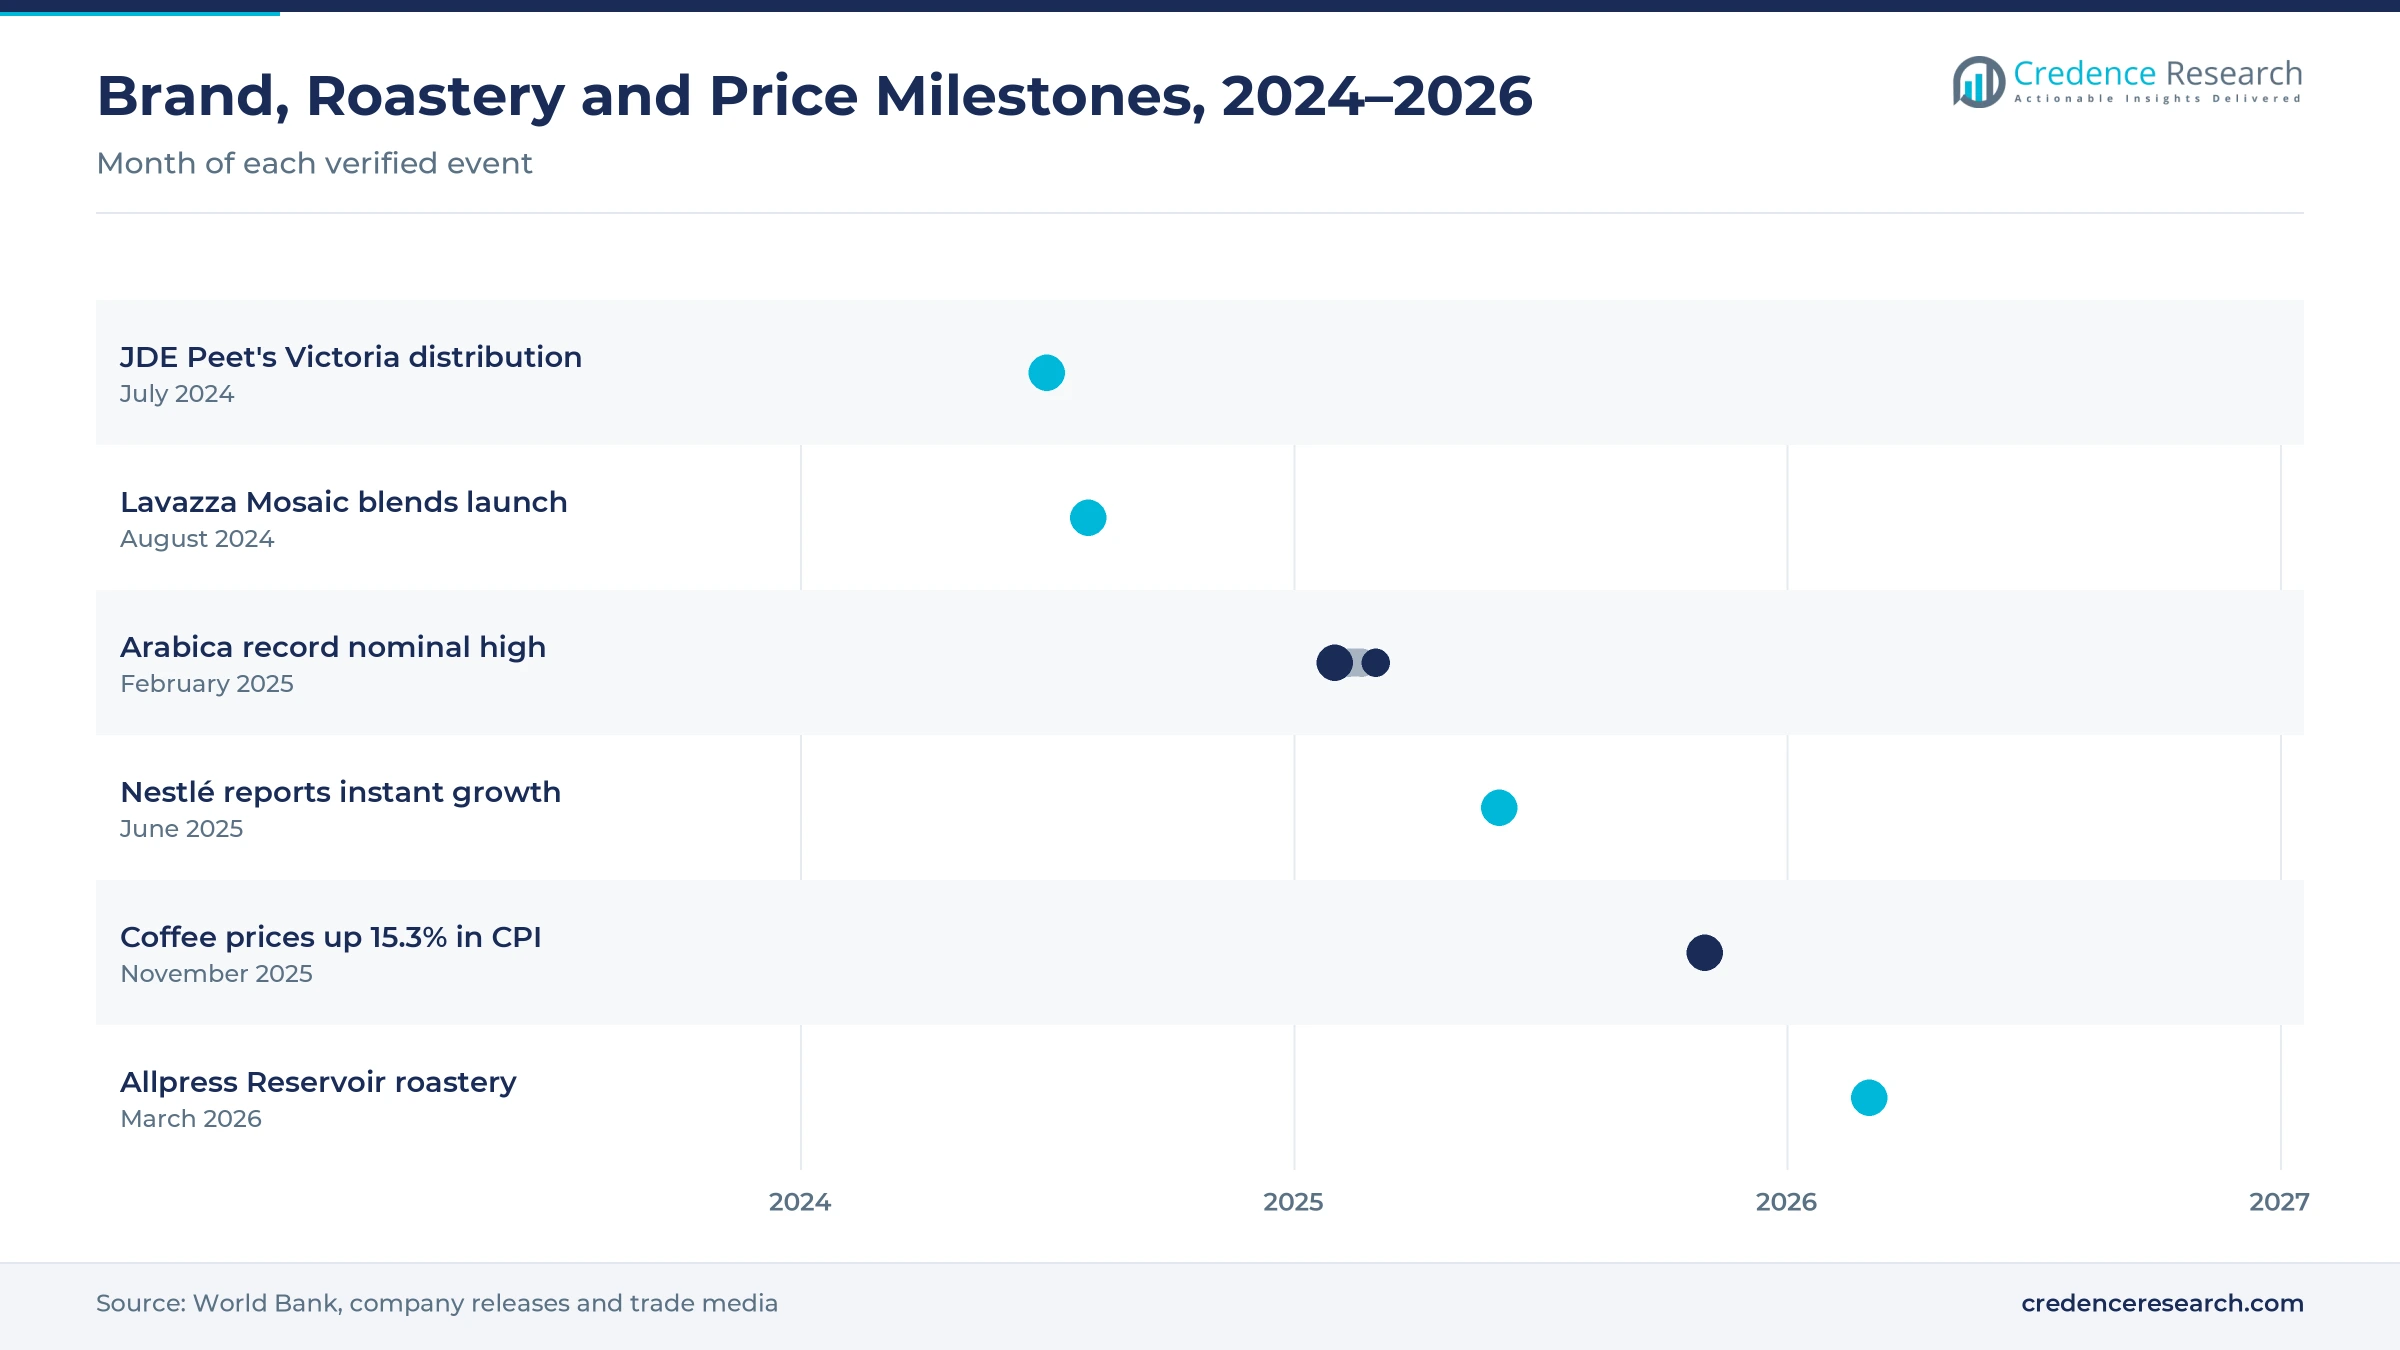
- Arabica prices reached about US$9 per kilogram in February and March 2025, a record nominal high that lifted shelf and café prices across Australia.
- Ready-to-drink coffee grows fastest at 6.87% a year during 2026–2035, as iced coffee in cans, bottles and cartons gains space in convenience stores.
Roasted and ground leads while ready-to-drink grows fastest
Why does roasted and ground coffee hold the largest value?
Based on product type, the market is categorized into instant coffee, roasted and ground coffee, coffee pods and capsules, and ready-to-drink coffee. Roasted and Ground Coffee led with a 44.0% share of 2025 value, because cafés and home espresso users buy whole beans and ground blends every week. Ready-to-Drink Coffee grows fastest at 6.87% a year, as iced coffee in cans, bottles and cartons wins shelf space in convenience stores and supermarkets.
How do households and cafés split coffee spending?
Based on customer type, the market is categorized into household consumers, cafés and coffee shops, workplaces and institutions, and hospitality and travel operators. Household Consumers led with a 46.0% share of 2025 value, because most Australians make at least part of their daily coffee at home. Hospitality and Travel Operators grow fastest at 5.75% a year, as hotels, airports and events add branded espresso service for returning travelers.
Which channels move the most coffee?
Based on distribution channel, the market is categorized into supermarkets and hypermarkets, cafés and foodservice, convenience and petrol retail, e-commerce and subscriptions, and specialty coffee retail. Supermarkets and Hypermarkets led with a 38.0% share of 2025 value, because they stock instant, ground, capsule and iced products in one weekly shop. E-Commerce and Subscriptions grow fastest at 6.92% a year, as roasters sell beans by subscription.
| Segment Group | Leading Sub-segment | Share, 2025 | Fastest-growing Sub-segment | CAGR, 2026–2035 |
|---|---|---|---|---|
| By Product Type | Roasted and Ground Coffee | 44.0% | Ready-to-Drink Coffee | 6.87% |
| By Customer Type | Household Consumers | 46.0% | Hospitality and Travel Operators | 5.75% |
| By Distribution Channel | Supermarkets and Hypermarkets | 38.0% | E-Commerce and Subscriptions | 6.92% |
Request a Free Sample
Fill in your details and we'll send you a free sample report.
- Sample data tables & charts
- Research methodology
Premium home brewing and a dense café network lift sales
How does premium home brewing lift coffee spending?
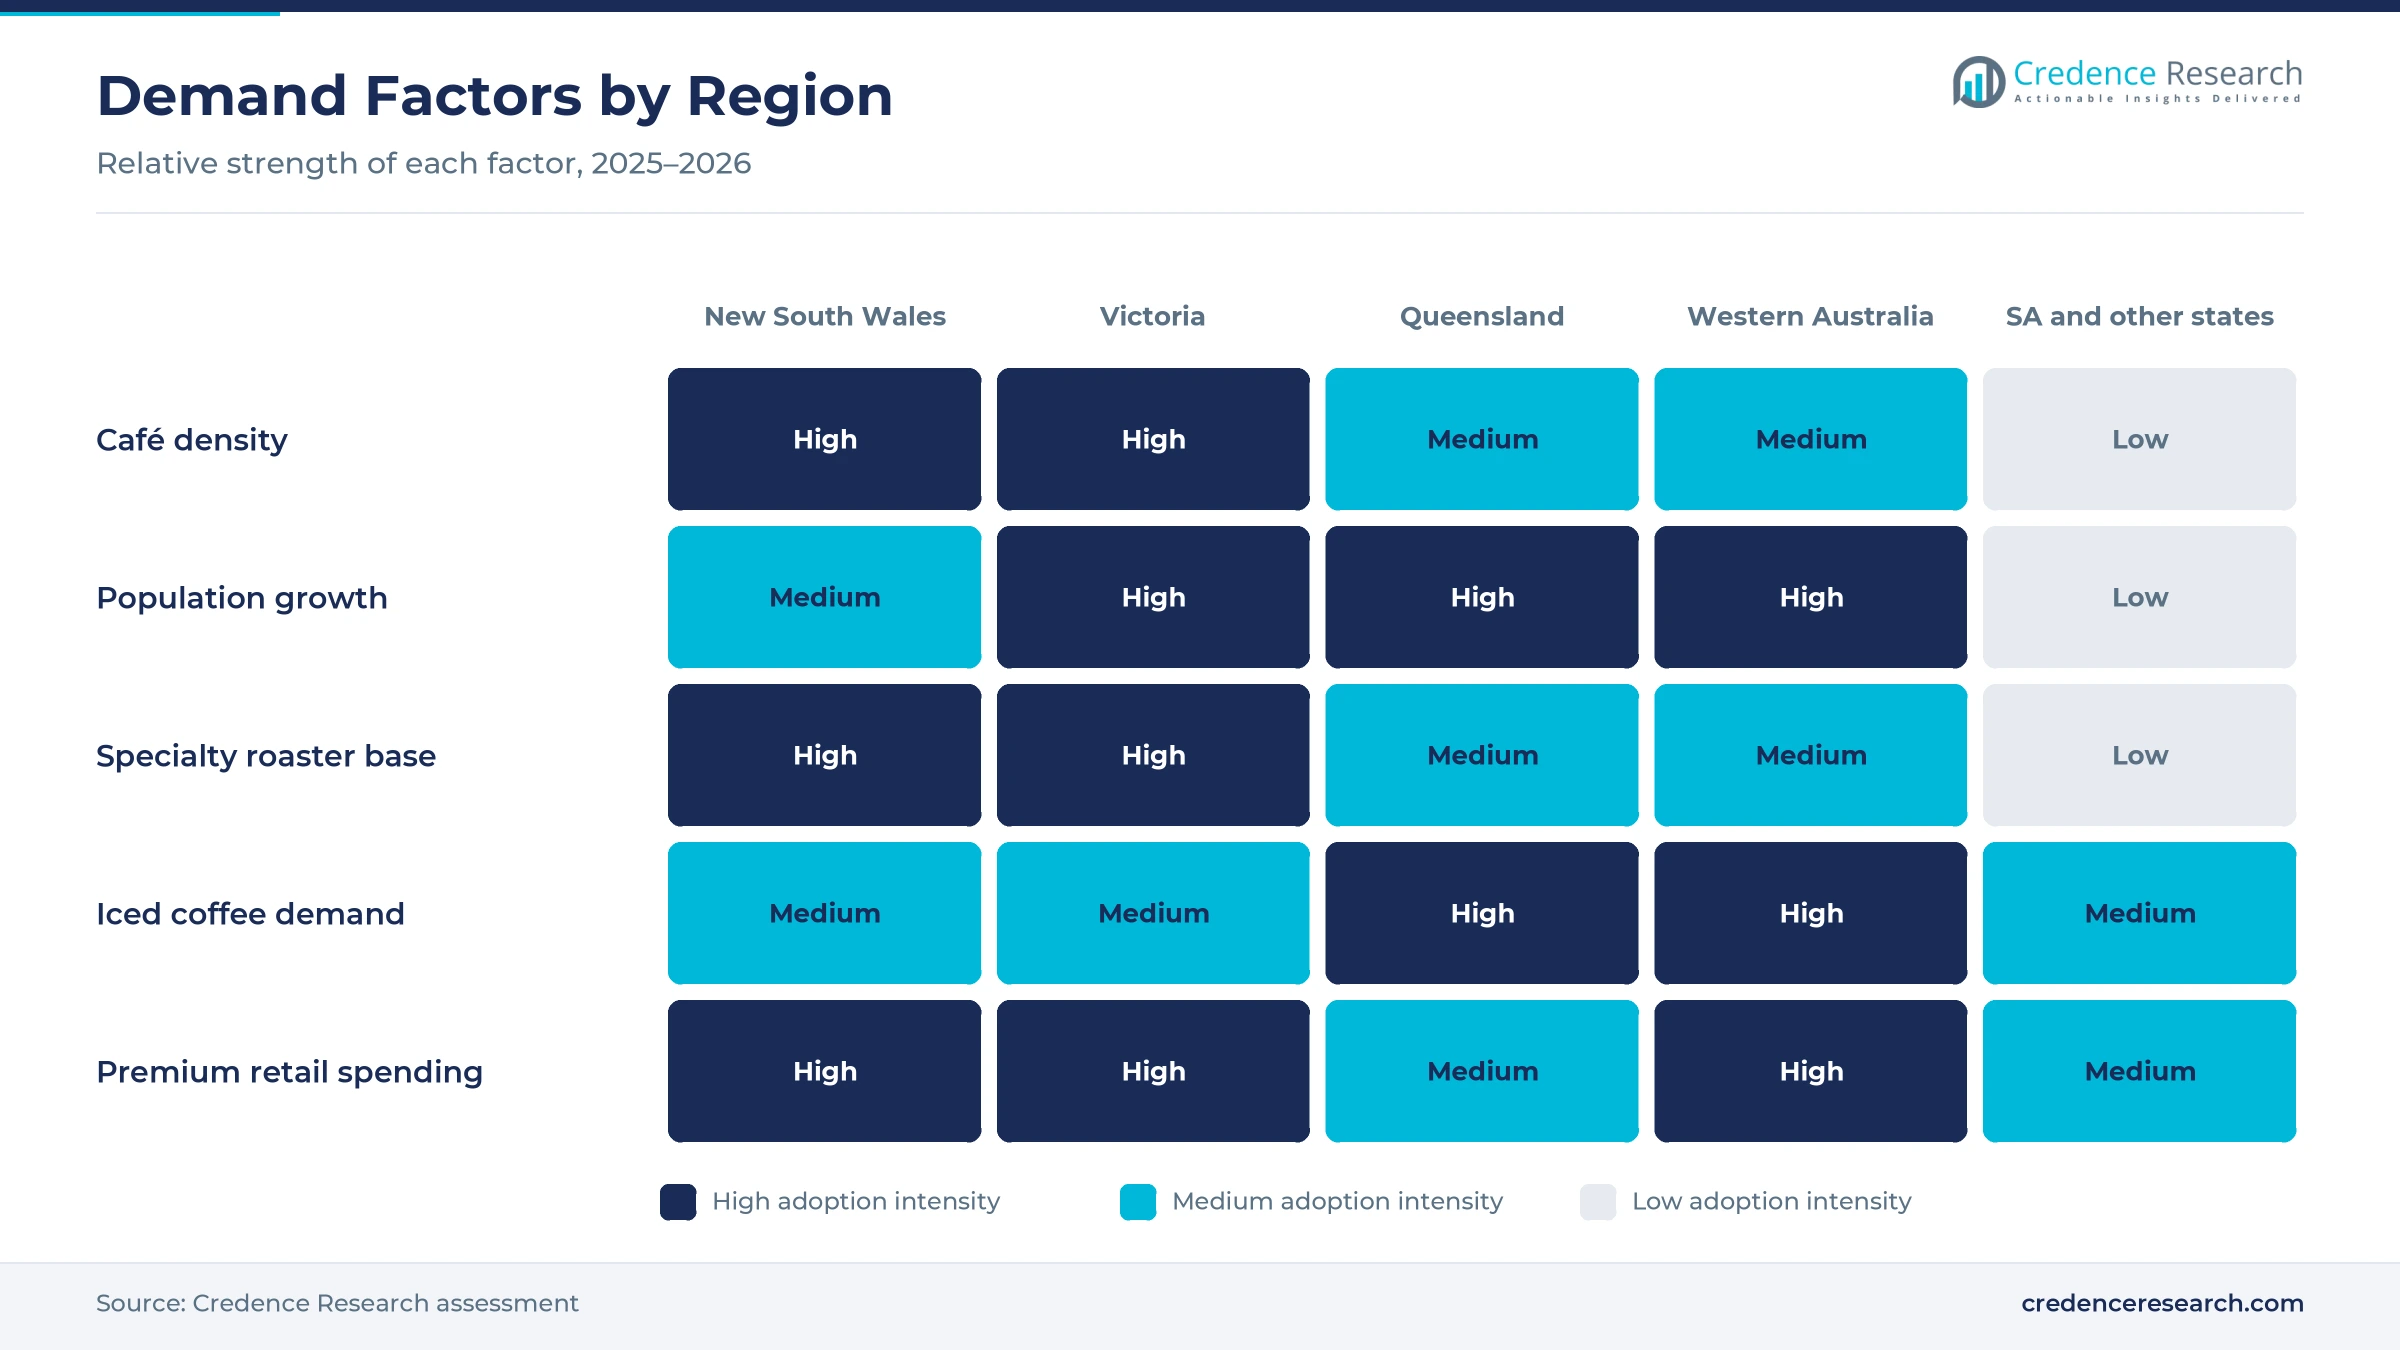
Premium home brewing lifts spending, because drinkers who cut café visits still want café-quality flavor and trade up to better instant, capsules and fresh beans. Instant varieties make up more than 60% of home coffee consumption, and Nescafe Gold grew more than 10% as the fastest-growing brand, according to a June 2025 Nestlé Australia comment. Cappuccino mixes cost under 50 cents a cup at home, while café cups approach A$7 in many cities. Lavazza launched its Mosaic blends for Australian cafés on Aug. 1, 2024, after a blind taste test of 100 people shaped the recipes. As a result, household consumers hold 46.0% of 2025 value, because premium home formats keep spending high even when café visits fall.
Why does the dense café network sustain daily demand?
The dense café network sustains daily demand, because espresso drinks are a habit for many Australians and cafés buy fresh roasted beans every week. Cafes, restaurants and takeaway food services turned over A$5,581.6 million in June 2025 in seasonally adjusted terms, according to the Australian Bureau of Statistics. The average café cup reached about A$5.50, up 37.5% from roughly A$4.00 before the pandemic, according to a May 2025 hospitality industry review. The Australian coffee industry also employed roughly 70,000 people as of 2023. In turn, cafés and foodservice outlets hold a large share of channel value, because each café buys several kilograms of beans each week from local roasters.
How does cold coffee widen consumption occasions?
Cold coffee widens consumption occasions, because iced and ready-to-drink formats reach drinkers in cars, gyms and workplaces outside café hours. Suntory BOSS Coffee reported more than 50% year-on-year growth and held nearly two-thirds of grocery and convenience ready-to-drink coffee scan sales, according to a May 2023 Frucor Suntory article. Nestlé began selling Starbucks Frappuccino bottles through Woolworths, IGA, 7-Eleven and BP in November 2022 under an exclusive local license. Concentrate-based iced coffee made at home also costs about 85 to 90 cents a serve. As a result, ready-to-drink coffee grows at 6.87% a year, the fastest of any product type during 2026–2035, and lifts chilled canned drink volumes.
Why does population growth add new coffee drinkers?
Population growth adds new coffee drinkers, because each new suburb brings households, workplaces and cafés that buy coffee every day. Australia's population reached 27.92 million at March 31, 2026, up 392,700 people or 1.4% in a year, according to official population estimates. Western Australia grew fastest of all states at 2.1%, while Victoria and Queensland each grew 1.6% in the same period. New South Wales remained the largest state with 8.67 million residents, which keeps Sydney the biggest café market. In turn, Western Australia gains new drinkers faster than any other region, because new residents in Perth add both home and café demand.
Price shocks push drinkers toward premium instant and pods
How is the shift from cafés to home brewing changing ranges?
The shift from cafés to home brewing is changing ranges, because higher cup prices push drinkers to make more coffee in their kitchens. Prices for coffee, tea and cocoa rose 15.3% in the year to November 2025, compared with overall inflation of 3.4%, according to consumer price data reported in January 2026. Nestlé Australia said in June 2025 that drinkers are buying more soluble coffee and more premium instant choices. Vittoria also entered instant coffee and launched a Nespresso-compatible aluminum capsule at Woolworths after home demand rose. As a result, supermarkets and hypermarkets hold 38.0% of 2025 channel value, because shoppers buy premium instant and capsules in the weekly shop.
Why is the rise of specialty roasters in retail notable?
The rise of specialty roasters in retail is notable, because café brands now sell beans and capsules beside mass brands on supermarket shelves. JDE Peet's bought Sydney roaster Campos Coffee in 2021, after Campos had expanded into Woolworths stores. JDE Peet's expanded direct distribution of Piazza D'Oro, L'Or and Moccona in Victoria in July 2024 to win more café partners. Allpress Espresso started supplying Melbourne customers from a new Reservoir roastery in March 2026, which consolidates its local roasting. In turn, specialty coffee retail grows faster than the overall market, as roasters reach shoppers who want traceable whole beans at home.
Can direct sales and subscriptions open new revenue?
Direct sales and subscriptions can open new revenue, because roasters keep more margin when they ship beans straight to home drinkers. Vittoria began selling its trade-only food-service blends online during the pandemic and described its new subscriptions as really successful in July 2022. Allpress and other specialty roasters also sell bags online, which links café loyalty to home purchases. Arabica prices nearly doubled year on year in early 2025, according to the World Bank, so roasters use direct channels to protect margins as costs rise. As a result, e-commerce and subscriptions grow at 6.92% a year, the fastest channel during 2026–2035.
Is there room to grow in cold coffee at home?
Cold coffee at home offers room to grow, because Australian summers favor iced drinks and home kits now make café-style iced lattes easy. Nespresso introduced its Barista Creations For Ice capsules for Vertuo and Original machines in Australia in January 2021. Nestlé also sells concentrate-based iced coffee that costs about 85 to 90 cents a serve. St Ali launched cartons of iced coffee in 410 Woolworths stores in May 2021, which showed that specialty roasters can win chilled shelf space. In turn, capsule makers and roasters that add cold brew concentrates and iced blends can reach drinkers in warmer states.
Bean costs and price-sensitive shoppers weigh on margins
How do green bean price swings squeeze roasters?
Green bean price swings squeeze roasters, because Australia imports almost all of its coffee and pays world prices in U.S. dollars. As a result, roasters face sudden cost jumps when droughts hit Brazil or Vietnam, and they must decide how much to pass on. Many roasters respond with forward buying, blend changes and smaller price steps, which spread the shock over several months for café customers. This risk stays high while weather keeps hitting major growing countries.
Why do price-sensitive drinkers cut café visits?
Price-sensitive drinkers cut café visits, because cups near A$7 strain household budgets during a period of high living costs. In turn, cafés lose volume on second and third daily cups, which hurts small operators with fixed rent and wages. Cafés respond with loyalty programs, smaller cup options and bundled breakfast offers, which help keep regular customers coming back each week. This pressure favors cafés with strong local loyalty and efficient service.
How does capsule waste raise environmental concerns?
Capsule waste raises environmental concerns, because millions of used pods reach landfill when drinkers do not return them for recycling. As a result, some shoppers avoid capsules or switch to compostable or aluminum pods that are easier to recover. Brands respond with drop-off points, mail-back kits and recycled aluminum, which reduce waste and protect the capsule format with eco-conscious buyers. This concern therefore pushes capsule brands to invest further in recovery schemes.
Why does labor cost pressure limit café margins?
Labor cost pressure limits café margins, because baristas, rent and milk costs rise while drinkers resist higher prices. In turn, some cafés shorten trading hours or close weaker sites, which reduces bean orders for local roasters. Operators respond with automated grinders, better rostering and higher-margin food, which helps them keep coffee prices within reach of regular customers. This pressure means roasters that support café efficiency keep more accounts.
Sydney café density keeps New South Wales in the lead
| Region | Value, 2025 (USD billion) | Share, 2025 | CAGR, 2026–2035 |
|---|---|---|---|
| New South Wales | 0.80 | 32.9% | 5.02% |
| Victoria | 0.59 | 24.3% | 5.12% |
| Queensland | 0.49 | 20.1% | 5.52% |
| Western Australia | 0.41 | 16.9% | 5.62% |
| South Australia and Other States | 0.14 | 5.8% | 4.82% |
Why does New South Wales hold the top share?
New South Wales held a 32.9% share of 2025 value and grows at 5.02% a year, because the state had 8.67 million residents at March 31, 2026, the largest of any state. Sydney hosts the biggest network of cafés, offices and transport hubs that serve espresso drinks. Campos Coffee and other Sydney roasters also supply cafés and supermarkets across the state. As a result, New South Wales generates the largest share of both café and retail coffee sales.
How does Victoria anchor specialty café culture?
Victoria held a 24.3% share of 2025 value and grows at 5.12% a year, because Melbourne has a strong specialty café culture and many independent roasters. The state had 7.15 million residents at March 31, 2026, after growing 1.6% in a year. Allpress began supplying Melbourne customers from its Reservoir roastery in March 2026. In turn, Victoria supports premium bean sales and a large base of café accounts.
What supports coffee demand in Queensland?
Queensland held a 20.1% share of 2025 value and grows at 5.52% a year, because the state added 90,100 residents in the year to March 2026. Warm weather supports strong demand for iced coffee and ready-to-drink products across the state. Merlo Coffee, founded in Brisbane in 1992, also runs coffee shops and roasting sites in the state. As a result, Queensland combines steady café demand with fast iced coffee growth.
Why is Western Australia growing fastest?
Western Australia held a 16.9% share of 2025 value and grows fastest at 5.62% a year, because the state grew 2.1% in the year to March 2026, the fastest of any state. Perth has a growing base of young workers and mining-sector households with high incomes. Hot summers also favor iced and ready-to-drink formats across Perth and regional towns. In turn, Western Australia adds new café and retail demand faster than other regions.
How do South Australia and other states contribute?
South Australia and other states held a 5.8% share of 2025 value and grow at 4.82% a year, because they cover smaller populations in Adelaide, Hobart, Canberra and Darwin. South Australia had 1.92 million residents at March 31, 2026, after growing 1.0% in a year. Tasmania grew only 0.6%, the slowest growth rate of any state. As a result, these areas rely on national brands and distributors for most supply.
Blend launches, roastery openings and price milestones
| Development | Status and market relevance |
|---|---|
| In July 2024, JDE Peet's expanded direct distribution of Piazza D'Oro, L'Or and Moccona in Victoria. | Strengthens café and retail reach in Melbourne |
| In August 2024, Lavazza launched its Mosaic blends for Australian cafés to mark 50 years in the country. | Shows global brands tailoring blends to local taste |
| In February 2025, arabica prices reached about US$9 per kilogram, a record nominal high. | Raised shelf and café prices across Australia |
| In June 2025, Nestlé Australia reported that Nescafe Gold was the fastest-growing brand with more than 10% growth. | Confirms the shift to premium instant at home |
| In March 2026, Allpress Espresso began supplying Melbourne customers from its new Reservoir roastery. | Adds specialty roasting capacity in Victoria |
Roasting, capsule and cold extraction tools define supply
- Small-batch roasting systems let specialty roasters profile each origin closely and adjust roast curves batch by batch, which supports premium single-origin and blended coffee for cafés and home buyers.
- Freeze-dried soluble processing keeps more aroma in instant coffee than spray drying does, which helps premium instant ranges compete with fresh beans as drinkers trade up at home.
- Aluminum and compostable capsules protect freshness in single serves for weeks, while drop-off and mail-back recycling programs answer waste concerns from shoppers.
- Cold extraction and aseptic filling produce shelf-stable iced coffee in cans, bottles and cartons, which lets brands supply convenience and grocery stores without a cold chain.
Need a Custom Version of This Report?
Tailor the scope, geography, or segments to your exact requirements.
- Custom geography or segment scope
- Direct access to our analyst team
Global brands and local roasters compete on quality
Competition combines global brand owners that dominate instant, capsules and ready-to-drink coffee with Australian roasters that lead in cafés and specialty beans. Nestlé Australia competes with Nescafe instant and Starbucks ready-to-drink bottles. JDE Peet's competes with Moccona, L'Or, Piazza D'Oro and Campos. Lavazza competes in cafés with its Mosaic blends launched in 2024. Vittoria competes in ground, instant and capsule formats with a long local history. Suntory competes in ready-to-drink cans through its BOSS Coffee brand in convenience stores. Merlo Coffee and Allpress Espresso compete in cafés and roasted beans through their own roasteries and coffee shops. Rivals compete on flavor, price, sustainability claims, café service support and shelf presence in supermarkets and convenience stores.
Which brands and roasters serve Australian drinkers?
| Company | Type | Role in the market |
|---|---|---|
| JDE Peet's Australia | Brand owner and roaster | Owns Moccona, L'Or, Piazza D'Oro and Campos Coffee |
| Nestlé Australia | Brand owner | Sells Nescafe and Starbucks ready-to-drink coffee |
| Vittoria Food & Beverage | Australian roaster | Offers ground, instant and capsule coffee |
| Luigi Lavazza Australia | Brand owner and roaster | Launched Mosaic café blends in August 2024 |
| Suntory Oceania | Beverage maker | Sells BOSS Coffee ready-to-drink cans |
| Allpress Espresso | Specialty roaster | Opened a Reservoir roastery in Melbourne in 2026 |
| Merlo Coffee | Roaster and café operator | Runs coffee shops and roasting sites from Brisbane |
Credence Research view on premium home brewing
Credence Research's view is that Australian coffee spending will grow steadily because drinkers keep their daily habit while shifting part of it from cafés to premium home formats. Roasted and ground coffee remains the largest value pool, while ready-to-drink coffee and online subscriptions add the fastest growth. Record green bean prices in 2025 tested margins, yet higher shelf prices also lifted value. Brands that pair café-quality flavor with convenient formats, and roasters with strong café service, should gain the most.
How the national consumption estimate was built
The report uses 2025 as the base year on a calendar basis, and market values come from the Credence Research model. That model combines official population and retail statistics, consumer price data, commodity price releases and company product information. Segment splits and zone growth rates are Credence Research estimates, while zone shares follow the client-provided split. Sources used are official statistics, international agency releases, trade media and company releases, and no interviews or surveys were used.
Iced drinks and premium formats carry growth to 2035
The Australia coffee market is expected to reach USD 4.08 billion by 2035, a 5.24% CAGR during 2026–2035, as drinkers buy premium instant, capsules and iced coffee while cafés keep their central role. Growth should be strongest in ready-to-drink coffee, online subscriptions and Western Australia, because these areas gain most from new drinkers and changing habits. Green bean costs, price-sensitive shoppers and capsule waste could slow growth in some segments, while café quality at home should support value.
Frequently Asked Questions
How big is the Australia coffee market?
Which product type leads Australian coffee value?
Which region leads the Australian coffee market?
Why are Australians brewing more coffee at home?
How did world coffee prices change in 2025?
Which channel grows fastest?
Who are the leading companies in the Australian coffee market?
What are the main challenges for coffee suppliers?
Table of Content
Chapter 1 Market Segmentation
- 1.1 Segmentation Framework
- 1.1.1 Product and Service Classification
- 1.1.2 Application and End-Use Classification
- 1.1.3 Technology and Solution Classification
- 1.1.4 Customer and Distribution Channel Classification
- 1.1.5 Geographic Segmentation
- 1.1.6 Market Segment Definitions and Boundaries
- 1.2 By Product Type
- 1.2.1 Roasted and Ground Coffee
- 1.2.2 Instant Coffee
- 1.2.3 Coffee Pods and Capsules
- 1.2.4 Ready-to-Drink Coffee
- 1.3 By Customer Type
- 1.3.1 Household Consumers
- 1.3.2 Cafés and Coffee Shops
- 1.3.3 Workplaces and Institutions
- 1.3.4 Hospitality and Travel Operators
Chapter 2 Introduction
- 2.1 Report Objectives and Scope
- 2.2 Product Definition and Industry Terminology
- 2.3 Market Inclusions and Exclusions
- 2.4 Research Process
- 2.4.1 Primary Research and Expert Interviews
- 2.4.2 Secondary Research and Source Review
- 2.4.3 Top-Down and Bottom-Up Estimation
- 2.4.4 Data Triangulation and Verification
- 2.5 Market Size Measurement Basis
- 2.5.1 2025: USD 2.43 billion → 2035: USD 4.08 billion
- 2.6 Historical and Forecast Reference Periods
- 2.6.1 Historical Period: 2018-2025
- 2.6.2 Base Year: 2025
- 2.6.3 Forecast Period: 2025-2035
- 2.7 Research Assumptions and Limitations
Chapter 3 Executive Summary
- 3.1 Market Snapshot and Key Findings
- 3.2 Base-Year Market Size, 2025
- 3.3 Forecast Market Size, 2035
- 3.4 Revenue and Volume Growth Outlook
- 3.5 Key Demand and Supply Indicators
- 3.6 Leading Market Segments
- 3.7 Fastest-Growing Market Opportunities
- 3.8 Regional Performance Highlights
- 3.9 Technology and Industry Transformation
- 3.10 Competitive Landscape Summary
- 3.11 Analyst View and Strategic Implications
Chapter 4 Australia Coffee Market Trends and Developments
- 4.1 Historical Industry Development, 2018-2025
- 4.2 Recent Market Trends and Developments
- 4.3 Demand and Customer Behavior Trends
- 4.4 Technology and Product Innovation
- 4.5 Artificial Intelligence, Automation and Digitalization
- 4.6 Local Manufacturing and Supply Chain Realignment
- 4.7 Industry Partnerships, Mergers and Acquisitions
- 4.8 Sustainability and Circular Economy Developments
- 4.9 Government and Private Sector Investment Trends
- 4.10 Emerging Business Models and Commercialization
- 4.11 Industry Developments and Announcements
Chapter 5 Australia Coffee Market Production, Supply and Demand Analysis
- 5.1 Demand Trend and Consumption Analysis, 2018-2025
- 5.2 Demand Forecast, 2025-2035
- 5.3 Production and Output Trend, 2018-2025
- 5.4 Production and Output Forecast, 2025-2035
- 5.5 Installed Capacity and Capacity Utilization
- 5.6 Company-Wise Production Plants and Statistics
- 5.6.1 Installed Production Capacity
- 5.6.2 Actual Production
- 5.6.3 Planned Capacity and Expansion Targets
- 5.7 Supply Chain Structure and Procurement Trends
- 5.8 Supply-Demand Gap and Bottlenecks
- 5.9 Import Dependence and Sourcing Structure
- 5.10 Contract Manufacturing and Outsourcing
- 5.11 Regional Supply and Demand Concentration
Chapter 6 Australia Coffee Market Pricing Analysis
- 6.1 Pricing Structure and Measurement
- 6.2 Historical Pricing Trends, 2018-2025
- 6.3 Pricing Outlook, 2025-2035
- 6.4 Average Selling Price and Unit Economics
- 6.5 Pricing by Product and Market Segment
- 6.6 Geographic Pricing Differences
- 6.7 Key Input, Energy, Labor and Logistics Costs
- 6.8 Contract Pricing and Purchasing Models
- 6.9 Pricing Sensitivity and Competitive Positioning
- 6.10 Price, Margin and Profitability Implications
Chapter 7 Australia Coffee Market Dynamics
- 7.1 Market Growth Drivers
- 7.1.1 Demand-Side Drivers
- 7.1.2 Technology and Innovation Drivers
- 7.1.3 Infrastructure and Investment Drivers
- 7.1.4 Regulatory and Policy Drivers
- 7.2 Market Restraints
- 7.2.1 Cost and Affordability Constraints
- 7.2.2 Technology and Adoption Barriers
- 7.2.3 Supply Chain and Operational Constraints
- 7.3 Market Challenges
- 7.3.1 Competitive Pressure and Margin Erosion
- 7.3.2 Skills, Infrastructure and Implementation Gaps
- 7.4 Emerging Market Opportunities
- 7.5 Market Dynamics Impact and Time-Horizon Assessment
Chapter 8 Australia Coffee Value Chain Analysis
- 8.1 Industry Value Chain Overview
- 8.2 Upstream Suppliers and Critical Inputs
- 8.3 Technology and Component Providers
- 8.4 Manufacturing or Service Delivery
- 8.5 Distribution, Channel Partners and Integrators
- 8.6 Downstream Applications and End Users
- 8.7 Value Addition and Profit Pools
- 8.8 Vertical Integration and Outsourcing
- 8.9 Supplier Concentration and Risk
- 8.10 Supply Chain Localization and Resilience
Chapter 9 Australia Coffee Market Regulations and Policies
- 9.1 Relevant Laws, Standards and Compliance Frameworks
- 9.2 Product, Service, Safety and Quality Requirements
- 9.3 Government Policies, Incentives and Subsidies
- 9.4 Imports, Exports and Trade Barriers
- 9.5 Public Procurement and Local Content Requirements
- 9.6 Environmental and Sustainability Compliance
- 9.7 Upcoming Policy Changes and Market Implications
Chapter 10 Australia Coffee Market Hotspots and Opportunities
- 10.1 Market Opportunity Mapping and Growth Hotspots
- 10.2 High-Growth Applications and Customer Groups
- 10.3 Underserved Markets and White-Space Opportunities
- 10.4 Emerging Technology and Product Opportunities
- 10.5 New Capacity and Investment Hotspots
- 10.6 Market Entry and Expansion Opportunities
- 10.7 Distribution and Partnership Opportunities
- 10.8 Near-Term and Long-Term Commercial Potential
- 10.9 Opportunity Attractiveness and Execution Risks
Chapter 11 Australia Coffee Market Outlook, 2025-2035
- 11.1 Market Size and Analysis
- 11.1.1 Revenue (Market Measurement: 2025: USD 2.43 billion → 2035: USD 4.08 billion)
- 11.1.2 Market Volume and Quantity Sold
- 11.1.3 Historical Market Size, 2018-2025
- 11.1.4 Base-Year Market Size, 2025
- 11.2 Market Forecast, 2025-2035
- 11.2.1 Revenue Forecast to 2035
- 11.2.2 Volume Forecast to 2035
- 11.2.3 CAGR and Year-on-Year Growth
- 11.2.4 Incremental Revenue Opportunity
- 11.3 Forecast Assumptions and Scenario Analysis
- 11.3.1 Base-Case Forecast
- 11.3.2 Optimistic and Conservative Scenarios
- 11.3.3 Technology, Pricing and Policy Sensitivities
- 11.4 Market Attractiveness and Growth Outlook
Chapter 12 Australia Coffee Market Segmentation and Outlook
- 12.1 Segmentation Summary and Market Shares, 2025
- 12.2 Largest and Fastest-Growing Segments
- 12.3 By Product Type - Market Size and Forecast, 2025-2035
- 12.3.1 Segment Definition and Scope
- 12.3.2 Historical Market Size, 2018-2025
- 12.3.3 Revenue Forecast, 2025-2035
- 12.3.4 Volume Forecast, 2025-2035
- 12.3.5 Base-Year Market Share, 2025
- 12.3.6 Segment CAGR and Growth Drivers
- 12.3.7 Subsegment Market Size and Forecast
- 12.3.7.1 Roasted and Ground Coffee
- 12.3.7.2 Instant Coffee
- 12.3.7.3 Coffee Pods and Capsules
- 12.3.7.4 Ready-to-Drink Coffee
- 12.3.8 Subsegment Pricing and Adoption Trends
- 12.3.9 Leading Suppliers and Competition
- 12.3.10 Regional Demand and Opportunities
- 12.4 By Customer Type - Market Size and Forecast, 2025-2035
- 12.4.1 Segment Definition and Scope
- 12.4.2 Historical Market Size, 2018-2025
- 12.4.3 Revenue Forecast, 2025-2035
- 12.4.4 Volume Forecast, 2025-2035
- 12.4.5 Base-Year Market Share, 2025
- 12.4.6 Segment CAGR and Growth Drivers
- 12.4.7 Subsegment Market Size and Forecast
- 12.4.7.1 Household Consumers
- 12.4.7.2 Cafés and Coffee Shops
- 12.4.7.3 Workplaces and Institutions
- 12.4.7.4 Hospitality and Travel Operators
- 12.4.8 Subsegment Pricing and Adoption Trends
- 12.4.9 Leading Suppliers and Competition
- 12.4.10 Regional Demand and Opportunities
- 12.5 Segment Growth Comparison
- 12.6 Segment Attractiveness and Priority Matrix
Chapter 13 Australia Coffee End-Use and Application Market Outlook
- 13.1 End-Use Industry and Customer Demand Structure
- 13.2 Leading Applications and Customer Groups
- 13.3 End-Use Market Size, Share and Forecast
- 13.4 Major End-Use Industry Deep Dives
- 13.4.1 Customer Requirements and Use Cases
- 13.4.2 Demand and Replacement Cycles
- 13.4.3 Technical and Regulatory Considerations
- 13.4.4 Purchasing and Procurement Models
- 13.4.5 Leading Vendors and Distribution Channels
- 13.4.6 Forecast and Commercial Opportunities
- 13.5 Emerging Applications and Cross-Segment Demand
- 13.6 End-Use Industry Investment Priorities
Chapter 14 Australia Coffee Geographic Market Outlook, 2025-2035
- 14.1 Domestic Market Distribution and Demand Clusters
- 14.2 State- or Province-Wise Market Size and Forecast, 2025-2035
- 14.3 City and Metropolitan Market Outlook
- 14.4 Industrial, Manufacturing and Commercial Clusters
- 14.5 Geographic Concentration of Key End Users
- 14.6 Local Pricing and Purchasing Differences
- 14.7 Domestic Production Facilities and Capacity Map
- 14.8 Local Infrastructure and Project Pipeline
- 14.9 State-Level Policy and Incentive Differences
- 14.10 Subnational Investment Hotspots and Opportunities
- 14.11 Distribution and Logistics Networks
- 14.12 Domestic Competitive Footprint
Chapter 15 Australia Coffee Technology, Innovation and Sustainability Outlook
- 15.1 Technology Landscape and Maturity
- 15.2 Product, Process and Service Innovation
- 15.3 AI, Automation and Digital Tools in the Industry
- 15.4 Technology Adoption and Performance Benchmarking
- 15.5 Innovation Pipeline and R&D Investment
- 15.6 Patent and Intellectual Property Trends
- 15.7 Energy Efficiency and Resource Management
- 15.8 Sustainability, Recycling and Circularity
- 15.9 Technology Roadmap, 2025-2035
- 15.10 Risks of Obsolescence and Technology Substitution
Chapter 16 Australia Coffee Market Key Strategic Imperatives
- 16.1 Growth and Market Entry Priorities
- 16.2 High-Return Products and Segments
- 16.3 Pricing, Profitability and Cost Optimization
- 16.4 Technology Investment and Product Differentiation
- 16.5 Supply Chain Localization and Resilience
- 16.6 Distribution and Customer Acquisition
- 16.7 Partnership, Acquisition and Capacity Strategy
- 16.8 Regional Expansion Priorities
- 16.9 Short-, Medium- and Long-Term Actions
Chapter 17 Competition Outlook
- 17.1 Industry Competition Characteristics
- 17.2 Market Structure and Concentration
- 17.3 Market Share and Competitive Positioning, 2025
- 17.4 Company-Wise Revenue and Product Benchmarking
- 17.5 Production and Service Capacity Benchmarking
- 17.6 Technology, Pricing and Differentiation
- 17.7 Regional Footprint and Distribution Strength
- 17.8 Mergers, Acquisitions and Strategic Alliances
- 17.9 New Entrants and Competitive Threats
- 17.10 Porter's Five Forces and Industry Attractiveness
- 17.11 Competitive Outlook, 2025-2035
Chapter 18 Company Profiles
- 18.1 Company Coverage and Selection Criteria
- 18.2 JDE Peet's Australia
- 18.2.1 Business Description
- 18.2.2 Company Ownership and Geographic Presence
- 18.2.3 Product and Service Portfolio
- 18.2.4 Manufacturing and Operating Footprint
- 18.2.5 Production Capacity and Expansion Plans
- 18.2.6 Financial Performance and Investment
- 18.2.7 Market Share and Competitive Position
- 18.2.8 Technology and Innovation Capabilities
- 18.2.9 Strategic Alliances or Partnerships
- 18.2.10 Recent Developments
- 18.2.11 Growth Strategy and Outlook
- 18.3 Nestlé Australia
- 18.4 Vittoria Food & Beverage
- 18.5 Luigi Lavazza Australia
- 18.6 Suntory Oceania
- 18.7 Coca-Cola Europacific Partners Australia
- 18.8 Starbucks Coffee Australia
- 18.9 Merlo Coffee
- 18.10 Allpress Espresso
- 18.11 Five Senses Coffee
- 18.12 Other Relevant Market Participants
Note: Every listed company is profiled on the structure shown under the first company. The company list is preliminary and may change based on research findings, market developments, data availability and client requirements.
Chapter 19 Disclaimer
- 19.1 Research and Forecast Disclaimer
- 19.2 Data Source and Estimation Limitations
Note: The depth of individual sections depends on data availability for this market. Volume, capacity, trade and other unit-based metrics are included where applicable.

