
Cloud calling, meetings and messaging scale across India
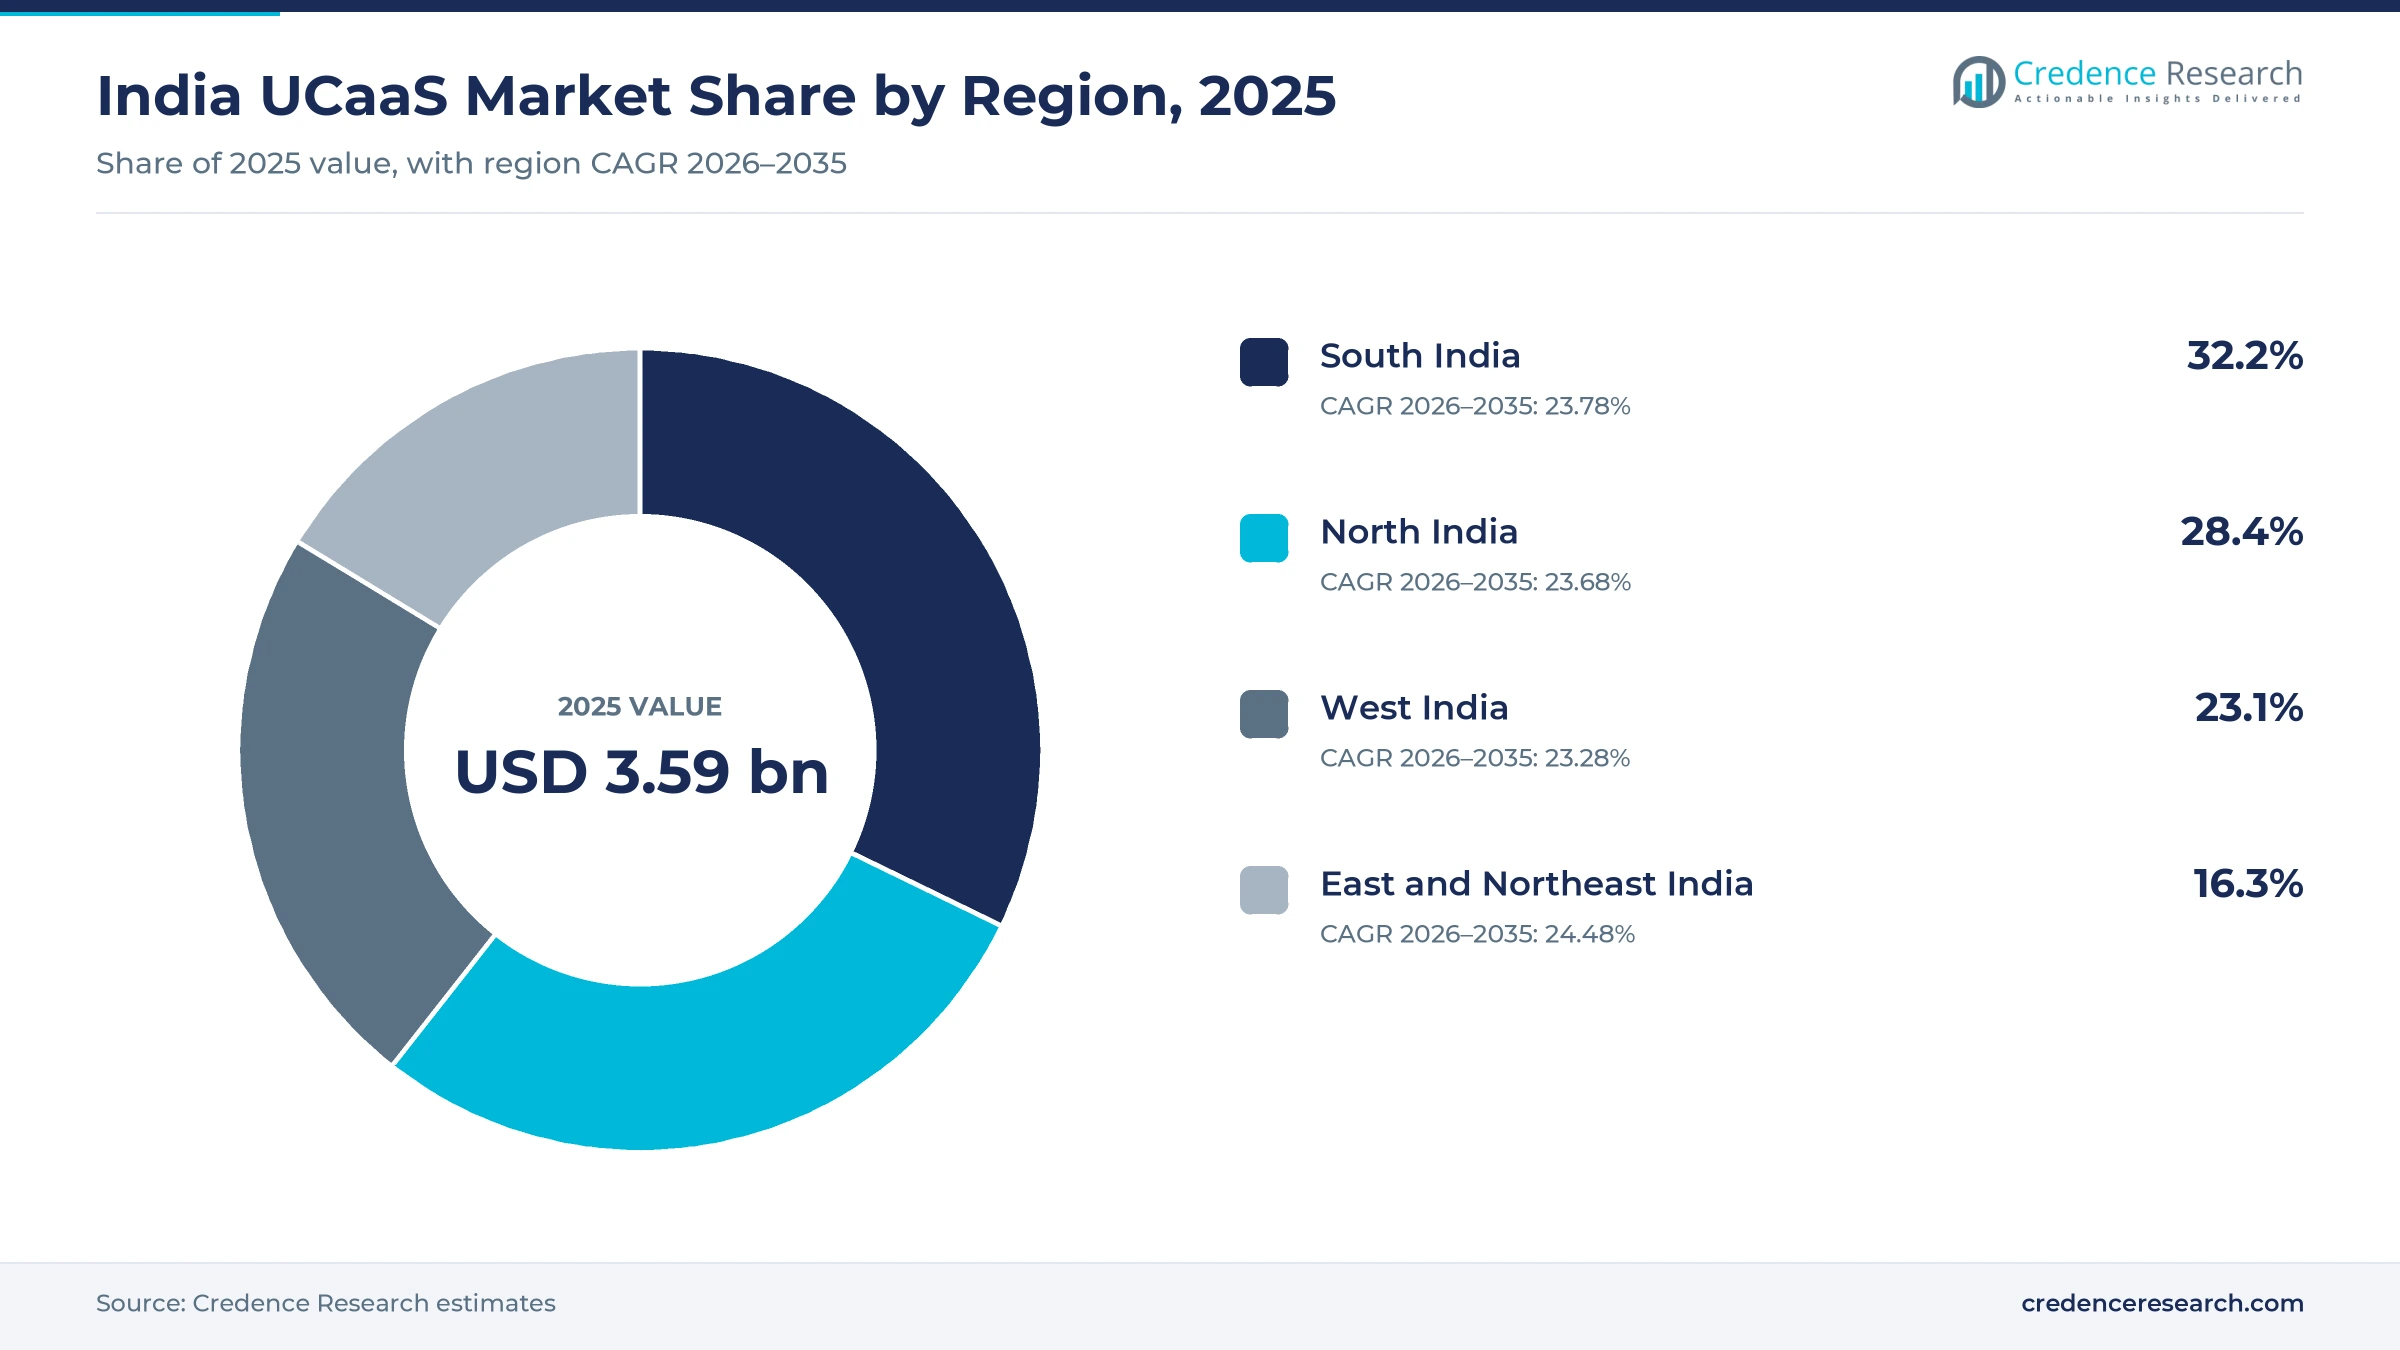
The India UCaaS market was valued at USD 3.59 billion in 2025 and is projected to increase from USD 4.46 billion in 2026 to USD 30.38 billion by 2035, registering a CAGR of 23.75% during 2026–2035. Demand comes from companies that replace desk phones, on-premises PBX systems and separate meeting tools with subscription services for calling, video, messaging and contact handling. South India held the largest regional share, 32.2% in 2025, because Bengaluru, Hyderabad and Chennai host large technology, BPO and global capability centers. East and Northeast India is the fastest-growing region at 24.48% a year, as broadband and 5G coverage reach more offices outside the metros. In turn, the commercial setting has shifted, because global platforms now offer licensed public phone calling in India through local telecom partners.
Which cloud calling, meeting and messaging services does the estimate count?
The estimate measures subscription and usage revenue from cloud telephony and hosted PBX, video meetings, team messaging and presence, and integrated suites delivered to organizations in India. It counts public, private, hybrid and carrier-managed cloud services, sold per user, in telecom bundles, as usage add-ons or under enterprise contracts.
The estimate excludes on-premises PBX hardware, desk phones and headsets sold on their own, consumer messaging apps and standalone contact center software. The value chain runs from cloud platforms and data centers through licensed telecom operators and resellers to the companies and public bodies that use each service.
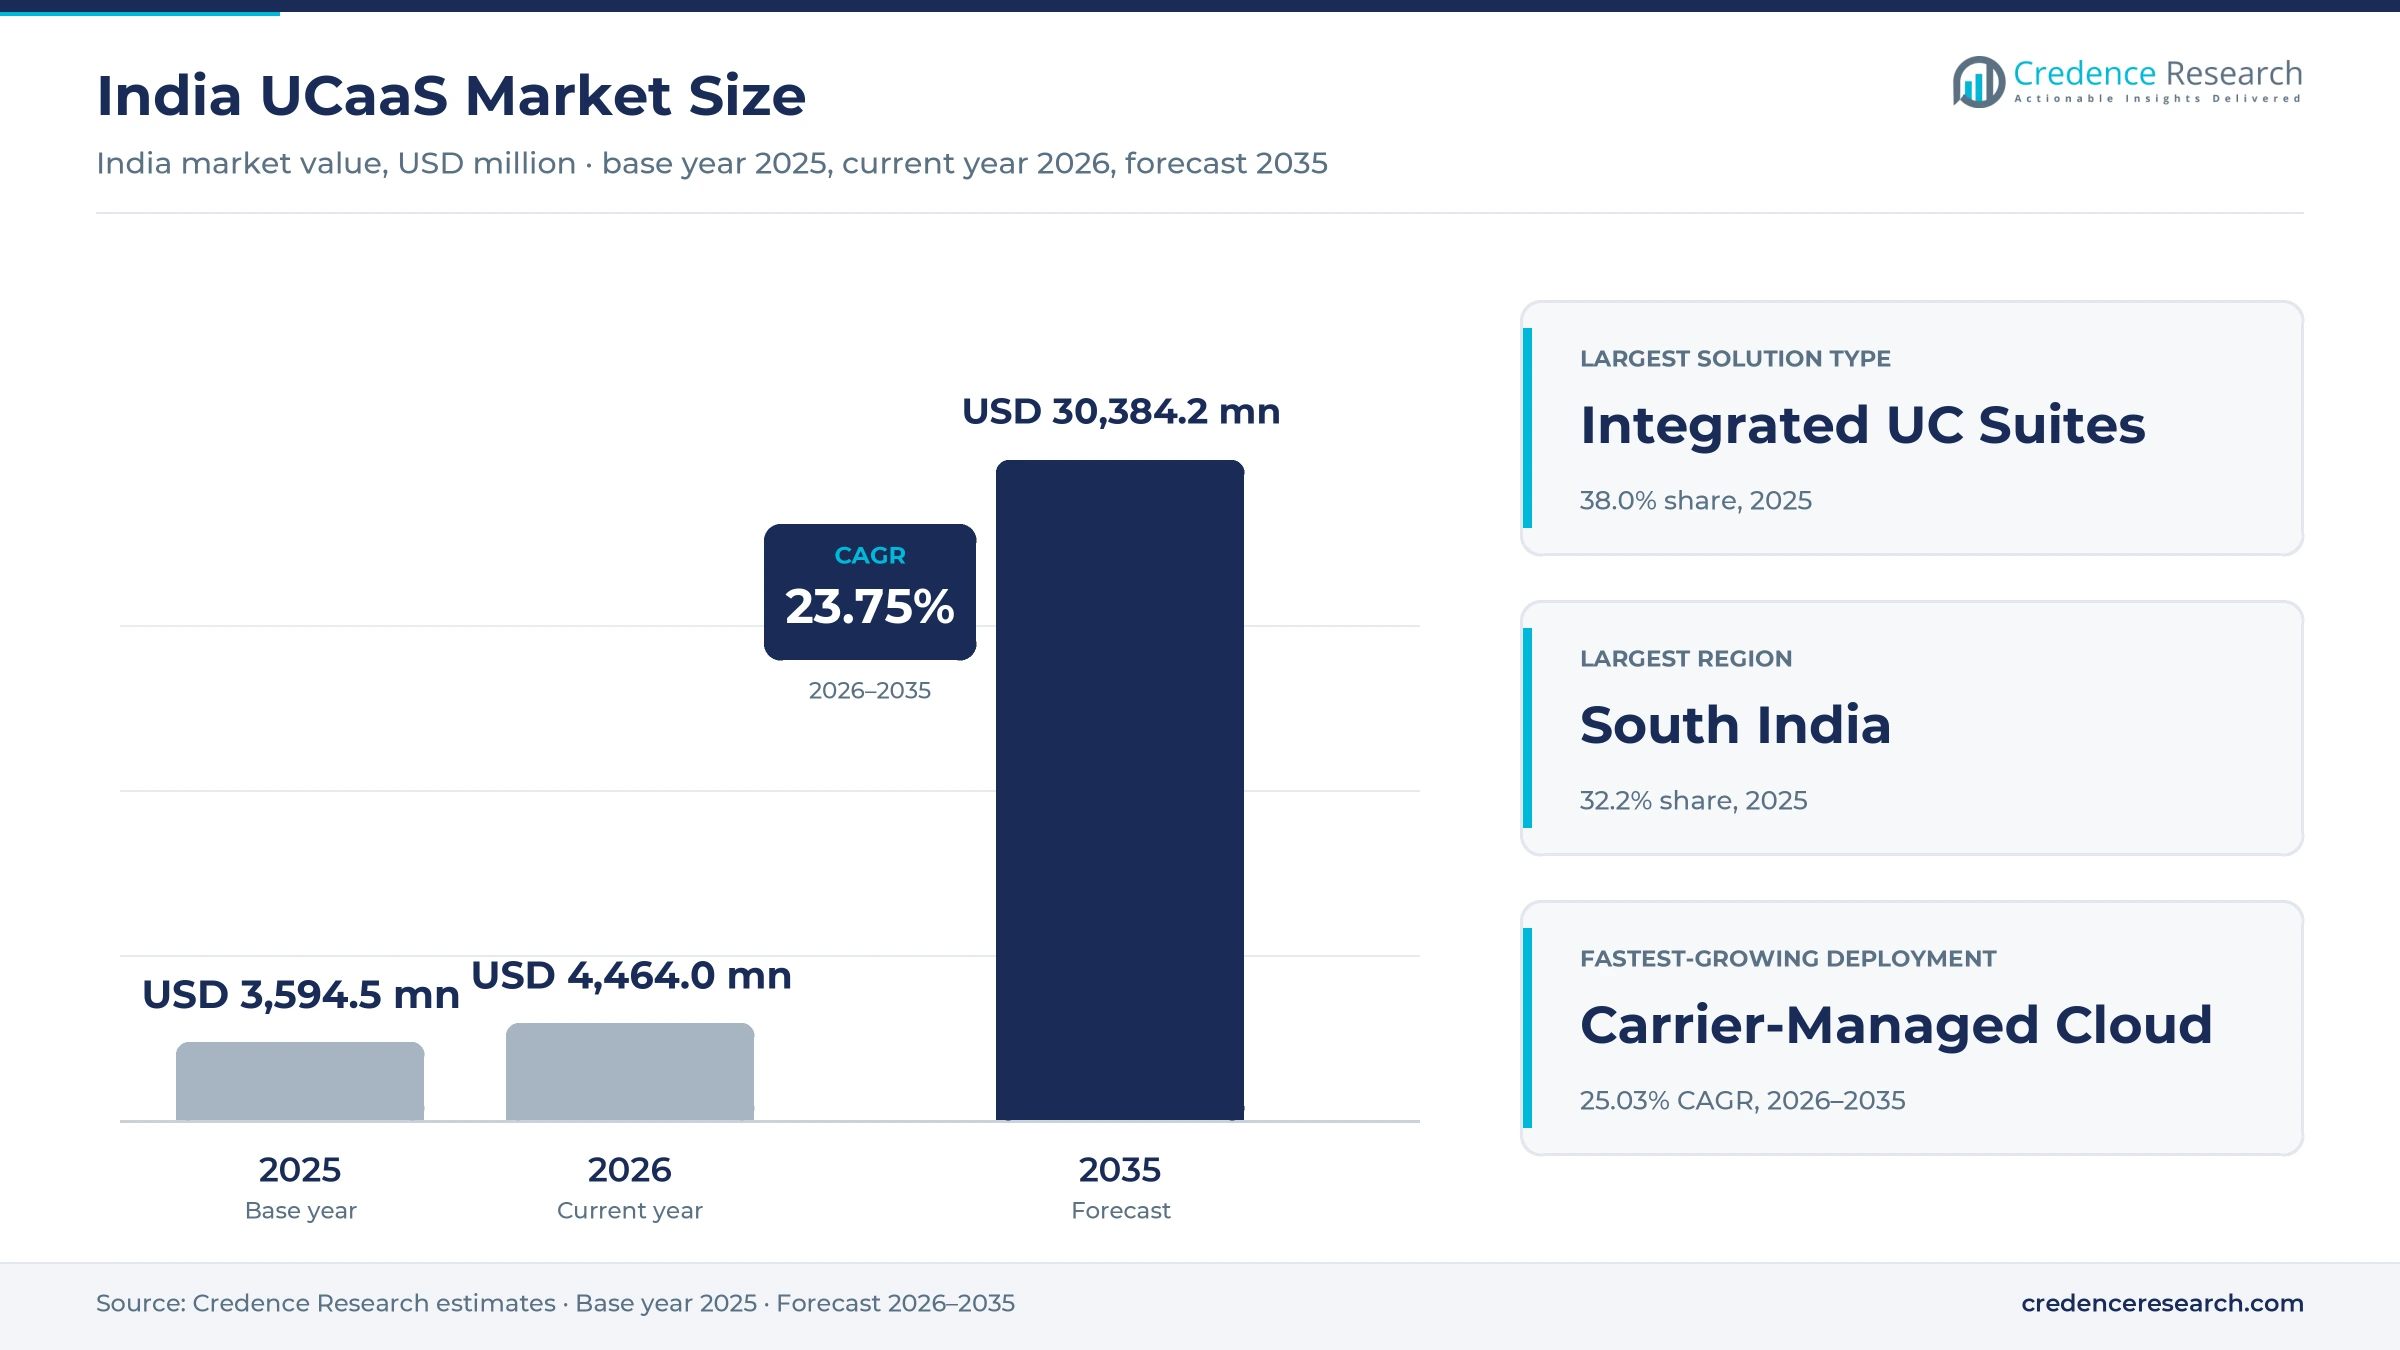
India UCaaS Market Insights
- The India UCaaS market was valued at USD 3.59 billion in 2025 and is projected to reach USD 30.38 billion by 2035, registering a CAGR of 23.75% during 2026–2035.
- South India held a 32.2% share of 2025 value, because Bengaluru, Hyderabad and Chennai host large technology, BPO and global capability centers.
- Integrated UC suites led with a 38.0% share of 2025 value, because large firms buy calling, meetings and chat from one platform.
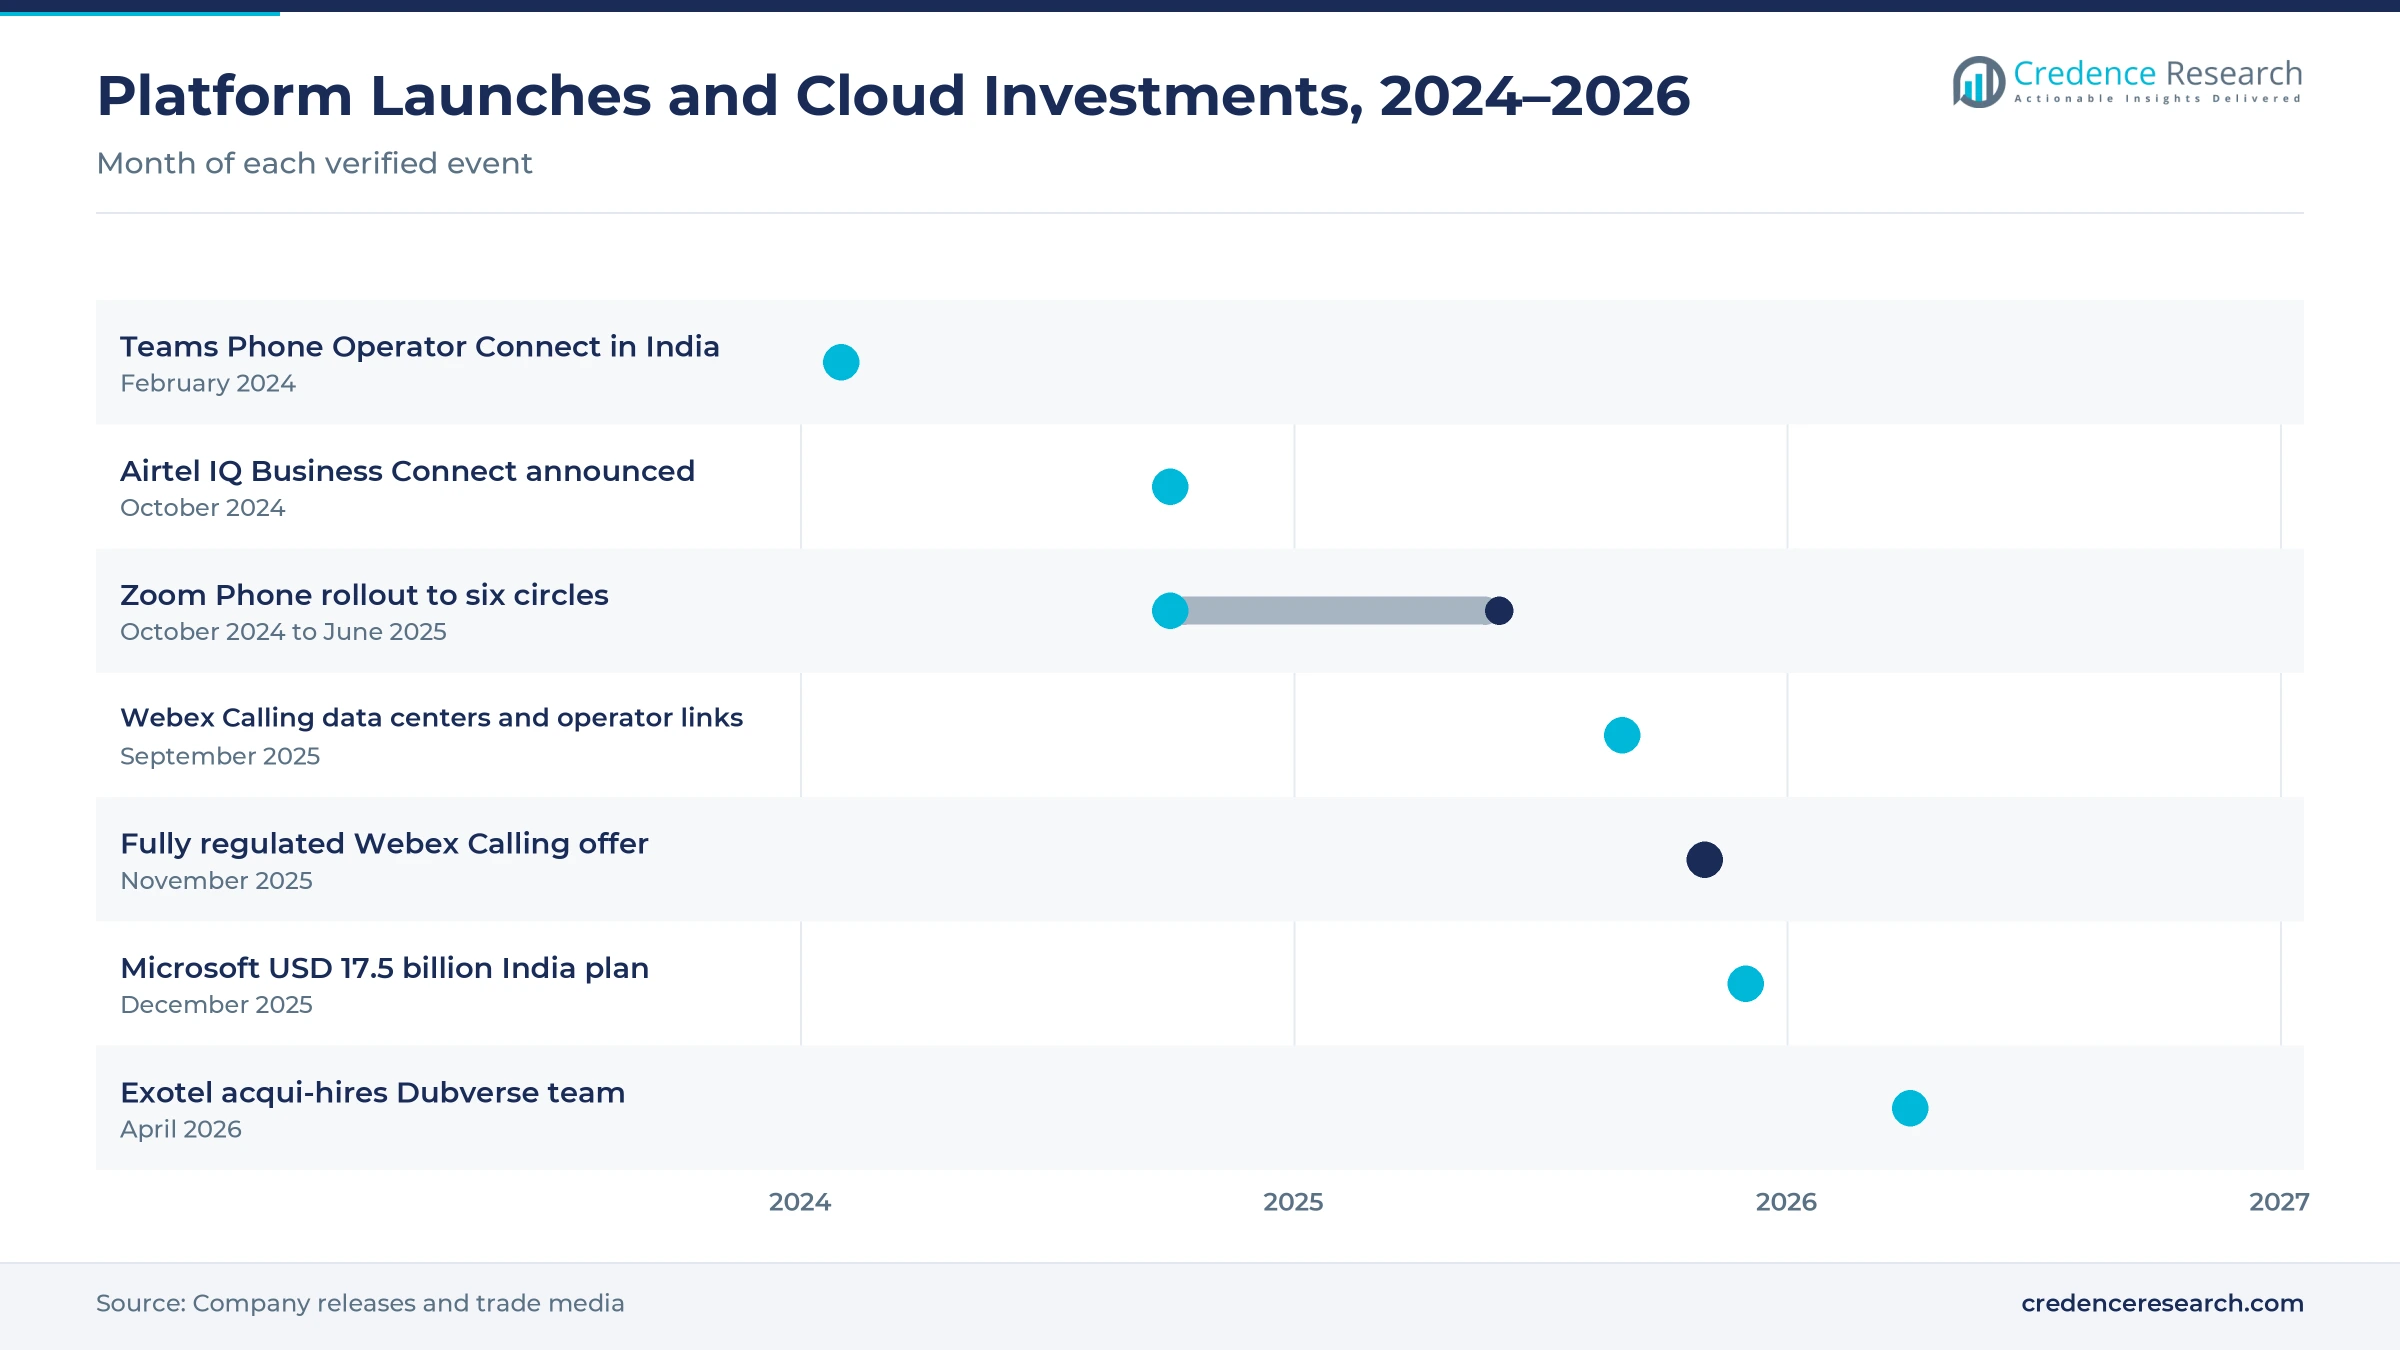
- Zoom completed the rollout of Zoom Phone across six Indian telecom circles on June 11, 2025, after starting in Maharashtra in October 2024.
- Microsoft announced a USD 17.5 billion cloud and AI investment in India on Dec. 9, 2025, including a new Hyderabad region due in mid-2026.
Integrated suites lead as cloud telephony grows fastest
Why do integrated suites hold the largest share?
Based on solution type, the market is categorized into cloud telephony and PBX, video meetings and conferencing, team messaging and presence, and integrated UC suites. Integrated UC Suites led with a 38.0% share of 2025 value, because large firms buy calling, meetings and chat together. Cloud Telephony and PBX grows fastest at 24.57% a year, as licensed public phone calling arrives on global platforms.
How do public, hybrid and carrier-managed clouds compare?
Based on deployment model, the market is categorized into public cloud multi-tenant, private cloud hosted, hybrid and carrier-managed cloud services. Public Cloud Multi-Tenant led with a 52.0% share of 2025 value, because shared platforms are quick to deploy. Carrier-Managed Cloud grows fastest at 25.03% a year, as telecom operators connect their phone networks directly to cloud platforms.
Which company sizes spend the most on cloud communications?
Based on enterprise size, the market is categorized into micro and small enterprises, mid-market enterprises and large enterprises. Large Enterprises led with a 47.0% share of 2025 value, because big firms run many seats across several cities. Micro and Small Enterprises grow fastest at 25.26% a year, as small firms adopt virtual numbers and simple calling apps.
Which industries lead cloud communications adoption?
Based on end-use industry, the market is categorized into IT and telecom, BFSI, healthcare, professional services and BPO, and others. IT and Telecom led with a 30.0% share of 2025 value, because technology firms run distributed teams and global clients. Healthcare grows fastest at 25.17% a year, as hospitals and clinics add virtual consultations and patient calling.
| Segment Group | Leading Sub-segment | Share, 2025 | Fastest-growing Sub-segment | CAGR, 2026–2035 |
|---|---|---|---|---|
| By Solution Type | Integrated UC Suites | 38.0% | Cloud Telephony and PBX | 24.57% |
| By Deployment Model | Public Cloud Multi-Tenant | 52.0% | Carrier-Managed Cloud | 25.03% |
| By Enterprise Size | Large Enterprises | 47.0% | Micro and Small Enterprises | 25.26% |
| By End-Use Industry | IT and Telecom | 30.0% | Healthcare | 25.17% |
Request a Free Sample
Fill in your details and we'll send you a free sample report.
- Sample data tables & charts
- Research methodology
Broadband, small firms and licensed cloud voice lift demand
How do broadband scale and mobile-first connectivity widen use?
Broadband scale and mobile-first connectivity widen use, because cloud calling and video need reliable data links at offices, homes and field sites. India had 1,101.21 million broadband subscribers at the end of August 2026, according to TRAI subscription data, while 5G fixed wireless access reached 13.45 million connections. Telecom operators had installed 514,742 5G base stations by Nov. 30, 2025, and 5G service reached 773 of 776 districts by February 2025. Wireline connections, which many offices still use, totaled 48.45 million in August 2026. As a result, public cloud multi-tenant services held 52.0% of 2025 value, because shared platforms run well on these wider networks.
Why do MSME digitization and distributed teams add demand?
MSME digitization and distributed teams add demand, because small firms and branch offices need business numbers and meetings without buying PBX hardware. More than 8.84 crore enterprises had registered on the Udyam portals by June 30, 2026, according to KNN India. Annual registrations rose from 28.13 lakh in 2020-21 to more than 2.48 crore in 2023-24, which shows how fast firms are formalizing. The Department of Telecommunications also dropped registration for other service providers in November 2020 and allowed work from anywhere. In turn, micro and small enterprises grow at 25.26% a year, the fastest of all company sizes, as they add virtual numbers.
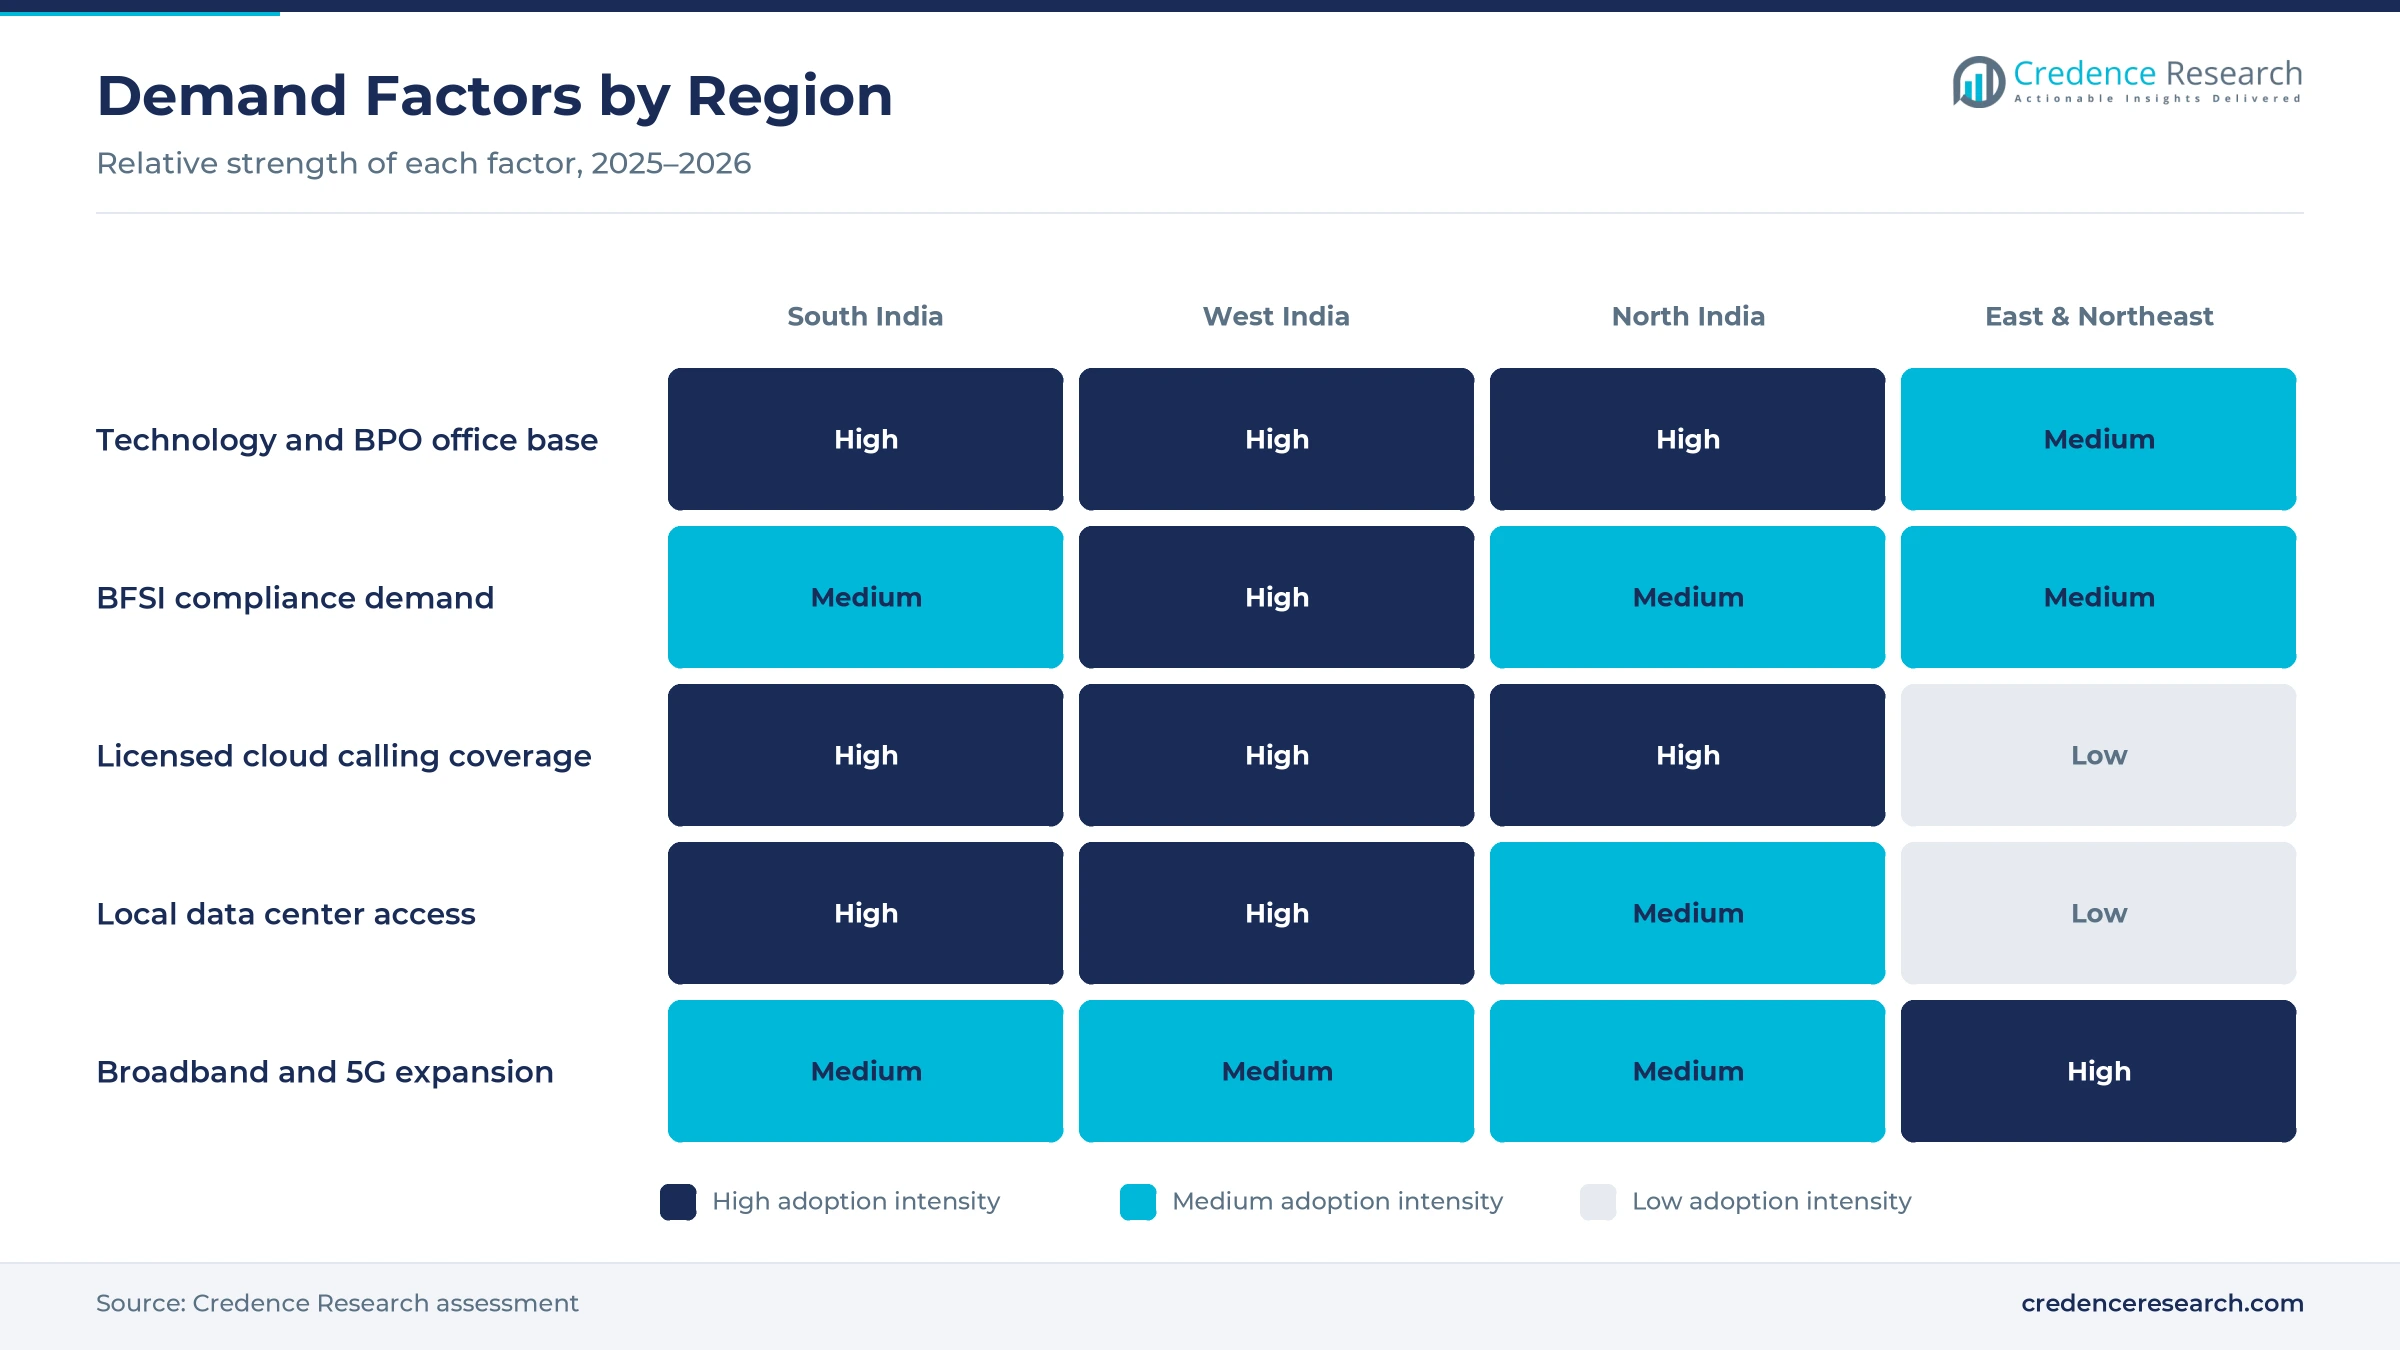
How is regulated cloud voice becoming easier to buy?
Regulated cloud voice is becoming easier to buy, because global platforms now connect to Indian phone networks through licensed local operators. Teams Phone calling through Operator Connect became generally available in India with Airtel, Tata Communications and Tata Tele Business Services on Feb. 5, 2024. Zoom completed its Zoom Phone rollout across six telecom circles on June 11, 2025, according to Zoom. Cisco said on Sept. 30, 2025, that Webex Calling would use cloud phone services from Airtel, Tata Teleservices and Tata Communications, according to Cisco. As a result, carrier-managed cloud grows at 25.03% a year, the fastest of all deployment models.
Why does hyperscale cloud investment support adoption?
Hyperscale cloud investment supports adoption, because local data centers cut call delay and help firms keep communications data inside India. Microsoft announced a USD 17.5 billion cloud and AI investment in India on Dec. 9, 2025, including a Hyderabad region with three availability zones due in mid-2026. Cisco also placed Webex Calling in dedicated data centers in Mumbai and Chennai in 2025. India's real GDP grew 7.8% in 2025 and is projected to grow 7% in 2026, according to IMF data. In turn, steady growth and local hosting help integrated UC suites keep 38.0% of 2025 value, the largest solution share.
AI assistants, local hosting and telco bundles gain ground
How is the shift toward AI-assisted calling changing services?
The shift toward AI-assisted calling is changing services, because buyers want summaries, routing and voice bots inside the same platform they use for calls. Zoom includes post-call summaries and voicemail task extraction through AI Companion at no extra cost for eligible paid Zoom Phone accounts in India. Exotel acqui-hired the Dubverse voice AI team in April 2026 and says it serves more than 7,000 enterprises and 20 billion interactions a year. Cisco also brought Webex Calling Customer Assist to India for the first time in September 2025. As a result, calling platforms increasingly overlap with cloud contact center services for front-line teams.
Why is the rise of in-country hosting significant?
The rise of in-country hosting is significant, because banks, insurers and public bodies prefer call records and recordings stored inside India. Cisco launched a fully regulated Webex Calling offer in India on Nov. 12, 2025, with call recordings, voicemail and call detail records stored locally in Mumbai and Chennai. Microsoft made Sovereign Public Cloud available from its Indian regions in December 2025, with built-in compliance guardrails. Cisco also planned Webex Contact Center hosting in Mumbai for the second quarter of 2026. In turn, BFSI buyers expand cloud seats, and providers add capacity in hyperscale data center campuses near Mumbai, Chennai and Hyderabad.
Can telco-bundled cloud voice open the small business segment?
Telco-bundled cloud voice can open the small business segment, because operators already bill millions of firms for mobile and broadband lines. Airtel Business and Vonage announced Airtel IQ Business Connect on Oct. 16, 2024, as a device-agnostic communications app that needs no additional hardware. Tata Tele Business Services markets its Smartflo suite with a 99.5% uptime guarantee and zero installation charges. More than 8.84 crore registered enterprises give operators a large base of small firms to target with these bundles. As a result, operators that bundle business cloud voice with connectivity can win first-time cloud buyers in smaller cities and towns.
Is the convergence with programmable messaging an opening?
Convergence with programmable messaging is an opening, because firms want calls, WhatsApp messages and customer alerts managed in one place. Gupshup agreed to buy cloud telephony firm Knowlarity in February 2022, when Knowlarity served more than 6,000 customers in 65 countries. Exotel combines voice AI, contact center and communications platform services for its 7,000-plus enterprise clients. Zoom also lets customers buy native numbers through a self-service portal for circles where Zoom Phone is not yet live and use them nationwide. In turn, providers that link calling with programmable voice and messaging APIs can sell more services to each account and reduce churn.
Licensing limits, voice quality and price pressure persist
How do telecom licensing rules limit service design?
Telecom licensing rules limit service design, because public phone calling must run through licensed operators and follow local interconnection rules. As a result, global platforms depend on partners for numbers and calling, which slows launches in some circles. Providers respond with operator partnerships and certified calling programs for each circle. In turn, firms that understand these rules can compete with global cloud-delivered unified communications platforms on equal terms.
Why does uneven voice and video quality slow adoption?
Uneven voice and video quality slows adoption, because some offices and homes outside the metros still face congested networks and power cuts. As a result, users drop calls or switch back to mobile phones, which weakens the business case for cloud seats. Providers respond with local media servers and adaptive audio codecs. In turn, wider 5G and fiber coverage should narrow this gap over the next few years.
How does price competition squeeze revenue per user?
Price competition squeezes revenue per user, because many firms already pay for bundled meeting tools and resist paying again for calling. As a result, providers face pressure to discount seats, especially for small firms and startups. Larger platforms respond by adding AI features and contact center options to justify higher plans. In turn, local providers compete on Indian-language support, quick setup and flexible billing.
Why does legacy PBX investment delay migration?
Legacy PBX investment delays migration, because many large firms still run on-premises systems with years of useful life left. As a result, these companies move in stages and keep desk phones in some branches. Providers respond with hybrid options that link old PBX systems to cloud platforms. In turn, hybrid deployments act as a bridge that lets firms switch fully once their hardware contracts end.
South India leads as eastern states grow fastest
| Region | Value, 2025 (USD billion) | Share, 2025 | CAGR, 2026–2035 |
|---|---|---|---|
| South India | 1.16 | 32.2% | 23.78% |
| North India | 1.02 | 28.4% | 23.68% |
| West India | 0.83 | 23.1% | 23.28% |
| East and Northeast India | 0.59 | 16.3% | 24.48% |
Why do southern technology hubs lead cloud seats?
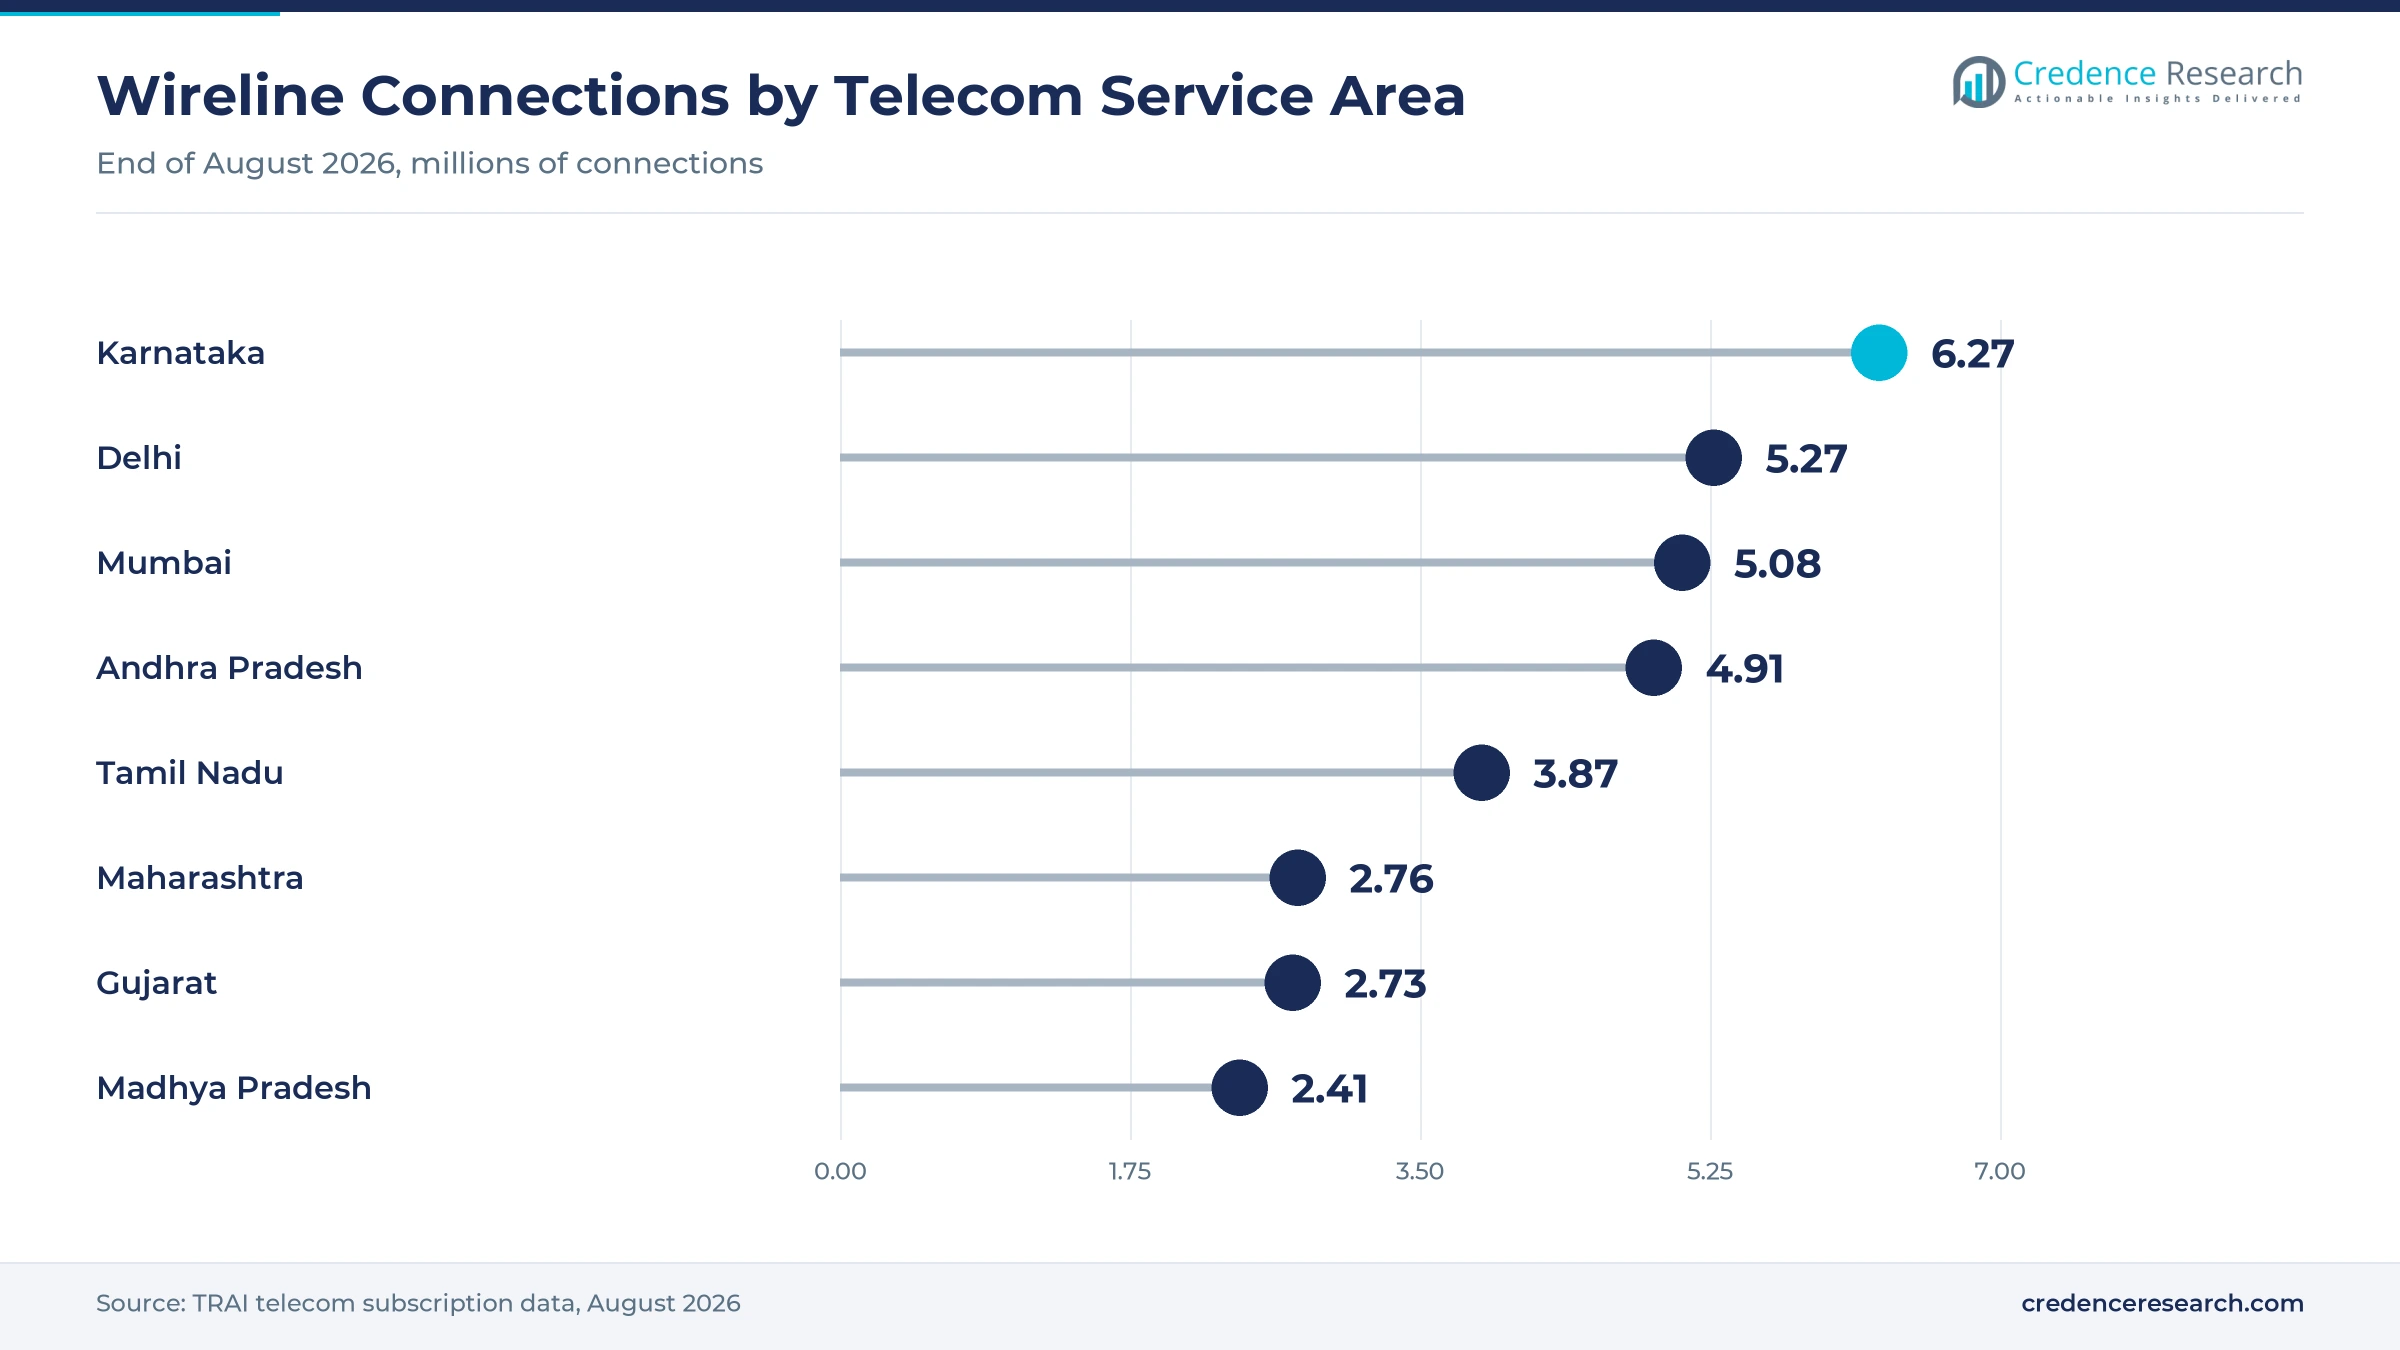
South India held a 32.2% share of 2025 value and grows at 23.78% a year, because Bengaluru, Hyderabad and Chennai host large technology firms, BPOs and global capability centers. Zoom Phone is live in the Karnataka, Tamil Nadu and Andhra Pradesh and Telangana circles. Karnataka also counted 6.27 million wireline connections in August 2026, the most of any service area. As a result, the region keeps the largest share of cloud communications spending.
How does the northern capital region add demand?
North India held a 28.4% share of 2025 value and grows at 23.68% a year, because Delhi NCR hosts government offices, corporate headquarters and large BPO campuses in Gurgaon and Noida. Zoom Phone added the Delhi NCR circle in June 2025. Delhi counted 5.27 million wireline connections in August 2026, the second-highest figure among service areas. In turn, the region generates strong demand for integrated suites and contact handling.
Why do western financial centers favor hosted calling?
West India held a 23.1% share of 2025 value and grows at 23.28% a year, because Mumbai and Pune host banks, insurers and professional services firms with strict compliance needs. Zoom Phone launched first in Maharashtra in October 2024, and Cisco hosts Webex Calling in a Mumbai data center. Mumbai alone counted 5.08 million wireline connections in August 2026. As a result, the region supports high spending on hosted and in-country calling.
How are eastern and northeastern states adding seats?
East and Northeast India held a 16.3% share of 2025 value and grows fastest at 24.48% a year, because broadband and 5G coverage are reaching more offices. Bihar had more than 1 million 5G fixed wireless connections in August 2026. Kolkata also counted 1.54 million wireline connections, which reflects its base of banks and service firms. In turn, the region gains share from a smaller base.
Platform launches and cloud investments in 2024–2026
| Development | Status and market relevance |
|---|---|
| In February 2024, Teams Phone calling through Operator Connect became generally available in India with Airtel, Tata Communications and Tata Tele Business Services. | Brings licensed cloud calling to Teams users |
| In June 2025, Zoom completed the rollout of Zoom Phone across six Indian telecom circles. | Extends licensed cloud calling to major cities |
| In September 2025, Cisco announced Webex Calling data centers in Mumbai and Chennai with cloud phone services from three Indian operators. | Raises local hosting and calling options |
| In December 2025, Microsoft announced a USD 17.5 billion cloud and AI investment in India, including a new Hyderabad region. | Expands local cloud capacity |
| In April 2026, Exotel acqui-hired the Dubverse voice AI team to strengthen its conversational platform. | Deepens voice AI in local cloud voice |
Operator links, AI assistants and local data centers
- Operator Connect links join cloud platforms directly to licensed telecom networks, which lets firms get local numbers without their own session border controllers.
- AI assistants write call summaries, pick tasks from voicemail and route callers, which saves agents and managers time on every call.
- Local data centers host calling and recordings inside India, which cuts call delay and helps banks and insurers meet data rules.
- Hybrid gateways connect existing PBX systems to cloud platforms, which lets large firms migrate branch by branch.
Need a Custom Version of This Report?
Tailor the scope, geography, or segments to your exact requirements.
- Custom geography or segment scope
- Direct access to our analyst team
Global platforms, telcos and local cloud voice firms compete
Competition is shaped by global platforms, Indian telecom operators and local cloud voice firms. Microsoft offers Teams Phone through Operator Connect with Airtel, Tata Communications and Tata Tele Business Services. Zoom sells Zoom Phone as an add-on in six telecom circles, while Cisco hosts Webex Calling in Mumbai and Chennai with operator partners. Airtel and Tata Tele Business Services bundle cloud calling with connectivity for enterprises and small firms. Exotel and Knowlarity compete in cloud telephony, contact handling and voice AI for mid-market buyers. RingCentral and MyOperator are also tracked in the Indian category. Rivals compete on licensing coverage, call quality, AI features, local hosting and price. Because buyers want one vendor for calls, meetings and chat, platforms with strong operator partnerships usually win the largest accounts.
Which companies provide cloud calling and collaboration in India?
| Company | Type | Role in the market |
|---|---|---|
| Microsoft Corporation | Global platform | Teams Phone Operator Connect live in India since February 2024 |
| Zoom Communications, Inc. | Global platform | Completed Zoom Phone rollout in six telecom circles in June 2025 |
| Cisco Systems, Inc. | Global platform | Hosts Webex Calling in Mumbai and Chennai data centers |
| Tata Communications Limited | Telecom operator | Offers Teams calling through its GlobalRapide platform |
| Bharti Airtel Limited | Telecom operator | Launched Airtel IQ Business Connect with Vonage in October 2024 |
| Tata Teleservices Limited | Telecom operator | Sells the Smartflo cloud suite and Teams Operator Connect |
| Exotel Techcom Pvt. Ltd. | Local cloud voice provider | Acqui-hired the Dubverse voice AI team in April 2026 |
Credence Research view on Indian cloud communications
Credence Research's view is that Indian cloud communications will grow several times faster than the economy, because firms are replacing PBX hardware and separate tools with one subscription platform. Integrated suites remain the largest value pool, while cloud telephony, carrier-managed cloud and small firms add the fastest growth. Operator partnerships have removed the main barrier for global platforms, and local data centers ease compliance concerns. Providers that combine licensed calling, AI features and Indian hosting should gain the most, while price competition keeps pressure on revenue per user.
How the Indian cloud communications estimate was built
The report uses 2025 as the base year on a calendar basis, and market values come from the Credence Research model. That model combines TRAI subscriber data, Udyam registration figures, IMF growth data and company releases on launches, partnerships and data centers. Regional shares follow the client's zone definitions, while segment splits and growth rates are Credence Research estimates. Sources used are official statistics, parliamentary replies, IMF data and company releases reported in trade media, and no interviews or surveys were used.
Licensed cloud voice and AI features carry growth to 2035
The India UCaaS market is expected to reach USD 30.38 billion by 2035, a 23.75% CAGR during 2026–2035, as firms move calling, meetings and messaging to cloud platforms. Growth should be strongest in cloud telephony, carrier-managed cloud, small firms and East and Northeast India, because these areas gain most from licensed operator links and wider broadband. AI assistants and local hosting will raise the value of each seat, while licensing limits, uneven network quality and price competition could slow some providers.
Frequently Asked Questions
How big is the India UCaaS market?
Which solution type leads Indian cloud communications spending?
Which region leads the Indian market?
How do global platforms offer phone calling in India?
Which deployment model is growing fastest?
Why are small businesses adopting cloud calling?
Who are the leading companies in the Indian market?
What are the main challenges for providers in India?
Table of Content
Chapter 1 Market Segmentation
- 1.1 Segmentation Framework
- 1.1.1 Product and Service Classification
- 1.1.2 Application and End-Use Classification
- 1.1.3 Technology and Solution Classification
- 1.1.4 Customer and Distribution Channel Classification
- 1.1.5 Geographic Segmentation
- 1.1.6 Market Segment Definitions and Boundaries
- 1.2 By Solution Type
- 1.2.1 Cloud Telephony and PBX
- 1.2.2 Video Meetings and Conferencing
- 1.2.3 Team Messaging and Presence
- 1.2.4 Integrated UC Suites
- 1.3 By Deployment Model
- 1.3.1 Public Cloud Multi-Tenant
- 1.3.2 Private Cloud Hosted
- 1.3.3 Hybrid UCaaS
- 1.3.4 Carrier-Managed Cloud
- 1.4 By Enterprise Size
- 1.4.1 Micro and Small Enterprises
- 1.4.2 Mid-Market Enterprises
- 1.4.3 Large Enterprises
- 1.5 By End-Use Industry
- 1.5.1 IT and Telecom
- 1.5.2 BFSI
- 1.5.3 Healthcare
- 1.5.4 Professional Services and BPO
- 1.5.5 Others
Chapter 2 Introduction
- 2.1 Report Objectives and Scope
- 2.2 Product Definition and Industry Terminology
- 2.3 Market Inclusions and Exclusions
- 2.4 Research Process
- 2.4.1 Primary Research and Expert Interviews
- 2.4.2 Secondary Research and Source Review
- 2.4.3 Top-Down and Bottom-Up Estimation
- 2.4.4 Data Triangulation and Verification
- 2.5 Market Size Measurement Basis
- 2.5.1 2025: USD 3.59 billion → 2035: USD 30.38 billion
- 2.6 Historical and Forecast Reference Periods
- 2.6.1 Historical Period: 2018-2025
- 2.6.2 Base Year: 2025
- 2.6.3 Forecast Period: 2025-2035
- 2.7 Research Assumptions and Limitations
Chapter 3 Executive Summary
- 3.1 Market Snapshot and Key Findings
- 3.2 Base-Year Market Size, 2025
- 3.3 Forecast Market Size, 2035
- 3.4 Revenue and Volume Growth Outlook
- 3.5 Key Demand and Supply Indicators
- 3.6 Leading Market Segments
- 3.7 Fastest-Growing Market Opportunities
- 3.8 Regional Performance Highlights
- 3.9 Technology and Industry Transformation
- 3.10 Competitive Landscape Summary
- 3.11 Analyst View and Strategic Implications
Chapter 4 India UCaaS Market Trends and Developments
- 4.1 Historical Industry Development, 2018-2025
- 4.2 Recent Market Trends and Developments
- 4.3 Demand and Customer Behavior Trends
- 4.4 Technology and Product Innovation
- 4.5 Artificial Intelligence, Automation and Digitalization
- 4.6 Local Manufacturing and Supply Chain Realignment
- 4.7 Industry Partnerships, Mergers and Acquisitions
- 4.8 Sustainability and Circular Economy Developments
- 4.9 Government and Private Sector Investment Trends
- 4.10 Emerging Business Models and Commercialization
- 4.11 Industry Developments and Announcements
Chapter 5 India UCaaS Market Production, Supply and Demand Analysis
- 5.1 Demand Trend and Consumption Analysis, 2018-2025
- 5.2 Demand Forecast, 2025-2035
- 5.3 Production and Output Trend, 2018-2025
- 5.4 Production and Output Forecast, 2025-2035
- 5.5 Installed Capacity and Capacity Utilization
- 5.6 Company-Wise Production Plants and Statistics
- 5.6.1 Installed Production Capacity
- 5.6.2 Actual Production
- 5.6.3 Planned Capacity and Expansion Targets
- 5.7 Supply Chain Structure and Procurement Trends
- 5.8 Supply-Demand Gap and Bottlenecks
- 5.9 Import Dependence and Sourcing Structure
- 5.10 Contract Manufacturing and Outsourcing
- 5.11 Regional Supply and Demand Concentration
Chapter 6 India UCaaS Market Pricing Analysis
- 6.1 Pricing Structure and Measurement
- 6.2 Historical Pricing Trends, 2018-2025
- 6.3 Pricing Outlook, 2025-2035
- 6.4 Average Selling Price and Unit Economics
- 6.5 Pricing by Product and Market Segment
- 6.6 Geographic Pricing Differences
- 6.7 Key Input, Energy, Labor and Logistics Costs
- 6.8 Contract Pricing and Purchasing Models
- 6.9 Pricing Sensitivity and Competitive Positioning
- 6.10 Price, Margin and Profitability Implications
Chapter 7 India UCaaS Market Dynamics
- 7.1 Market Growth Drivers
- 7.1.1 Demand-Side Drivers
- 7.1.2 Technology and Innovation Drivers
- 7.1.3 Infrastructure and Investment Drivers
- 7.1.4 Regulatory and Policy Drivers
- 7.2 Market Restraints
- 7.2.1 Cost and Affordability Constraints
- 7.2.2 Technology and Adoption Barriers
- 7.2.3 Supply Chain and Operational Constraints
- 7.3 Market Challenges
- 7.3.1 Competitive Pressure and Margin Erosion
- 7.3.2 Skills, Infrastructure and Implementation Gaps
- 7.4 Emerging Market Opportunities
- 7.5 Market Dynamics Impact and Time-Horizon Assessment
Chapter 8 India UCaaS Value Chain Analysis
- 8.1 Industry Value Chain Overview
- 8.2 Upstream Suppliers and Critical Inputs
- 8.3 Technology and Component Providers
- 8.4 Manufacturing or Service Delivery
- 8.5 Distribution, Channel Partners and Integrators
- 8.6 Downstream Applications and End Users
- 8.7 Value Addition and Profit Pools
- 8.8 Vertical Integration and Outsourcing
- 8.9 Supplier Concentration and Risk
- 8.10 Supply Chain Localization and Resilience
Chapter 9 India UCaaS Market Regulations and Policies
- 9.1 Relevant Laws, Standards and Compliance Frameworks
- 9.2 Product, Service, Safety and Quality Requirements
- 9.3 Government Policies, Incentives and Subsidies
- 9.4 Imports, Exports and Trade Barriers
- 9.5 Public Procurement and Local Content Requirements
- 9.6 Environmental and Sustainability Compliance
- 9.7 Data Protection, AI and Cybersecurity Compliance
- 9.8 Upcoming Policy Changes and Market Implications
Chapter 10 India UCaaS Market Hotspots and Opportunities
- 10.1 Market Opportunity Mapping and Growth Hotspots
- 10.2 High-Growth Applications and Customer Groups
- 10.3 Underserved Markets and White-Space Opportunities
- 10.4 Emerging Technology and Product Opportunities
- 10.5 New Capacity and Investment Hotspots
- 10.6 Market Entry and Expansion Opportunities
- 10.7 Distribution and Partnership Opportunities
- 10.8 Near-Term and Long-Term Commercial Potential
- 10.9 Opportunity Attractiveness and Execution Risks
Chapter 11 India UCaaS Market Outlook, 2025-2035
- 11.1 Market Size and Analysis
- 11.1.1 Revenue (Market Measurement: 2025: USD 3.59 billion → 2035: USD 30.38 billion)
- 11.1.2 Market Volume and Quantity Sold
- 11.1.3 Historical Market Size, 2018-2025
- 11.1.4 Base-Year Market Size, 2025
- 11.2 Market Forecast, 2025-2035
- 11.2.1 Revenue Forecast to 2035
- 11.2.2 Volume Forecast to 2035
- 11.2.3 CAGR and Year-on-Year Growth
- 11.2.4 Incremental Revenue Opportunity
- 11.3 Forecast Assumptions and Scenario Analysis
- 11.3.1 Base-Case Forecast
- 11.3.2 Optimistic and Conservative Scenarios
- 11.3.3 Technology, Pricing and Policy Sensitivities
- 11.4 Market Attractiveness and Growth Outlook
Chapter 12 India UCaaS Market Segmentation and Outlook
- 12.1 Segmentation Summary and Market Shares, 2025
- 12.2 Largest and Fastest-Growing Segments
- 12.3 By Solution Type - Market Size and Forecast, 2025-2035
- 12.3.1 Segment Definition and Scope
- 12.3.2 Historical Market Size, 2018-2025
- 12.3.3 Revenue Forecast, 2025-2035
- 12.3.4 Volume Forecast, 2025-2035
- 12.3.5 Base-Year Market Share, 2025
- 12.3.6 Segment CAGR and Growth Drivers
- 12.3.7 Subsegment Market Size and Forecast
- 12.3.7.1 Cloud Telephony and PBX
- 12.3.7.2 Video Meetings and Conferencing
- 12.3.7.3 Team Messaging and Presence
- 12.3.7.4 Integrated UC Suites
- 12.3.8 Subsegment Pricing and Adoption Trends
- 12.3.9 Leading Suppliers and Competition
- 12.3.10 Regional Demand and Opportunities
- 12.4 By Deployment Model - Market Size and Forecast, 2025-2035
- 12.4.1 Segment Definition and Scope
- 12.4.2 Historical Market Size, 2018-2025
- 12.4.3 Revenue Forecast, 2025-2035
- 12.4.4 Volume Forecast, 2025-2035
- 12.4.5 Base-Year Market Share, 2025
- 12.4.6 Segment CAGR and Growth Drivers
- 12.4.7 Subsegment Market Size and Forecast
- 12.4.7.1 Public Cloud Multi-Tenant
- 12.4.7.2 Private Cloud Hosted
- 12.4.7.3 Hybrid UCaaS
- 12.4.7.4 Carrier-Managed Cloud
- 12.4.8 Subsegment Pricing and Adoption Trends
- 12.4.9 Leading Suppliers and Competition
- 12.4.10 Regional Demand and Opportunities
- 12.5 By Enterprise Size - Market Size and Forecast, 2025-2035
- 12.5.1 Segment Definition and Scope
- 12.5.2 Historical Market Size, 2018-2025
- 12.5.3 Revenue Forecast, 2025-2035
- 12.5.4 Volume Forecast, 2025-2035
- 12.5.5 Base-Year Market Share, 2025
- 12.5.6 Segment CAGR and Growth Drivers
- 12.5.7 Subsegment Market Size and Forecast
- 12.5.7.1 Micro and Small Enterprises
- 12.5.7.2 Mid-Market Enterprises
- 12.5.7.3 Large Enterprises
- 12.5.8 Subsegment Pricing and Adoption Trends
- 12.5.9 Leading Suppliers and Competition
- 12.5.10 Regional Demand and Opportunities
- 12.6 By End-Use Industry - Market Size and Forecast, 2025-2035
- 12.6.1 Segment Definition and Scope
- 12.6.2 Historical Market Size, 2018-2025
- 12.6.3 Revenue Forecast, 2025-2035
- 12.6.4 Volume Forecast, 2025-2035
- 12.6.5 Base-Year Market Share, 2025
- 12.6.6 Segment CAGR and Growth Drivers
- 12.6.7 Subsegment Market Size and Forecast
- 12.6.7.1 IT and Telecom
- 12.6.7.2 BFSI
- 12.6.7.3 Healthcare
- 12.6.7.4 Professional Services and BPO
- 12.6.7.5 Others
- 12.6.8 Subsegment Pricing and Adoption Trends
- 12.6.9 Leading Suppliers and Competition
- 12.6.10 Regional Demand and Opportunities
- 12.7 Segment Growth Comparison
- 12.8 Segment Attractiveness and Priority Matrix
Chapter 13 India UCaaS End-Use and Application Market Outlook
- 13.1 End-Use Industry and Customer Demand Structure
- 13.2 Leading Applications and Customer Groups
- 13.3 End-Use Market Size, Share and Forecast
- 13.4 Major End-Use Industry Deep Dives
- 13.4.1 Customer Requirements and Use Cases
- 13.4.2 Demand and Replacement Cycles
- 13.4.3 Technical and Regulatory Considerations
- 13.4.4 Purchasing and Procurement Models
- 13.4.5 Leading Vendors and Distribution Channels
- 13.4.6 Forecast and Commercial Opportunities
- 13.5 Emerging Applications and Cross-Segment Demand
- 13.6 End-Use Industry Investment Priorities
Chapter 14 India UCaaS Geographic Market Outlook, 2025-2035
- 14.1 Domestic Market Distribution and Demand Clusters
- 14.2 State- or Province-Wise Market Size and Forecast, 2025-2035
- 14.3 City and Metropolitan Market Outlook
- 14.4 Industrial, Manufacturing and Commercial Clusters
- 14.5 Geographic Concentration of Key End Users
- 14.6 Local Pricing and Purchasing Differences
- 14.7 Domestic Production Facilities and Capacity Map
- 14.8 Local Infrastructure and Project Pipeline
- 14.9 State-Level Policy and Incentive Differences
- 14.10 Subnational Investment Hotspots and Opportunities
- 14.11 Distribution and Logistics Networks
- 14.12 Domestic Competitive Footprint
Chapter 15 India UCaaS Technology, Innovation and Sustainability Outlook
- 15.1 Technology Landscape and Maturity
- 15.2 Product, Process and Service Innovation
- 15.3 AI, Automation and Digital Tools in the Industry
- 15.4 Technology Adoption and Performance Benchmarking
- 15.5 Innovation Pipeline and R&D Investment
- 15.6 Patent and Intellectual Property Trends
- 15.7 Energy Efficiency and Resource Management
- 15.8 Sustainability, Recycling and Circularity
- 15.9 Technology Roadmap, 2025-2035
- 15.10 Risks of Obsolescence and Technology Substitution
Chapter 16 India UCaaS Market Key Strategic Imperatives
- 16.1 Growth and Market Entry Priorities
- 16.2 High-Return Products and Segments
- 16.3 Pricing, Profitability and Cost Optimization
- 16.4 Technology Investment and Product Differentiation
- 16.5 Supply Chain Localization and Resilience
- 16.6 Distribution and Customer Acquisition
- 16.7 Partnership, Acquisition and Capacity Strategy
- 16.8 Regional Expansion Priorities
- 16.9 Short-, Medium- and Long-Term Actions
Chapter 17 Competition Outlook
- 17.1 Industry Competition Characteristics
- 17.2 Market Structure and Concentration
- 17.3 Market Share and Competitive Positioning, 2025
- 17.4 Company-Wise Revenue and Product Benchmarking
- 17.5 Production and Service Capacity Benchmarking
- 17.6 Technology, Pricing and Differentiation
- 17.7 Regional Footprint and Distribution Strength
- 17.8 Mergers, Acquisitions and Strategic Alliances
- 17.9 New Entrants and Competitive Threats
- 17.10 Porter's Five Forces and Industry Attractiveness
- 17.11 Competitive Outlook, 2025-2035
Chapter 18 Company Profiles
- 18.1 Company Coverage and Selection Criteria
- 18.2 Microsoft Corporation
- 18.2.1 Business Description
- 18.2.2 Company Ownership and Geographic Presence
- 18.2.3 Product and Service Portfolio
- 18.2.4 Manufacturing and Operating Footprint
- 18.2.5 Production Capacity and Expansion Plans
- 18.2.6 Financial Performance and Investment
- 18.2.7 Market Share and Competitive Position
- 18.2.8 Technology and Innovation Capabilities
- 18.2.9 Strategic Alliances or Partnerships
- 18.2.10 Recent Developments
- 18.2.11 Growth Strategy and Outlook
- 18.3 Cisco Systems, Inc.
- 18.4 Zoom Communications, Inc.
- 18.5 RingCentral, Inc.
- 18.6 Tata Communications Limited
- 18.7 Bharti Airtel Limited
- 18.8 Tata Teleservices Limited
- 18.9 Exotel Techcom Pvt. Ltd.
- 18.10 Knowlarity
- 18.11 MyOperator
- 18.12 Other Relevant Market Participants
Note: Every listed company is profiled on the structure shown under the first company. The company list is preliminary and may change based on research findings, market developments, data availability and client requirements.
Chapter 19 Disclaimer
- 19.1 Research and Forecast Disclaimer
- 19.2 Data Source and Estimation Limitations
Note: The depth of individual sections depends on data availability for this market. Volume, capacity, trade and other unit-based metrics are included where applicable.

