
Steel fabrication volumes anchor Indian filler metal demand
The India welding consumables market was valued at USD 1.32 billion in 2025 and is projected to increase from USD 1.40 billion in 2026 to USD 2.27 billion by 2035, registering a CAGR of 5.52% during 2026–2035. Demand comes from fabricators that join structural steel for bridges and buildings, factories that weld vehicles and machinery, and contractors that lay pipelines and build ships, boilers and rolling stock. South India held the largest regional share, 30.3% in 2025, because Tamil Nadu has the most registered factories in the country and Chennai hosts major consumable suppliers. East and Central India is the fastest-growing region at 5.95% a year, as freight corridors and new consumable plants in Chhattisgarh, West Bengal and Maharashtra's Vidarbha belt expand. Rules have also tightened, because covered electrodes and gas shielded welding rods and wires now need the Bureau of Indian Standards mark. As a result, certified brands are gaining ground over unmarked electrodes sold through local hardware counters.
What does the estimate count, from electrodes to submerged arc flux?
The estimate measures the value of stick electrodes, solid wires, flux-cored wires, submerged arc wires and fluxes, and specialty filler metals sold in India for arc welding, hardfacing and cladding. Values are stated at the prices that fabricators, vehicle makers, contractors, shipyards and maintenance teams pay through direct contracts, distributors, dealers, online procurement and public tenders.
The estimate excludes welding machines, torches, cables, shielding gases, protective equipment and exports of finished consumables. The value chain runs from wire rod, ferroalloy and flux mineral suppliers through electrode and wire plants to distributors and dealers, and onward to welders on fabrication floors, construction sites and plant maintenance crews.
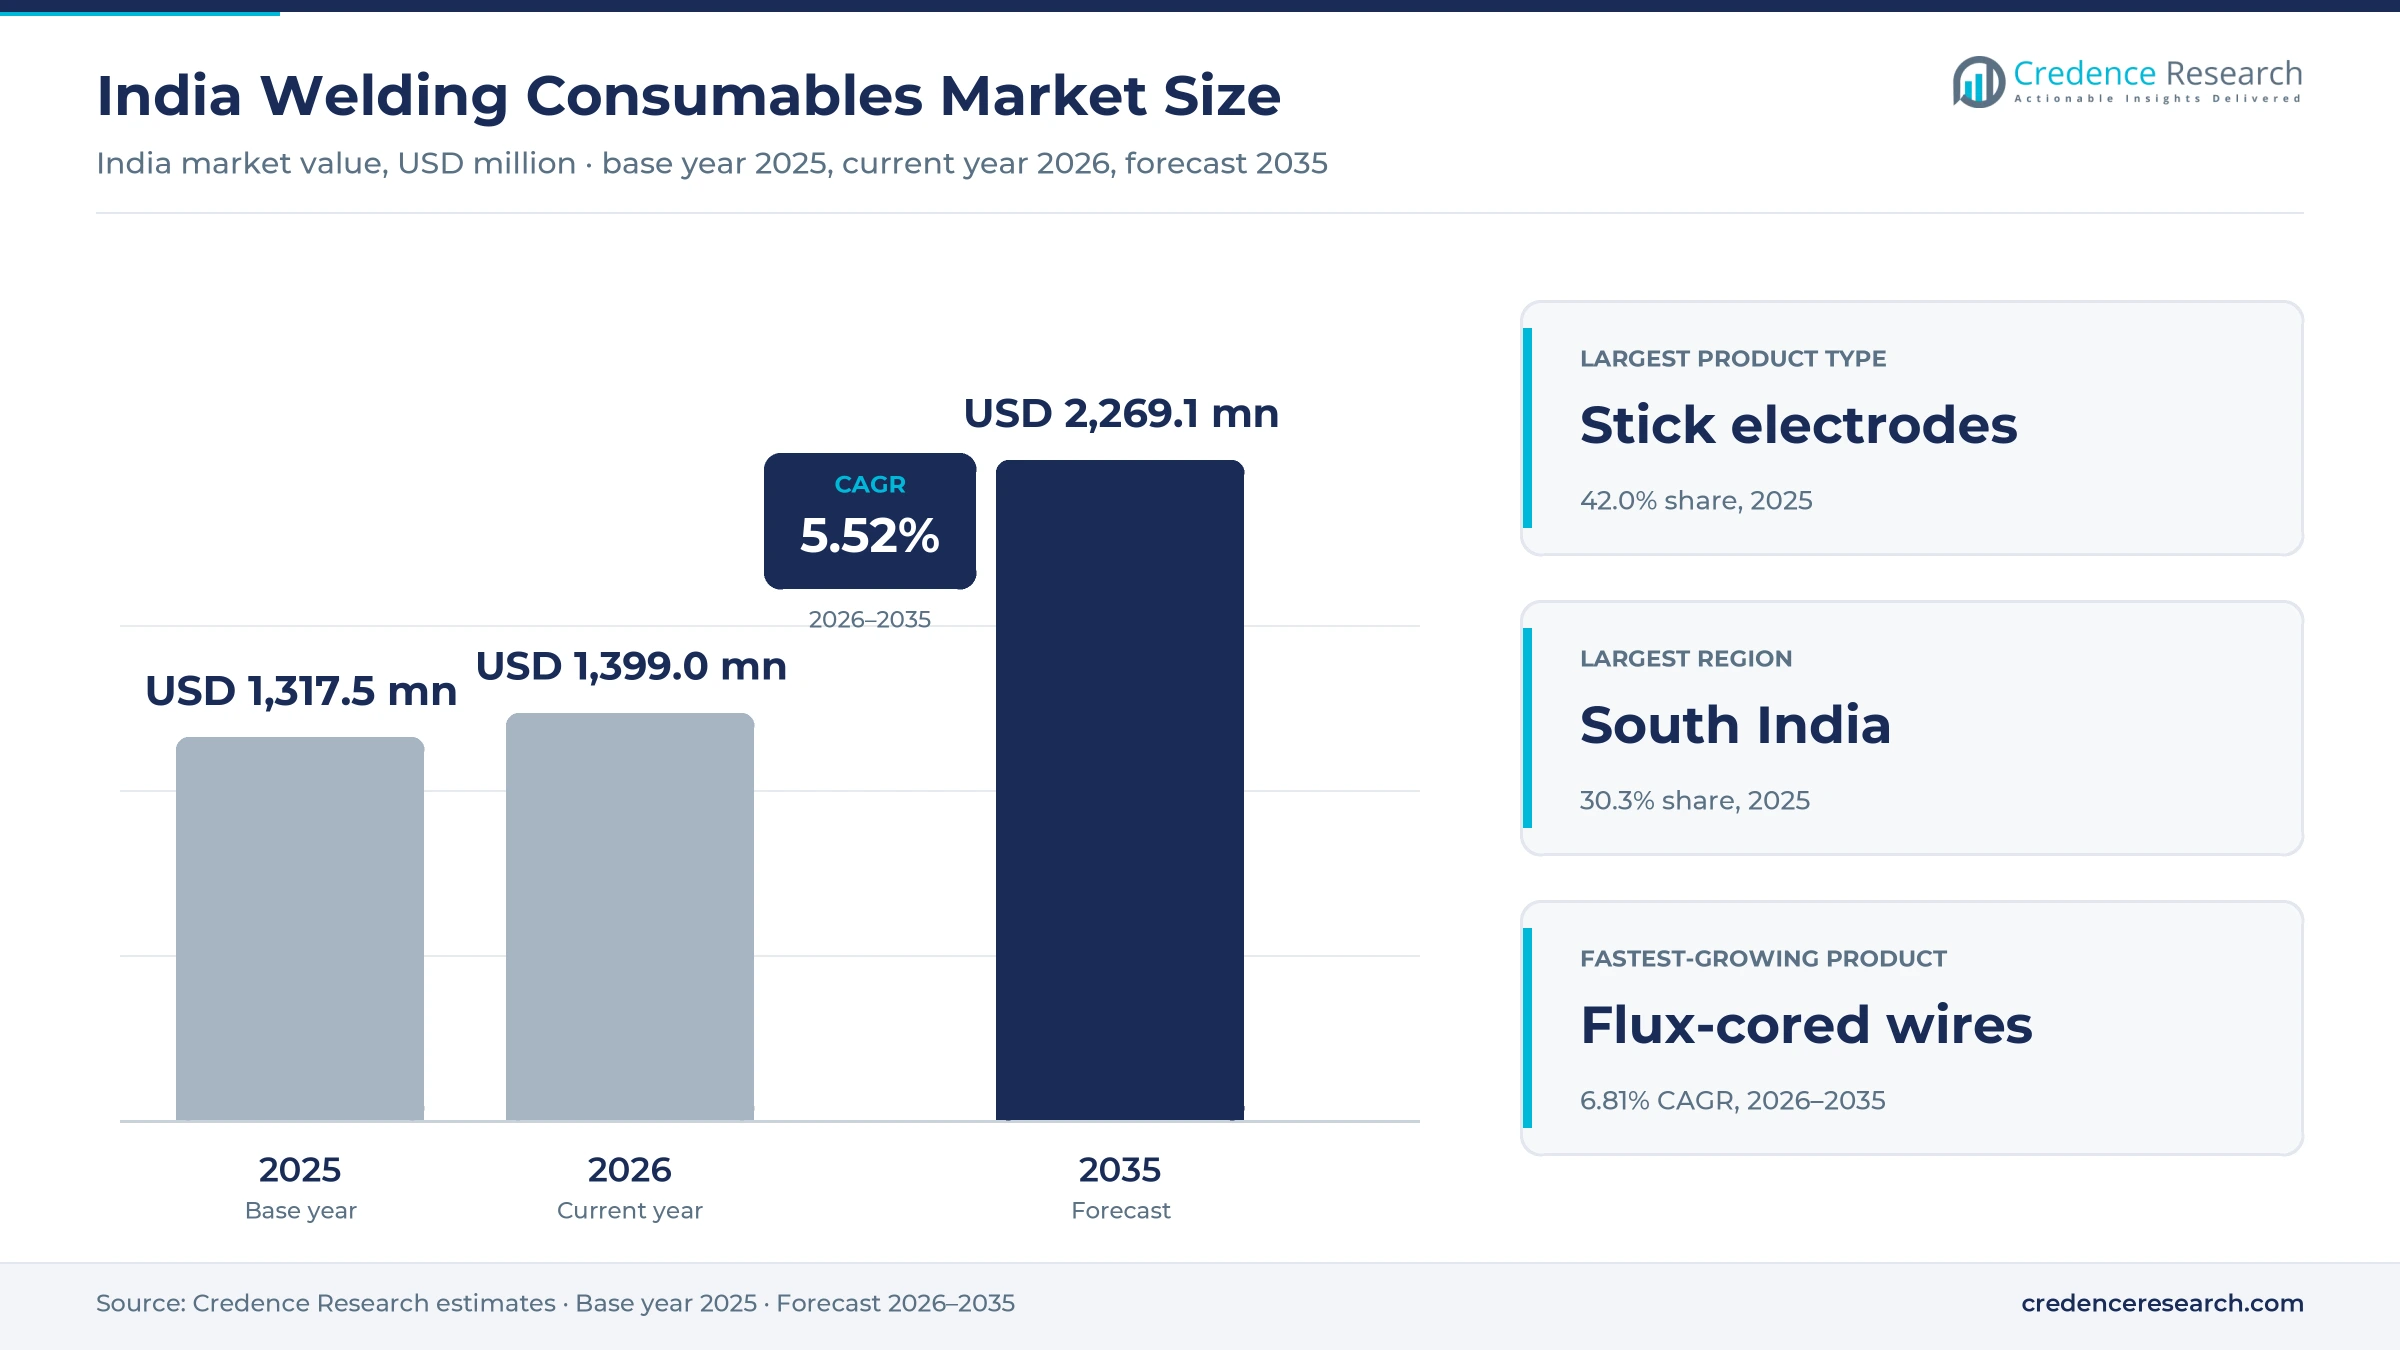
India Welding Consumables Market Insights
- The India welding consumables market was valued at USD 1.32 billion in 2025 and is projected to reach USD 2.27 billion by 2035, registering a CAGR of 5.52% during 2026–2035.
- South India held a 30.3% share of 2025 value, because Tamil Nadu leads the country in registered factories and Chennai hosts major consumable suppliers.
- Stick electrodes led with a 42.0% share of 2025 value, because site welders, small workshops and repair crews still rely on manual metal arc welding.
- Finished steel consumption in India reached 152.13 million metric tons in fiscal 2024-25, up from 136.29 million a year earlier, which widened the fabrication base.
- Indian Railways received a record capital budget of INR 2.93 lakh crore for 2026-27, which supports wagon, coach and bridge welding through the decade.
Stick electrodes lead while flux-cored wires grow fastest
Why do stick electrodes still lead product demand?
Based on product type, the market is categorized into stick electrodes, solid wires, flux-cored wires, submerged arc wires and fluxes, and specialty filler metals. Stick Electrodes led with a 42.0% share of 2025 value, because site welders, small workshops and repair crews use manual metal arc welding with simple power sources. Flux-Cored Wires grow fastest at 6.81% a year, as fabricators move to semiautomatic welding for higher deposition rates.
Which industries buy the most filler metal?
Based on end-use industry, the market is categorized into automotive and transportation, construction and infrastructure, heavy engineering and capital goods, oil, gas and process industries, and shipbuilding, rail and power. Construction and Infrastructure led with 30.0% of 2025 value, because bridges, metro viaducts, towers and steel buildings consume large tonnages of electrodes and wire. Shipbuilding, Rail and Power grows fastest at 6.06% a year, as shipyards, wagon builders and power plants expand.
How do fabrication and repair split the application mix?
Based on application, the market is categorized into fabrication welding, maintenance and repair, pipeline and pressure vessel, structural steel joining and hardfacing and cladding. Fabrication Welding led with 38.0% of 2025 value, because machinery, vehicle and equipment plants weld new parts every shift. Hardfacing and Cladding grows fastest at 6.15% a year, as steel, cement, mining and sugar plants rebuild worn parts instead of replacing them.
Which buyers account for the largest purchases?
Based on customer type, the market is categorized into large fabricators and OEMs, mid-size engineering firms, MSME workshops, EPC contractors and maintenance service providers. Large Fabricators and OEMs led with 34.0% of 2025 value, because vehicle makers, heavy engineering groups and steel structure builders buy under annual supply contracts. EPC Contractors grow fastest at 5.98% a year, as rail, pipeline and shipyard projects move to execution.
| Segment Group | Leading Sub-segment | Share, 2025 | Fastest-growing Sub-segment | CAGR, 2026–2035 |
|---|---|---|---|---|
| By Product Type | Stick Electrodes | 42.0% | Flux-Cored Wires | 6.81% |
| By End-Use Industry | Construction and Infrastructure | 30.0% | Shipbuilding, Rail and Power | 6.06% |
| By Application | Fabrication Welding | 38.0% | Hardfacing and Cladding | 6.15% |
| By Customer Type | Large Fabricators and OEMs | 34.0% | EPC Contractors | 5.98% |
Request a Free Sample
Fill in your details and we'll send you a free sample report.
- Sample data tables & charts
- Research methodology
Steel, rail, vehicles and shipyards lift electrode use
How does record steel use lift electrode and wire volumes?
Welding consumables track the tonnage of steel that Indian fabricators cut, fit and join, so record steel use lifts electrode and wire volumes directly. Finished steel consumption reached 152.13 million metric tons in fiscal 2024-25, up from 136.29 million a year earlier, according to the Ministry of Steel. Crude steel capacity stood at 200.3 million metric tons, and the National Steel Policy targets 300 million metric tons by 2030-31. The third round of the production-linked incentive scheme for specialty steel, launched on Nov. 4, 2025, is expected to attract committed investment of INR 13,203 crore. As a result, more steel passes through fabrication shops each year, while tool steel makers add alloy grades that need matching filler metals.
Why do rail and infrastructure budgets sustain demand?
Public capital spending keeps bridges, metro viaducts, freight corridors and rolling stock on fabricators' order books, and each project consumes large volumes of submerged arc and stick consumables. Public capital expenditure rose to INR 12.2 lakh crore in the Union Budget 2026-27, according to the Press Information Bureau's New India Samachar. Indian Railways received a record capital budget of INR 2.93 lakh crore for 2026-27, with targets of 32,000 wagons and 10,392 coaches, according to PRS Legislative Research. The 1,506-km Western Dedicated Freight Corridor was about 93% commissioned, while the 1,337-km Eastern corridor is fully commissioned. In turn, construction and infrastructure led end use with 30.0% of 2025 value, supported by wider building construction activity.
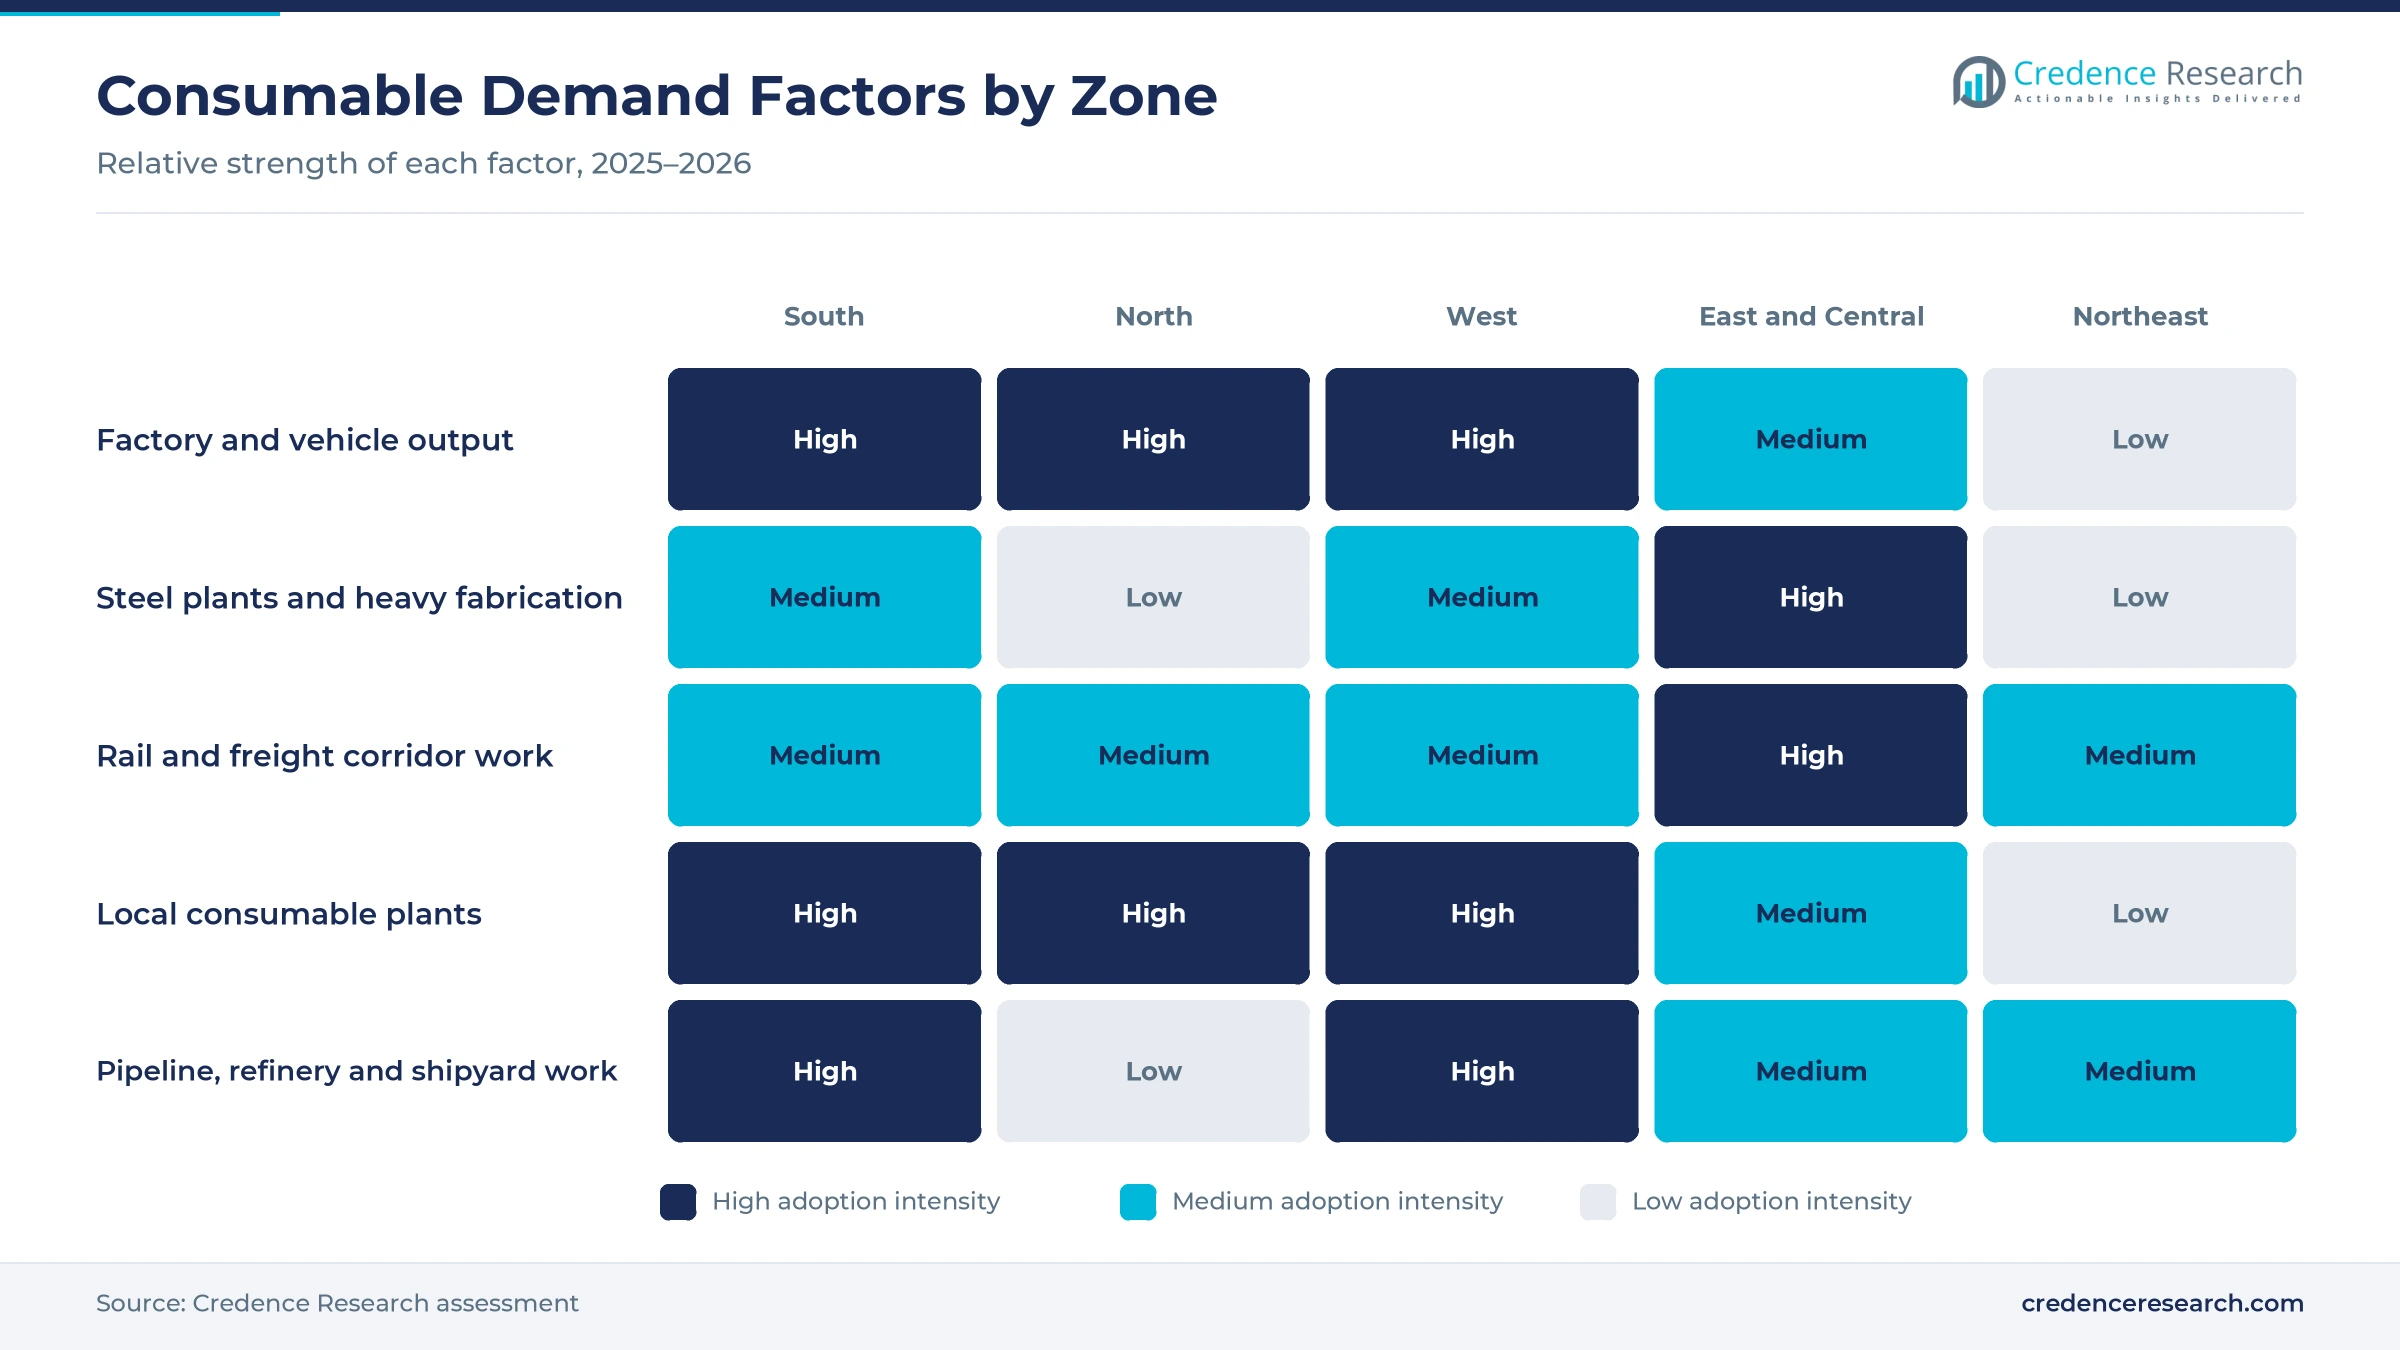
How does automotive output scale raise solid wire use?
Vehicle plants and their component suppliers run robotic MIG-MAG lines across every shift, so higher output raises solid wire demand almost unit for unit. Indian automakers produced 3.47 crore vehicles in fiscal 2025-26, while commercial vehicle sales rose 12.6% to 10.80 lakh units, according to Society of Indian Automobile Manufacturers data reported by Autoguide India. Maruti Suzuki made more than 23.4 lakh vehicles in the same year, its highest ever and it identified land at Khoraj in Gujarat for a fifth plant of 10 lakh units, according to a Maruti Suzuki release. Chassis, exhaust and seat frame lines need consistent wire feed, as do body panel stamping suppliers that weld subassemblies. As a result, solid wires grow faster than the total market.
Why do shipyards and gas pipelines add high-value demand?
Shipyards, gas pipelines and power projects use consumables that carry classification society and code approvals, which raises value per kilogram. The Union Cabinet approved a package worth INR 69,725 crore for shipbuilding and maritime development on Sept. 24, 2025, according to the Prime Minister's official website. The package includes a Shipbuilding Financial Assistance Scheme worth INR 24,736 crore running to March 31, 2036, and targets 4.5 million gross tonnage of capacity. India also had 25,429 km of natural gas pipelines operating in June 2025 and 10,459 km under construction, the petroleum ministry told Parliament in December 2025. In turn, shipbuilding, rail and power grows fastest by end use at 6.06% a year.
Wire processes, BIS rules and local plants reshape supply
How is the shift from electrodes to wire processes changing the mix?
Fabricators are moving from stick electrodes to solid and flux-cored wires, because continuous wire feed raises deposition rates and cuts the stops for electrode changes. Classic Electrodes, which raised about INR 41.50 crore through an issue that opened on Aug. 22, 2025, runs 8,600 metric tons a year of MIG wire capacity beside 10,608 metric tons of electrodes, according to a PTI report carried by The Week. Ador Welding supplies solid and flux-cored wire in drum packs to reduce spool changes on automated lines, according to Industrial Automation India. voestalpine Bohler Welding also said in January 2025 that it plans to add solid wire production in India. As a result, flux-cored wires grow fastest at 6.81% a year.
Why is the rise of mandatory BIS certification reshaping supply?
Quality control orders have made the Bureau of Indian Standards mark compulsory for the most common electrodes and wires, which raises the cost of selling unmarked products. The Department for Promotion of Industry and Internal Trade notified a draft order covering IS 814 covered electrodes and IS 6419 welding rods and bare electrodes for gas shielded arc welding to the World Trade Organization. Enforcement began on Jan. 16, 2024, for larger makers, April 16, 2024, for small enterprises and July 16, 2024, for micro enterprises, according to the law firm Economic Laws Practice. Products must carry the Standard Mark under a bureau license, while goods made for export are exempt. In turn, certified brands are winning dealer shelf space from unmarked local electrodes.
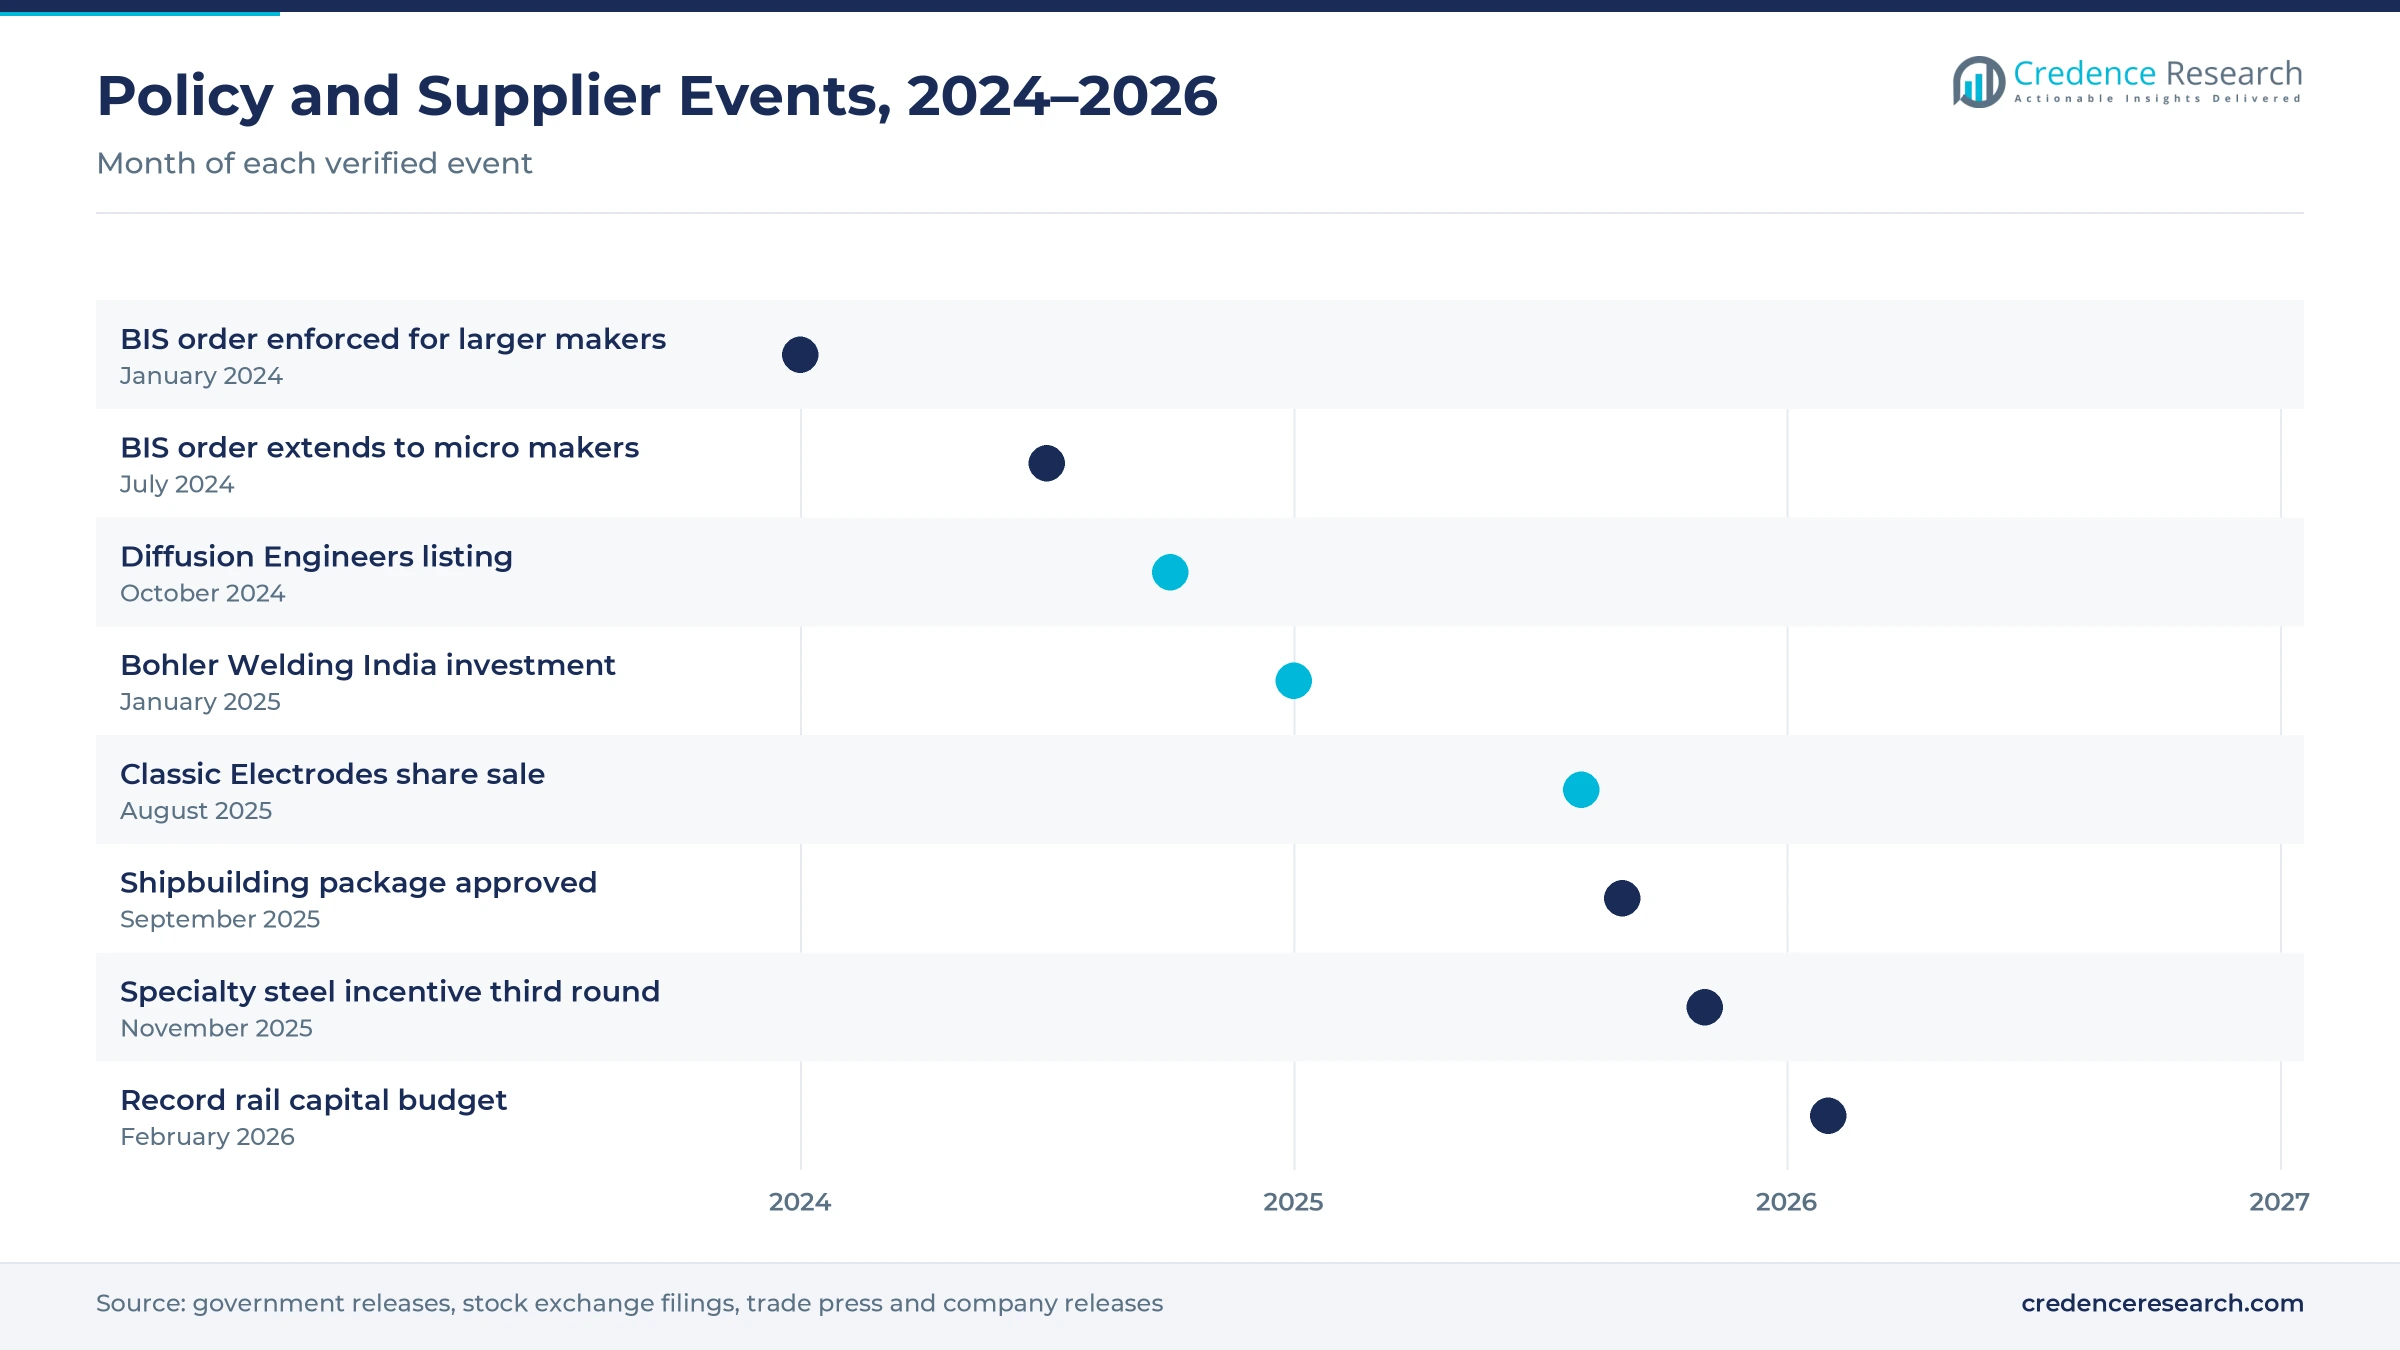
Can new local plants open room for import substitution?
Foreign and domestic suppliers are adding Indian capacity, which opens room to replace imported wires and specialty grades with local supply. voestalpine Bohler Welding said on Jan. 28, 2025, that it had invested about EUR 3 million in its Indian sites at Bhiwadi, Thane and Delhi, which employed about 250 people. Diffusion Engineers listed its shares on Oct. 4, 2024, and planned a new manufacturing facility in Nagpur from the proceeds, according to 5paisa. Modi Hitech runs 9,600 metric tons a year of electrode and wire capacity at Modipuram in Uttar Pradesh, according to its group website. As a result, EPC contractors grow fastest by customer type at 5.98% a year, as local supply shortens project lead times.
Is hardfacing and repair welding an opening for specialists?
Steel, cement, mining and sugar plants increasingly rebuild worn rollers, crushers and hammers with hardfacing alloys instead of buying new parts, which opens a higher-margin niche. Basic metals ranked among the five industries that together produced more than 45% of manufacturing gross value added in 2024-25, according to the Ministry of Statistics and Programme Implementation. EWAC Alloys, which Larsen & Toubro agreed to sell to ESAB in October 2017, according to a PTI report carried by Business Standard, specializes in maintenance, repair and hardfacing consumables. Modi Hitech sells electrodes to railways, rolling mills and sugar mills, while D&H Secheron offers reclamation electrodes and flux-cored wires for surfacing. In turn, hardfacing and cladding grows fastest by application at 6.15% a year.
Wire rod costs and low-price electrodes squeeze margins
How do wire rod and alloy costs squeeze margins?
Steel wire rod, ferroalloys, nickel and flux minerals make up most of the cost of a kilogram of electrode or wire, and their prices move with steel and metal cycles. Consumable makers often hold dealer prices fixed for a quarter, so sudden input increases create cost pressure before price lists change. As a result, smaller electrode makers without purchasing scale feel the squeeze first. Larger suppliers respond with index-linked contracts, wider alloy ranges and tighter inventory planning to limit that risk.
Why does low-price unorganized supply hold back value?
Hundreds of small plants still sell general purpose electrodes at low prices through hardware counters in towns and industrial estates. Many MSME workshops buy on price per packet rather than deposition rate or weld quality, which keeps average realization low in the largest product group. In turn, branded makers must offer economy lines and small packs to compete. Stronger enforcement of BIS marking rules should gradually move volume toward certified suppliers.
How does the welder skills gap slow the move to wires?
Semiautomatic and robotic processes need welders who can set wire feed, gas flow and pulse parameters, while many site welders learned only manual stick welding. Fabricators that lack trained staff delay the switch to solid and flux-cored wires, which slows the most productive part of the market. As a result, suppliers and training institutes run welding schools and certification courses. Ador Welding has trained and certified welders and inspectors for about seven decades through its training division.
Why do tender pricing and payment delays strain suppliers?
Government departments, public sector units and EPC contractors buy large volumes through tenders that reward the lowest compliant price. Payment cycles on public projects can stretch for months, which ties up working capital for consumable makers and their distributors. In turn, smaller suppliers struggle to bid for large rail, pipeline and power orders. Larger brands use approvals, credit lines and project service teams to win and finance these contracts.
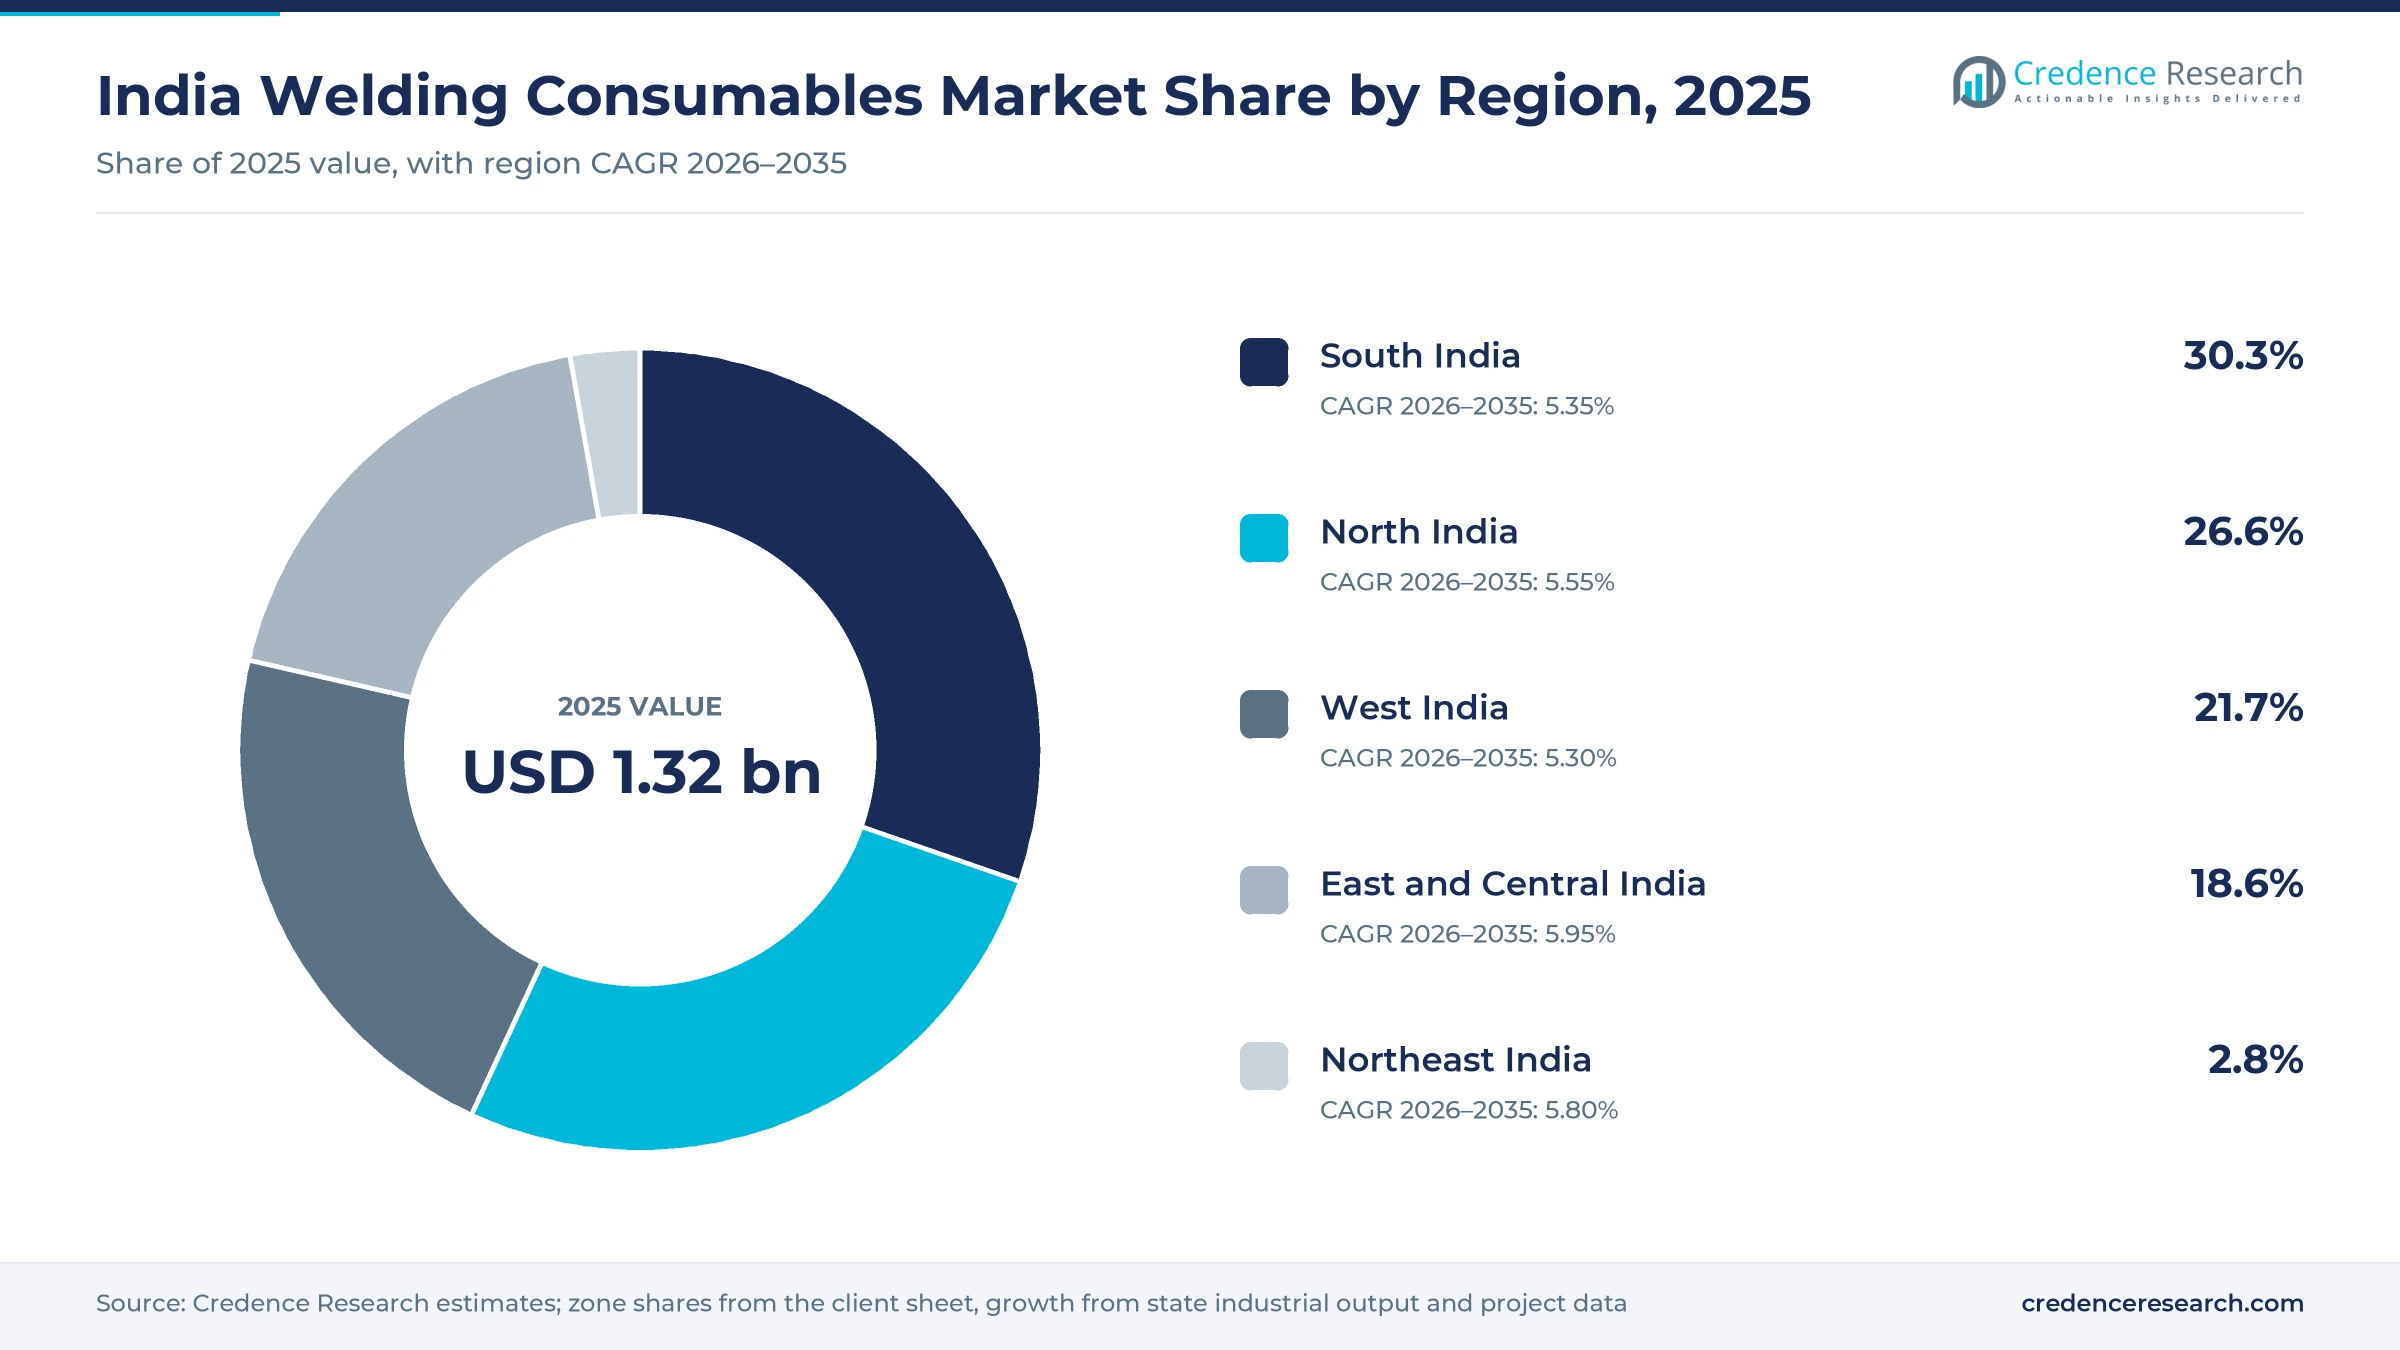
South India leads as East and Central India grows fastest
| Region | Value, 2025 (USD billion) | Share, 2025 | CAGR, 2026–2035 |
|---|---|---|---|
| South India | 0.40 | 30.3% | 5.35% |
| North India | 0.35 | 26.6% | 5.55% |
| West India | 0.29 | 21.7% | 5.30% |
| East and Central India | 0.25 | 18.6% | 5.95% |
| Northeast India | 0.04 | 2.8% | 5.80% |
How do Tamil Nadu and Karnataka factories put the south first?
South India held 30.3% of 2025 value and grows at 5.35% a year, because Tamil Nadu, Karnataka, Andhra Pradesh, Telangana and Kerala combine vehicle, engineering and shipyard clusters. Tamil Nadu reported 41,221 registered factories in 2024-25, the most of any state, and Karnataka produced 7.31% of manufacturing gross value added. ESAB India has its headquarters in Chennai, Lincoln Electric opened a solid wire plant there in 2009, and Ador Welding runs a plant in Bengaluru. As a result, the zone buys large volumes of solid wire for automated lines.
How does North India sustain demand from vehicle plants?
North India held 26.6% of 2025 value and grows at 5.55% a year, because Haryana, Uttar Pradesh, Rajasthan, Punjab and Delhi host vehicle, two-wheeler and component plants. Maruti Suzuki builds cars at Gurugram, Manesar and Kharkhoda in Haryana, and Uttar Pradesh produced 6.64% of manufacturing gross value added in 2024-25. voestalpine Bohler Welding operates at Bhiwadi and Delhi, Superon is based in Gurugram, and Modi Hitech makes electrodes and wires at Modipuram near Meerut. In turn, nearby plants serve automotive buyers with short delivery times.
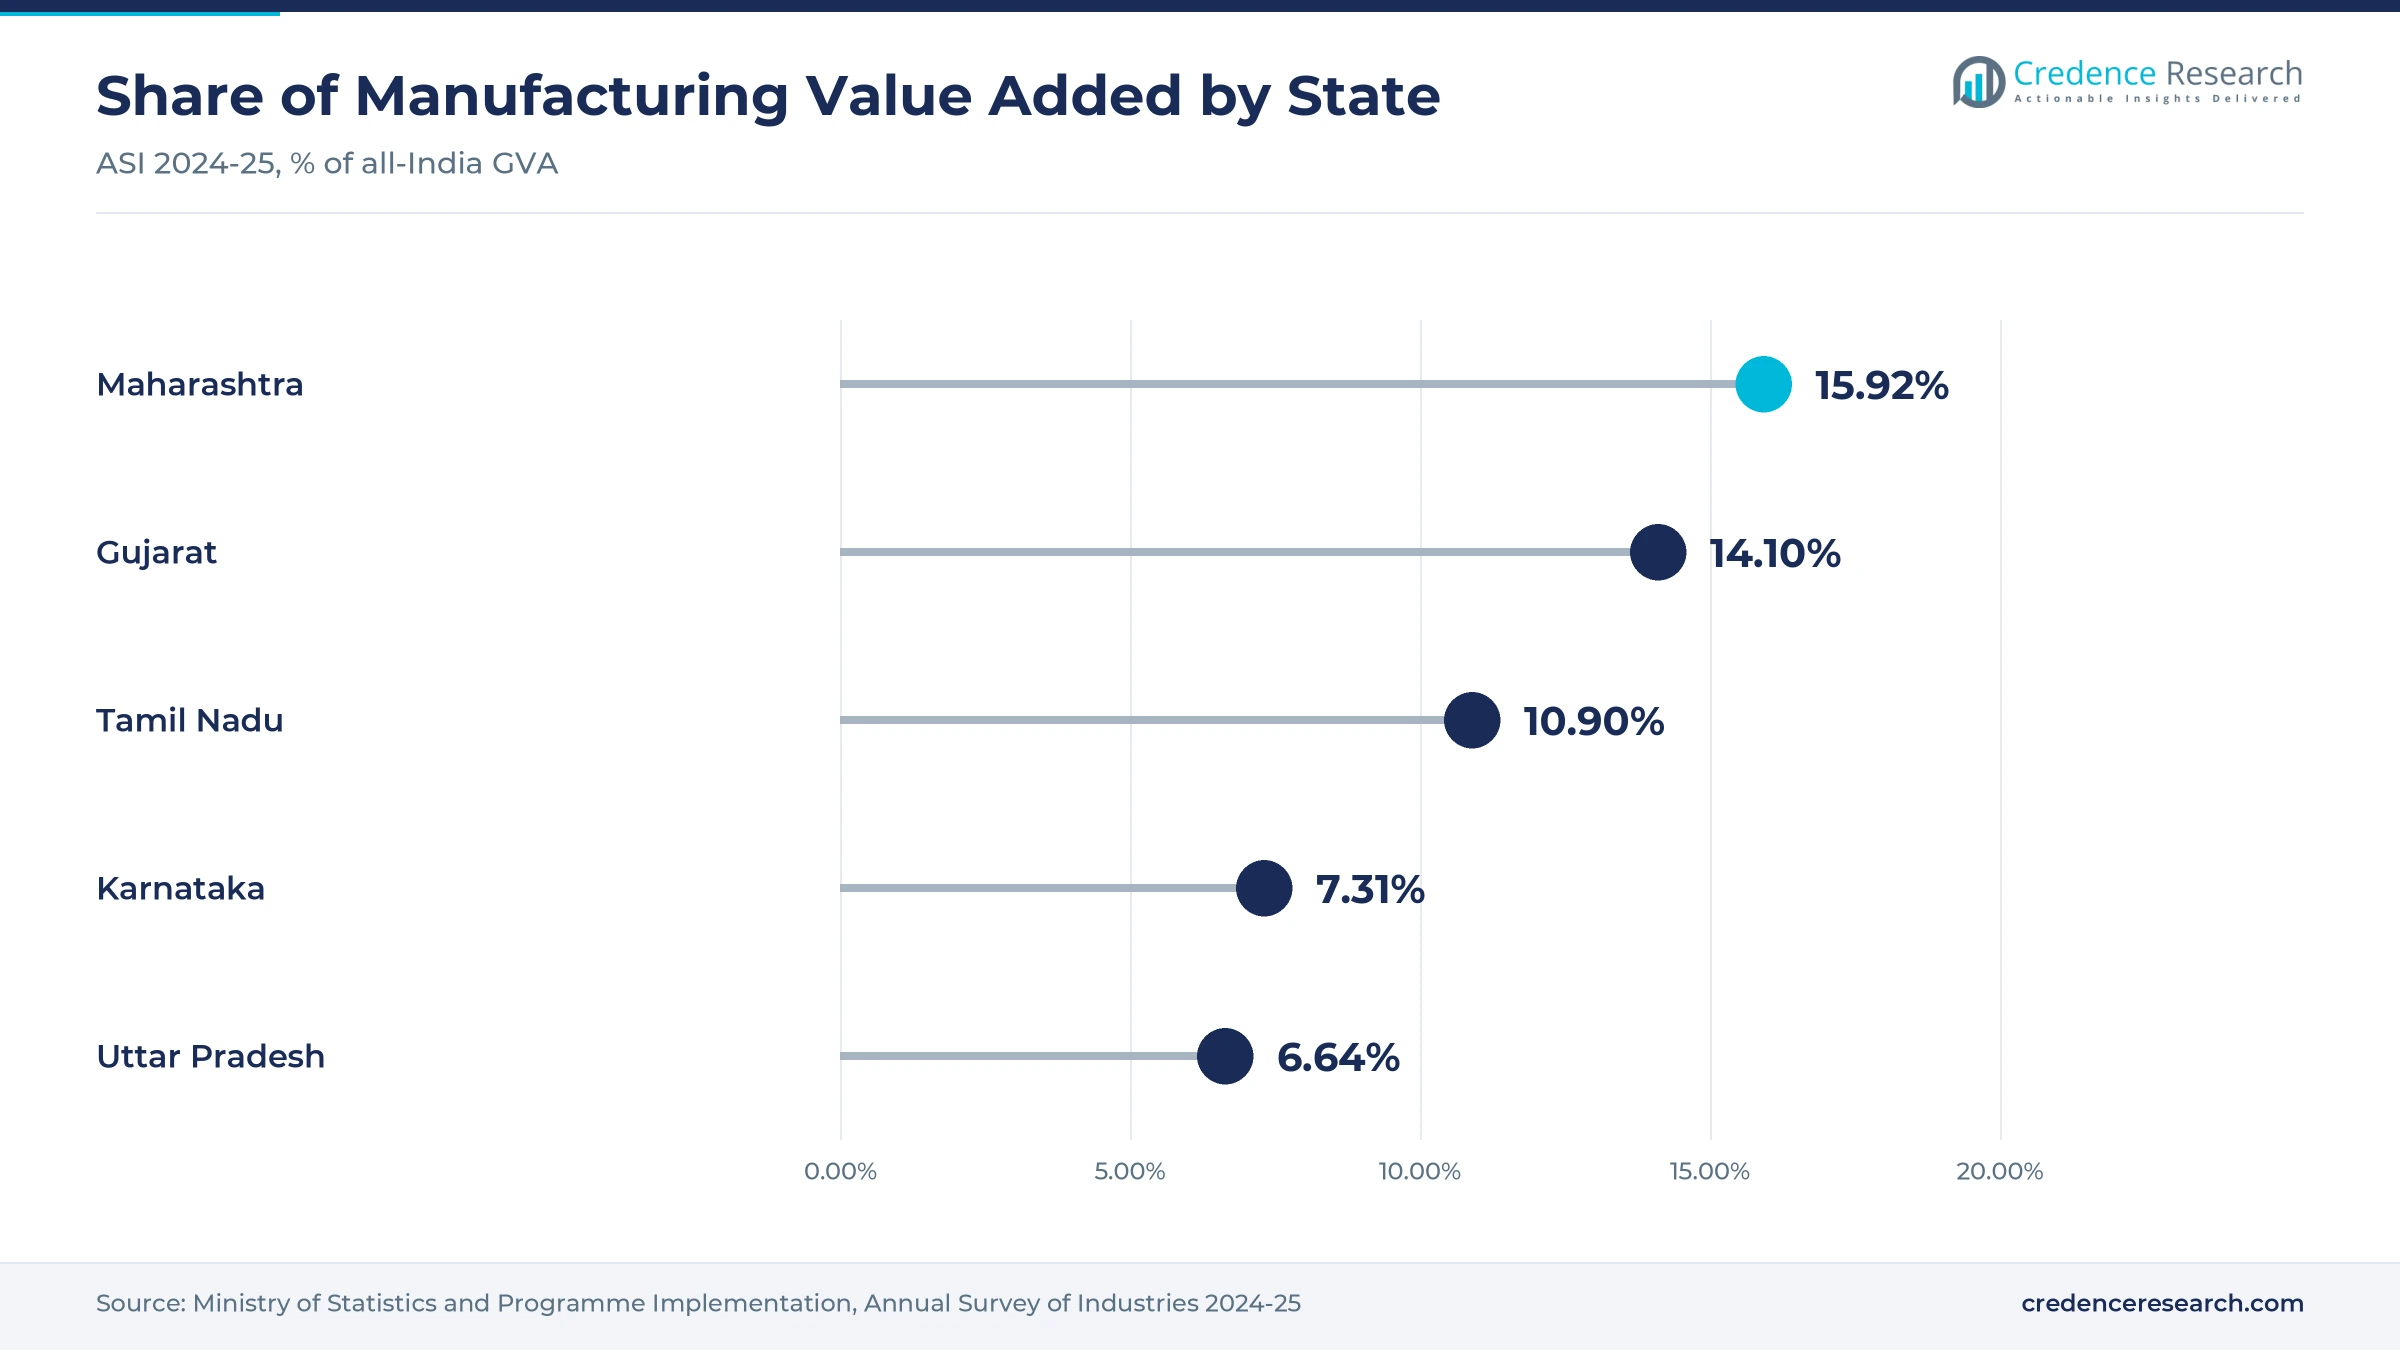
Why is West India a large industrial buyer?
West India held 21.7% of 2025 value and grows at 5.30% a year, because Maharashtra and Gujarat combine refineries, chemical plants, engineering works and vehicle factories. Maharashtra produced 15.92% of manufacturing gross value added in 2024-25, the highest of any state, and Gujarat produced 14.10%, according to the Annual Survey of Industries. Ador Welding runs plants at Chinchwad and Silvassa, and D&H Secheron is based in Mumbai. As a result, the zone draws steady demand for pipeline, pressure vessel and fabrication work.
Why is East and Central India growing fastest?
East and Central India held 18.6% of 2025 value and grows fastest at 5.95% a year, because freight corridors, rail projects and new consumable plants are expanding across Chhattisgarh, Odisha, West Bengal and Vidarbha. Ador Welding operates plants at Raipur and Nagpur, and Diffusion Engineers planned a new Nagpur facility after its 2024 listing. The 2026-27 Union Budget also proposed an East-West freight corridor from Dankuni to Surat. In turn, local supply is expanding where fabrication volumes rise fastest.
What limits demand in Northeast India?
Northeast India held 2.8% of 2025 value and grows at 5.80% a year, because its registered factory base is small compared with other zones. None of the northeastern states ranks among the ten states with the most registered factories in the 2024-25 Annual Survey of Industries. Demand comes mainly from road, bridge, rail and pipeline projects and from plant maintenance. As a result, most consumables reach the zone through distributors based in eastern India.
Listings, plant spending and policy marked 2024 to 2026
| Development | Status and market relevance |
|---|---|
| In October 2024, Diffusion Engineers listed its shares and planned a new manufacturing facility in Nagpur. | Adds consumable and wear part capacity in central India |
| In January 2025, voestalpine Bohler Welding reported about EUR 3 million of investment in its Indian sites. | Expands local consumable production at Bhiwadi, Thane and Delhi |
| In August 2025, Classic Electrodes opened an initial share sale of about INR 41.50 crore to buy plant and machinery. | Supports electrode and MIG wire output from West Bengal and Haryana |
| In September 2025, the Union Cabinet approved a INR 69,725 crore shipbuilding and maritime package. | Supports demand for approved marine grade consumables to 2036 |
| In November 2025, the government launched the third round of its specialty steel incentive scheme. | Adds alloy steel capacity that needs matching filler metals |
Five arc processes set the mix of electrodes and wires
- SMAW burns a flux-coated stick electrode, which keeps it common on construction sites, in small workshops and in repair work.
- GMAW and MIG-MAG feeds solid wire under shielding gas, which suits robotic and semiautomatic lines in vehicle and appliance plants.
- FCAW feeds tubular wire with flux inside, which gives high deposition for structural, shipyard and heavy fabrication work.
- SAW runs wire under a blanket of granular flux, which suits long seams on pipes, pressure vessels, wind towers and girders.
- GTAW and TIG uses a tungsten electrode with a separate filler rod, which gives clean welds on stainless steel and thin sections.
Need a Custom Version of This Report?
Tailor the scope, geography, or segments to your exact requirements.
- Custom geography or segment scope
- Direct access to our analyst team
Approvals and dealer reach separate the leading suppliers
Competition centers on product approvals, dealer reach, technical service and price, and it differs by process and buyer. ESAB India and Ador Welding offer the widest ranges of electrodes, wires and fluxes, and Ador runs plants at Silvassa, Raipur, Bengaluru, Chinchwad and Nagpur. D&H Secheron, founded in 1966, holds approvals from railway, nuclear and ship classification bodies. Lincoln Electric and voestalpine Bohler Welding serve demanding pipeline, power and heavy fabrication users with local wire and electrode supply. EWAC Alloys, an ESAB group company, focuses on repair and hardfacing, while Superon sells electrodes, wires and fluxes and exports to more than 95 countries. Modi Hitech, Diffusion Engineers and Classic Electrodes compete through regional plants and value lines. Stick electrodes held 42.0% of 2025 value, so dealer networks still decide much of the market.
Companies profiled and their roles in this market
| Company | Type | Role in the market |
|---|---|---|
| ESAB India Limited | Consumable and equipment maker | Chennai headquarters, filler metals, equipment and exports |
| Ador Welding Limited | Consumable and equipment maker | Plants at Silvassa, Raipur, Bengaluru, Chinchwad and Nagpur |
| D&H Sécheron Electrodes Private Limited | Consumable maker | Founded in 1966; railway, nuclear and marine approvals |
| EWAC Alloys Limited | Repair welding specialist | ESAB group company; maintenance, repair and hardfacing consumables |
| Lincoln Electric Company (India) Private Limited | Consumable and equipment maker | Opened a Chennai solid wire facility in 2009 |
| voestalpine Bohler Welding India Technology Private Limited | Consumable maker | Sites at Bhiwadi, Thane and Delhi; solid wire planned |
| Superon Schweisstechnik India | Consumable and equipment maker | Gurugram base; exports to more than 95 countries |
| Modi Hitech India Limited | Electrode and wire maker | Modipuram plant with 9,600 metric tons a year of capacity |
| Diffusion Engineers Limited | Consumable and wear part maker | Listed October 2024; new Nagpur facility planned |
| Classic Electrodes (India) Limited | Electrode and wire maker | West Bengal and Haryana units; electrodes and MIG wire |
Credence Research view on Indian filler metal demand
Credence Research's view is that Indian welding consumable demand will grow steadily, because record steel use, rail and infrastructure budgets and rising vehicle output keep fabrication volumes climbing. Stick electrodes keep the largest share through the forecast, while flux-cored and solid wires gain ground as fabricators automate. Mandatory BIS marking should move volume from unmarked local products toward certified brands. East and Central India should grow fastest as steel and freight projects expand there. Suppliers that combine approvals, wire capacity and dealer reach in several zones should gain the most share.
Steel, output and company data anchor the estimate
The report uses 2025 as the base year on a calendar basis, and market values come from the Credence Research model. That model combines steel consumption, national accounts and industrial survey data, vehicle production, rail and shipbuilding budgets, company plant capacities and stock exchange filings. Segment splits and zone growth rates are Credence Research estimates, while zone shares are Credence Research estimates built from state factory and output data. Sources used are official statistics, government releases, parliamentary research, stock exchange filings, trade press and company releases, and no interviews or surveys were used.
Infrastructure and factory output carry growth to 2035
Sales of welding consumables in India are expected to reach USD 2.27 billion by 2035, a 5.52% CAGR during 2026–2035, as steel use, infrastructure and factory output keep fabrication volumes rising. Growth should stay firm through 2030 as rail capital budgets, freight corridors and specialty steel capacity come on stream. After that, shipbuilding, power and automated vehicle lines will set the pace for wire demand. Faster project execution would favor submerged arc and flux-cored products, while slower public spending would weigh on construction demand. Flux-cored wires are expected to gain the most product share through 2035.
Frequently Asked Questions
How big is the India welding consumables market?
Which product type leads demand in India?
Which region leads the Indian market?
Which end-use industry buys the most consumables?
How does steel consumption affect demand?
Do welding electrodes need BIS certification in India?
Who are the leading suppliers in India?
What are the main challenges for consumable makers?
Table of Content
Chapter 1 Market Segmentation
- 1.1 Segmentation Framework
- 1.1.1 Product and Service Classification
- 1.1.2 Application and End-Use Classification
- 1.1.3 Technology and Solution Classification
- 1.1.4 Customer and Distribution Channel Classification
- 1.1.5 Geographic Segmentation
- 1.1.6 Market Segment Definitions and Boundaries
- 1.2 By Product Type
- 1.2.1 Stick Electrodes
- 1.2.2 Solid Wires
- 1.2.3 Flux-Cored Wires
- 1.2.4 Submerged Arc Wires and Fluxes
- 1.2.5 Specialty Filler Metals
- 1.3 By End-Use Industry
- 1.3.1 Construction and Infrastructure
- 1.3.2 Heavy Engineering and Capital Goods
- 1.3.3 Automotive and Transportation
- 1.3.4 Oil, Gas and Process Industries
- 1.3.5 Shipbuilding, Rail and Power
- 1.4 By Application
- 1.4.1 Fabrication Welding
- 1.4.2 Structural Steel Joining
- 1.4.3 Pipeline and Pressure Vessel
- 1.4.4 Maintenance and Repair
- 1.4.5 Hardfacing and Cladding
- 1.5 By Customer Type
- 1.5.1 Large Fabricators and OEMs
- 1.5.2 MSME Workshops
- 1.5.3 EPC Contractors
- 1.5.4 Mid-Size Engineering Firms
- 1.5.5 Maintenance Service Providers
Chapter 2 Introduction
- 2.1 Report Objectives and Scope
- 2.2 Product Definition and Industry Terminology
- 2.3 Market Inclusions and Exclusions
- 2.4 Research Process
- 2.4.1 Primary Research and Expert Interviews
- 2.4.2 Secondary Research and Source Review
- 2.4.3 Top-Down and Bottom-Up Estimation
- 2.4.4 Data Triangulation and Verification
- 2.5 Market Size Measurement Basis
- 2.5.1 2025: USD 1.32 billion → 2035: USD 2.27 billion
- 2.6 Historical and Forecast Reference Periods
- 2.6.1 Historical Period: 2018-2025
- 2.6.2 Base Year: 2025
- 2.6.3 Forecast Period: 2025-2035
- 2.7 Research Assumptions and Limitations
Chapter 3 Executive Summary
- 3.1 Market Snapshot and Key Findings
- 3.2 Base-Year Market Size, 2025
- 3.3 Forecast Market Size, 2035
- 3.4 Revenue and Volume Growth Outlook
- 3.5 Key Demand and Supply Indicators
- 3.6 Leading Market Segments
- 3.7 Fastest-Growing Market Opportunities
- 3.8 Regional Performance Highlights
- 3.9 Technology and Industry Transformation
- 3.10 Competitive Landscape Summary
- 3.11 Analyst View and Strategic Implications
Chapter 4 India Welding Consumables Market Trends and Developments
- 4.1 Historical Industry Development, 2018-2025
- 4.2 Recent Market Trends and Developments
- 4.3 Demand and Customer Behavior Trends
- 4.4 Technology and Product Innovation
- 4.5 Artificial Intelligence, Automation and Digitalization
- 4.6 Local Manufacturing and Supply Chain Realignment
- 4.7 Industry Partnerships, Mergers and Acquisitions
- 4.8 Sustainability and Circular Economy Developments
- 4.9 Government and Private Sector Investment Trends
- 4.10 Emerging Business Models and Commercialization
- 4.11 Industry Developments and Announcements
Chapter 5 India Welding Consumables Market Production, Supply and Demand Analysis
- 5.1 Demand Trend and Consumption Analysis, 2018-2025
- 5.2 Demand Forecast, 2025-2035
- 5.3 Production and Output Trend, 2018-2025
- 5.4 Production and Output Forecast, 2025-2035
- 5.5 Installed Capacity and Capacity Utilization
- 5.6 Company-Wise Production Plants and Statistics
- 5.6.1 Installed Production Capacity
- 5.6.2 Actual Production
- 5.6.3 Planned Capacity and Expansion Targets
- 5.7 Supply Chain Structure and Procurement Trends
- 5.8 Supply-Demand Gap and Bottlenecks
- 5.9 Import Dependence and Sourcing Structure
- 5.10 Contract Manufacturing and Outsourcing
- 5.11 Regional Supply and Demand Concentration
Chapter 6 India Welding Consumables Market Pricing Analysis
- 6.1 Pricing Structure and Measurement
- 6.2 Historical Pricing Trends, 2018-2025
- 6.3 Pricing Outlook, 2025-2035
- 6.4 Average Selling Price and Unit Economics
- 6.5 Pricing by Product and Market Segment
- 6.6 Geographic Pricing Differences
- 6.7 Key Input, Energy, Labor and Logistics Costs
- 6.8 Contract Pricing and Purchasing Models
- 6.9 Pricing Sensitivity and Competitive Positioning
- 6.10 Price, Margin and Profitability Implications
Chapter 7 India Welding Consumables Market Dynamics
- 7.1 Market Growth Drivers
- 7.1.1 Demand-Side Drivers
- 7.1.2 Technology and Innovation Drivers
- 7.1.3 Infrastructure and Investment Drivers
- 7.1.4 Regulatory and Policy Drivers
- 7.2 Market Restraints
- 7.2.1 Cost and Affordability Constraints
- 7.2.2 Technology and Adoption Barriers
- 7.2.3 Supply Chain and Operational Constraints
- 7.3 Market Challenges
- 7.3.1 Competitive Pressure and Margin Erosion
- 7.3.2 Skills, Infrastructure and Implementation Gaps
- 7.4 Emerging Market Opportunities
- 7.5 Market Dynamics Impact and Time-Horizon Assessment
Chapter 8 India Welding Consumables Value Chain Analysis
- 8.1 Industry Value Chain Overview
- 8.2 Upstream Suppliers and Critical Inputs
- 8.3 Technology and Component Providers
- 8.4 Manufacturing or Service Delivery
- 8.5 Distribution, Channel Partners and Integrators
- 8.6 Downstream Applications and End Users
- 8.7 Value Addition and Profit Pools
- 8.8 Vertical Integration and Outsourcing
- 8.9 Supplier Concentration and Risk
- 8.10 Supply Chain Localization and Resilience
Chapter 9 India Welding Consumables Market Regulations and Policies
- 9.1 Relevant Laws, Standards and Compliance Frameworks
- 9.2 Product, Service, Safety and Quality Requirements
- 9.3 Government Policies, Incentives and Subsidies
- 9.4 Imports, Exports and Trade Barriers
- 9.5 Public Procurement and Local Content Requirements
- 9.6 Environmental and Sustainability Compliance
- 9.7 Upcoming Policy Changes and Market Implications
Chapter 10 India Welding Consumables Market Hotspots and Opportunities
- 10.1 Market Opportunity Mapping and Growth Hotspots
- 10.2 High-Growth Applications and Customer Groups
- 10.3 Underserved Markets and White-Space Opportunities
- 10.4 Emerging Technology and Product Opportunities
- 10.5 New Capacity and Investment Hotspots
- 10.6 Market Entry and Expansion Opportunities
- 10.7 Distribution and Partnership Opportunities
- 10.8 Near-Term and Long-Term Commercial Potential
- 10.9 Opportunity Attractiveness and Execution Risks
Chapter 11 India Welding Consumables Market Outlook, 2025-2035
- 11.1 Market Size and Analysis
- 11.1.1 Revenue (Market Measurement: 2025: USD 1.32 billion → 2035: USD 2.27 billion)
- 11.1.2 Market Volume and Quantity Sold
- 11.1.3 Historical Market Size, 2018-2025
- 11.1.4 Base-Year Market Size, 2025
- 11.2 Market Forecast, 2025-2035
- 11.2.1 Revenue Forecast to 2035
- 11.2.2 Volume Forecast to 2035
- 11.2.3 CAGR and Year-on-Year Growth
- 11.2.4 Incremental Revenue Opportunity
- 11.3 Forecast Assumptions and Scenario Analysis
- 11.3.1 Base-Case Forecast
- 11.3.2 Optimistic and Conservative Scenarios
- 11.3.3 Technology, Pricing and Policy Sensitivities
- 11.4 Market Attractiveness and Growth Outlook
Chapter 12 India Welding Consumables Market Segmentation and Outlook
- 12.1 Segmentation Summary and Market Shares, 2025
- 12.2 Largest and Fastest-Growing Segments
- 12.3 By Product Type - Market Size and Forecast, 2025-2035
- 12.3.1 Segment Definition and Scope
- 12.3.2 Historical Market Size, 2018-2025
- 12.3.3 Revenue Forecast, 2025-2035
- 12.3.4 Volume Forecast, 2025-2035
- 12.3.5 Base-Year Market Share, 2025
- 12.3.6 Segment CAGR and Growth Drivers
- 12.3.7 Subsegment Market Size and Forecast
- 12.3.7.1 Stick Electrodes
- 12.3.7.2 Solid Wires
- 12.3.7.3 Flux-Cored Wires
- 12.3.7.4 Submerged Arc Wires and Fluxes
- 12.3.7.5 Specialty Filler Metals
- 12.3.8 Subsegment Pricing and Adoption Trends
- 12.3.9 Leading Suppliers and Competition
- 12.3.10 Regional Demand and Opportunities
- 12.4 By End-Use Industry - Market Size and Forecast, 2025-2035
- 12.4.1 Segment Definition and Scope
- 12.4.2 Historical Market Size, 2018-2025
- 12.4.3 Revenue Forecast, 2025-2035
- 12.4.4 Volume Forecast, 2025-2035
- 12.4.5 Base-Year Market Share, 2025
- 12.4.6 Segment CAGR and Growth Drivers
- 12.4.7 Subsegment Market Size and Forecast
- 12.4.7.1 Construction and Infrastructure
- 12.4.7.2 Heavy Engineering and Capital Goods
- 12.4.7.3 Automotive and Transportation
- 12.4.7.4 Oil, Gas and Process Industries
- 12.4.7.5 Shipbuilding, Rail and Power
- 12.4.8 Subsegment Pricing and Adoption Trends
- 12.4.9 Leading Suppliers and Competition
- 12.4.10 Regional Demand and Opportunities
- 12.5 By Application - Market Size and Forecast, 2025-2035
- 12.5.1 Segment Definition and Scope
- 12.5.2 Historical Market Size, 2018-2025
- 12.5.3 Revenue Forecast, 2025-2035
- 12.5.4 Volume Forecast, 2025-2035
- 12.5.5 Base-Year Market Share, 2025
- 12.5.6 Segment CAGR and Growth Drivers
- 12.5.7 Subsegment Market Size and Forecast
- 12.5.7.1 Fabrication Welding
- 12.5.7.2 Structural Steel Joining
- 12.5.7.3 Pipeline and Pressure Vessel
- 12.5.7.4 Maintenance and Repair
- 12.5.7.5 Hardfacing and Cladding
- 12.5.8 Subsegment Pricing and Adoption Trends
- 12.5.9 Leading Suppliers and Competition
- 12.5.10 Regional Demand and Opportunities
- 12.6 By Customer Type - Market Size and Forecast, 2025-2035
- 12.6.1 Segment Definition and Scope
- 12.6.2 Historical Market Size, 2018-2025
- 12.6.3 Revenue Forecast, 2025-2035
- 12.6.4 Volume Forecast, 2025-2035
- 12.6.5 Base-Year Market Share, 2025
- 12.6.6 Segment CAGR and Growth Drivers
- 12.6.7 Subsegment Market Size and Forecast
- 12.6.7.1 Large Fabricators and OEMs
- 12.6.7.2 MSME Workshops
- 12.6.7.3 EPC Contractors
- 12.6.7.4 Mid-Size Engineering Firms
- 12.6.7.5 Maintenance Service Providers
- 12.6.8 Subsegment Pricing and Adoption Trends
- 12.6.9 Leading Suppliers and Competition
- 12.6.10 Regional Demand and Opportunities
- 12.7 Segment Growth Comparison
- 12.8 Segment Attractiveness and Priority Matrix
Chapter 13 India Welding Consumables End-Use and Application Market Outlook
- 13.1 End-Use Industry and Customer Demand Structure
- 13.2 Leading Applications and Customer Groups
- 13.3 End-Use Market Size, Share and Forecast
- 13.4 Major End-Use Industry Deep Dives
- 13.4.1 Customer Requirements and Use Cases
- 13.4.2 Demand and Replacement Cycles
- 13.4.3 Technical and Regulatory Considerations
- 13.4.4 Purchasing and Procurement Models
- 13.4.5 Leading Vendors and Distribution Channels
- 13.4.6 Forecast and Commercial Opportunities
- 13.5 Emerging Applications and Cross-Segment Demand
- 13.6 End-Use Industry Investment Priorities
Chapter 14 India Welding Consumables Geographic Market Outlook, 2025-2035
- 14.1 Domestic Market Distribution and Demand Clusters
- 14.2 State- or Province-Wise Market Size and Forecast, 2025-2035
- 14.3 City and Metropolitan Market Outlook
- 14.4 Industrial, Manufacturing and Commercial Clusters
- 14.5 Geographic Concentration of Key End Users
- 14.6 Local Pricing and Purchasing Differences
- 14.7 Domestic Production Facilities and Capacity Map
- 14.8 Local Infrastructure and Project Pipeline
- 14.9 State-Level Policy and Incentive Differences
- 14.10 Subnational Investment Hotspots and Opportunities
- 14.11 Distribution and Logistics Networks
- 14.12 Domestic Competitive Footprint
Chapter 15 India Welding Consumables Technology, Innovation and Sustainability Outlook
- 15.1 Technology Landscape and Maturity
- 15.2 Product, Process and Service Innovation
- 15.3 AI, Automation and Digital Tools in the Industry
- 15.4 Technology Adoption and Performance Benchmarking
- 15.5 Innovation Pipeline and R&D Investment
- 15.6 Patent and Intellectual Property Trends
- 15.7 Energy Efficiency and Resource Management
- 15.8 Sustainability, Recycling and Circularity
- 15.9 Technology Roadmap, 2025-2035
- 15.10 Risks of Obsolescence and Technology Substitution
Chapter 16 India Welding Consumables Market Key Strategic Imperatives
- 16.1 Growth and Market Entry Priorities
- 16.2 High-Return Products and Segments
- 16.3 Pricing, Profitability and Cost Optimization
- 16.4 Technology Investment and Product Differentiation
- 16.5 Supply Chain Localization and Resilience
- 16.6 Distribution and Customer Acquisition
- 16.7 Partnership, Acquisition and Capacity Strategy
- 16.8 Regional Expansion Priorities
- 16.9 Short-, Medium- and Long-Term Actions
Chapter 17 Competition Outlook
- 17.1 Industry Competition Characteristics
- 17.2 Market Structure and Concentration
- 17.3 Market Share and Competitive Positioning, 2025
- 17.4 Company-Wise Revenue and Product Benchmarking
- 17.5 Production and Service Capacity Benchmarking
- 17.6 Technology, Pricing and Differentiation
- 17.7 Regional Footprint and Distribution Strength
- 17.8 Mergers, Acquisitions and Strategic Alliances
- 17.9 New Entrants and Competitive Threats
- 17.10 Porter's Five Forces and Industry Attractiveness
- 17.11 Competitive Outlook, 2025-2035
Chapter 18 Company Profiles
- 18.1 Company Coverage and Selection Criteria
- 18.2 ESAB India Limited
- 18.2.1 Business Description
- 18.2.2 Company Ownership and Geographic Presence
- 18.2.3 Product and Service Portfolio
- 18.2.4 Manufacturing and Operating Footprint
- 18.2.5 Production Capacity and Expansion Plans
- 18.2.6 Financial Performance and Investment
- 18.2.7 Market Share and Competitive Position
- 18.2.8 Technology and Innovation Capabilities
- 18.2.9 Strategic Alliances or Partnerships
- 18.2.10 Recent Developments
- 18.2.11 Growth Strategy and Outlook
- 18.3 Ador Welding Limited
- 18.4 D&H Sécheron Electrodes Private Limited
- 18.5 EWAC Alloys Limited
- 18.6 Lincoln Electric Company (India) Private Limited
- 18.7 voestalpine Bohler Welding India Technology Private Limited
- 18.8 Superon Schweisstechnik India
- 18.9 Modi Hitech India Limited
- 18.10 Diffusion Engineers Limited
- 18.11 Classic Electrodes (India) Limited
- 18.12 Other Relevant Market Participants
Note: Every listed company is profiled on the structure shown under the first company. The company list is preliminary and may change based on research findings, market developments, data availability and client requirements.
Chapter 19 Disclaimer
- 19.1 Research and Forecast Disclaimer
- 19.2 Data Source and Estimation Limitations
Note: The depth of individual sections depends on data availability for this market. Volume, capacity, trade and other unit-based metrics are included where applicable.

