
Recovery targets push Australia toward source separation
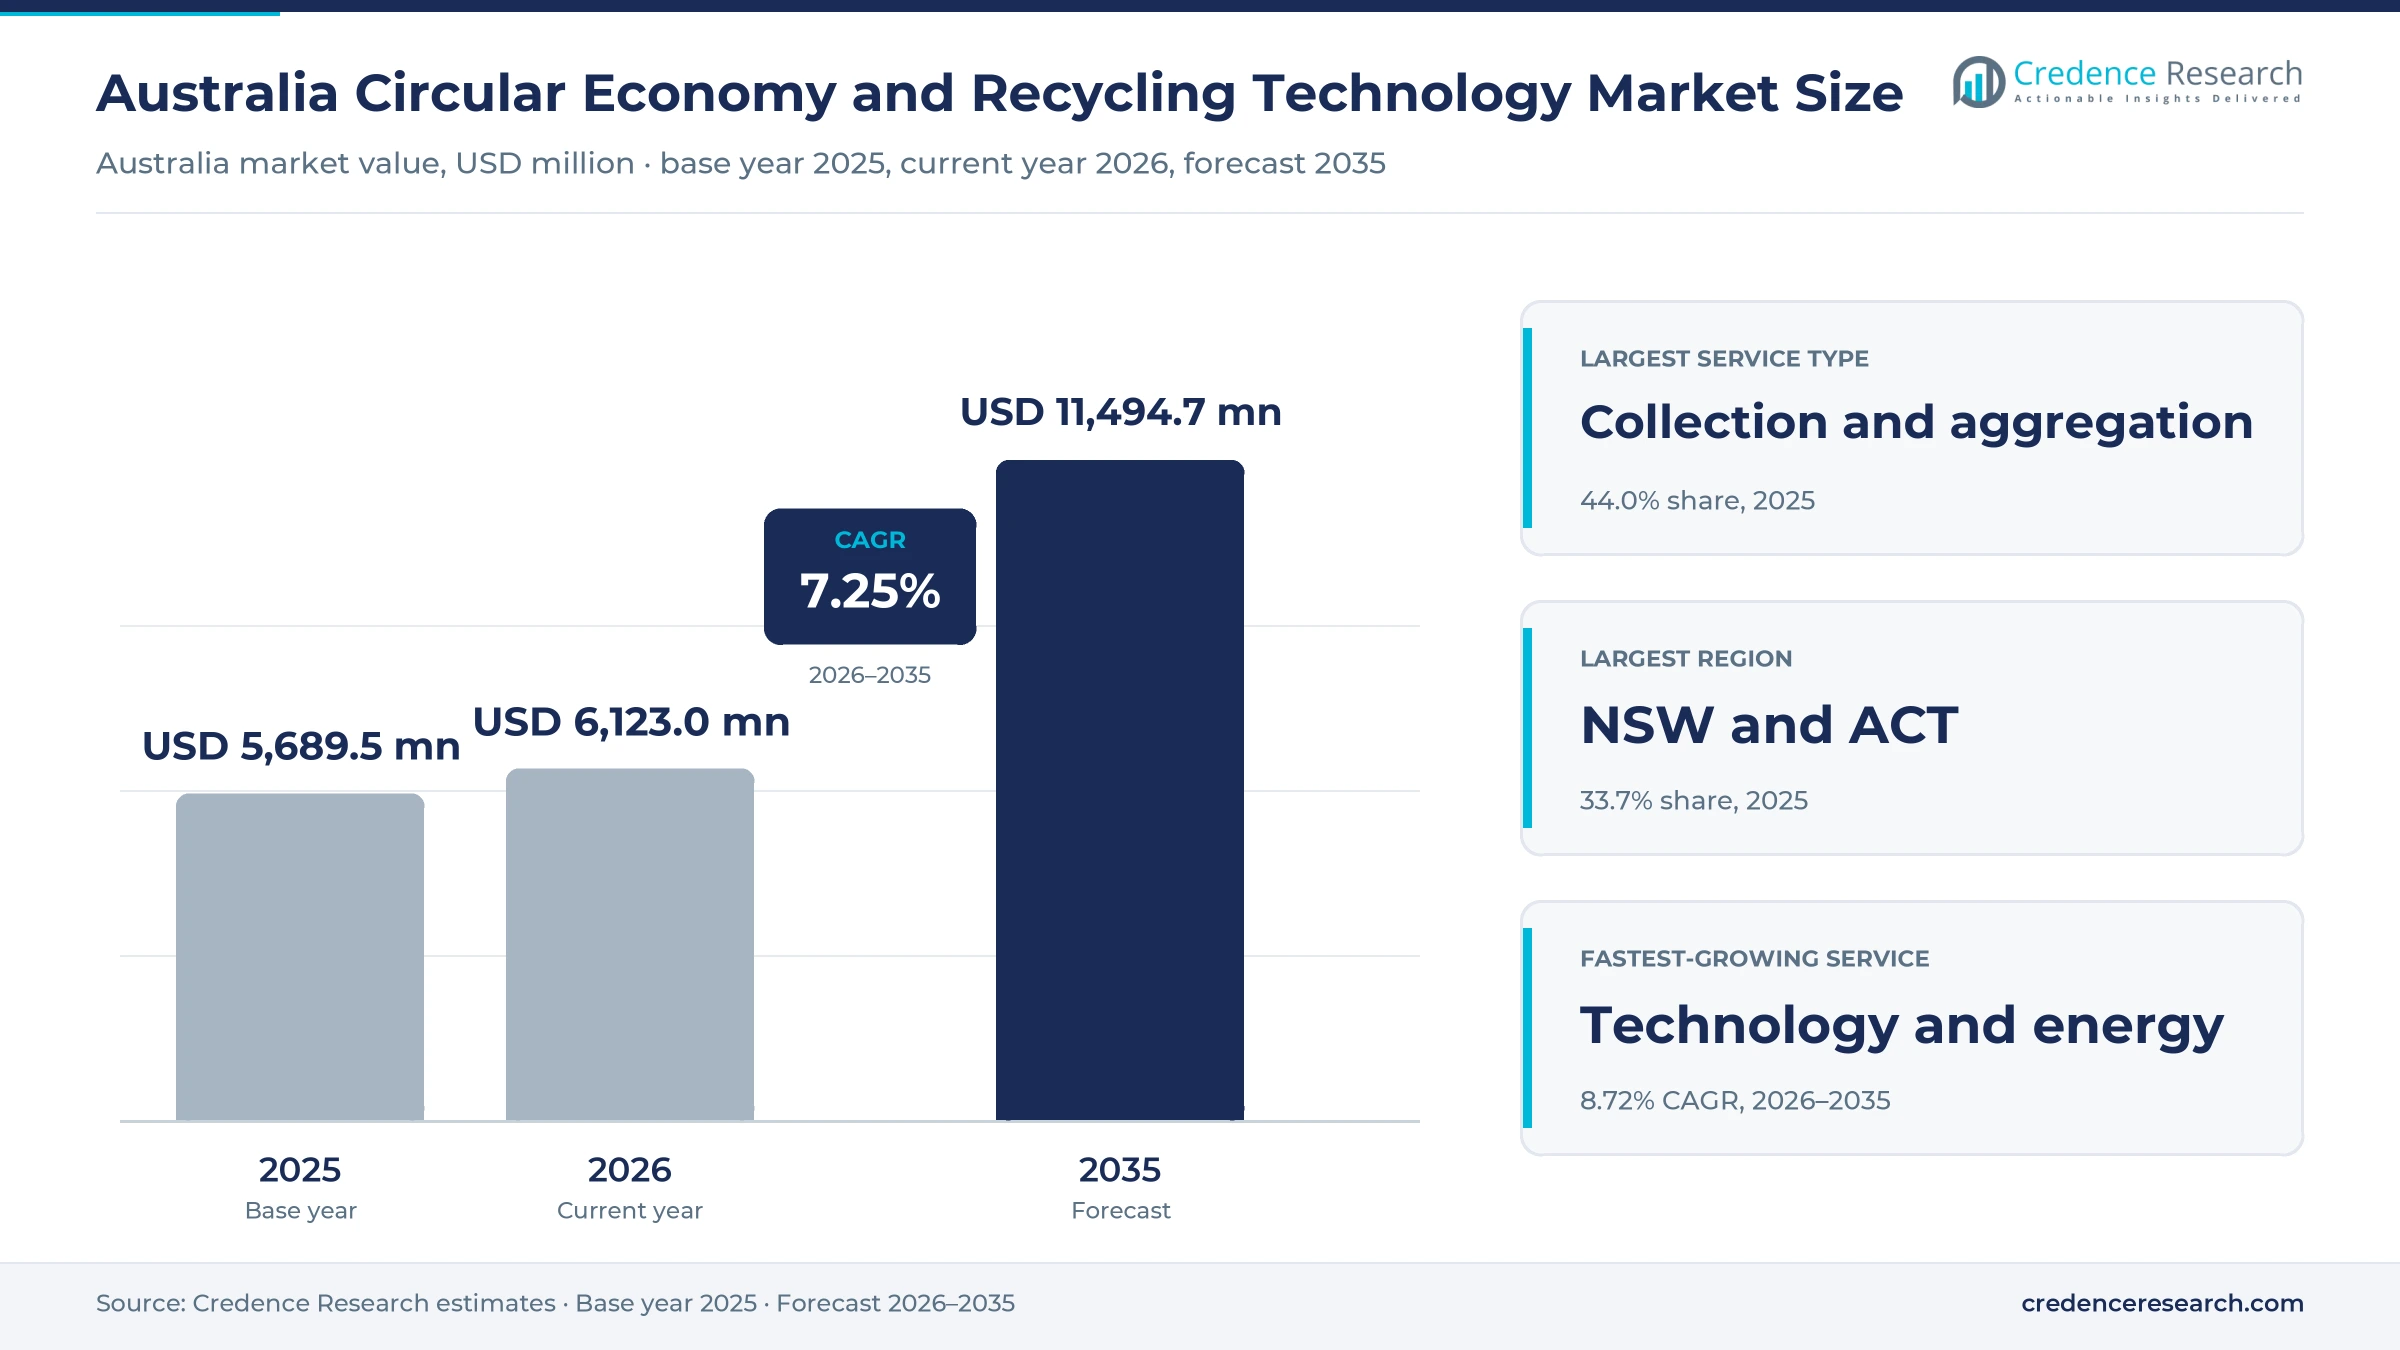
The Australia circular economy and recycling technology market was valued at USD 5.69 billion in 2025 and is projected to increase from USD 6.12 billion in 2026 to USD 11.49 billion by 2035, registering a CAGR of 7.25% during 2026–2035. Demand comes from councils, businesses and builders that must divert more material from landfill as state levies rise and national recovery targets near their 2030 deadline. New South Wales and the Australian Capital Territory held the largest regional share, 33.7% in 2025, because the zone generates the most waste and leads the rollout of food organics collection. Queensland is the fastest-growing region at 7.72% a year, as a rising disposal levy pushes councils and businesses toward recycling contracts. The opening of large energy recovery capacity in Western Australia and staged business organics mandates in New South Wales have also widened the range of services that buyers procure.
Which recovery services and systems does the estimate count?
The estimate measures spending on recycling collection and aggregation, materials sorting and reprocessing, specialist and biological recovery such as composting and anaerobic digestion, and recovery technology and energy services. It counts contract fees, tonnage-based gate fees, performance payments and equipment sales paid by councils, businesses, builders and stewardship schemes.
The estimate excludes landfill disposal fees, state waste levies passed to government and the resale value of recovered commodities. The value chain runs from kerbside and commercial collection through transfer stations and materials recovery facilities to reprocessors, organics processors and energy recovery plants, which return materials or energy to the economy.
Australia Circular Economy and Recycling Technology Market Insights
- The Australia circular economy and recycling technology market was valued at USD 5.69 billion in 2025 and is projected to reach USD 11.49 billion by 2035, registering a CAGR of 7.25% during 2026–2035.
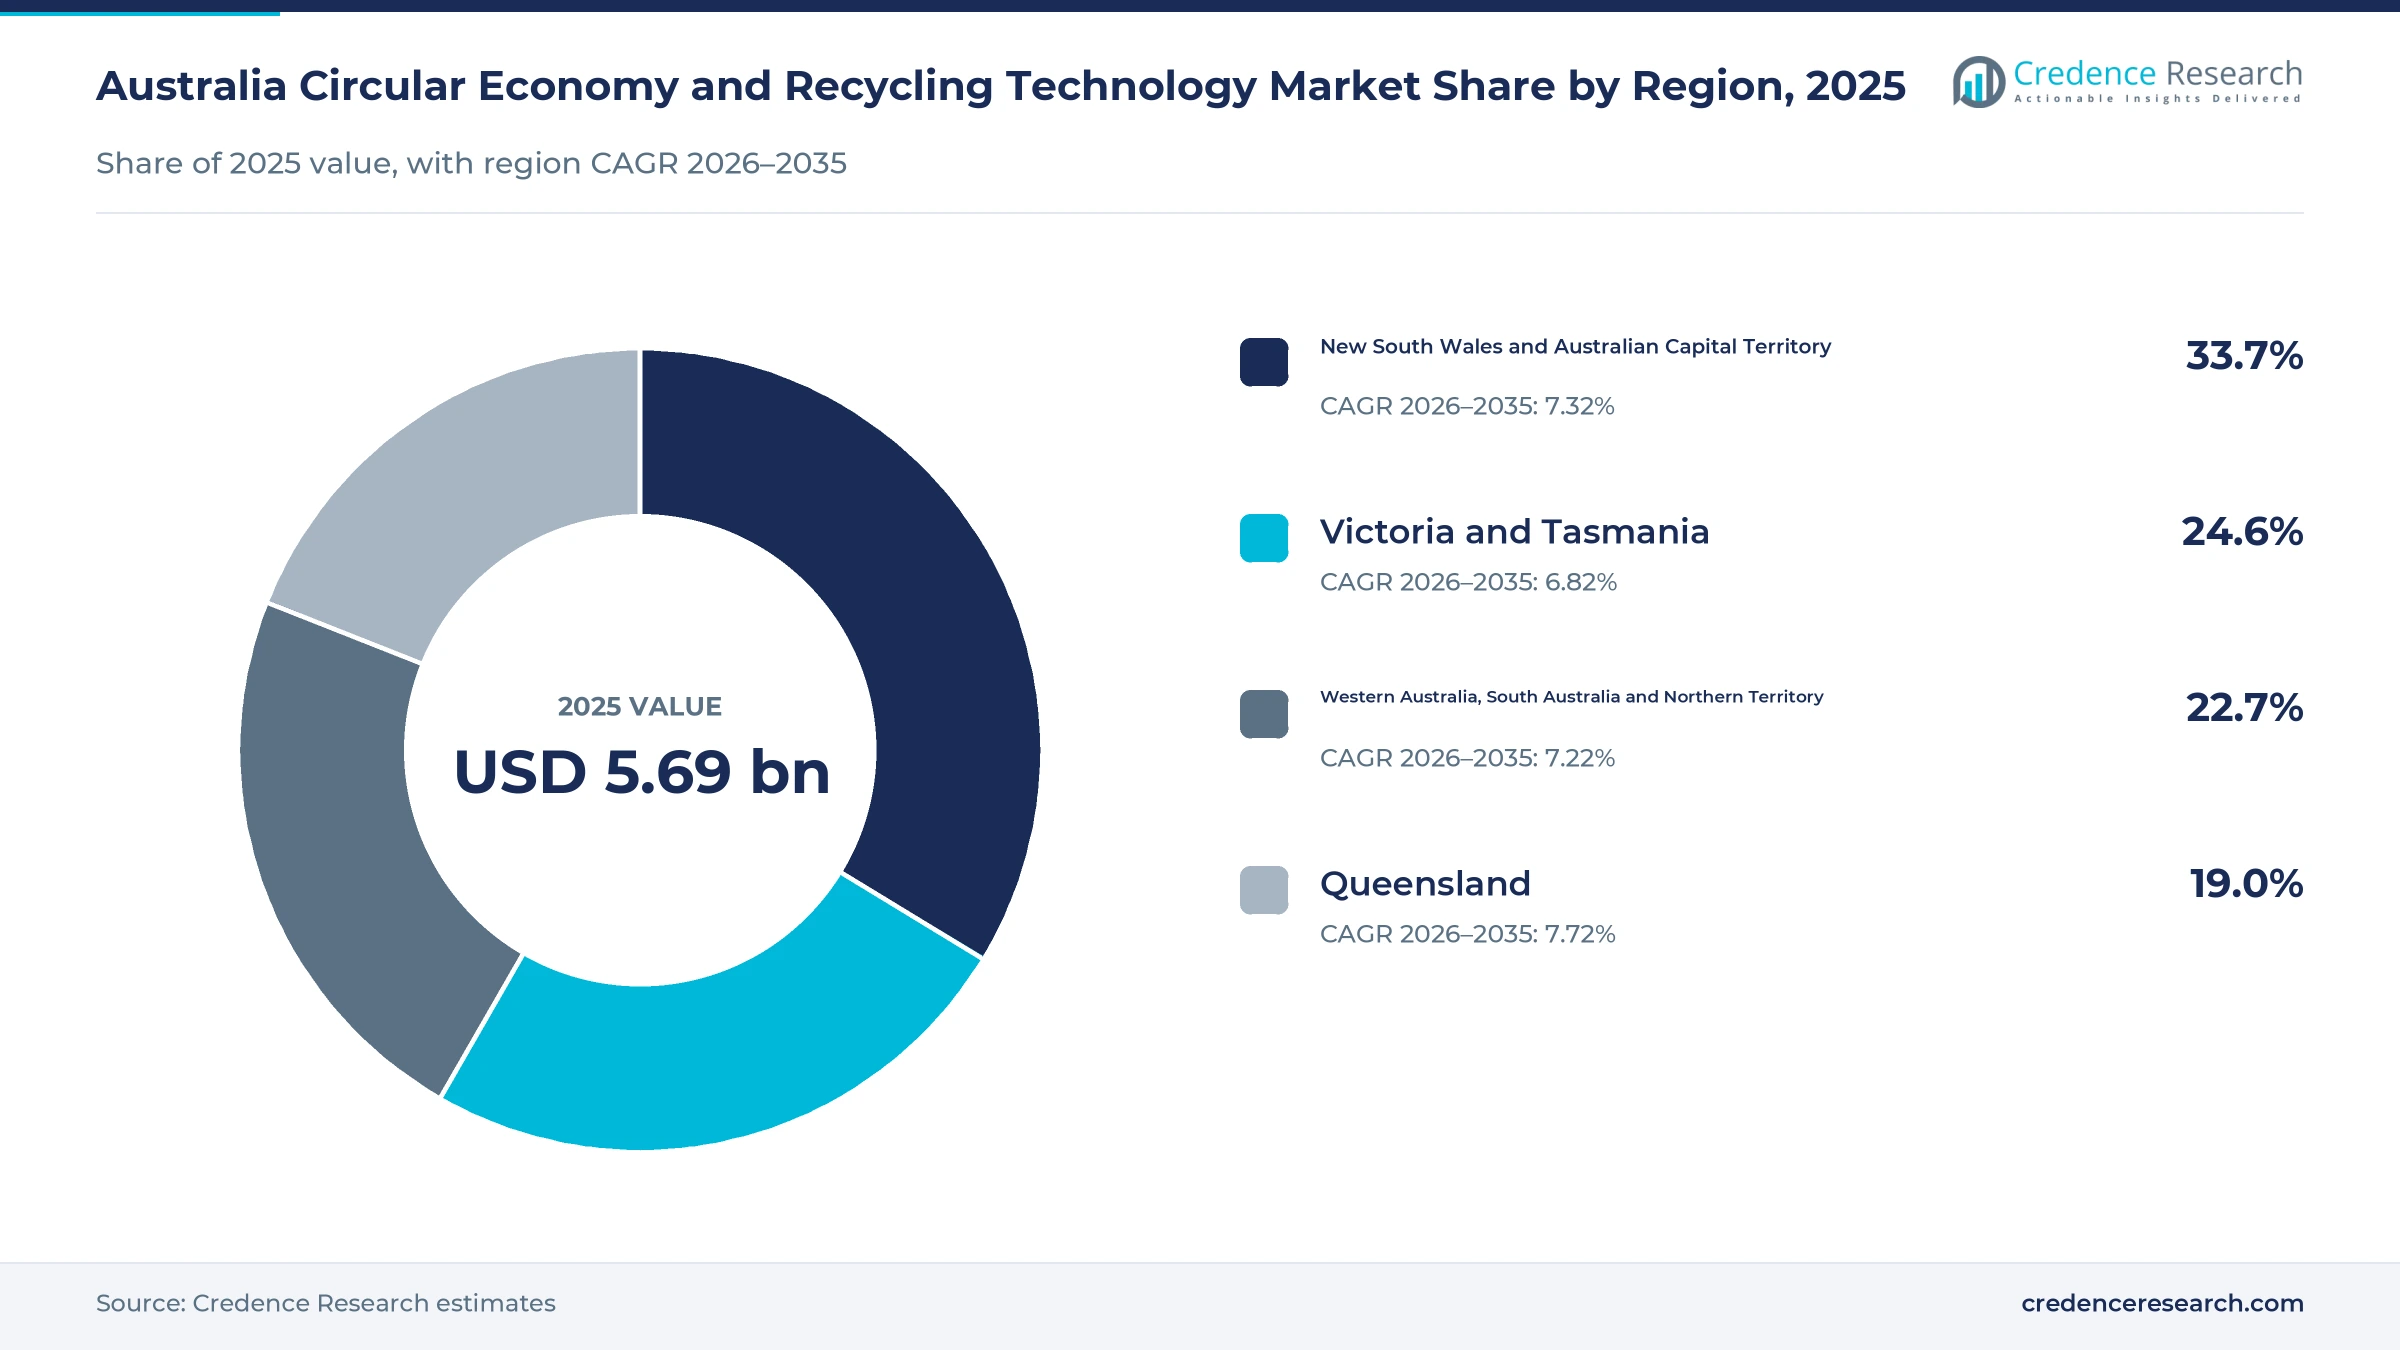
- New South Wales and the Australian Capital Territory held a 33.7% share of 2025 value, because the zone generates the most waste and leads organics collection rollout.
- Recycling collection and aggregation led with a 44.0% share of 2025 value, because council kerbside contracts and commercial bin services remain the largest recurring spend.
- Australia generated 75.6 million metric tons of waste in 2022-23 and recovered 66% of it, still short of the national target of 80% recovery by 2030.
- Recovery technology and energy services grow fastest at 8.72% a year during 2026–2035, as energy recovery plants, advanced sorting lines and digestion capacity come online.
Collection contracts hold most value as organics grow
Why do collection contracts hold the largest share?
Based on service type, the market is categorized into recycling collection and aggregation, materials sorting and reprocessing, specialist and biological recovery, and recovery technology and energy services. Recycling Collection and Aggregation led with a 44.0% share of 2025 value, because every council and business pays for regular bin lifts before any material is sorted. Recovery Technology and Energy Services grow fastest at 8.72% a year, as energy recovery and advanced sorting plants add capacity.
How do councils shape recovery service demand?
Based on customer type, the market is categorized into municipal authorities, business waste generators, construction contractors and stewardship schemes and recovery operators. Municipal Authorities led with a 38.0% share of 2025 value, because councils tender long kerbside contracts for millions of households. Stewardship Schemes and Recovery Operators grow fastest at 8.58% a year, as container deposit and product stewardship schemes buy more collection and processing.
Which end-use sectors generate the most paid volume?
Based on end-use industry, the market is categorized into residential municipal services, manufacturing and distribution, construction and infrastructure, and consumer services and public facilities. Residential Municipal Services led with a 37.0% share of 2025 value, because household collection runs weekly across every council area. Consumer Services and Public Facilities grow fastest at 7.82% a year, as supermarkets and hospitality sites add food organics services.
How do providers charge for recovery services?
Based on revenue model, the market is categorized into fixed contract fees, tonnage-based service fees, recovery performance fees and equipment sales and subscriptions. Fixed Contract Fees led with a 41.0% share of 2025 value, because councils prefer predictable annual payments for kerbside services. Recovery Performance Fees grow fastest at 8.63% a year, as buyers tie payments to diversion rates and contamination limits.
| Segment Group | Leading Sub-segment | Share, 2025 | Fastest-growing Sub-segment | CAGR, 2026–2035 |
|---|---|---|---|---|
| By Service Type | Recycling Collection and Aggregation | 44.0% | Recovery Technology and Energy Services | 8.72% |
| By Customer Type | Municipal Authorities | 38.0% | Stewardship Schemes and Recovery Operators | 8.58% |
| By End-Use Industry | Residential Municipal Services | 37.0% | Consumer Services and Public Facilities | 7.82% |
| By Revenue Model | Fixed Contract Fees | 41.0% | Recovery Performance Fees | 8.63% |
Request a Free Sample
Fill in your details and we'll send you a free sample report.
- Sample data tables & charts
- Research methodology
Recovery targets, FOGO rules and network scale lift demand
How do recovery targets and new plants lift spending?
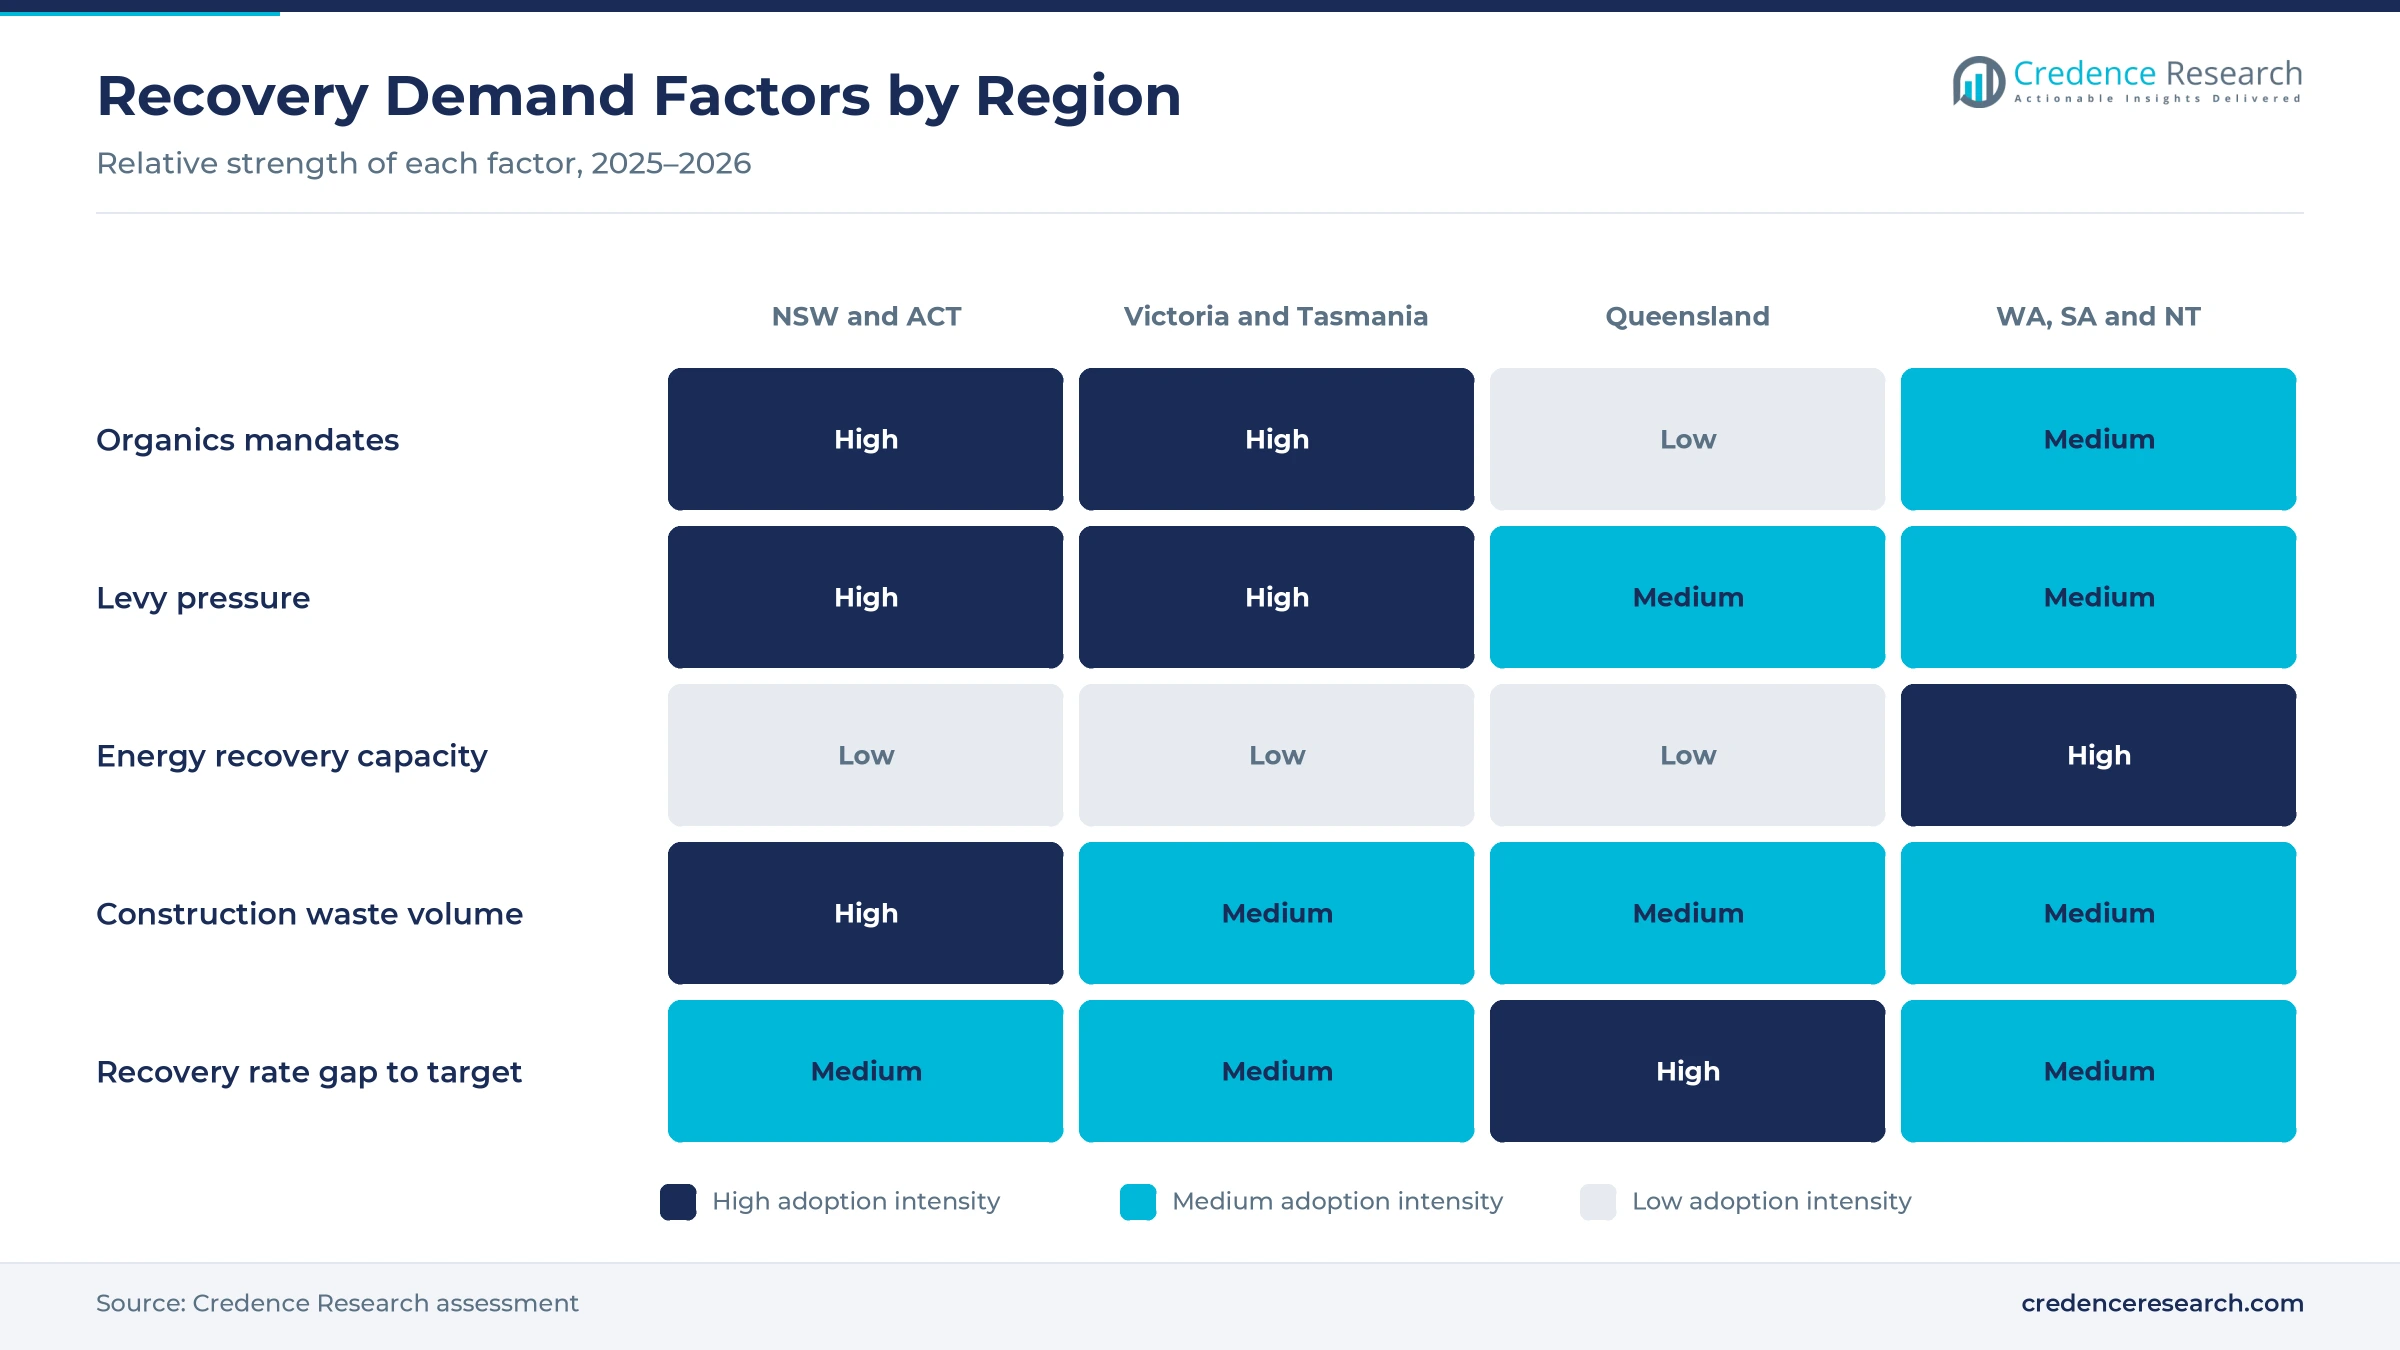
National targets require far higher diversion than Australia achieves today, which forces councils and businesses to buy more sorting and reprocessing capacity. Australia recovered 66% of its waste in 2022-23 against a target of 80% by 2030, according to the Australian Bureau of Statistics. The federal Recycling Modernisation Fund committed A$250 million, which co-investment from states and industry is expected to lift to about A$1 billion. Visy added 95,000 metric tons a year of mixed paper and cardboard capacity at Coolaroo with A$24 million of federal and Victorian funding, according to the Victorian Premier. In turn, materials sorting and reprocessing holds a large share of 2025 value as new plants open.
Why do organics obligations add new collection services?
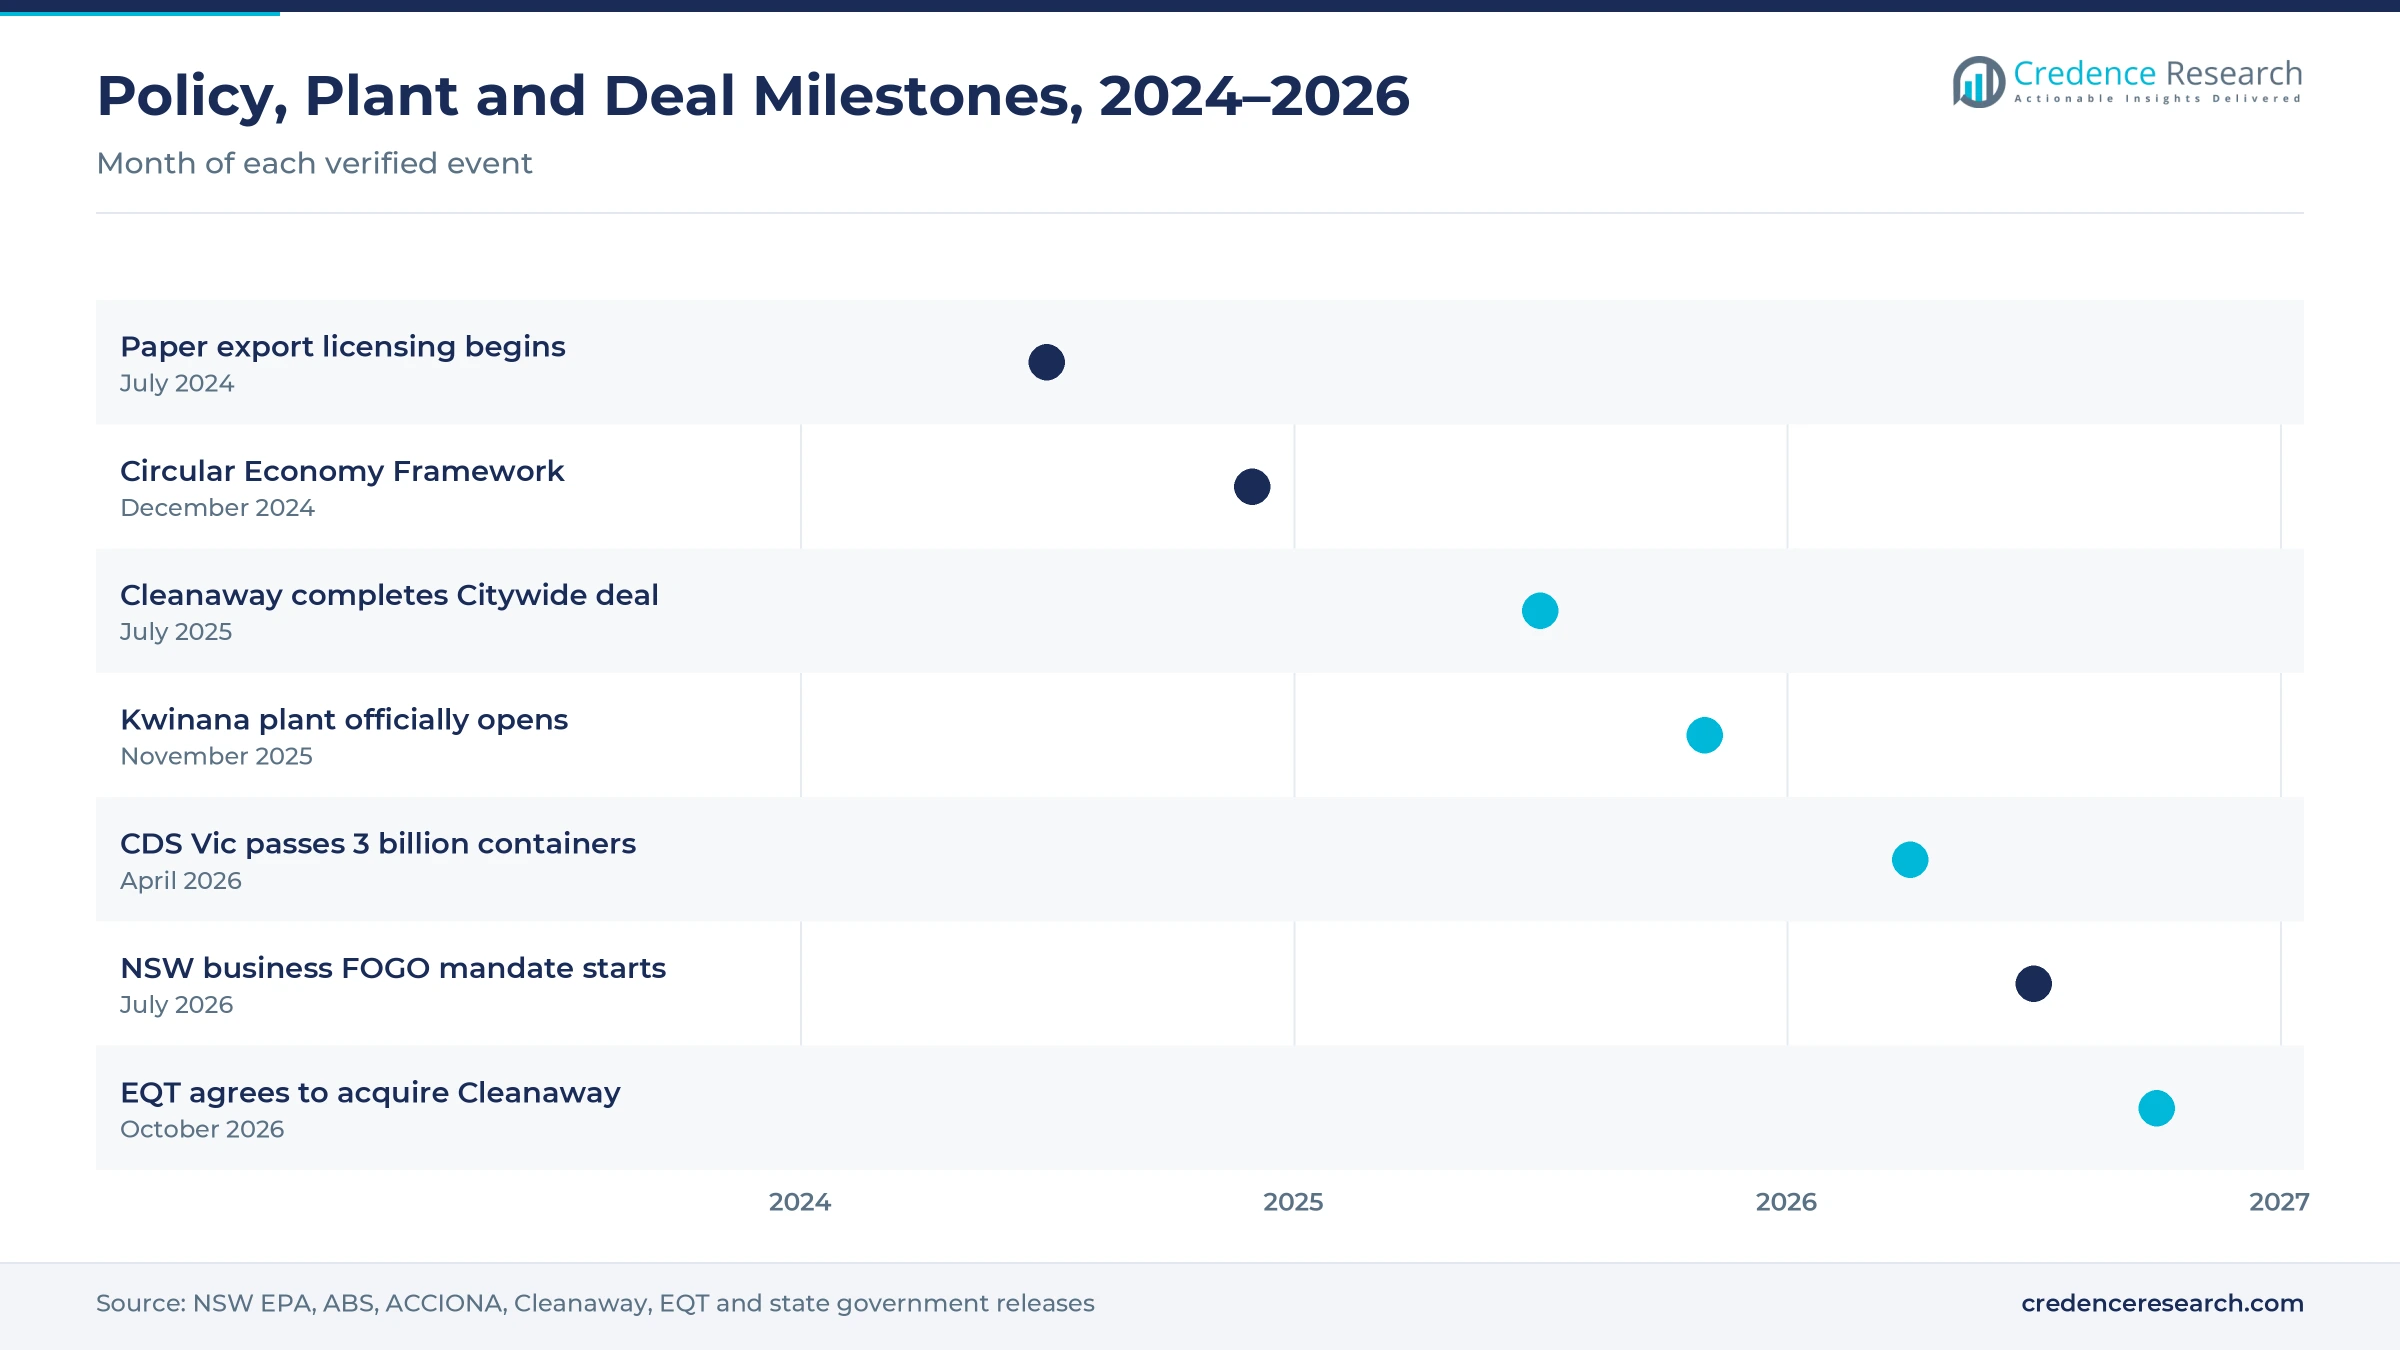
Mandatory food organics collection creates a new bin, a new truck run and new processing demand for every covered household and business. In New South Wales, the largest supermarkets, hospitality sites and institutions must have a food organics service from July 1, 2026, with smaller premises following in 2028 and 2030, according to the NSW Environment Protection Authority. Councils must also offer all NSW households a food and garden organics service by July 1, 2030. Victorian councils must provide a standard four-stream household system by 2030 under the state circular economy act. As a result, specialist and biological recovery grows faster than collection, while food waste handling becomes a core contract item.
How do integrated recovery networks change procurement?
Large buyers increasingly prefer one operator that can collect, transfer, sort and process material, which favors firms with linked assets across the chain. Cleanaway completed its acquisition of Citywide Waste on July 1, 2025, adding about 200 staff, 100 vehicles and the Dynon Road Transfer Station, which it plans to upgrade for A$35 million. EQT Infrastructure agreed to acquire Cleanaway on Oct. 18, 2026, with completion expected by the end of March 2027. JJ Richards & Sons, established in 1932, runs materials recovery facilities in Bendigo, Launceston and Toowoomba alongside its collection fleet. In turn, integrated providers win more municipal solid waste tenders that bundle collection with processing.
Why do export rules and deposit schemes secure feedstock?
Export controls and container refunds keep more clean material inside Australia, which gives local reprocessors steadier feedstock. Licensing for mixed and unsorted paper and cardboard exports began on July 1, 2024, extending rules that already covered glass, plastics and tires. Victoria's container deposit scheme, launched in November 2023, had collected more than 3 billion containers by April 2026, and litter has fallen 71% since the scheme began, according to the North Central Review. The Albury plant of Circular Plastics Australia processes the equivalent of 1 billion bottles a year into more than 20,000 metric tons of recycled PET. As a result, stewardship schemes and recovery operators grow at 8.58% a year, the fastest customer type during 2026–2035.
Energy recovery and circularity goals reshape spending
How is the rise of energy recovery changing residual waste?
Residual waste that cannot be recycled is moving from landfill to thermal plants in some states, which adds a new service line for councils. ACCIONA officially opened the Kwinana Energy Recovery facility in November 2025, with capacity for up to 460,000 metric tons a year and 38 MW of baseload power, according to ACCIONA. The plant also recovers more than 10,000 metric tons of metals a year from bottom ash. Western Australia sent about 146,000 metric tons of waste to energy recovery in 2024-25, nearly 200% more than a year earlier, according to the state Waste Authority. In turn, recovery technology and energy services grow at 8.72% a year as more thermal treatment plants reach operation.
Why is the shift to circularity goals widening scope?
Governments now measure how much secondary material re-enters the economy, not only how much waste leaves landfill, which widens demand beyond collection. Environment ministers backed a national Circular Economy Framework in December 2024 that aims to double the circularity rate by 2035. Australia's circularity rate stood at about 4.3% in 2024, below a global rate of 6.9%, according to the Australian Bureau of Statistics. Global municipal waste is expected to rise from 2.01 billion metric tons a year to about 3.40 billion metric tons by 2050, according to the World Bank. As a result, manufacturers and builders seek recycled inputs, which supports reprocessing and recovery performance contracts.
Can domestic plastics reprocessing become a growth opening?
Australia still recycles a small share of the plastic it uses, which leaves a large opening for operators that can turn mixed polymers into food-grade resin. Australia generated about 2.6 million metric tons of plastics in 2020-21 and recycled only 13%, according to National Waste Report figures published by Planet Ark. The federal government added A$60 million for hard-to-recycle plastics such as soft plastics to its recycling infrastructure program. Cleanaway, Pact Group, Asahi Beverages and Coca-Cola Europacific Partners jointly own the Albury PET plant, which began operations in December 2021. In turn, operators with polymer reprocessing lines can win long offtake deals with brand owners.
Is there an opening in construction and demolition recovery?
Construction and demolition waste is the fastest-rising stream in the largest state, which gives builders and processors a clear opening for aggregate and timber recovery. New South Wales generated 22.4 million metric tons of waste in 2024-25, up 5% from 2023-24, mainly because construction and demolition generation rose 7%. The state recycled 80% of its construction and demolition waste, against 52% for commercial and industrial waste and 48% for municipal waste, according to the NSW Environment Protection Authority. Western Australia also linked a fall in its recycling rate to more construction waste going to landfill in 2024-25. As a result, construction contractors gain recovery options in the zones where diversion still lags the national target.
Contamination, low plastics yields and landfill pricing gaps
How does contamination raise sorting costs?
Mixed bins that carry food, film and nappies lower the value of sorted material and add labor at materials recovery facilities. As a result, processors pay more to clean bales before they can sell them to local or overseas mills. Councils respond with bin audits, education campaigns and tags on bins, which help cut contamination over time. This challenge eases when separate glass and organics bins remove the heaviest contaminants from the recycling stream.
Why do low plastics yields limit reprocessing margins?
Many plastic items are too small, too mixed or too dirty to recover at a profit, which keeps yields low for reprocessors. In turn, plants that need steady clean feedstock compete for the same bottles and containers from deposit schemes. Operators respond with optical sorting, washing lines and offtake deals with brand owners, which help stabilize margins. This pressure should ease as packaging design standards favor recyclable formats.
How do uneven landfill levies weaken recovery economics?
Disposal levies differ widely between states and between metropolitan and regional areas, which makes landfill cheaper than recovery in some places. Queensland charges A$125 a metric ton for metropolitan general waste in 2025-26, but only A$97 a metric ton in regional areas. As a result, recycling contracts are harder to justify where gate fees stay low. Governments respond with scheduled levy increases and grants, which narrow the price gap over time.
Why do long approvals delay new recovery plants?
Energy recovery, organics and reprocessing plants need planning, environmental and community approvals that can take several years. In turn, councils with new organics mandates may lack nearby processing when deadlines arrive, which raises haulage costs. Operators respond with modular composting, shared regional facilities and early engagement with planners. This challenge is sharpest in growing metropolitan areas where land near residents is scarce.
NSW and the ACT lead while Queensland grows fastest
| Region | Value, 2025 (USD billion) | Share, 2025 | CAGR, 2026–2035 |
|---|---|---|---|
| New South Wales and Australian Capital Territory | 1.92 | 33.7% | 7.32% |
| Victoria and Tasmania | 1.40 | 24.6% | 6.82% |
| Western Australia, South Australia and Northern Territory | 1.29 | 22.7% | 7.22% |
| Queensland | 1.08 | 19.0% | 7.72% |
Why do New South Wales and the ACT hold the top share?
New South Wales and the Australian Capital Territory held a 33.7% share of 2025 value and grow at 7.32% a year, because the zone generates the most waste. New South Wales alone generated 22.4 million metric tons in 2024-25 and recycled 67%, up from a 63% baseline in 2015-16. Staged food organics mandates from July 2026 add new business and household services. As a result, the zone leads spending on both collection and organics processing.
How do Victoria and Tasmania build on four-stream systems?
Victoria and Tasmania held a 24.6% share of 2025 value and grow at 6.82% a year, because Victoria already funds large recycling programs. The state committed A$515 million to its waste and recycling sector, including A$380 million under Recycling Victoria. Victorian councils must deliver four-stream household services by 2030, and Mildura added glass collection in July 2024. In turn, the zone grows steadily from a high base of separated collection and paper reprocessing.
Why does Queensland grow the fastest?
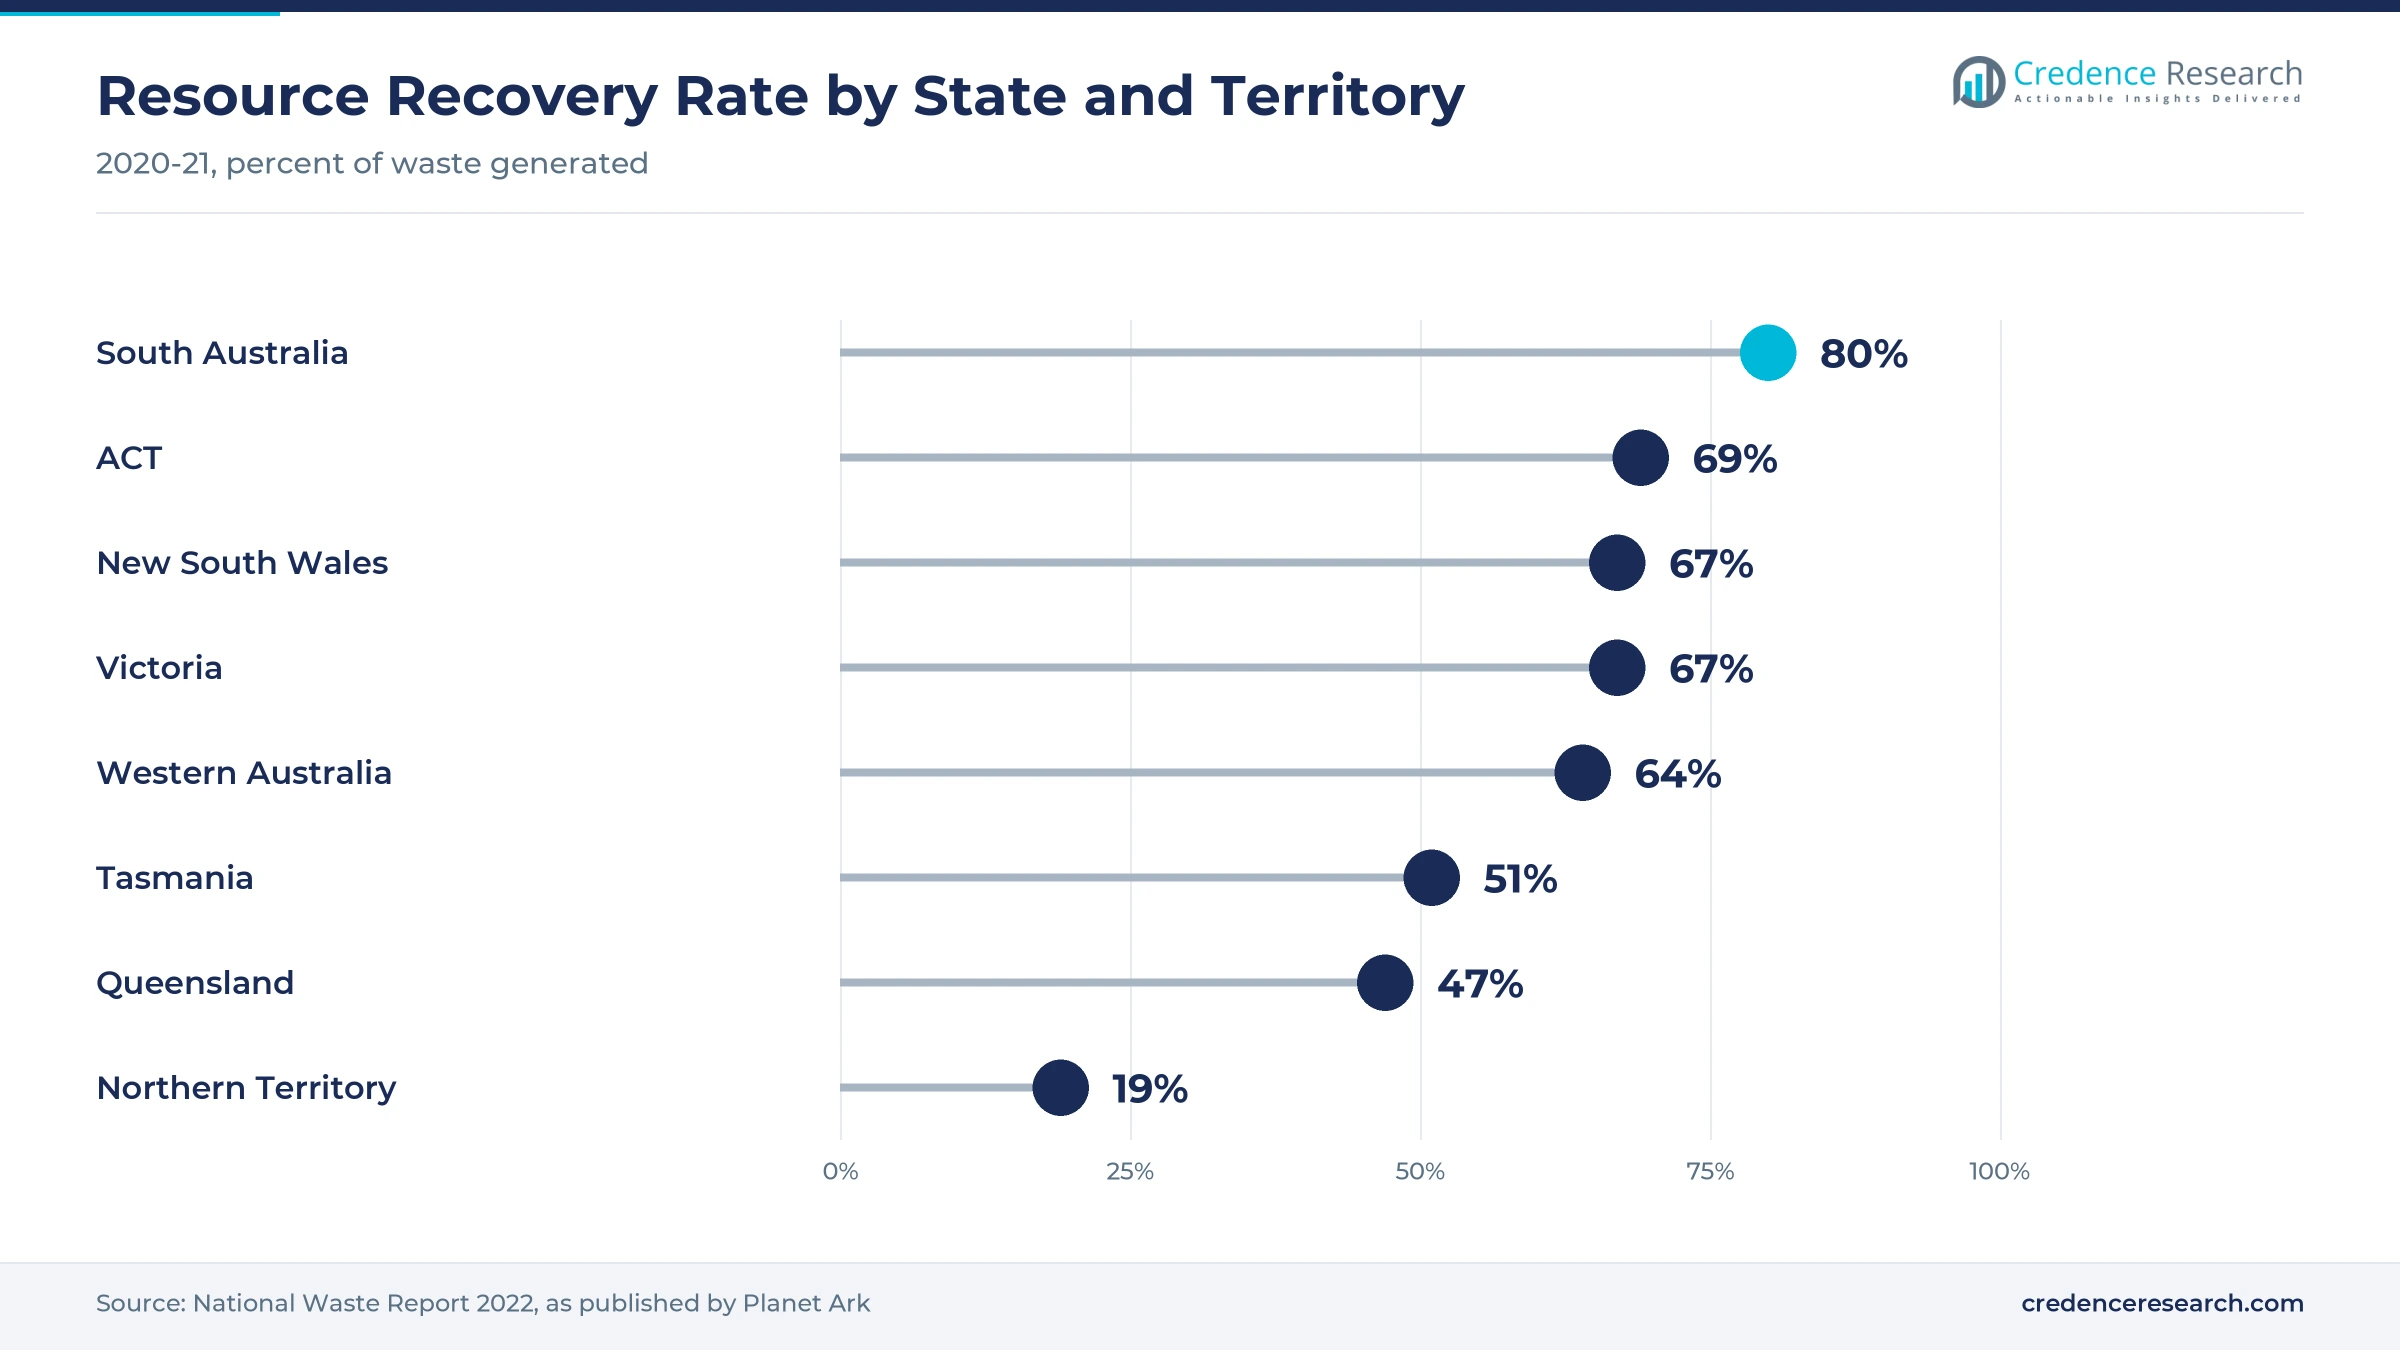
Queensland held a 19.0% share of 2025 value and grows fastest at 7.72% a year, because the state started from a low recovery rate and is raising its disposal levy each year. Queensland recovered 47% of its waste in 2020-21, the second-lowest rate of any state or territory. The metropolitan general waste levy rises from A$125 a metric ton in 2025-26 to A$135 a metric ton in 2026-27. As a result, more councils and businesses move waste from landfill into recycling contracts.
How do WA, South Australia and the NT add energy recovery?
Western Australia, South Australia and the Northern Territory held a 22.7% share of 2025 value and grow at 7.22% a year. Western Australia generated 7.5 million metric tons of waste in 2024-25 and recovered 64%, while South Australia posted the highest recovery rate of any state in 2020-21. The new Kwinana plant adds a large block of thermal recovery capacity near Perth. In turn, the zone combines mature recovery in South Australia with new energy services in the west.
Acquisitions, energy recovery plants and FOGO deadlines
| Development | Status and market relevance |
|---|---|
| In December 2024, environment ministers backed a national Circular Economy Framework that aims to double circularity by 2035. | Sets a national goal beyond landfill diversion |
| In July 2025, Cleanaway completed its acquisition of Citywide Waste and the Dynon Road Transfer Station in Melbourne. | Extends an integrated inner-city collection network |
| In November 2025, ACCIONA officially opened the Kwinana Energy Recovery facility in Western Australia. | Adds up to 460,000 metric tons a year of thermal capacity |
| In July 2026, the first NSW food organics mandate took effect for large supermarkets, hospitality sites and institutions. | Creates new business organics collection demand |
| In October 2026, EQT Infrastructure agreed to acquire Cleanaway through a scheme of arrangement. | Pending shareholder, court and regulatory approvals |
Sorting, digestion and thermal recovery drive upgrades
- Optical and robotic sorting separates polymers, paper grades and metals at materials recovery facilities, which raises bale value and lowers contamination.
- Anaerobic digestion turns food organics into biogas and fertilizer, as at Veolia's EarthPower site in New South Wales, which supports new organics mandates.
- Thermal energy recovery converts residual waste into baseload electricity and recovers metals from bottom ash, as at the Kwinana plant near Perth.
- Drum pulping and washing lines clean mixed paper and plastics so that reprocessors can make new packaging from lower-grade feedstock.
Need a Custom Version of This Report?
Tailor the scope, geography, or segments to your exact requirements.
- Custom geography or segment scope
- Direct access to our analyst team
National integrators and family operators compete on reach
Competition combines national integrators that run collection, transfer and processing assets with family-owned operators and specialist processors. Cleanaway provides collection, recycling, treatment and disposal services to households, businesses and councils nationwide, and expanded in inner Melbourne through Citywide Waste. JJ Richards & Sons, the largest privately owned waste management company in Australia, offers bin, liquid waste and recycling services and runs materials recovery facilities in several states. Veolia offers food organics collection and anaerobic digestion in New South Wales, while REMONDIS runs organics composting facilities in New South Wales and Western Australia. Visy reprocesses paper and cardboard at Coolaroo, and ACCIONA owns and operates the Kwinana energy recovery plant. Pact Group co-owns the PET bottle reprocessing plant at Albury in New South Wales. Rivals compete on network coverage, processing capacity, diversion performance and long council contracts.
Which collectors, reprocessors and plant operators lead?
| Company | Type | Role in the market |
|---|---|---|
| JJ Richards & Sons | Integrated collector | Bin, liquid waste and recycling services with regional MRFs |
| Cleanaway | Integrated collector | National collection, recycling, treatment and disposal network |
| Veolia | Integrated collector | Food organics collection and anaerobic digestion in NSW |
| REMONDIS | Integrated collector | Organics composting in New South Wales and Western Australia |
| Visy | Reprocessor | Paper and cardboard recycling at Coolaroo in Victoria |
| ACCIONA | Energy recovery operator | Owns and operates the Kwinana energy recovery facility |
| Pact Group | Reprocessor | Co-owner of the Circular Plastics Australia PET plant at Albury |
Credence Research view on Australian resource recovery
Credence Research's view is that Australian recovery spending will rise steadily because state organics mandates, rising levies and the 2030 recovery target all fall due within the next five years. Collection contracts remain the core of value, yet organics processing, energy recovery and performance-linked contracts add the fastest growth. Consolidation among integrated operators should continue, as councils favor providers that can collect, sort and process under one contract. Providers with local processing capacity near growing cities should gain the most share by 2035.
How the Australian recovery services estimate was built
The report uses 2025 as the base year on a calendar basis, and market values come from the Credence Research model. That model combines national and state data on waste generation, recovery rates and levy settings, government announcements on funding and mandates, and company releases on acquisitions and new plants. Segment splits, zone shares and zone growth rates are Credence Research estimates. Sources used are statistics agency and regulator publications, government releases, company releases and international agency data, and no interviews or surveys were used.
Organics mandates and 2030 targets set demand to 2035
The Australia circular economy and recycling technology market is expected to reach USD 11.49 billion by 2035, a 7.25% CAGR during 2026–2035, as councils and businesses add organics services and more material moves to recovery. Growth should be strongest in recovery technology and energy services, stewardship schemes and Queensland, because these areas gain most from new plants, deposit schemes and rising levies. Contamination, low plastics yields and slow approvals could delay some projects, while the national circularity goal should support demand after 2030.
Frequently Asked Questions
How big is the Australia circular economy and recycling technology market?
Which service type leads Australian recovery spending?
Which region leads the market?
What is Australia's national resource recovery target?
When do NSW food organics mandates start?
What capacity does the Kwinana energy recovery plant add?
Who are the leading companies in Australian recycling and recovery?
What are the main challenges for recovery providers?
Table of Content
Chapter 1 Market Segmentation
- 1.1 Segmentation Framework
- 1.1.1 Product and Service Classification
- 1.1.2 Application and End-Use Classification
- 1.1.3 Technology and Solution Classification
- 1.1.4 Customer and Distribution Channel Classification
- 1.1.5 Geographic Segmentation
- 1.1.6 Market Segment Definitions and Boundaries
- 1.2 By Service Type
- 1.2.1 Recycling Collection and Aggregation
- 1.2.2 Materials Sorting and Reprocessing
- 1.2.3 Specialist and Biological Recovery
- 1.2.4 Recovery Technology and Energy Services
- 1.3 By Customer Type
- 1.3.1 Municipal Authorities
- 1.3.2 Business Waste Generators
- 1.3.3 Construction Contractors
- 1.3.4 Stewardship Schemes and Recovery Operators
- 1.4 By End-Use Industry
- 1.4.1 Residential Municipal Services
- 1.4.2 Manufacturing and Distribution
- 1.4.3 Construction and Infrastructure
- 1.4.4 Consumer Services and Public Facilities
- 1.5 By Revenue Model
- 1.5.1 Fixed Contract Fees
- 1.5.2 Tonnage-Based Service Fees
- 1.5.3 Recovery Performance Fees
- 1.5.4 Equipment Sales and Subscriptions
Chapter 2 Introduction
- 2.1 Report Objectives and Scope
- 2.2 Product Definition and Industry Terminology
- 2.3 Market Inclusions and Exclusions
- 2.4 Research Process
- 2.4.1 Primary Research and Expert Interviews
- 2.4.2 Secondary Research and Source Review
- 2.4.3 Top-Down and Bottom-Up Estimation
- 2.4.4 Data Triangulation and Verification
- 2.5 Market Size Measurement Basis
- 2.5.1 2025: USD 5.69 billion → 2035: USD 11.49 billion
- 2.6 Historical and Forecast Reference Periods
- 2.6.1 Historical Period: 2018-2025
- 2.6.2 Base Year: 2025
- 2.6.3 Forecast Period: 2025-2035
- 2.7 Research Assumptions and Limitations
Chapter 3 Executive Summary
- 3.1 Market Snapshot and Key Findings
- 3.2 Base-Year Market Size, 2025
- 3.3 Forecast Market Size, 2035
- 3.4 Revenue and Volume Growth Outlook
- 3.5 Key Demand and Supply Indicators
- 3.6 Leading Market Segments
- 3.7 Fastest-Growing Market Opportunities
- 3.8 Regional Performance Highlights
- 3.9 Technology and Industry Transformation
- 3.10 Competitive Landscape Summary
- 3.11 Analyst View and Strategic Implications
Chapter 4 Australia Circular Economy and Recycling Technology Market Trends and Developments
- 4.1 Historical Industry Development, 2018-2025
- 4.2 Recent Market Trends and Developments
- 4.3 Demand and Customer Behavior Trends
- 4.4 Technology and Product Innovation
- 4.5 Artificial Intelligence, Automation and Digitalization
- 4.6 Local Manufacturing and Supply Chain Realignment
- 4.7 Industry Partnerships, Mergers and Acquisitions
- 4.8 Sustainability and Circular Economy Developments
- 4.9 Government and Private Sector Investment Trends
- 4.10 Emerging Business Models and Commercialization
- 4.11 Industry Developments and Announcements
Chapter 5 Australia Circular Economy and Recycling Technology Market Production, Supply and Demand Analysis
- 5.1 Demand Trend and Consumption Analysis, 2018-2025
- 5.2 Demand Forecast, 2025-2035
- 5.3 Production and Output Trend, 2018-2025
- 5.4 Production and Output Forecast, 2025-2035
- 5.5 Installed Capacity and Capacity Utilization
- 5.6 Company-Wise Production Plants and Statistics
- 5.6.1 Installed Production Capacity
- 5.6.2 Actual Production
- 5.6.3 Planned Capacity and Expansion Targets
- 5.7 Supply Chain Structure and Procurement Trends
- 5.8 Supply-Demand Gap and Bottlenecks
- 5.9 Import Dependence and Sourcing Structure
- 5.10 Contract Manufacturing and Outsourcing
- 5.11 Regional Supply and Demand Concentration
Chapter 6 Australia Circular Economy and Recycling Technology Market Pricing Analysis
- 6.1 Pricing Structure and Measurement
- 6.2 Historical Pricing Trends, 2018-2025
- 6.3 Pricing Outlook, 2025-2035
- 6.4 Average Selling Price and Unit Economics
- 6.5 Pricing by Product and Market Segment
- 6.6 Geographic Pricing Differences
- 6.7 Key Input, Energy, Labor and Logistics Costs
- 6.8 Contract Pricing and Purchasing Models
- 6.9 Pricing Sensitivity and Competitive Positioning
- 6.10 Price, Margin and Profitability Implications
Chapter 7 Australia Circular Economy and Recycling Technology Market Dynamics
- 7.1 Market Growth Drivers
- 7.1.1 Demand-Side Drivers
- 7.1.2 Technology and Innovation Drivers
- 7.1.3 Infrastructure and Investment Drivers
- 7.1.4 Regulatory and Policy Drivers
- 7.2 Market Restraints
- 7.2.1 Cost and Affordability Constraints
- 7.2.2 Technology and Adoption Barriers
- 7.2.3 Supply Chain and Operational Constraints
- 7.3 Market Challenges
- 7.3.1 Competitive Pressure and Margin Erosion
- 7.3.2 Skills, Infrastructure and Implementation Gaps
- 7.4 Emerging Market Opportunities
- 7.5 Market Dynamics Impact and Time-Horizon Assessment
Chapter 8 Australia Circular Economy and Recycling Technology Value Chain Analysis
- 8.1 Industry Value Chain Overview
- 8.2 Upstream Suppliers and Critical Inputs
- 8.3 Technology and Component Providers
- 8.4 Manufacturing or Service Delivery
- 8.5 Distribution, Channel Partners and Integrators
- 8.6 Downstream Applications and End Users
- 8.7 Value Addition and Profit Pools
- 8.8 Vertical Integration and Outsourcing
- 8.9 Supplier Concentration and Risk
- 8.10 Supply Chain Localization and Resilience
Chapter 9 Australia Circular Economy and Recycling Technology Market Regulations and Policies
- 9.1 Relevant Laws, Standards and Compliance Frameworks
- 9.2 Product, Service, Safety and Quality Requirements
- 9.3 Government Policies, Incentives and Subsidies
- 9.4 Imports, Exports and Trade Barriers
- 9.5 Public Procurement and Local Content Requirements
- 9.6 Environmental and Sustainability Compliance
- 9.7 Upcoming Policy Changes and Market Implications
Chapter 10 Australia Circular Economy and Recycling Technology Market Hotspots and Opportunities
- 10.1 Market Opportunity Mapping and Growth Hotspots
- 10.2 High-Growth Applications and Customer Groups
- 10.3 Underserved Markets and White-Space Opportunities
- 10.4 Emerging Technology and Product Opportunities
- 10.5 New Capacity and Investment Hotspots
- 10.6 Market Entry and Expansion Opportunities
- 10.7 Distribution and Partnership Opportunities
- 10.8 Near-Term and Long-Term Commercial Potential
- 10.9 Opportunity Attractiveness and Execution Risks
Chapter 11 Australia Circular Economy and Recycling Technology Market Outlook, 2025-2035
- 11.1 Market Size and Analysis
- 11.1.1 Revenue (Market Measurement: 2025: USD 5.69 billion → 2035: USD 11.49 billion)
- 11.1.2 Market Volume and Quantity Sold
- 11.1.3 Historical Market Size, 2018-2025
- 11.1.4 Base-Year Market Size, 2025
- 11.2 Market Forecast, 2025-2035
- 11.2.1 Revenue Forecast to 2035
- 11.2.2 Volume Forecast to 2035
- 11.2.3 CAGR and Year-on-Year Growth
- 11.2.4 Incremental Revenue Opportunity
- 11.3 Forecast Assumptions and Scenario Analysis
- 11.3.1 Base-Case Forecast
- 11.3.2 Optimistic and Conservative Scenarios
- 11.3.3 Technology, Pricing and Policy Sensitivities
- 11.4 Market Attractiveness and Growth Outlook
Chapter 12 Australia Circular Economy and Recycling Technology Market Segmentation and Outlook
- 12.1 Segmentation Summary and Market Shares, 2025
- 12.2 Largest and Fastest-Growing Segments
- 12.3 By Service Type - Market Size and Forecast, 2025-2035
- 12.3.1 Segment Definition and Scope
- 12.3.2 Historical Market Size, 2018-2025
- 12.3.3 Revenue Forecast, 2025-2035
- 12.3.4 Volume Forecast, 2025-2035
- 12.3.5 Base-Year Market Share, 2025
- 12.3.6 Segment CAGR and Growth Drivers
- 12.3.7 Subsegment Market Size and Forecast
- 12.3.7.1 Recycling Collection and Aggregation
- 12.3.7.2 Materials Sorting and Reprocessing
- 12.3.7.3 Specialist and Biological Recovery
- 12.3.7.4 Recovery Technology and Energy Services
- 12.3.8 Subsegment Pricing and Adoption Trends
- 12.3.9 Leading Suppliers and Competition
- 12.3.10 Regional Demand and Opportunities
- 12.4 By Customer Type - Market Size and Forecast, 2025-2035
- 12.4.1 Segment Definition and Scope
- 12.4.2 Historical Market Size, 2018-2025
- 12.4.3 Revenue Forecast, 2025-2035
- 12.4.4 Volume Forecast, 2025-2035
- 12.4.5 Base-Year Market Share, 2025
- 12.4.6 Segment CAGR and Growth Drivers
- 12.4.7 Subsegment Market Size and Forecast
- 12.4.7.1 Municipal Authorities
- 12.4.7.2 Business Waste Generators
- 12.4.7.3 Construction Contractors
- 12.4.7.4 Stewardship Schemes and Recovery Operators
- 12.4.8 Subsegment Pricing and Adoption Trends
- 12.4.9 Leading Suppliers and Competition
- 12.4.10 Regional Demand and Opportunities
- 12.5 By End-Use Industry - Market Size and Forecast, 2025-2035
- 12.5.1 Segment Definition and Scope
- 12.5.2 Historical Market Size, 2018-2025
- 12.5.3 Revenue Forecast, 2025-2035
- 12.5.4 Volume Forecast, 2025-2035
- 12.5.5 Base-Year Market Share, 2025
- 12.5.6 Segment CAGR and Growth Drivers
- 12.5.7 Subsegment Market Size and Forecast
- 12.5.7.1 Residential Municipal Services
- 12.5.7.2 Manufacturing and Distribution
- 12.5.7.3 Construction and Infrastructure
- 12.5.7.4 Consumer Services and Public Facilities
- 12.5.8 Subsegment Pricing and Adoption Trends
- 12.5.9 Leading Suppliers and Competition
- 12.5.10 Regional Demand and Opportunities
- 12.6 By Revenue Model - Market Size and Forecast, 2025-2035
- 12.6.1 Segment Definition and Scope
- 12.6.2 Historical Market Size, 2018-2025
- 12.6.3 Revenue Forecast, 2025-2035
- 12.6.4 Volume Forecast, 2025-2035
- 12.6.5 Base-Year Market Share, 2025
- 12.6.6 Segment CAGR and Growth Drivers
- 12.6.7 Subsegment Market Size and Forecast
- 12.6.7.1 Fixed Contract Fees
- 12.6.7.2 Tonnage-Based Service Fees
- 12.6.7.3 Recovery Performance Fees
- 12.6.7.4 Equipment Sales and Subscriptions
- 12.6.8 Subsegment Pricing and Adoption Trends
- 12.6.9 Leading Suppliers and Competition
- 12.6.10 Regional Demand and Opportunities
- 12.7 Segment Growth Comparison
- 12.8 Segment Attractiveness and Priority Matrix
Chapter 13 Australia Circular Economy and Recycling Technology End-Use and Application Market Outlook
- 13.1 End-Use Industry and Customer Demand Structure
- 13.2 Leading Applications and Customer Groups
- 13.3 End-Use Market Size, Share and Forecast
- 13.4 Major End-Use Industry Deep Dives
- 13.4.1 Customer Requirements and Use Cases
- 13.4.2 Demand and Replacement Cycles
- 13.4.3 Technical and Regulatory Considerations
- 13.4.4 Purchasing and Procurement Models
- 13.4.5 Leading Vendors and Distribution Channels
- 13.4.6 Forecast and Commercial Opportunities
- 13.5 Emerging Applications and Cross-Segment Demand
- 13.6 End-Use Industry Investment Priorities
Chapter 14 Australia Circular Economy and Recycling Technology Geographic Market Outlook, 2025-2035
- 14.1 Domestic Market Distribution and Demand Clusters
- 14.2 State- or Province-Wise Market Size and Forecast, 2025-2035
- 14.3 City and Metropolitan Market Outlook
- 14.4 Industrial, Manufacturing and Commercial Clusters
- 14.5 Geographic Concentration of Key End Users
- 14.6 Local Pricing and Purchasing Differences
- 14.7 Domestic Production Facilities and Capacity Map
- 14.8 Local Infrastructure and Project Pipeline
- 14.9 State-Level Policy and Incentive Differences
- 14.10 Subnational Investment Hotspots and Opportunities
- 14.11 Distribution and Logistics Networks
- 14.12 Domestic Competitive Footprint
Chapter 15 Australia Circular Economy and Recycling Technology Technology, Innovation and Sustainability Outlook
- 15.1 Technology Landscape and Maturity
- 15.2 Product, Process and Service Innovation
- 15.3 AI, Automation and Digital Tools in the Industry
- 15.4 Technology Adoption and Performance Benchmarking
- 15.5 Innovation Pipeline and R&D Investment
- 15.6 Patent and Intellectual Property Trends
- 15.7 Energy Efficiency and Resource Management
- 15.8 Sustainability, Recycling and Circularity
- 15.9 Technology Roadmap, 2025-2035
- 15.10 Risks of Obsolescence and Technology Substitution
Chapter 16 Australia Circular Economy and Recycling Technology Market Key Strategic Imperatives
- 16.1 Growth and Market Entry Priorities
- 16.2 High-Return Products and Segments
- 16.3 Pricing, Profitability and Cost Optimization
- 16.4 Technology Investment and Product Differentiation
- 16.5 Supply Chain Localization and Resilience
- 16.6 Distribution and Customer Acquisition
- 16.7 Partnership, Acquisition and Capacity Strategy
- 16.8 Regional Expansion Priorities
- 16.9 Short-, Medium- and Long-Term Actions
Chapter 17 Competition Outlook
- 17.1 Industry Competition Characteristics
- 17.2 Market Structure and Concentration
- 17.3 Market Share and Competitive Positioning, 2025
- 17.4 Company-Wise Revenue and Product Benchmarking
- 17.5 Production and Service Capacity Benchmarking
- 17.6 Technology, Pricing and Differentiation
- 17.7 Regional Footprint and Distribution Strength
- 17.8 Mergers, Acquisitions and Strategic Alliances
- 17.9 New Entrants and Competitive Threats
- 17.10 Porter's Five Forces and Industry Attractiveness
- 17.11 Competitive Outlook, 2025-2035
Chapter 18 Company Profiles
- 18.1 Company Coverage and Selection Criteria
- 18.2 JJ Richards & Sons
- 18.2.1 Business Description
- 18.2.2 Company Ownership and Geographic Presence
- 18.2.3 Product and Service Portfolio
- 18.2.4 Manufacturing and Operating Footprint
- 18.2.5 Production Capacity and Expansion Plans
- 18.2.6 Financial Performance and Investment
- 18.2.7 Market Share and Competitive Position
- 18.2.8 Technology and Innovation Capabilities
- 18.2.9 Strategic Alliances or Partnerships
- 18.2.10 Recent Developments
- 18.2.11 Growth Strategy and Outlook
- 18.3 Cleanaway
- 18.4 Veolia
- 18.5 REMONDIS
- 18.6 Visy
- 18.7 ACCIONA
- 18.8 Pact Group
- 18.9 Other Relevant Market Participants
Note: Every listed company is profiled on the structure shown under the first company. The company list is preliminary and may change based on research findings, market developments, data availability and client requirements.
Chapter 19 Disclaimer
- 19.1 Research and Forecast Disclaimer
- 19.2 Data Source and Estimation Limitations
Note: The depth of individual sections depends on data availability for this market. Volume, capacity, trade and other unit-based metrics are included where applicable.

