
Refineries and smelters keep gas cleaning spend steady
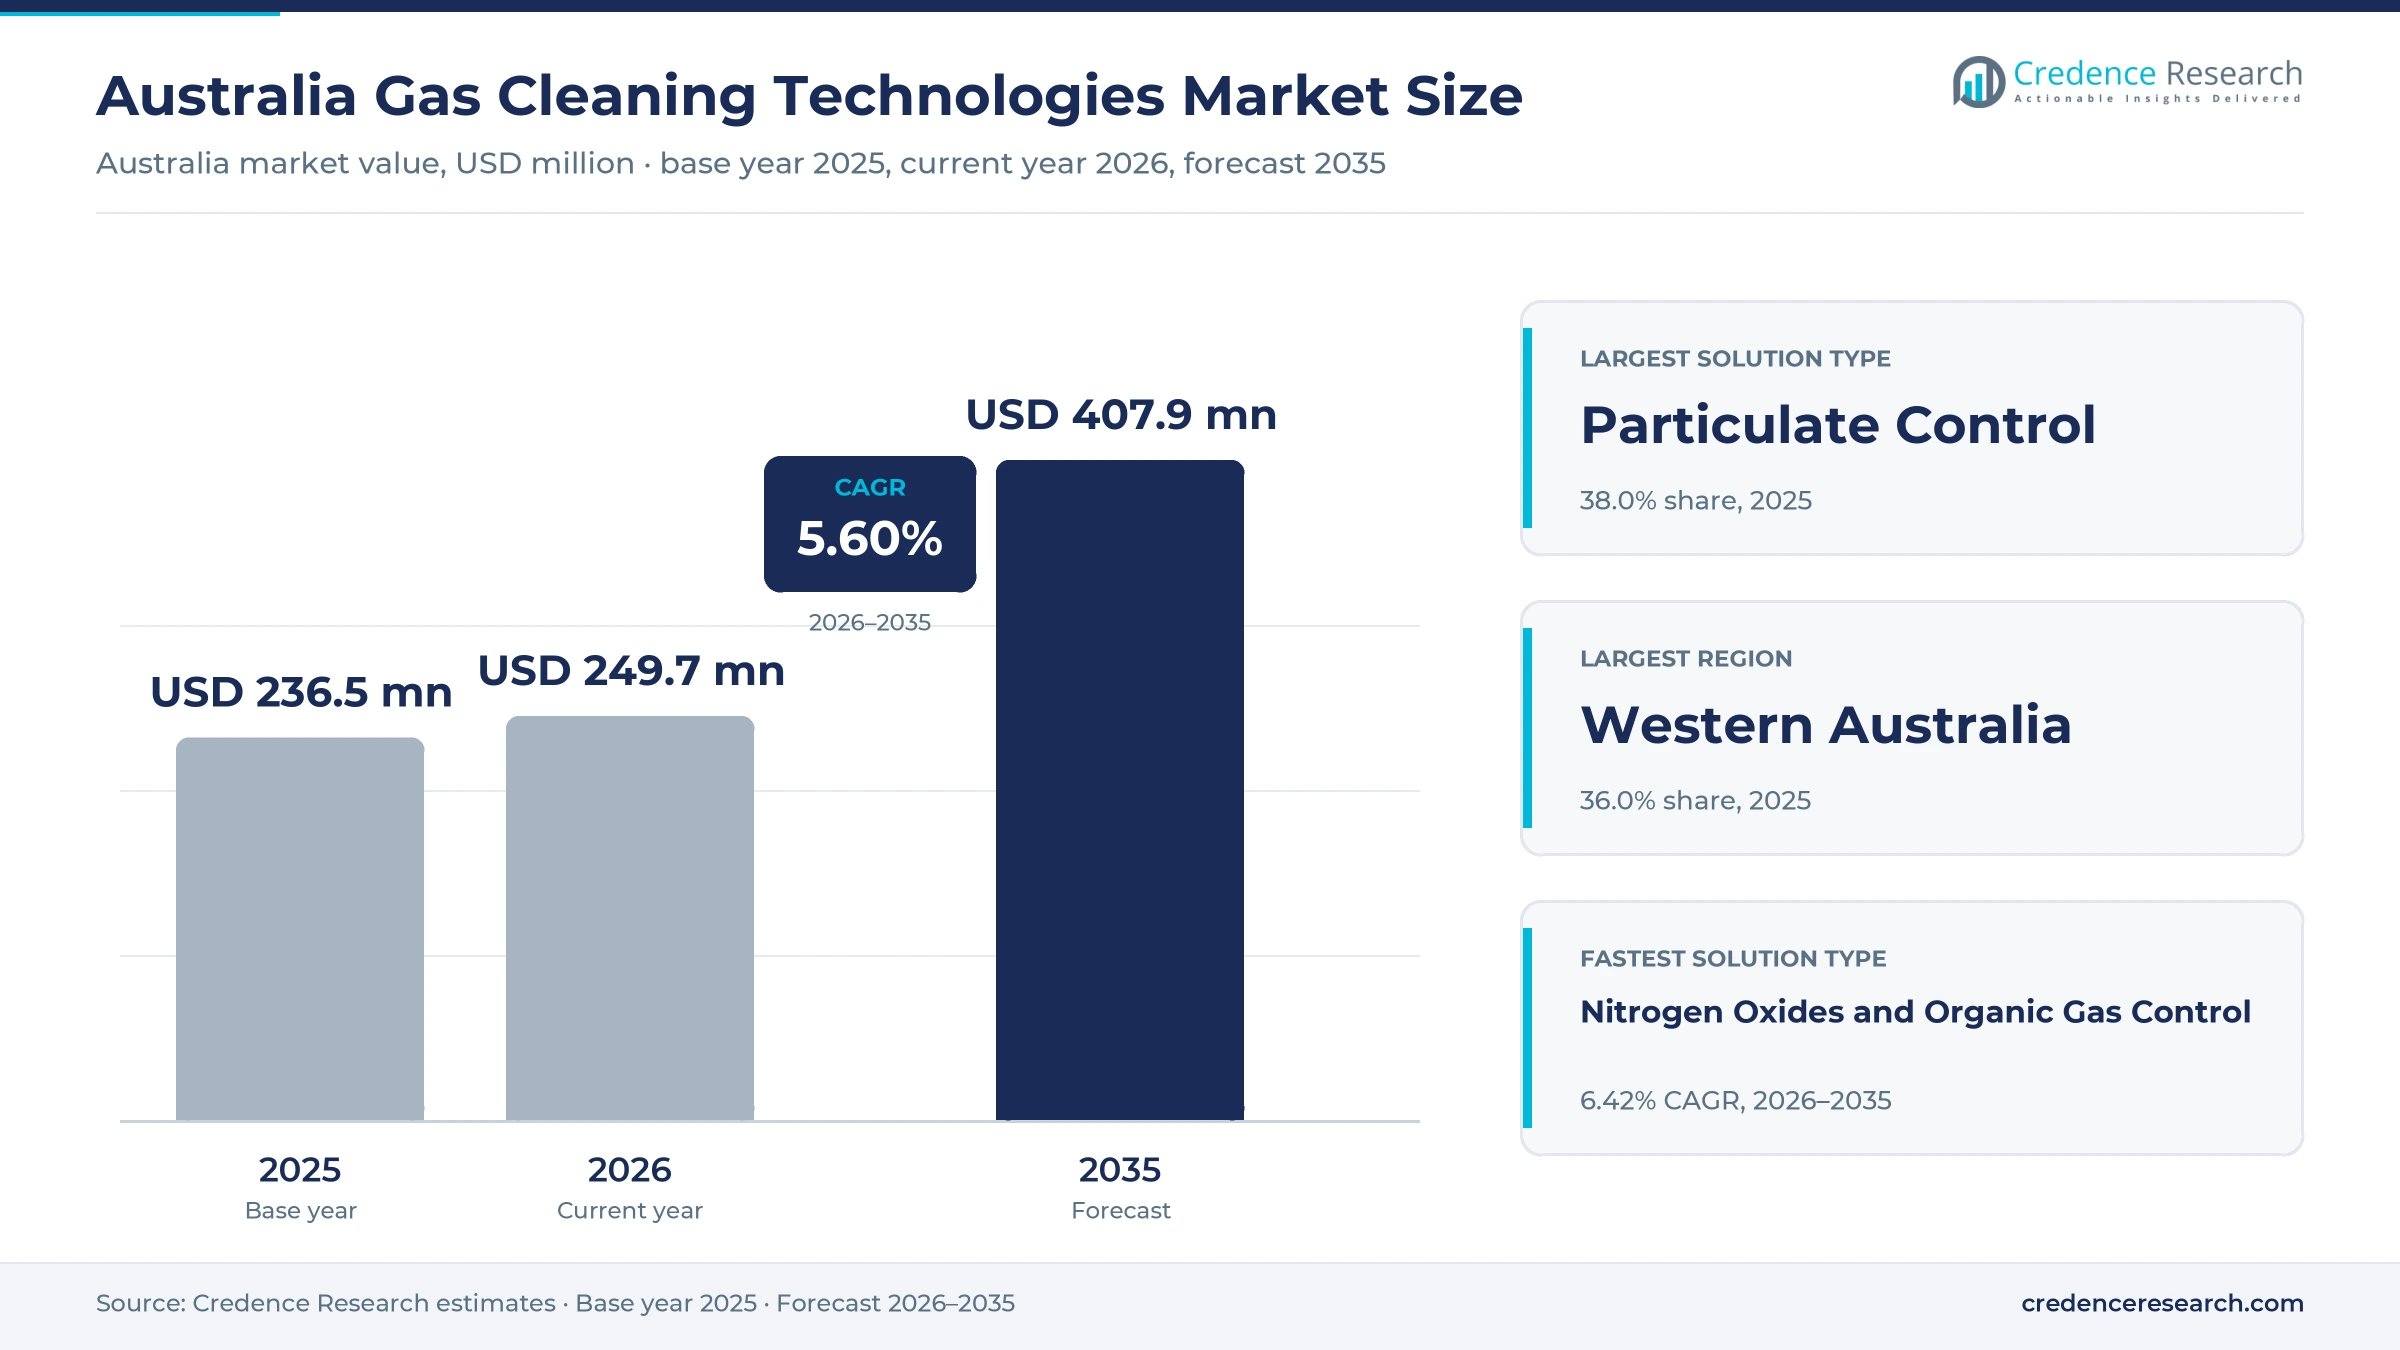
The Australia gas cleaning technologies market was valued at USD 236.5 million in 2025 and is projected to increase from USD 249.7 million in 2026 to USD 407.9 million by 2035, registering a CAGR of 5.60% during 2026–2035. Demand comes from alumina refineries, smelters, mineral processing plants, coal-fired power stations and new energy-from-waste plants, each of which must meet its own licensed emission limits for dust, acid gases and nitrogen oxides. Western Australia held the largest regional share, 36.0% in 2025, because the state hosts the Worsley, Wagerup and Pinjarra alumina refineries and more Safeguard processing facilities than any other. The same region is also the fastest-growing at 5.93% a year during 2026–2035, as new processing plants and waste-to-energy capacity add projects. Government support packages for the Mount Isa, Port Pirie and Whyalla operations during 2025 have shifted spending toward upgrades of existing plants rather than full replacements.
Which equipment and services does this estimate include?
The estimate counts spending by industrial operators in Australia on equipment that removes dust, fumes, acid gases, nitrogen oxides and organic compounds from process off-gas and stack gas. This covers electrostatic precipitators, bag filters, cyclones, wet and dry scrubbers, thermal oxidizers and catalytic or non-catalytic nitrogen oxide control, together with replacement filter bags, spare parts, rebuilds and field service. Value is counted where the equipment is installed, across four zones that group the states and territories.
Western Australia is one zone, Eastern Australia covers New South Wales, Victoria and the Australian Capital Territory, Northern Australia covers Queensland and the Northern Territory, and Southern Australia covers South Australia and Tasmania. The estimate leaves out vehicle exhaust catalysts, building ventilation filters, personal respirators and carbon capture plants, because these serve different buyers and budgets from process gas cleaning.
Australia Gas Cleaning Technologies Market Insights
- The Australia gas cleaning technologies market is projected to grow from USD 249.7 million in 2026 to USD 407.9 million by 2035, a CAGR of 5.60%, as aging refineries and smelters upgrade emission plant.
- Western Australia held the largest regional share at 36.0% in 2025, reflecting the alumina refineries near Collie, Pinjarra and Wagerup and the state's large mineral processing base.
- Particulate control led solution types with 38.0% of 2025 value, because precipitators and bag filters guard almost every kiln, calciner, smelter and coal boiler in the country.
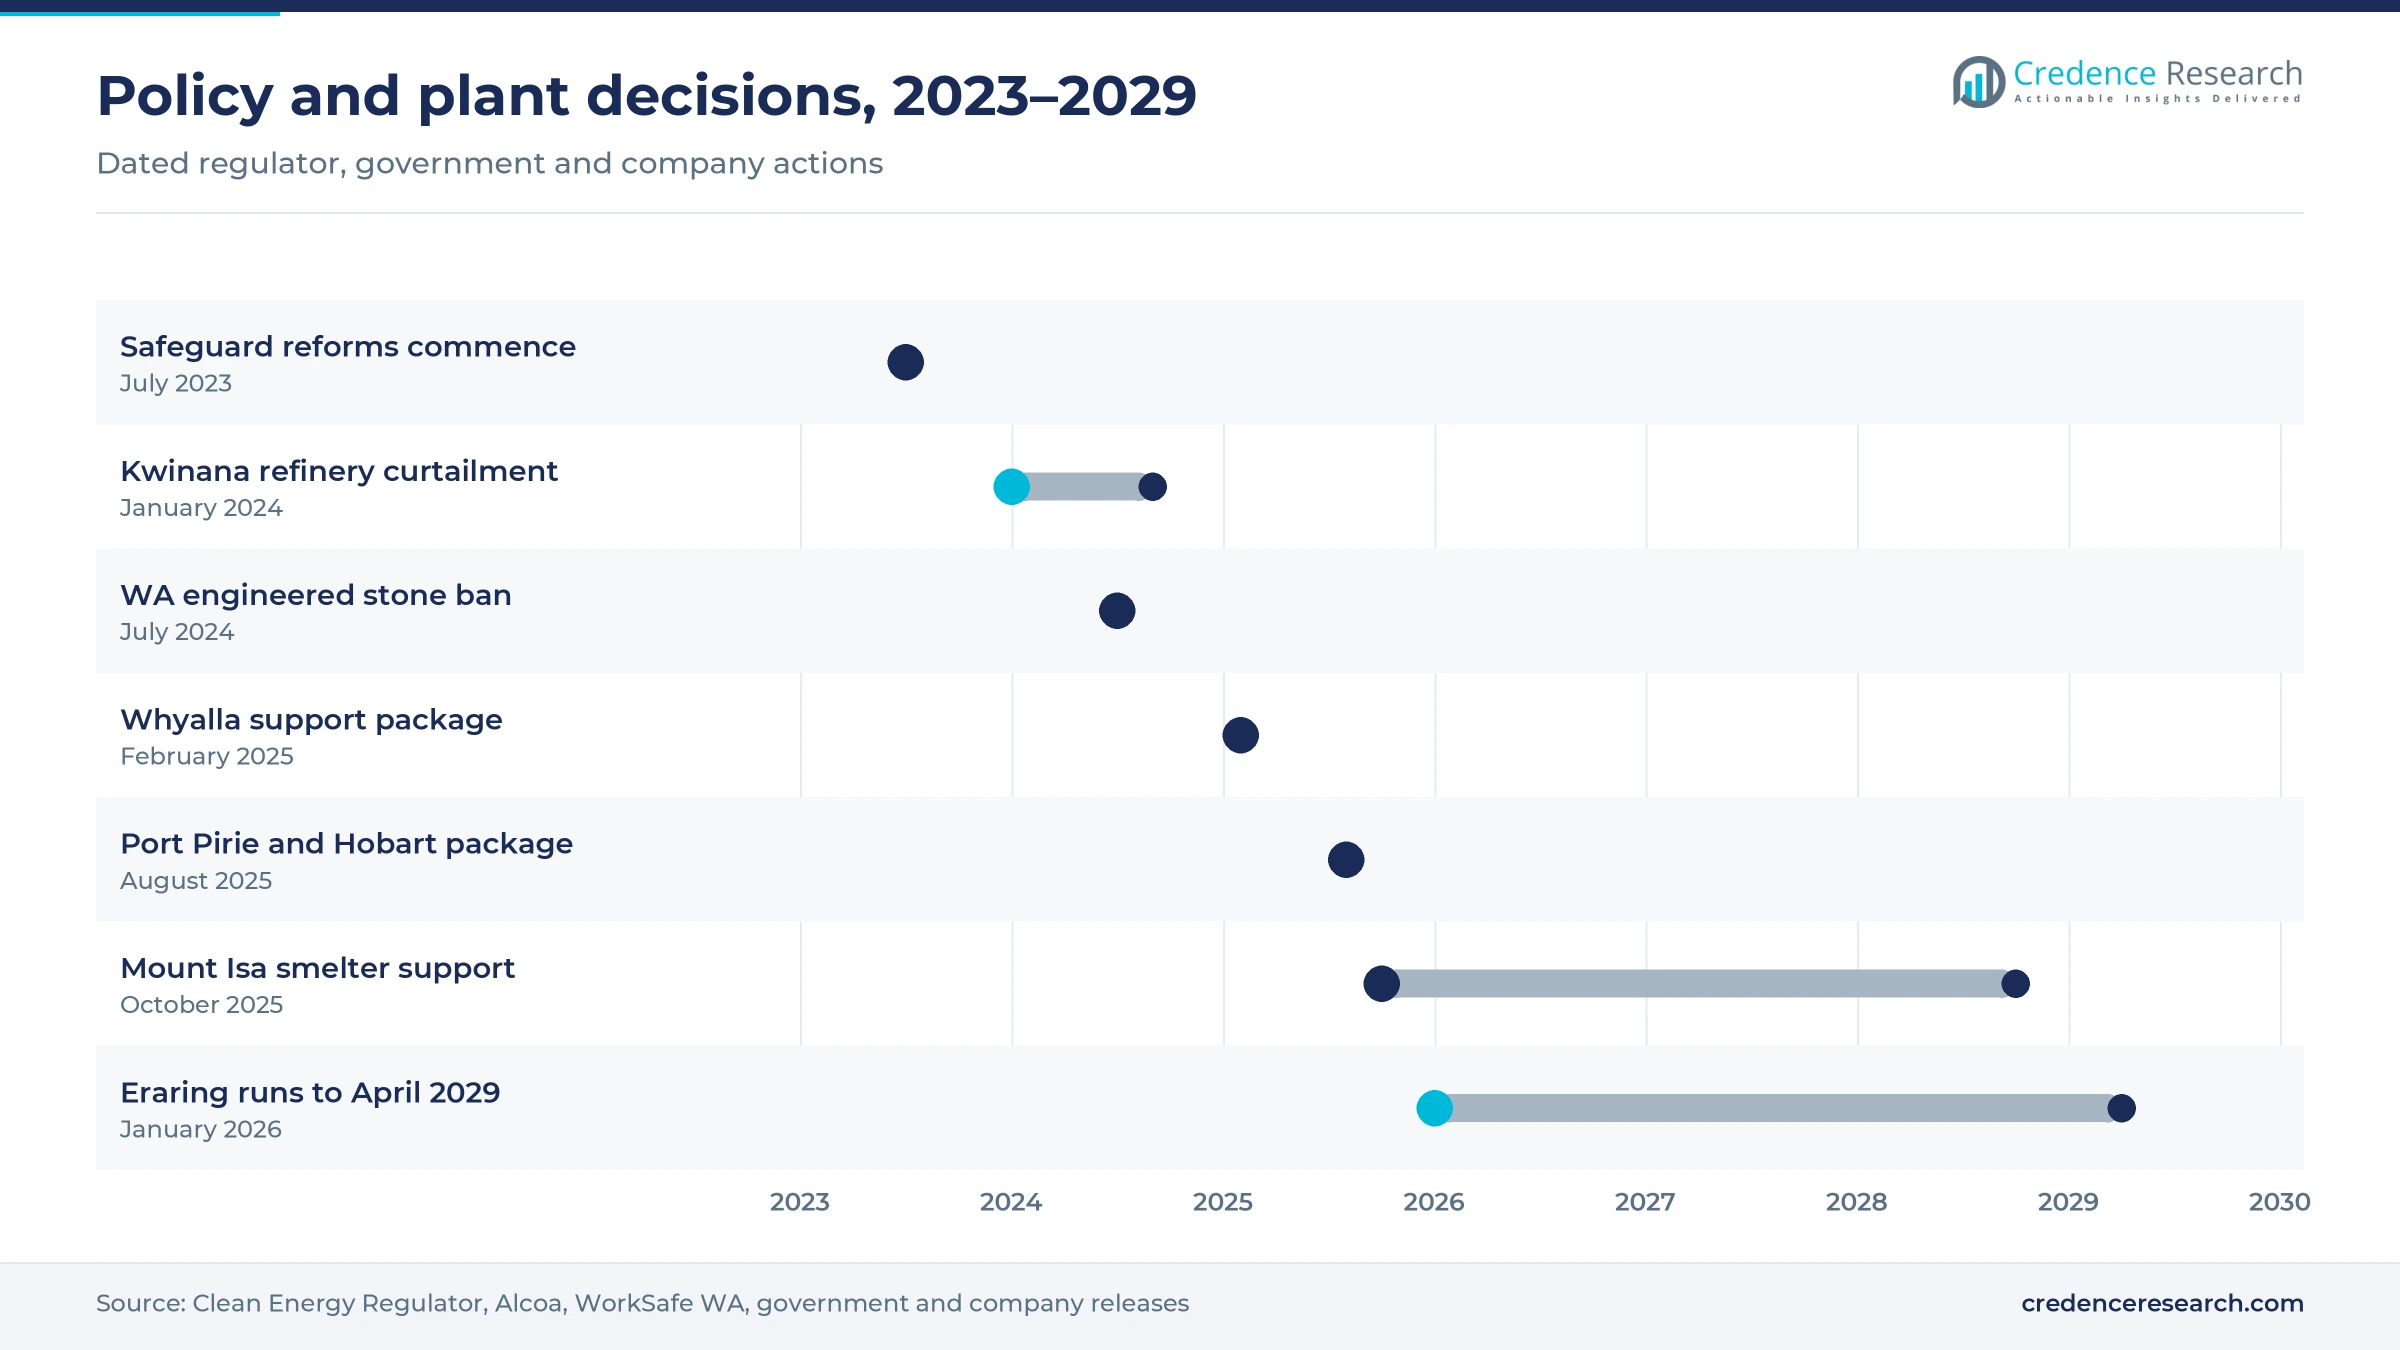
- Federal and Queensland governments agreed on Oct. 8, 2025, to fund three years of support that keeps the Mount Isa copper smelter and Townsville refinery operating.
- Total Air Pollution Control, Nederman MikroPul and Plastic Fabricators WA show how local design and fabrication remain central to scrubber and dust collector supply.
Particulate control holds the largest share of spend
Why does particulate control lead equipment spending?
Based on solution type, the market is categorized into Particulate Control, Gas Scrubbing, Nitrogen Oxides and Organic Gas Control, and Components and Integrated Support. Particulate Control led with 38.0% of 2025 value, because precipitators and bag filters sit on nearly every calciner, kiln and boiler. Nitrogen Oxides and Organic Gas Control grows fastest at 6.42% a year, as energy-from-waste plants and chemical sites install selective non-catalytic reduction and thermal oxidizers.
Which industries buy the most gas cleaning equipment?
Based on end-use industry, the market is categorized into Mining and Mineral Processing, Alumina and Aluminium, Power Generation and Process Manufacturing and Energy. Mining and Mineral Processing led with 34.0% of 2025 value, because crushing, roasting and refining plants run dust and acid gas control across many sites. Process Manufacturing and Energy grows fastest at 6.25% a year, as waste-to-energy and chemical plants add complete flue gas treatment trains.
Why does installed-base work outweigh new projects?
Based on application, the market is categorized into Greenfield Emissions Control, Brownfield Process Upgrades and Installed-Base Reliability. Installed-Base Reliability led with 40.0% of 2025 value, because filter bags, electrodes and fans on older plants need regular replacement to stay within license limits. Greenfield Emissions Control grows fastest at 6.13% a year, as new refineries, rare earth plants and waste-to-energy facilities specify emission control from the design stage.
How do operators place gas cleaning contracts?
Based on sales channel, the market is categorized into Direct Supplier Contracts, Engineering Procurement and Construction Contracts, Specialist Integrator Contracts and Authorised Distribution Contracts. Direct Supplier Contracts led with 38.0% of 2025 value, because large operators buy precipitator rebuilds and filter systems straight from equipment makers. Specialist Integrator Contracts grow fastest at 5.97% a year, as smaller plants hand complete design, fabrication and installation to one local firm.
| Segment Group | Leading Sub-segment | Share, 2025 | Fastest-growing Sub-segment | CAGR, 2026–2035 |
|---|---|---|---|---|
| By Solution Type | Particulate Control | 38.0% | Nitrogen Oxides and Organic Gas Control | 6.42% |
| By End-Use Industry | Mining and Mineral Processing | 34.0% | Process Manufacturing and Energy | 6.25% |
| By Application | Installed-Base Reliability | 40.0% | Greenfield Emissions Control | 6.13% |
| By Sales Channel | Direct Supplier Contracts | 38.0% | Specialist Integrator Contracts | 5.97% |
Request a Free Sample
Fill in your details and we'll send you a free sample report.
- Sample data tables & charts
- Research methodology
Process limits and aging plant drive equipment orders
Process-specific limits push upgrades at older plants
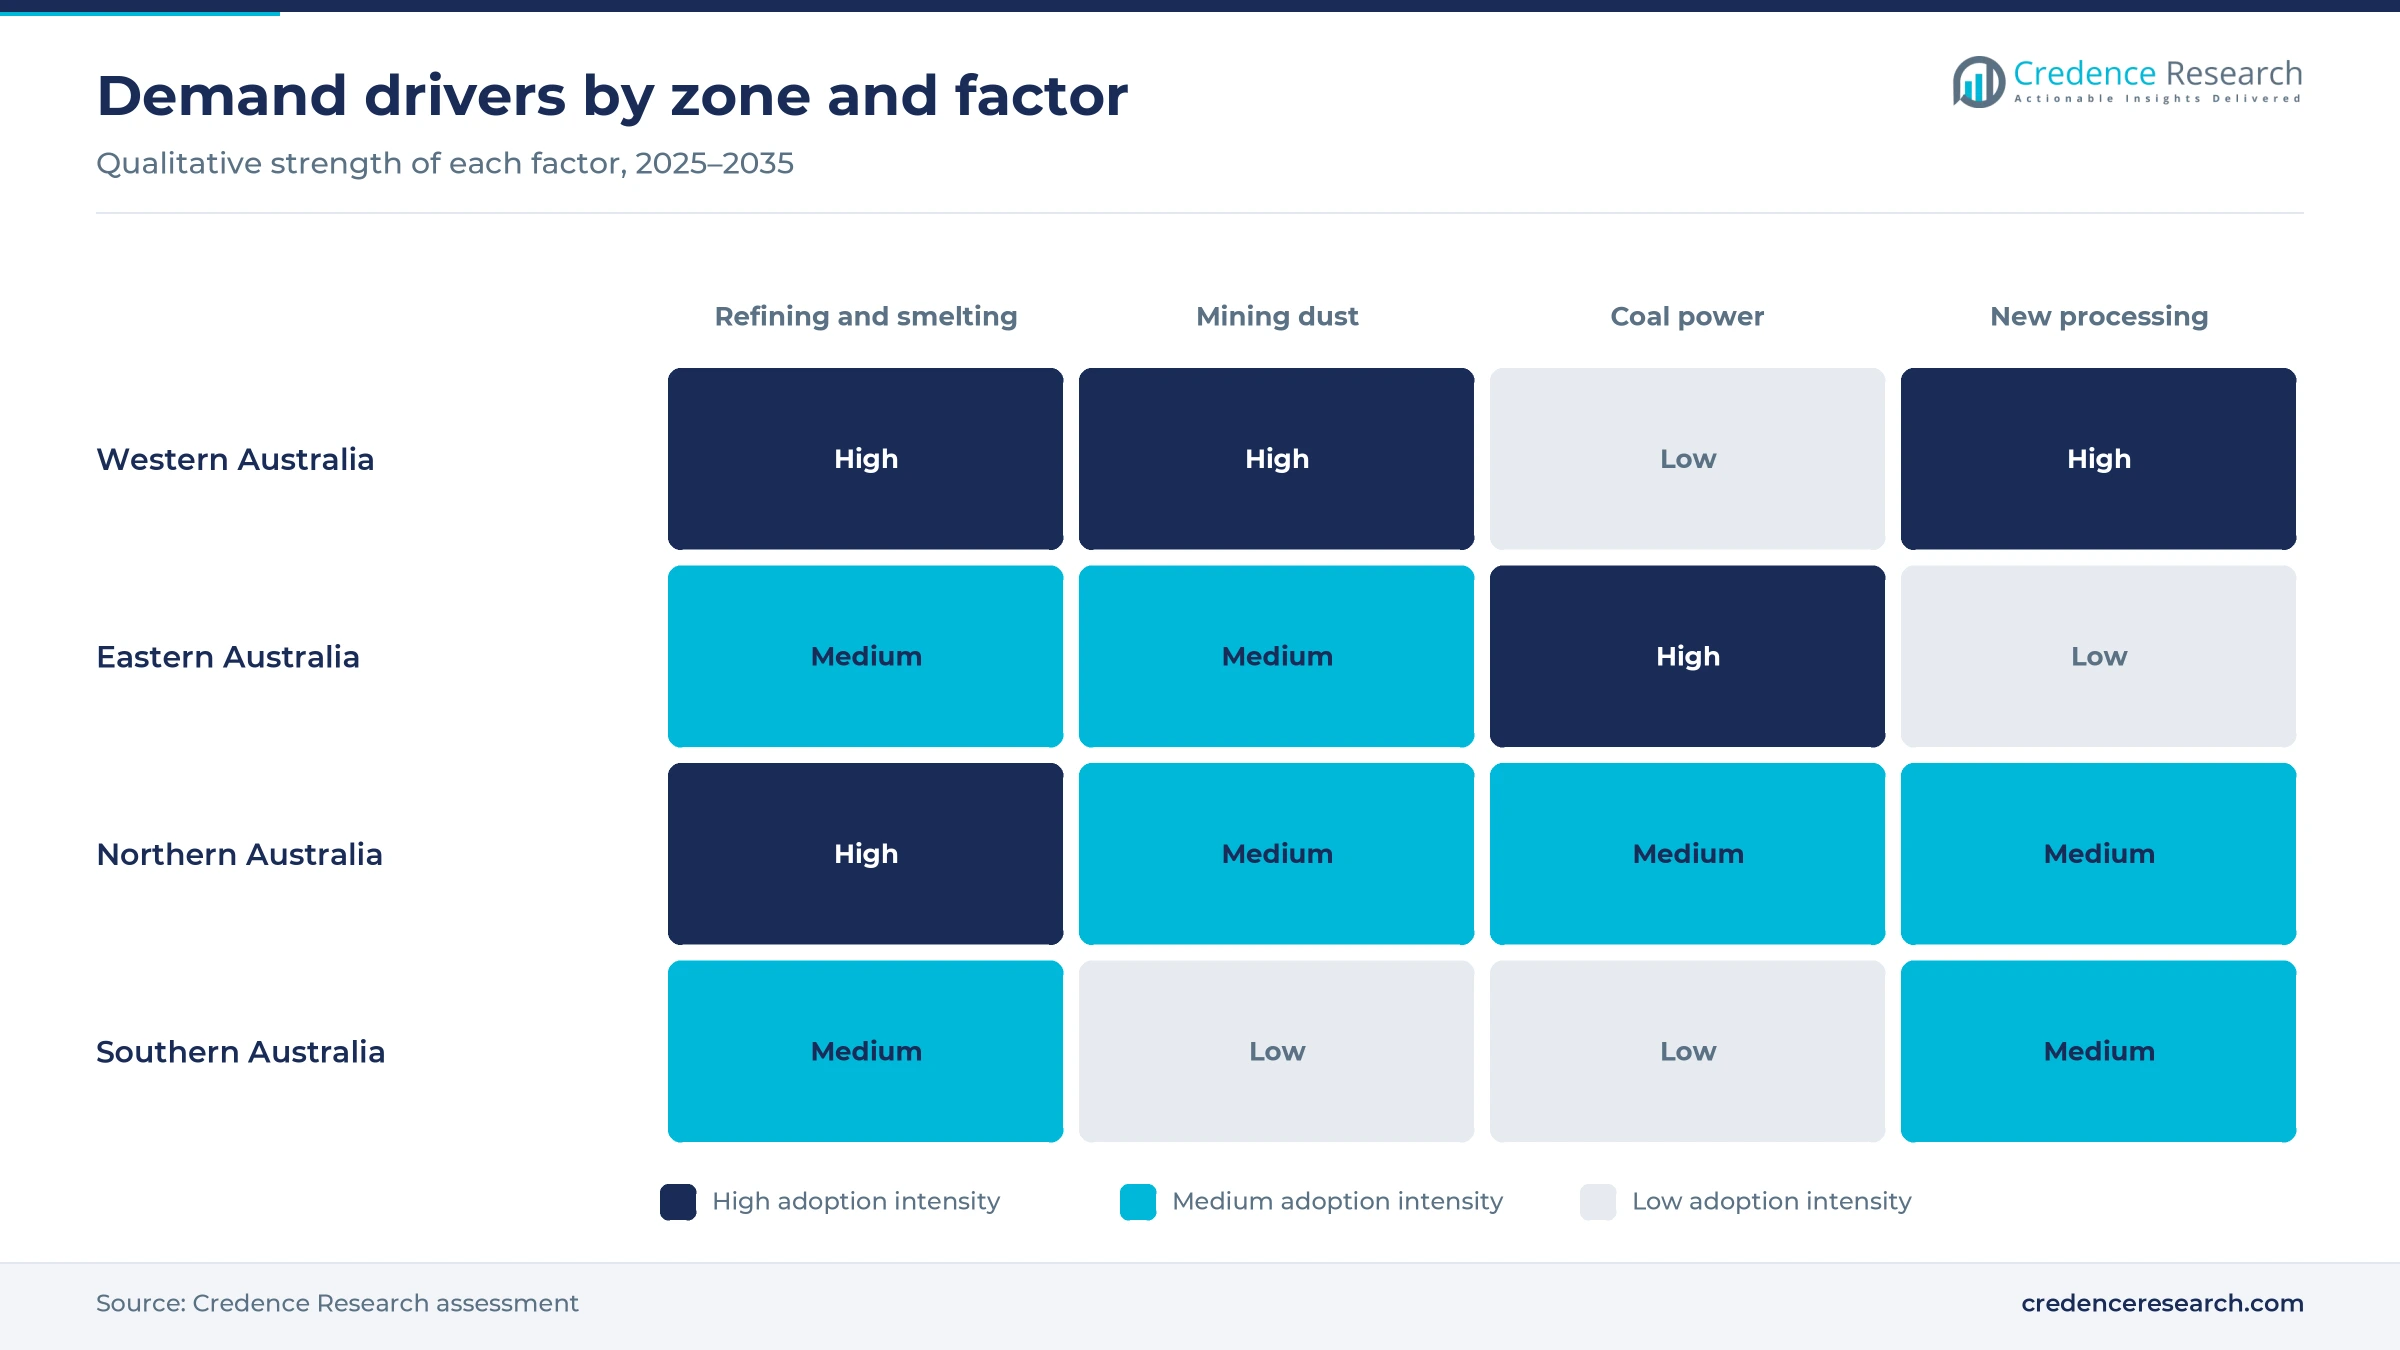
Environmental regulators set emission limits plant by plant, so each refinery, smelter and kiln needs gas cleaning matched to its own process. The NSW Protection of the Environment Operations (Clean Air) Regulation 2022 came into force on Dec. 16, 2022, and it keeps aging plant on a transition to tighter air emission standards, according to the NSW Environment Protection Authority. The national ambient air measure also set goals of 7 and 20 micrograms per cubic meter for annual and daily fine particles by 2025, according to the National Environment Protection Council. Because these goals limit what plants near towns can release, operators fit better filters and scrubbers rather than accept tighter license conditions. As a result, particulate control remains the largest solution type in the Australia gas cleaning technologies market.
Aging precipitators and filters need replacement and service
Much of the installed gas cleaning base was built with refineries, smelters and coal plants that have run for decades, so replacement and service work is the largest source of spending. Glencore's Mount Isa copper smelter is about 60 years old, and federal and Queensland governments agreed in October 2025 to provide up to A$600 million over three years to keep it running, according to Mining Weekly. In 2017, a worn precipitator at a large Australian copper smelter was replaced with a 350-ton unit that removes about 96% of particulates, according to GE. Origin Energy also said in January 2026 that its 2,880 MW Eraring coal plant will run until April 2029. These decisions explain why installed-base reliability held the largest application share, 40.0% of 2025 value.
Alumina, critical minerals and new plants add projects
New processing capacity creates greenfield demand, although investment is selective and concentrated in a few resource chains. Australia produced an estimated 17.0 million tons of alumina in 2025, out of a world total of 150 million tons, according to the U.S. Geological Survey. The same source notes that an expanded bauxite mine near Boddington began operating in June 2025 to supply a 4.7-million-ton-a-year refinery near Collie. Rare earth refineries also need off-gas treatment, and Total Air Pollution Control won a June 2022 contract for caustic gas scrubbers on the acid-bake rotary kiln at the Yangibana project in Western Australia, according to The Environmental Group. Greenfield emissions control therefore has the fastest application CAGR, at 6.13% a year.
Energy-from-waste plants add acid gas and NOx control
Energy-from-waste plants in Perth create a new class of buyer that needs acid gas, dioxin and nitrogen oxide treatment from the first day of operation. The East Rockingham facility is designed to burn 300,000 tons of municipal and industrial waste a year, and it cleans flue gas with hydrated lime, activated carbon and selective non-catalytic reduction, according to Kanadevia Inova. The Clean Energy Finance Corporation said in October 2018 that the Kwinana project would take about 400,000 tons of residual waste a year and generate 36 MW. Because each plant needs a full treatment train, nitrogen oxides and organic gas control grows fastest among solution types at 6.42% a year, while process manufacturing and energy users grow at 6.25%.
Rescue packages and carbon baselines reshape projects
Rescue funding shifts spend to smelter upgrades
Public support for struggling metal plants is shifting spending from new builds toward upgrades that keep old furnaces compliant and running. On Feb. 20, 2025, the Australian and South Australian governments announced an A$2.4 billion package for the Whyalla steelworks, including A$32.6 million for infrastructure upgrades, according to the South Australian Department for Energy and Mining. On Aug. 5, 2025, an A$135 million package for Nyrstar's Port Pirie and Hobart smelters added funds for a major maintenance project and an antimony pilot plant, according to the federal industry minister. Federal and Queensland support for the Mount Isa copper smelter followed in October 2025. Each of these programs extends the life of existing stacks, which favors brownfield process upgrades and precipitator rebuilds over new plant.
Carbon baselines now sit beside air quality limits
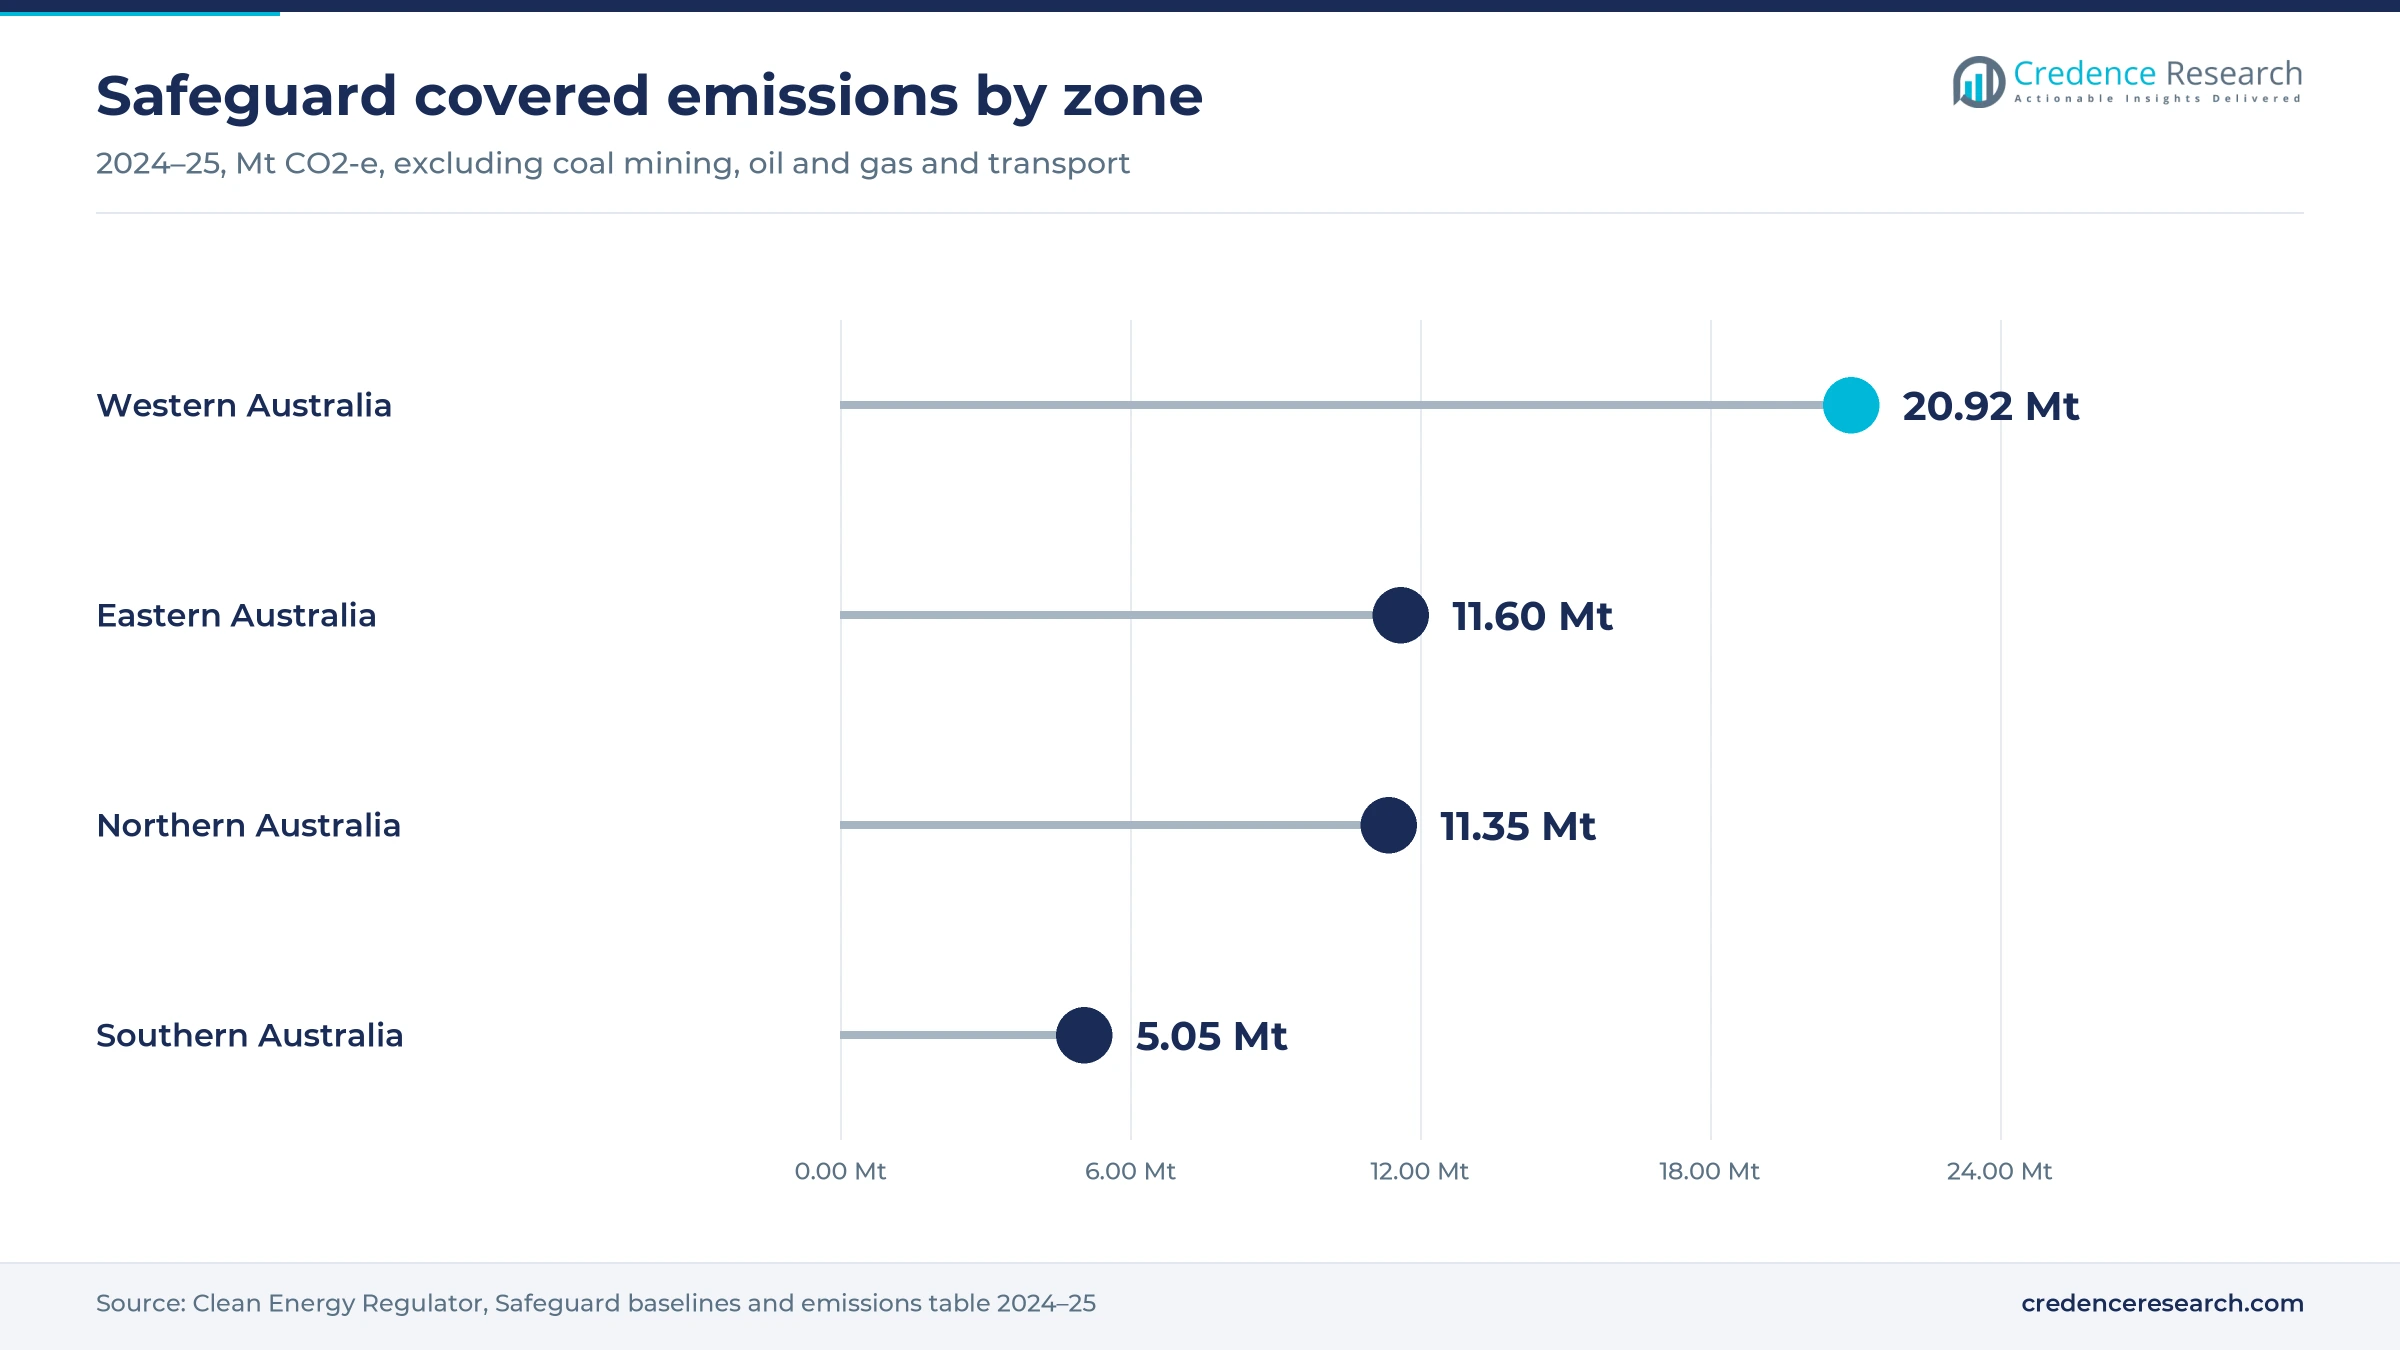
Carbon rules now sit beside air quality limits, so large emitters plan gas cleaning changes together with energy and process changes. The reformed Safeguard Mechanism commenced on July 1, 2023, and facility baselines decline at a default rate of 4.9% a year, according to the Clean Energy Regulator. The same regulator reports that 208 facilities were covered in 2024–25, with covered emissions of 132.8 Mt CO2-e, down 2.3% from the previous year, in its Safeguard data insights. The Australian Energy Council reported in April 2024 that coal plant nitrogen oxide, sulfur dioxide and PM10 emissions all fell year on year in the latest pollutant inventory. These shifts change gas volumes and composition, so scrubbers and filters are resized during decarbonization projects.
Silica rules widen workplace dust capture demand
Tighter silica rules open a market for dust collection at quarries, tunnels and fabrication shops that sit outside licensed stack controls. Engineered stone was banned in Western Australia from July 1, 2024, and stronger regulation of all crystalline silica substances started on Sept. 1, 2024, according to WorkSafe WA. The regulator names on-tool extraction and local exhaust ventilation among the recognized dust controls. Grydale supplies mobile dust extractors for tunneling, mining and quarrying, and its units often work beside underground mining equipment in development headings. Camfil Australia released its Gold Series III dust collector on Nov. 11, 2025, for mining, chemical and metalworking dust.
Pilbara ore sheds and ports need enclosed dust control
Iron ore handling in the Pilbara offers an opening for enclosed storage and bag filter systems that meet local dust conditions. Luehr Filter supplied large horizontal reverse air bag dust collection systems for the Onslow Iron ore storage shed to meet EPA dust emission requirements, according to Australian Mining Review in December 2025. In Port Hedland, a dust taskforce brings together WA Health, the town, the port authority and iron ore exporters, according to the WA Department of Health. Western Australia also hosts the Worsley, Wagerup and Pinjarra refineries, which reported some of the largest covered emissions in 2024–25, with Worsley at 3.22 Mt CO2-e and Wagerup at 1.31 Mt, according to the Clean Energy Regulator's baselines and emissions table. These sites keep dust and gas control demand steady statewide.
Closures, coal exits and remote sites limit growth
Plant closures remove installed-base demand
When an old refinery or smelter closes, its precipitators, filters and scrubbers stop generating parts and service orders. Alcoa announced on Jan. 8, 2024, that it would fully curtail its 2.2-million-ton Kwinana alumina refinery, with production ending in the third quarter of 2024. Nyrstar's Port Pirie and Hobart smelters were also placed under strategic review in 2025 before public support arrived. Suppliers that depend on a few large sites therefore face sudden drops in work.
Coal plant retirements shrink power generation demand
Coal-fired stations carry some of the largest precipitator and fabric filter installations, yet most face retirement within the forecast period. Owners hesitate to fund major rebuilds when closure dates are close, even when those dates move, as Eraring's did in January 2026. As a result, power generation is the slowest-growing end use, and suppliers must replace this work with orders from mining, refining and waste-to-energy plants over time.
Remote sites raise installation and service costs
Many processing plants sit in the Pilbara, the Goldfields, Gladstone or Mount Isa, far from fabrication shops and skilled crews. Shipping large ductwork and filter housings, flying in crews and working around shutdown windows raise the installed cost of each project. Smaller operators may then delay upgrades or choose cheaper partial fixes. Suppliers respond with modular designs, local partners and planned outage service contracts that spread these costs over several years.
Custom process designs lengthen sales cycles
Every kiln, calciner and furnace produces a different off-gas, so suppliers must test, model and guarantee each design before an order is placed. Rare earth plants, such as the acid-bake kiln at Yangibana, release acidic gases that need several conditioning and treatment stages. These steps lengthen tender periods and raise engineering costs for suppliers. Firms with test data and local reference sites win more often, while newcomers struggle to prove performance.
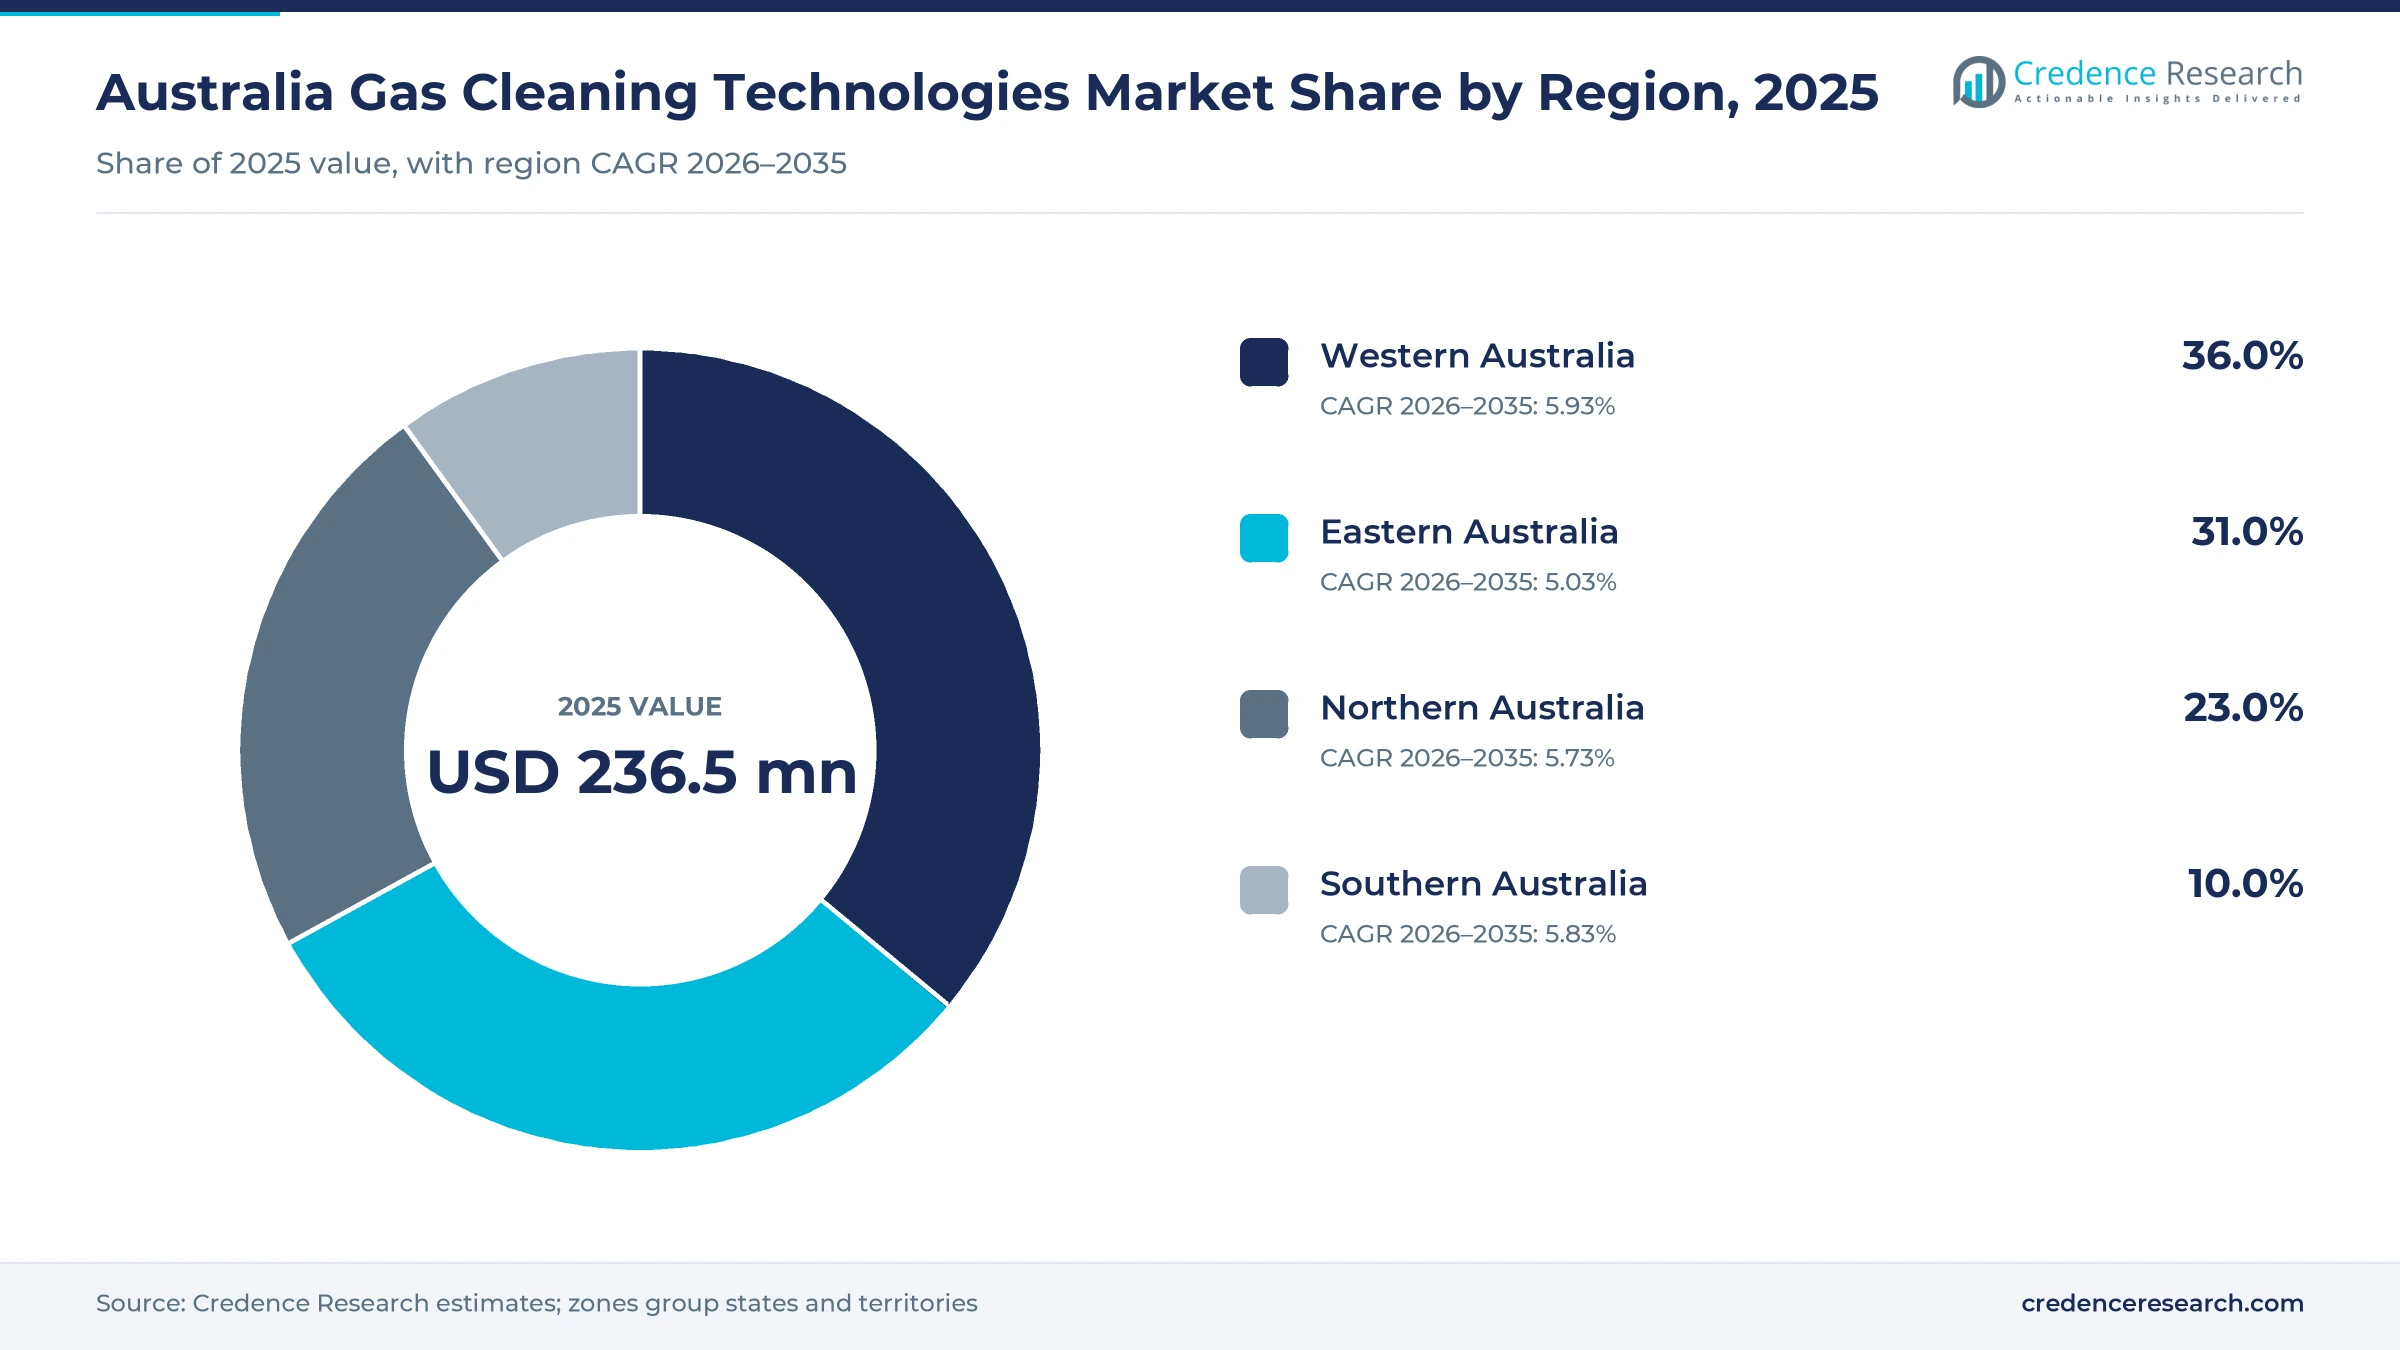
Western Australia leads on refining and mining plants
| Region | Value, 2025 (USD million) | Share, 2025 | CAGR, 2026–2035 |
|---|---|---|---|
| Western Australia | 85.1 | 36.0% | 5.93% |
| Eastern Australia | 73.3 | 31.0% | 5.03% |
| Northern Australia | 54.4 | 23.0% | 5.73% |
| Southern Australia | 23.6 | 10.0% | 5.83% |
Western Australia leads on alumina and mineral processing
Western Australia held the largest regional share of the Australia gas cleaning technologies market in 2025 and grows fastest at 5.93% a year. Clean Energy Regulator data for 2024–25 list the Worsley refinery at 3.22 Mt CO2-e and the Wagerup and Pinjarra refineries at 1.31 Mt and 1.27 Mt, which signals large calciner and boiler gas flows. New waste-to-energy plants near Perth add acid gas and nitrogen oxide control. Local firms such as Plastic Fabricators WA in Landsdale build gas scrubbing systems and odor control units for mining and processing clients.
Eastern Australia holds coal power and smelter demand
Eastern Australia held a 31.0% share of 2025 value and grows at 5.03% a year, the slowest regional rate. The zone covers New South Wales, Victoria and the Australian Capital Territory, where the Tomago and Portland smelters reported covered emissions of 1.09 Mt and 0.60 Mt in 2024–25. The NSW Clean Air Regulation keeps aging plant on a path to tighter standards. Growth still trails the national rate because coal stations such as Eraring are set to close within the forecast period.
Northern Australia grows on Gladstone and Mount Isa
Northern Australia held a 23.0% share of 2025 value and grows at 5.73% a year, close to the national rate. The zone covers Queensland and the Northern Territory, and Gladstone is its industrial hub, where Queensland Alumina and Rio Tinto Yarwun reported covered emissions of 3.17 Mt and 2.05 Mt in 2024–25. Boyne smelter reported 0.94 Mt of covered emissions in the same reporting year. The Mount Isa support package keeps the copper smelter and the Townsville refinery operating for three more years, which sustains service and upgrade work in Queensland.
Southern Australia gains from smelter support packages
Southern Australia held a 10.0% share of 2025 value and grows at 5.83% a year, slightly above the national rate. The zone covers South Australia and Tasmania, where Nyrstar's Port Pirie facility reported covered emissions of 0.43 Mt in 2024–25 and the Bell Bay smelter reported 0.34 Mt. Public support for Port Pirie, Hobart and Whyalla during 2025 funds maintenance and upgrades, which favors precipitator rebuilds, scrubber refurbishment and filter replacement at these older plants.
Smelter support and new equipment since 2025
| Development | Status and market relevance |
|---|---|
| In February 2025, the Australian and South Australian governments announced an A$2.4 billion support package for the Whyalla steelworks. | Active; includes infrastructure upgrades at an aging integrated plant |
| In August 2025, governments agreed an A$135 million package for Nyrstar's Port Pirie and Hobart smelters. | Active; funds a major maintenance project and an antimony pilot plant |
| In October 2025, federal and Queensland governments committed up to A$600 million to keep the Mount Isa copper smelter operating. | Active; three annual installments support continued smelter operation |
| In November 2025, Camfil Australia released its Gold Series III dust collector for mining, chemical and metalworking dust. | Launched; targets hazardous and combustible dust duties |
| In January 2026, Origin Energy said its Eraring coal power station will run until April 2029. | Extended; keeps a large installed base of emission plant in service |
Precipitators, bag filters and scrubbers do the work
- Electrostatic precipitators charge dust and collect it on plates, and precipitator units remain the standard on calciners, smelters and coal boilers.
- Bag filters catch fine dust in fabric, with pulse jet and horizontal reverse air designs used at crushers, kilns and ore sheds.
- Wet and dry scrubbers remove sulfur dioxide and acid gases with caustic, lime or dual alkali chemistry at smelters and rare earth kilns.
- Nitrogen oxide reduction injects ammonia or urea into hot gas, and catalytic reduction systems are used where lower outlet limits apply.
Need a Custom Version of This Report?
Tailor the scope, geography, or segments to your exact requirements.
- Custom geography or segment scope
- Direct access to our analyst team
Local fabricators compete with global filter makers
Competition centers on process know-how, local fabrication and the ability to service equipment at remote sites, rather than on price alone. Total Air Pollution Control, part of The Environmental Group, designs scrubbing and dust systems for mining and rare earth clients and won an off-gas scrubbing contract for a refinery in Angola in April 2026. Nederman MikroPul runs its Asia Pacific hub from Bayswater in Victoria and offers baghouses, cyclones and wet scrubbers. Fowlerex Technologies in Wetherill Park builds precipitators, scrubbers, baghouses and thermal oxidizers. Luehr Filter serves mine sites with bag filter systems, while Camfil Australia and Grydale supply standard and mobile dust collectors. Global makers supply the core of large air pollution control systems, while local firms win fabrication and service work.
Companies profiled and their roles in this market
| Company | Type | Role in the market |
|---|---|---|
| Total Air Pollution Control | Design and supply contractor | Scrubbing and dust systems for mining and rare earth plants |
| Nederman MikroPul | Equipment maker | Bayswater hub supplying baghouses, cyclones and wet scrubbers |
| Fowlerex Technologies | Fabricator and installer | Wetherill Park maker of precipitators, scrubbers and oxidizers |
| Luehr Filter Australia | Bag filter specialist | Horizontal reverse air filters for the Onslow Iron ore shed |
| Camfil Air Pollution Control | Dust collector maker | Released Gold Series III collector in Australia in 2025 |
| Plastic Fabricators WA | Thermoplastic fabricator | Landsdale maker of gas scrubbers and odor control units |
| Grydale | Mobile dust extraction supplier | Mobile extractors for tunneling, mining and quarrying |
| GEA Emission Control | Equipment maker | Global supplier of gas scrubbers and other emission control systems |
| Donaldson Industrial Air Filtration | Filter maker | Global filtration group with a filter manufacturing site at Wyong in New South Wales |
| ANDRITZ Clean Air Technologies | Precipitator technology owner | Holds the former GE air quality portfolio and SIR power supplies |
Credence Research view on industrial emission control
Credence Research's view is that the Australia gas cleaning technologies market will grow at a steady pace because most spending protects plants that already exist. Public rescue packages for smelters in Queensland, South Australia and Tasmania confirm that governments want these plants to keep running, which keeps rebuild and service work flowing. New refineries, rare earth plants and waste-to-energy facilities add higher-value greenfield orders, mostly in Western Australia. Suppliers with local fabrication, test data for difficult gases and remote service crews are best placed, while coal plant work fades as retirements approach.
How the zone and segment estimates were built
The report uses 2025 as the base year on a calendar basis, and market values come from the Credence Research model. That model draws on Clean Energy Regulator facility emissions data, U.S. Geological Survey production data, state environment regulator pages, national air quality measures, government funding releases, company releases and stock exchange announcements. Zone shares and segment splits are Credence Research estimates, with zone shares guided by Safeguard covered emissions by state and the location of coal generation. Sources used are government pages, agency data, company filings and trade media, and no interviews or surveys were used.
Brownfield upgrades and new processing to 2035
The Australia gas cleaning technologies market is expected to reach USD 407.9 million by 2035, rising at a 5.60% CAGR during 2026–2035, as operators rebuild aging precipitators and add scrubbers to new processing plants. Particulate control keeps the largest share, while nitrogen oxide and organic gas control grows fastest with waste-to-energy and chemical plants. Western Australia stays the largest and fastest-growing zone, as refining and new processing plants keep adding projects. Coal retirements will reduce power station work, yet refining, smelting and mineral processing should keep demand resilient through the forecast period.
Frequently Asked Questions
How big is the Australia gas cleaning technologies market?
Which solution type holds the largest share?
Which region holds the largest share of value?
Which solution type grows fastest?
How do smelter support packages affect demand?
Why does installed-base reliability lead applications?
How does the Safeguard Mechanism relate to gas cleaning?
Which companies are active in the Australia gas cleaning technologies market?
Table of Content
Chapter 1 Market Segmentation
- 1.1 Segmentation Framework
- 1.1.1 Product and Service Classification
- 1.1.2 Application and End-Use Classification
- 1.1.3 Technology and Solution Classification
- 1.1.4 Customer and Distribution Channel Classification
- 1.1.5 Geographic Segmentation
- 1.1.6 Market Segment Definitions and Boundaries
- 1.2 By Solution Type
- 1.2.1 Particulate Control
- 1.2.2 Gas Scrubbing
- 1.2.3 Nitrogen Oxides and Organic Gas Control
- 1.2.4 Components and Integrated Support
- 1.3 By End-Use Industry
- 1.3.1 Mining and Mineral Processing
- 1.3.2 Alumina and Aluminium
- 1.3.3 Power Generation
- 1.3.4 Process Manufacturing and Energy
- 1.4 By Application
- 1.4.1 Greenfield Emissions Control
- 1.4.2 Brownfield Process Upgrades
- 1.4.3 Installed-Base Reliability
- 1.5 By Sales Channel
- 1.5.1 Direct Supplier Contracts
- 1.5.2 Engineering Procurement and Construction Contracts
- 1.5.3 Specialist Integrator Contracts
- 1.5.4 Authorised Distribution Contracts
Chapter 2 Introduction
- 2.1 Report Objectives and Scope
- 2.2 Product Definition and Industry Terminology
- 2.3 Market Inclusions and Exclusions
- 2.4 Research Process
- 2.4.1 Primary Research and Expert Interviews
- 2.4.2 Secondary Research and Source Review
- 2.4.3 Top-Down and Bottom-Up Estimation
- 2.4.4 Data Triangulation and Verification
- 2.5 Market Size Measurement Basis
- 2.5.1 2025: USD 236.5 million → 2035: USD 407.9 million
- 2.6 Historical and Forecast Reference Periods
- 2.6.1 Historical Period: 2018-2025
- 2.6.2 Base Year: 2025
- 2.6.3 Forecast Period: 2025-2035
- 2.7 Research Assumptions and Limitations
Chapter 3 Executive Summary
- 3.1 Market Snapshot and Key Findings
- 3.2 Base-Year Market Size, 2025
- 3.3 Forecast Market Size, 2035
- 3.4 Revenue and Volume Growth Outlook
- 3.5 Key Demand and Supply Indicators
- 3.6 Leading Market Segments
- 3.7 Fastest-Growing Market Opportunities
- 3.8 Regional Performance Highlights
- 3.9 Technology and Industry Transformation
- 3.10 Competitive Landscape Summary
- 3.11 Analyst View and Strategic Implications
Chapter 4 Australia Gas Cleaning Technologies Market Trends and Developments
- 4.1 Historical Industry Development, 2018-2025
- 4.2 Recent Market Trends and Developments
- 4.3 Demand and Customer Behavior Trends
- 4.4 Technology and Product Innovation
- 4.5 Artificial Intelligence, Automation and Digitalization
- 4.6 Local Manufacturing and Supply Chain Realignment
- 4.7 Industry Partnerships, Mergers and Acquisitions
- 4.8 Sustainability and Circular Economy Developments
- 4.9 Government and Private Sector Investment Trends
- 4.10 Emerging Business Models and Commercialization
- 4.11 Industry Developments and Announcements
Chapter 5 Australia Gas Cleaning Technologies Market Production, Supply and Demand Analysis
- 5.1 Demand Trend and Consumption Analysis, 2018-2025
- 5.2 Demand Forecast, 2025-2035
- 5.3 Production and Output Trend, 2018-2025
- 5.4 Production and Output Forecast, 2025-2035
- 5.5 Installed Capacity and Capacity Utilization
- 5.6 Company-Wise Production Plants and Statistics
- 5.6.1 Installed Production Capacity
- 5.6.2 Actual Production
- 5.6.3 Planned Capacity and Expansion Targets
- 5.7 Supply Chain Structure and Procurement Trends
- 5.8 Supply-Demand Gap and Bottlenecks
- 5.9 Import Dependence and Sourcing Structure
- 5.10 Contract Manufacturing and Outsourcing
- 5.11 Regional Supply and Demand Concentration
Chapter 6 Australia Gas Cleaning Technologies Market Pricing Analysis
- 6.1 Pricing Structure and Measurement
- 6.2 Historical Pricing Trends, 2018-2025
- 6.3 Pricing Outlook, 2025-2035
- 6.4 Average Selling Price and Unit Economics
- 6.5 Pricing by Product and Market Segment
- 6.6 Geographic Pricing Differences
- 6.7 Key Input, Energy, Labor and Logistics Costs
- 6.8 Contract Pricing and Purchasing Models
- 6.9 Pricing Sensitivity and Competitive Positioning
- 6.10 Price, Margin and Profitability Implications
Chapter 7 Australia Gas Cleaning Technologies Market Dynamics
- 7.1 Market Growth Drivers
- 7.1.1 Demand-Side Drivers
- 7.1.2 Technology and Innovation Drivers
- 7.1.3 Infrastructure and Investment Drivers
- 7.1.4 Regulatory and Policy Drivers
- 7.2 Market Restraints
- 7.2.1 Cost and Affordability Constraints
- 7.2.2 Technology and Adoption Barriers
- 7.2.3 Supply Chain and Operational Constraints
- 7.3 Market Challenges
- 7.3.1 Competitive Pressure and Margin Erosion
- 7.3.2 Skills, Infrastructure and Implementation Gaps
- 7.4 Emerging Market Opportunities
- 7.5 Market Dynamics Impact and Time-Horizon Assessment
Chapter 8 Australia Gas Cleaning Technologies Value Chain Analysis
- 8.1 Industry Value Chain Overview
- 8.2 Upstream Suppliers and Critical Inputs
- 8.3 Technology and Component Providers
- 8.4 Manufacturing or Service Delivery
- 8.5 Distribution, Channel Partners and Integrators
- 8.6 Downstream Applications and End Users
- 8.7 Value Addition and Profit Pools
- 8.8 Vertical Integration and Outsourcing
- 8.9 Supplier Concentration and Risk
- 8.10 Supply Chain Localization and Resilience
Chapter 9 Australia Gas Cleaning Technologies Market Regulations and Policies
- 9.1 Relevant Laws, Standards and Compliance Frameworks
- 9.2 Product, Service, Safety and Quality Requirements
- 9.3 Government Policies, Incentives and Subsidies
- 9.4 Imports, Exports and Trade Barriers
- 9.5 Public Procurement and Local Content Requirements
- 9.6 Environmental and Sustainability Compliance
- 9.7 Upcoming Policy Changes and Market Implications
Chapter 10 Australia Gas Cleaning Technologies Market Hotspots and Opportunities
- 10.1 Market Opportunity Mapping and Growth Hotspots
- 10.2 High-Growth Applications and Customer Groups
- 10.3 Underserved Markets and White-Space Opportunities
- 10.4 Emerging Technology and Product Opportunities
- 10.5 New Capacity and Investment Hotspots
- 10.6 Market Entry and Expansion Opportunities
- 10.7 Distribution and Partnership Opportunities
- 10.8 Near-Term and Long-Term Commercial Potential
- 10.9 Opportunity Attractiveness and Execution Risks
Chapter 11 Australia Gas Cleaning Technologies Market Outlook, 2025-2035
- 11.1 Market Size and Analysis
- 11.1.1 Revenue (Market Measurement: 2025: USD 236.5 million → 2035: USD 407.9 million)
- 11.1.2 Market Volume and Quantity Sold
- 11.1.3 Historical Market Size, 2018-2025
- 11.1.4 Base-Year Market Size, 2025
- 11.2 Market Forecast, 2025-2035
- 11.2.1 Revenue Forecast to 2035
- 11.2.2 Volume Forecast to 2035
- 11.2.3 CAGR and Year-on-Year Growth
- 11.2.4 Incremental Revenue Opportunity
- 11.3 Forecast Assumptions and Scenario Analysis
- 11.3.1 Base-Case Forecast
- 11.3.2 Optimistic and Conservative Scenarios
- 11.3.3 Technology, Pricing and Policy Sensitivities
- 11.4 Market Attractiveness and Growth Outlook
Chapter 12 Australia Gas Cleaning Technologies Market Segmentation and Outlook
- 12.1 Segmentation Summary and Market Shares, 2025
- 12.2 Largest and Fastest-Growing Segments
- 12.3 By Solution Type - Market Size and Forecast, 2025-2035
- 12.3.1 Segment Definition and Scope
- 12.3.2 Historical Market Size, 2018-2025
- 12.3.3 Revenue Forecast, 2025-2035
- 12.3.4 Volume Forecast, 2025-2035
- 12.3.5 Base-Year Market Share, 2025
- 12.3.6 Segment CAGR and Growth Drivers
- 12.3.7 Subsegment Market Size and Forecast
- 12.3.7.1 Particulate Control
- 12.3.7.2 Gas Scrubbing
- 12.3.7.3 Nitrogen Oxides and Organic Gas Control
- 12.3.7.4 Components and Integrated Support
- 12.3.8 Subsegment Pricing and Adoption Trends
- 12.3.9 Leading Suppliers and Competition
- 12.3.10 Regional Demand and Opportunities
- 12.4 By End-Use Industry - Market Size and Forecast, 2025-2035
- 12.4.1 Segment Definition and Scope
- 12.4.2 Historical Market Size, 2018-2025
- 12.4.3 Revenue Forecast, 2025-2035
- 12.4.4 Volume Forecast, 2025-2035
- 12.4.5 Base-Year Market Share, 2025
- 12.4.6 Segment CAGR and Growth Drivers
- 12.4.7 Subsegment Market Size and Forecast
- 12.4.7.1 Mining and Mineral Processing
- 12.4.7.2 Alumina and Aluminium
- 12.4.7.3 Power Generation
- 12.4.7.4 Process Manufacturing and Energy
- 12.4.8 Subsegment Pricing and Adoption Trends
- 12.4.9 Leading Suppliers and Competition
- 12.4.10 Regional Demand and Opportunities
- 12.5 By Application - Market Size and Forecast, 2025-2035
- 12.5.1 Segment Definition and Scope
- 12.5.2 Historical Market Size, 2018-2025
- 12.5.3 Revenue Forecast, 2025-2035
- 12.5.4 Volume Forecast, 2025-2035
- 12.5.5 Base-Year Market Share, 2025
- 12.5.6 Segment CAGR and Growth Drivers
- 12.5.7 Subsegment Market Size and Forecast
- 12.5.7.1 Greenfield Emissions Control
- 12.5.7.2 Brownfield Process Upgrades
- 12.5.7.3 Installed-Base Reliability
- 12.5.8 Subsegment Pricing and Adoption Trends
- 12.5.9 Leading Suppliers and Competition
- 12.5.10 Regional Demand and Opportunities
- 12.6 By Sales Channel - Market Size and Forecast, 2025-2035
- 12.6.1 Segment Definition and Scope
- 12.6.2 Historical Market Size, 2018-2025
- 12.6.3 Revenue Forecast, 2025-2035
- 12.6.4 Volume Forecast, 2025-2035
- 12.6.5 Base-Year Market Share, 2025
- 12.6.6 Segment CAGR and Growth Drivers
- 12.6.7 Subsegment Market Size and Forecast
- 12.6.7.1 Direct Supplier Contracts
- 12.6.7.2 Engineering Procurement and Construction Contracts
- 12.6.7.3 Specialist Integrator Contracts
- 12.6.7.4 Authorised Distribution Contracts
- 12.6.8 Subsegment Pricing and Adoption Trends
- 12.6.9 Leading Suppliers and Competition
- 12.6.10 Regional Demand and Opportunities
- 12.7 Segment Growth Comparison
- 12.8 Segment Attractiveness and Priority Matrix
Chapter 13 Australia Gas Cleaning Technologies End-Use and Application Market Outlook
- 13.1 End-Use Industry and Customer Demand Structure
- 13.2 Leading Applications and Customer Groups
- 13.3 End-Use Market Size, Share and Forecast
- 13.4 Major End-Use Industry Deep Dives
- 13.4.1 Customer Requirements and Use Cases
- 13.4.2 Demand and Replacement Cycles
- 13.4.3 Technical and Regulatory Considerations
- 13.4.4 Purchasing and Procurement Models
- 13.4.5 Leading Vendors and Distribution Channels
- 13.4.6 Forecast and Commercial Opportunities
- 13.5 Emerging Applications and Cross-Segment Demand
- 13.6 End-Use Industry Investment Priorities
Chapter 14 Australia Gas Cleaning Technologies Geographic Market Outlook, 2025-2035
- 14.1 Domestic Market Distribution and Demand Clusters
- 14.2 State- or Province-Wise Market Size and Forecast, 2025-2035
- 14.3 City and Metropolitan Market Outlook
- 14.4 Industrial, Manufacturing and Commercial Clusters
- 14.5 Geographic Concentration of Key End Users
- 14.6 Local Pricing and Purchasing Differences
- 14.7 Domestic Production Facilities and Capacity Map
- 14.8 Local Infrastructure and Project Pipeline
- 14.9 State-Level Policy and Incentive Differences
- 14.10 Subnational Investment Hotspots and Opportunities
- 14.11 Distribution and Logistics Networks
- 14.12 Domestic Competitive Footprint
Chapter 15 Australia Gas Cleaning Technologies Technology, Innovation and Sustainability Outlook
- 15.1 Technology Landscape and Maturity
- 15.2 Product, Process and Service Innovation
- 15.3 AI, Automation and Digital Tools in the Industry
- 15.4 Technology Adoption and Performance Benchmarking
- 15.5 Innovation Pipeline and R&D Investment
- 15.6 Patent and Intellectual Property Trends
- 15.7 Energy Efficiency and Resource Management
- 15.8 Sustainability, Recycling and Circularity
- 15.9 Technology Roadmap, 2025-2035
- 15.10 Risks of Obsolescence and Technology Substitution
Chapter 16 Australia Gas Cleaning Technologies Market Key Strategic Imperatives
- 16.1 Growth and Market Entry Priorities
- 16.2 High-Return Products and Segments
- 16.3 Pricing, Profitability and Cost Optimization
- 16.4 Technology Investment and Product Differentiation
- 16.5 Supply Chain Localization and Resilience
- 16.6 Distribution and Customer Acquisition
- 16.7 Partnership, Acquisition and Capacity Strategy
- 16.8 Regional Expansion Priorities
- 16.9 Short-, Medium- and Long-Term Actions
Chapter 17 Competition Outlook
- 17.1 Industry Competition Characteristics
- 17.2 Market Structure and Concentration
- 17.3 Market Share and Competitive Positioning, 2025
- 17.4 Company-Wise Revenue and Product Benchmarking
- 17.5 Production and Service Capacity Benchmarking
- 17.6 Technology, Pricing and Differentiation
- 17.7 Regional Footprint and Distribution Strength
- 17.8 Mergers, Acquisitions and Strategic Alliances
- 17.9 New Entrants and Competitive Threats
- 17.10 Porter's Five Forces and Industry Attractiveness
- 17.11 Competitive Outlook, 2025-2035
Chapter 18 Company Profiles
- 18.1 Company Coverage and Selection Criteria
- 18.2 ANDRITZ Clean Air Technologies
- 18.2.1 Business Description
- 18.2.2 Company Ownership and Geographic Presence
- 18.2.3 Product and Service Portfolio
- 18.2.4 Manufacturing and Operating Footprint
- 18.2.5 Production Capacity and Expansion Plans
- 18.2.6 Financial Performance and Investment
- 18.2.7 Market Share and Competitive Position
- 18.2.8 Technology and Innovation Capabilities
- 18.2.9 Strategic Alliances or Partnerships
- 18.2.10 Recent Developments
- 18.2.11 Growth Strategy and Outlook
- 18.3 GEA Emission Control
- 18.4 Nederman MikroPul
- 18.5 Donaldson Industrial Air Filtration
- 18.6 Camfil Air Pollution Control
- 18.7 Total Air Pollution Control
- 18.8 Fowlerex Technologies
- 18.9 Luehr Filter Australia
- 18.10 Grydale
- 18.11 Plastic Fabricators WA
- 18.12 Other Relevant Market Participants
Note: Every listed company is profiled on the structure shown under the first company. The company list is preliminary and may change based on research findings, market developments, data availability and client requirements.
Chapter 19 Disclaimer
- 19.1 Research and Forecast Disclaimer
- 19.2 Data Source and Estimation Limitations
Note: The depth of individual sections depends on data availability for this market. Volume, capacity, trade and other unit-based metrics are included where applicable.

