
Recycled resin and bottle redesign shape Australian demand
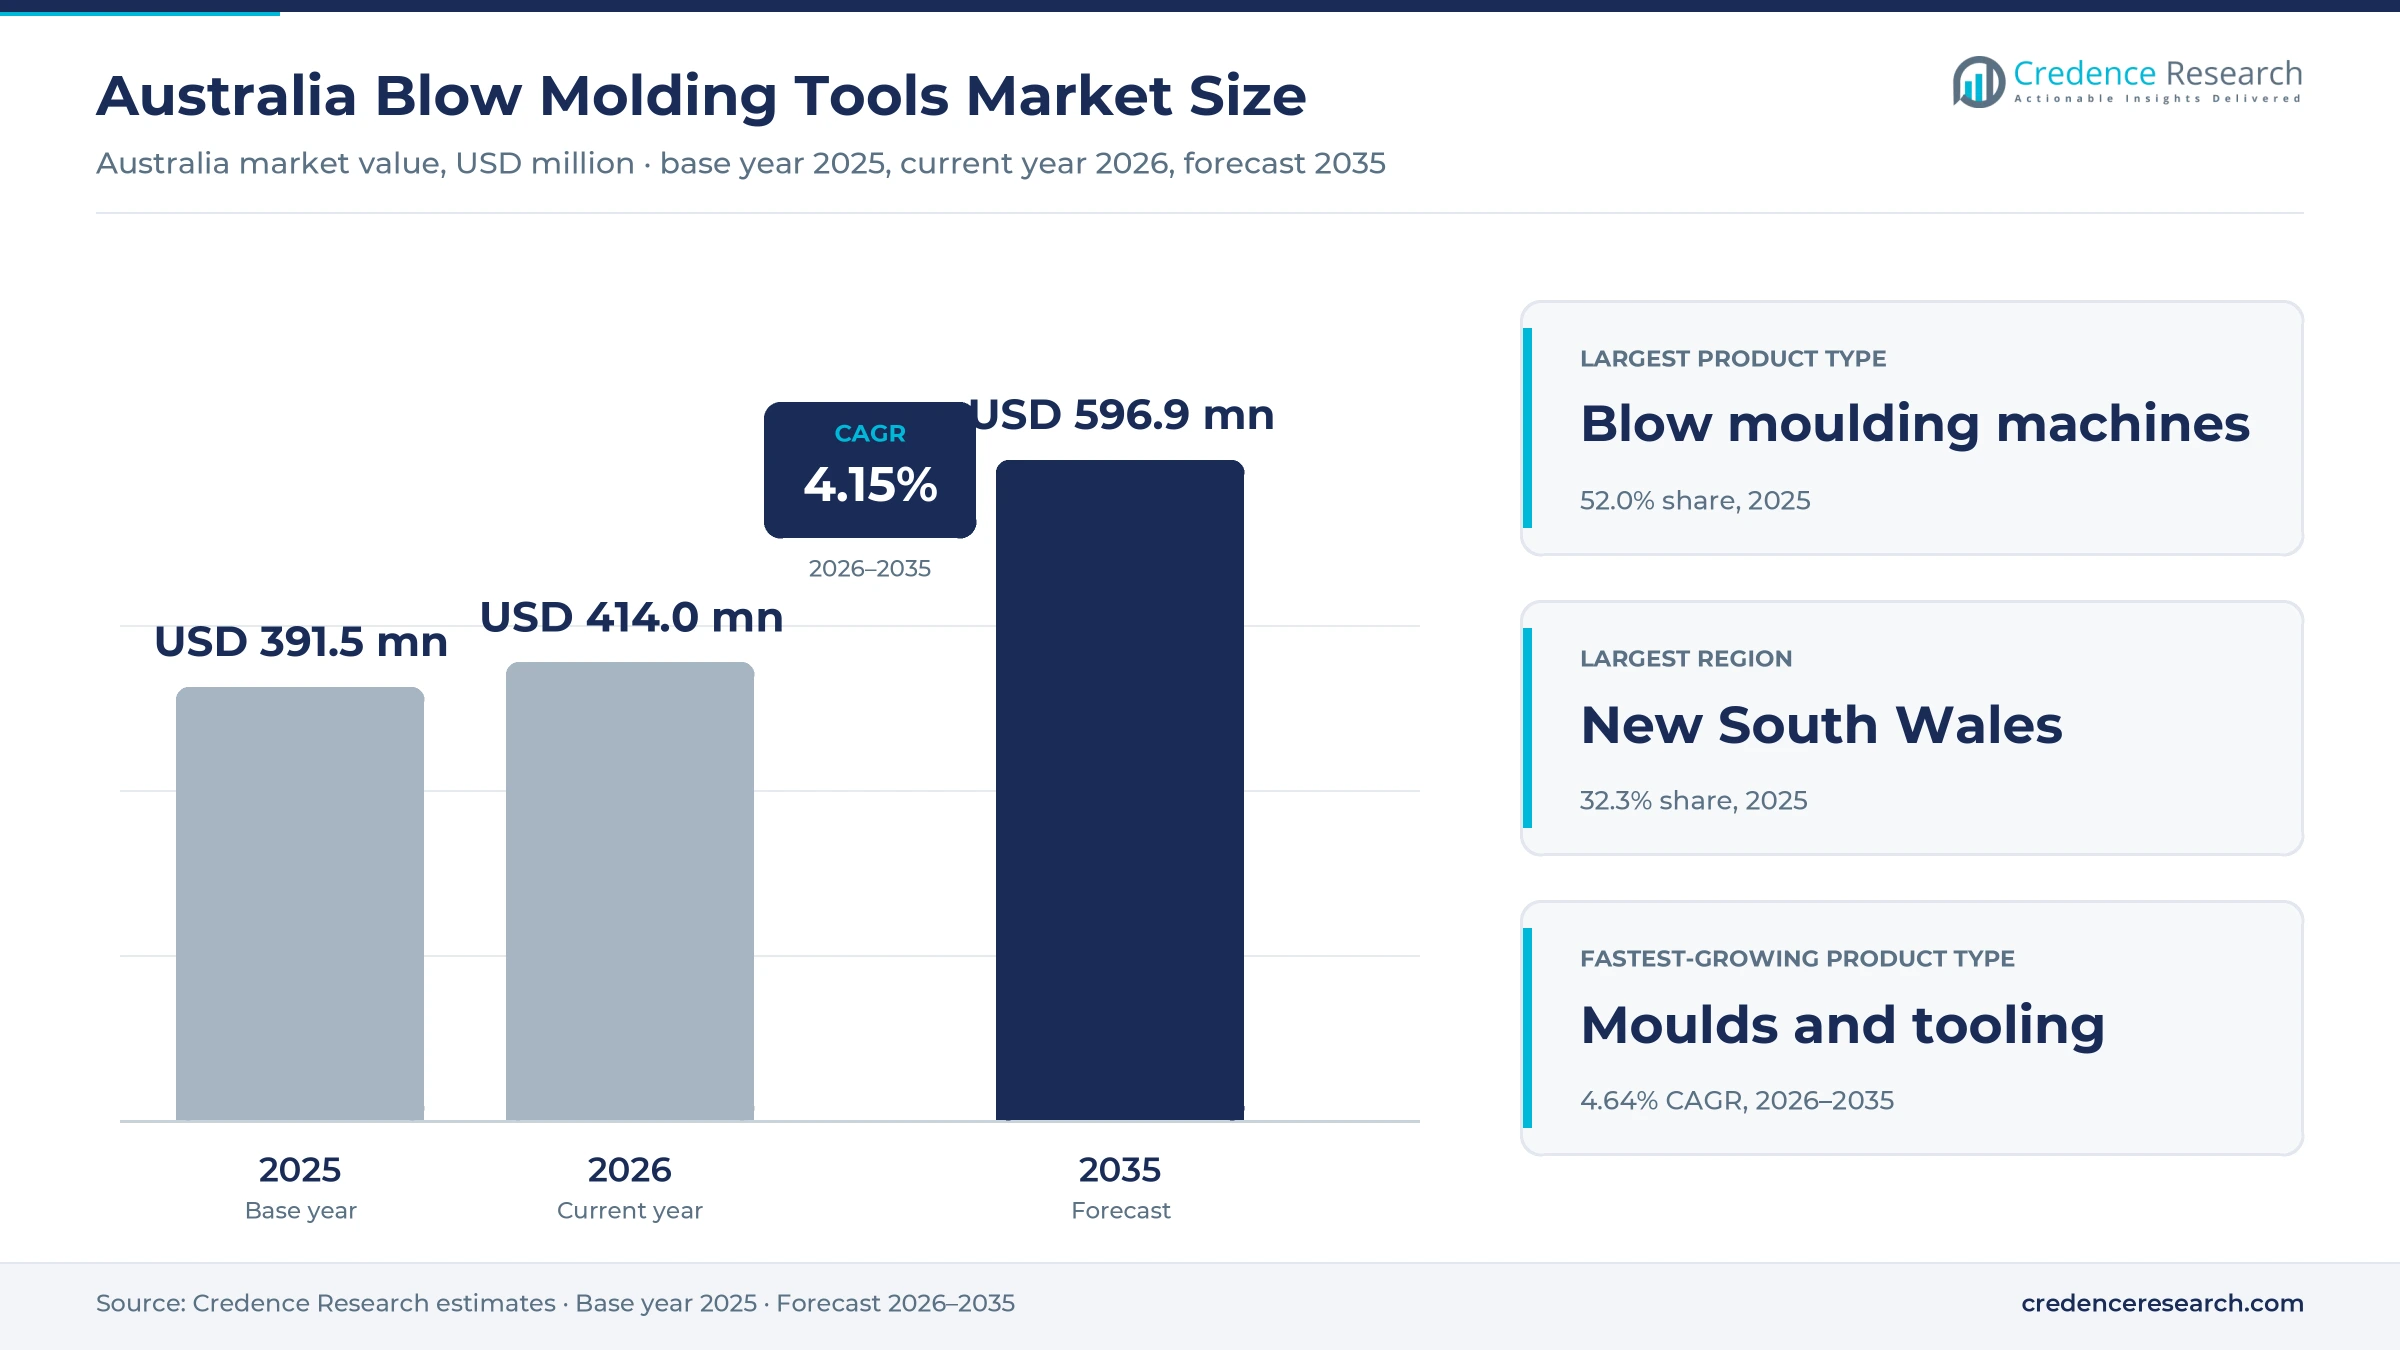
The Australia blow molding tools market was valued at USD 391.5 million in 2025 and is projected to increase from USD 414.0 million in 2026 to USD 596.9 million by 2035, registering a CAGR of 4.15% during 2026–2035. Demand comes from beverage, dairy, personal care and chemical container plants that must run more recycled PET and HDPE, cut bottle weight and switch formats faster on machines bought years ago. New South Wales held the largest regional share, 32.3% in 2025, because Sydney hosts the largest cluster of beverage fillers, converters and machinery suppliers. Queensland is the fastest-growing region at 4.45% a year, as beverage plants in South-East Queensland add blow-fill capacity. At the same time, Australia's 2025 National Packaging Targets and the federal review of packaging regulation push brand owners toward recycled resin, which raises spending on new moulds, preform heating upgrades and process controls that keep recycled bottles within tolerance.
Which molding equipment and tooling purchases are counted?
The estimate measures the value of blow molding machines, moulds and tooling, dedicated parts and dedicated ancillary equipment bought by Australian container and hollow-part producers. It covers extrusion, injection-stretch, injection and hybrid processes used for food, beverage, personal care, household, pharmaceutical and technical products, whether supplied directly by makers or through local engineering agents.
The estimate excludes resin, preforms bought as finished goods, filling and capping machines sold on their own, and general plant utilities that also serve other processes. The value chain runs from European and Japanese machine builders and their Australian subsidiaries or agents to merchant converters, captive brand-owner plants and technical product makers, which buy spare parts and moulds through the life of each machine.
Australia Blow Molding Tools Market Insights
- The Australia blow molding tools market was valued at USD 391.5 million in 2025 and is projected to reach USD 596.9 million by 2035, registering a CAGR of 4.15% during 2026–2035.
- New South Wales held a 32.3% share of 2025 value, because the state has 8.67 million residents and hosts the Australian offices of Krones and SMC.
- Blow moulding machines led with a 52.0% share of 2025 value, while moulds and tooling grow fastest at 4.64% a year as converters redesign bottles for recycled resin.
- Australian packaging carried 44% average recycled content in 2022-23 against a 50% national target, which pushes converters to requalify molds and process settings for recycled PET and HDPE.
- Krones, Sidel and SMC serve Australian plants through local subsidiaries, while Aoki and MEPER machines reach converters through Victorian agents Tasman Machinery and Telford Smith.
Machines lead while moulds and tooling grow fastest
Why do complete machines hold the largest value?
Based on product type, the market is categorized into blow moulding machines, moulds and tooling, dedicated parts and accessories, and dedicated ancillary equipment. Blow Moulding Machines led with a 52.0% share of 2025 value, because each new line carries a high unit price and beverage fillers buy complete blow-fill blocks. Moulds and Tooling grows fastest at 4.64% a year, as converters redesign bottles for recycled resin and lower weight.
How does food and beverage packaging anchor spending?
Based on end-use industry, the market is categorized into food and beverage packaging, personal care and household products, pharmaceutical packaging and technical and non-food applications. Food and Beverage Packaging led with 54.0% of 2025 value, because water, soft drink, juice and milk bottles run on the largest machines. Pharmaceutical Packaging grows fastest at 4.93% a year, as small precise bottles favor injection molding tools.
Why do small containers dominate machine demand?
Based on application, the market is categorized into small containers up to 2 Litres, containers above 2 to 20 Litres, containers above 20 Litres, and non-container hollow components. Small Containers up to 2 Litres led with 58.0% of 2025 value and also grow fastest at 4.38% a year, because beverage, dairy and personal care bottles fall in this range and change shape most often when brands adopt recycled resin.
How do extrusion and stretch molding split the base?
Based on technology, the market is categorized into extrusion blow moulding, injection-stretch blow moulding, injection blow moulding and specialty hybrid blow moulding. Extrusion Blow Moulding led with 44.0% of 2025 value, because HDPE milk, juice and chemical bottles run on extrusion lines. Specialty Hybrid Blow Moulding grows fastest at 4.71% a year, as converters test combined processes for multilayer and recycled containers.
| Segment Group | Leading Sub-segment | Share, 2025 | Fastest-growing Sub-segment | CAGR, 2026–2035 |
|---|---|---|---|---|
| By Product Type | Blow Moulding Machines | 52.0% | Moulds and Tooling | 4.64% |
| By End-Use Industry | Food and Beverage Packaging | 54.0% | Pharmaceutical Packaging | 4.93% |
| By Application | Small Containers up to 2 Litres | 58.0% | Small Containers up to 2 Litres | 4.38% |
| By Technology | Extrusion Blow Moulding | 44.0% | Specialty Hybrid Blow Moulding | 4.71% |
Request a Free Sample
Fill in your details and we'll send you a free sample report.
- Sample data tables & charts
- Research methodology
Recycled resin, lighter bottles and refits drive spending
Why does recycled-material equipment qualification lift spending?
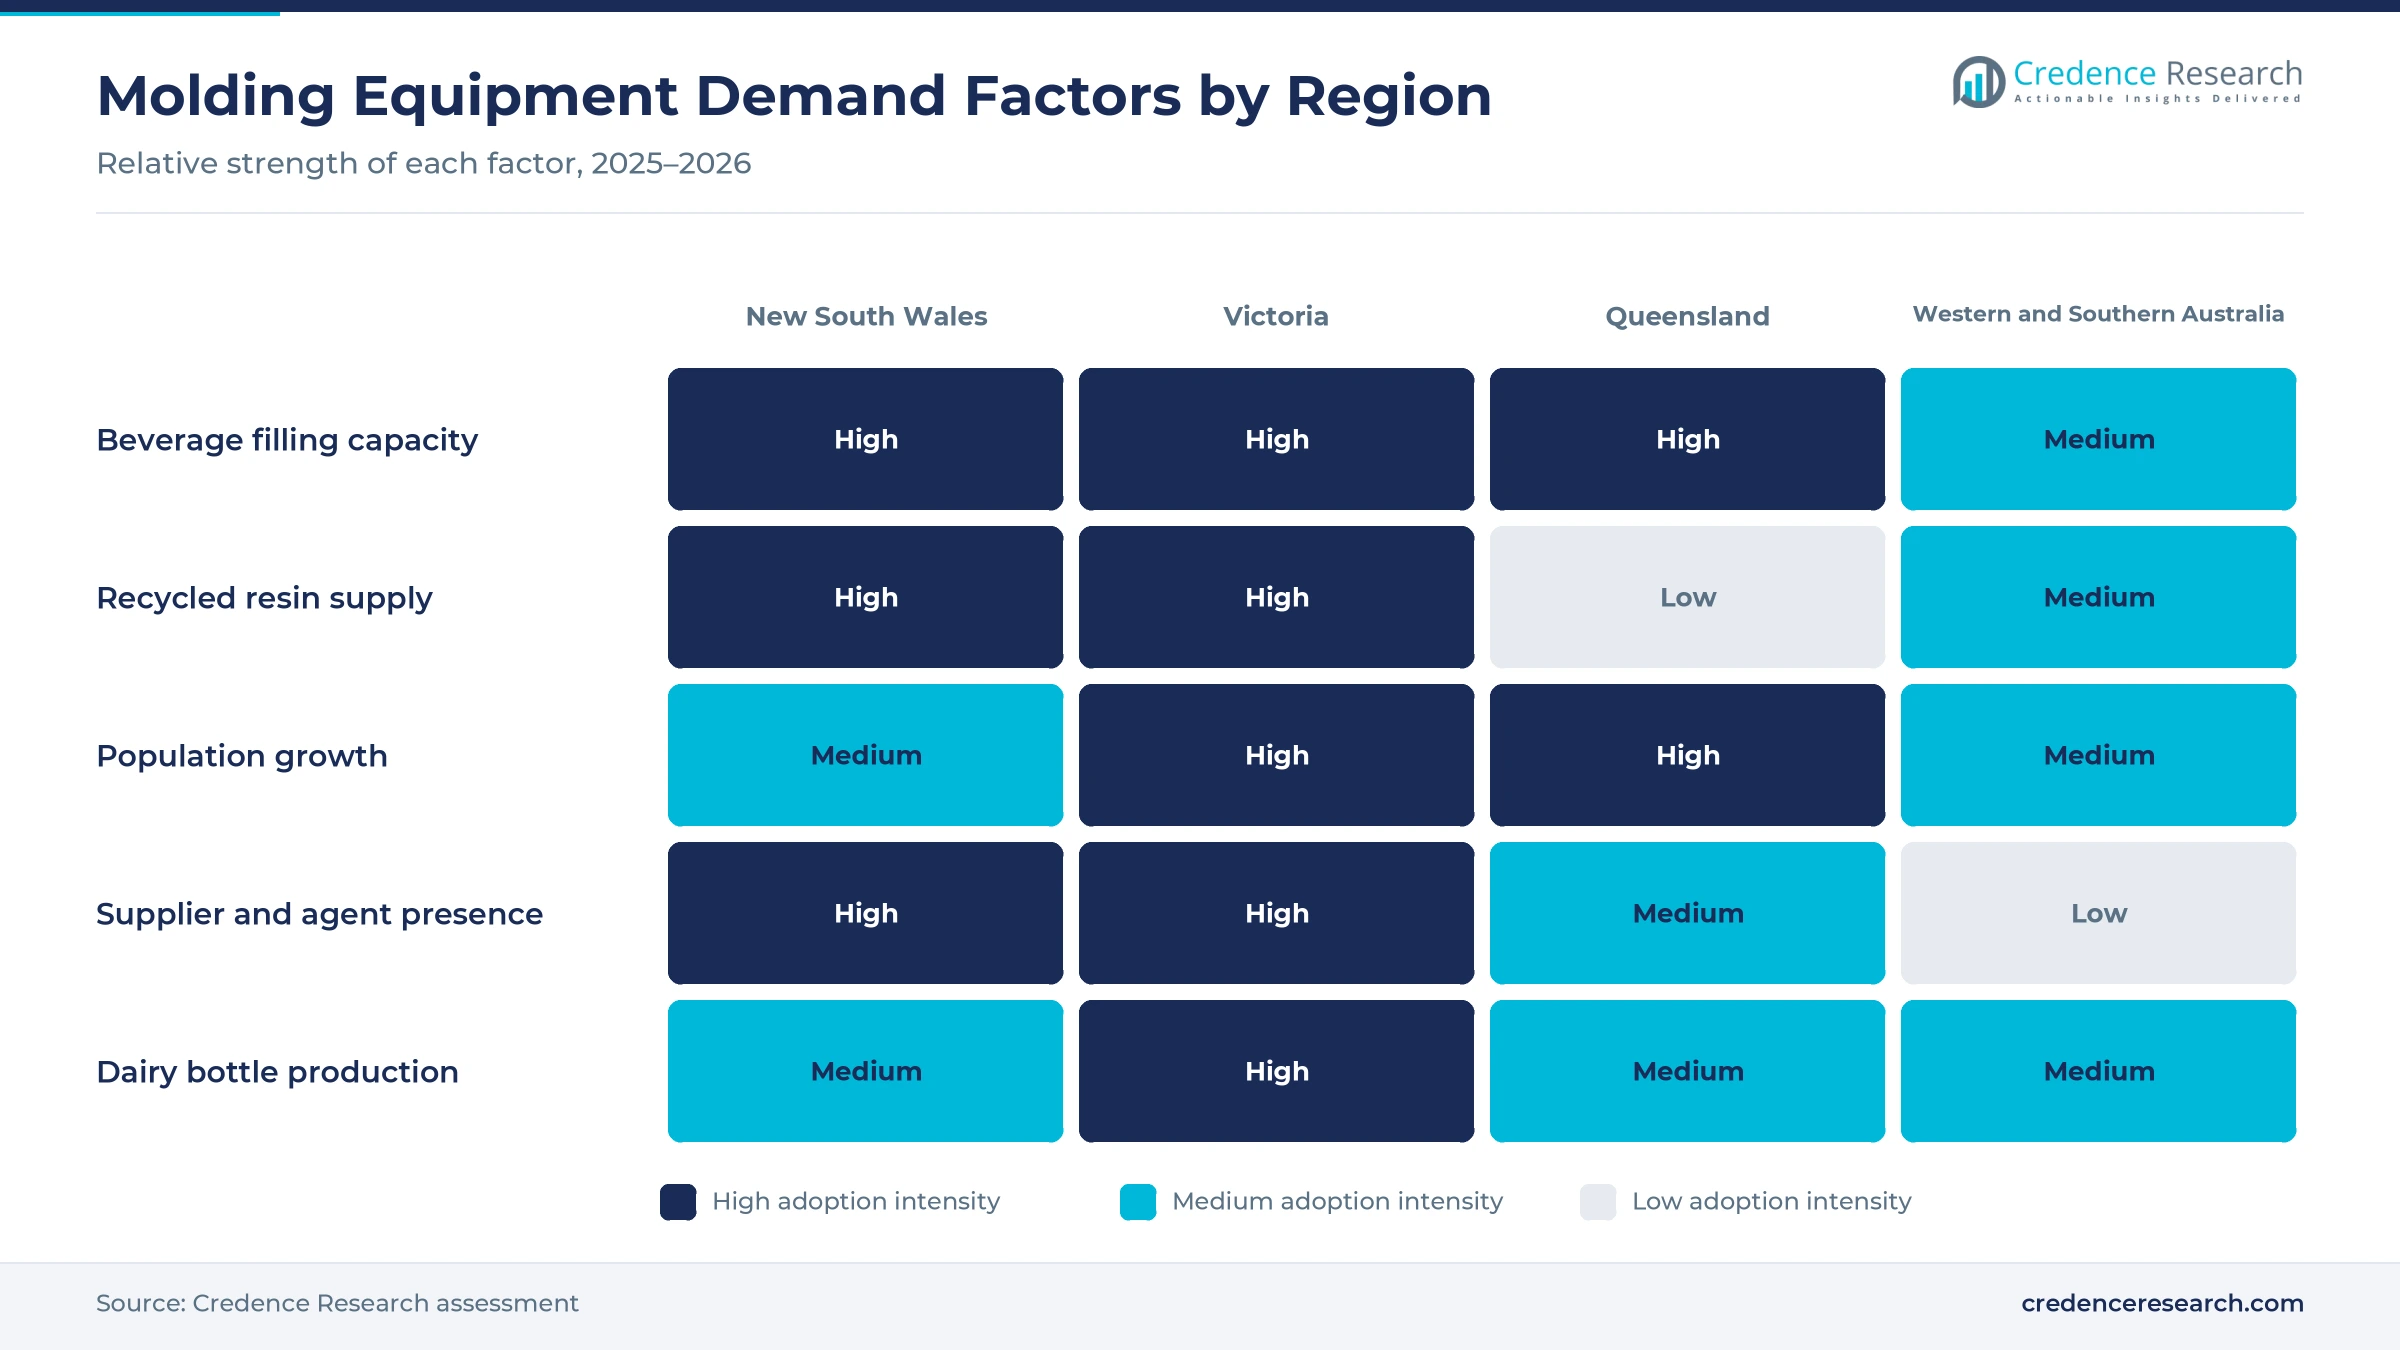
Recycled PET and HDPE behave differently from virgin resin, so converters must requalify molds, heating profiles and process controls before they can run higher recycled content. Australian packaging carried 44% average recycled content in 2022-23 against the 50% goal in the 2025 National Packaging Targets, which keeps pressure on bottle makers. Circular Plastics Australia's Albury plant recycles the equivalent of one billion PET bottles a year into more than 20,000 metric tons of new bottles and food packaging, the Clean Energy Finance Corporation said. Australian Manufacturing reported on Aug. 25, 2026 that about 350 million Asahi soft drink bottles a year now use recycled plastic from Albury and Altona. As a result, moulds and tooling grow at 4.64% a year.
How do lightweighting and format flexibility drive tooling refits?
Brand owners keep cutting bottle weight and adding sizes, which forces converters to buy new preform and blow molds and machines that change formats quickly. Petnology reported that Bickford's cut its 1-liter juice bottle to 32 grams, half its previous weight, on a Sidel aseptic line in Adelaide. The same line runs 250-milliliter, 500-milliliter, 600-milliliter and 1-liter bottles at up to 18,000 bottles an hour for carbonated drinks. Pact Group lists HDPE and PET bottles from 250 milliliters to 10 liters across milk, juice, water and soft drinks. In turn, small containers up to 2 Litres hold 58.0% of 2025 value, because frequent redesigns concentrate on these bottles and their molds.
Why does the installed equipment base sustain replacement demand?
Australia runs a mature but steady manufacturing base, so most spending replaces or upgrades existing lines rather than building new plants. Manufacturing accounted for 5.38% of Australian GDP in 2024, according to World Bank data, a share that has held between 5.3% and 5.5% since 2019. Asahi invested $55 million in its Wulkuraka plant near Ipswich, adding a hot-fill and blow-fill line that nearly doubled capacity to 300 million liters, the company said in June 2022. Telford Smith keeps more than $2 million of new and used stock at its Melbourne warehouse for local processors. As a result, replacement parts and upgrades for existing lines keep demand steady, alongside local supply of bottle-grade PET chip.
How do container deposit schemes widen recycled feedstock?
Container refund schemes in Victoria, Tasmania and other states collect clean beverage bottles, which gives recyclers the feedstock that food-grade recycled PET and HDPE lines need. Victoria started its scheme on Nov. 1, 2023, with a 10-cent refund, and Business Victoria reported more than 10 million containers recycled in the first week. Tasmania launched Recycle Rewards on May 1, 2025, and Waste Management Review reported more than 1.2 million deposits in four days. Asahi said in August 2026 that bottles collected through these schemes feed the Albury and Altona plants. In turn, converters invest in molds and controls that keep recycled PET bottles within tolerance.
Closed-loop bottles and national packaging rules rise
Why is the shift to closed-loop beverage bottles accelerating?
Large beverage companies are shifting to bottles made entirely from recycled PET, which raises the share of machine time spent on recycled resin. Coca-Cola Europacific Partners said in February 2024 that seven out of 10 of its Australian PET bottles are made from 100% recycled plastic, excluding caps and labels, Packaging News reported. Bega began moving flavored milk and iced coffee bottles under 1 liter to fully recycled PET from March 15, 2023, with Dare, Big M and Dairy Farmers first. Asahi has since moved Schweppes, Solo, Pepsi, Cool Ridge and Frantelle bottles to recycled plastic. As a result, injection-stretch blow moulding lines need preform heating and mould upgrades to run fully recycled PET.
How is the rise of national packaging rules changing investment?
Packaging regulation is moving from voluntary targets toward national rules, which encourages converters to plan tooling changes ahead of new design requirements. The federal environment department opened a public consultation on Sept. 27, 2024, covering mandatory packaging requirements and a national extended producer responsibility scheme, Packaging Gateway reported. Environment ministers backed national packaging design standards on Dec. 10, 2024, with consultation on a kerbside recyclability grading framework in early 2025. The Australian Packaging Covenant Organisation said only 20% of plastic packaging was recycled or composted in 2023-24, against a 70% target. In turn, technical and non-food applications follow beverage plants into recyclable designs.
Can recycled HDPE milk bottles open a tooling opportunity?
Dairy converters are moving 2-liter bottles to recycled HDPE, which creates demand for new extrusion moulds and parison controls at milk plants. Food Processing reported in May 2024 that Pact's Laverton plant can process up to 20,000 metric tons of HDPE and PP packaging a year, roughly half a billion 2-liter milk bottles. The same report said Pact is upgrading its Sydney, Melbourne, Brisbane and Perth packaging plants to use more recycled content in HDPE milk bottles. Visy began making fully recycled 2-liter bottles for Bannister Downs Dairy at Forrestfield in Western Australia in December 2023, Packaging News reported. As a result, extrusion blow moulding keeps 44.0% of 2025 value, while dairy packaging tooling turns over faster.
Can local parts and retrofit services win aftermarket share?
Plants that cannot wait weeks for imported components create room for suppliers with local stock, parts and retrofit services. SMC Corporation employs more than 250 people in Australia, with a head office, warehouse and local production at Castle Hill in Sydney and offices in five other cities. SMC opened a South Australia distribution center in May 2017 and tripled stock at its 3,049-square-meter Victorian warehouse, Packaging News reported. Aoki Technical Laboratory sells its one-step machines through Tasman Machinery in Braeside, Victoria, according to its sales network page. Telford Smith, a Melbourne machinery supplier founded in 1923, offers MEPER blow molding machines for thermoplastic containers. In turn, dedicated ancillary equipment grows faster than complete machines, supported by circular economy and recycling technology spending.
Feedstock quality, policy timing and service reach weigh
Why does uneven recycled feedstock quality raise process risk?
Recycled resin varies in color, viscosity and contamination, which makes bottle wall thickness and strength harder to hold within specification. The packaging covenant body found that only 28% of rigid plastics were recovered in 2023-24, although about 73% had good recycling potential. As a result, converters face scrap and downtime when supply quality shifts between batches. Plants respond with tighter preform heating, inline inspection and moulds designed for recycled material.
How does policy timing delay equipment decisions?
National packaging rules are still being designed, which leaves converters unsure which recycled content and design standards they will face. Environment ministers backed design standards in December 2024, but the grading framework remained under consultation into 2025. In turn, some brand owners delay large machine orders until requirements are fixed, and they favor mould changes and retrofits that keep options open at lower cost.
Why does a small, dispersed customer base raise supplier costs?
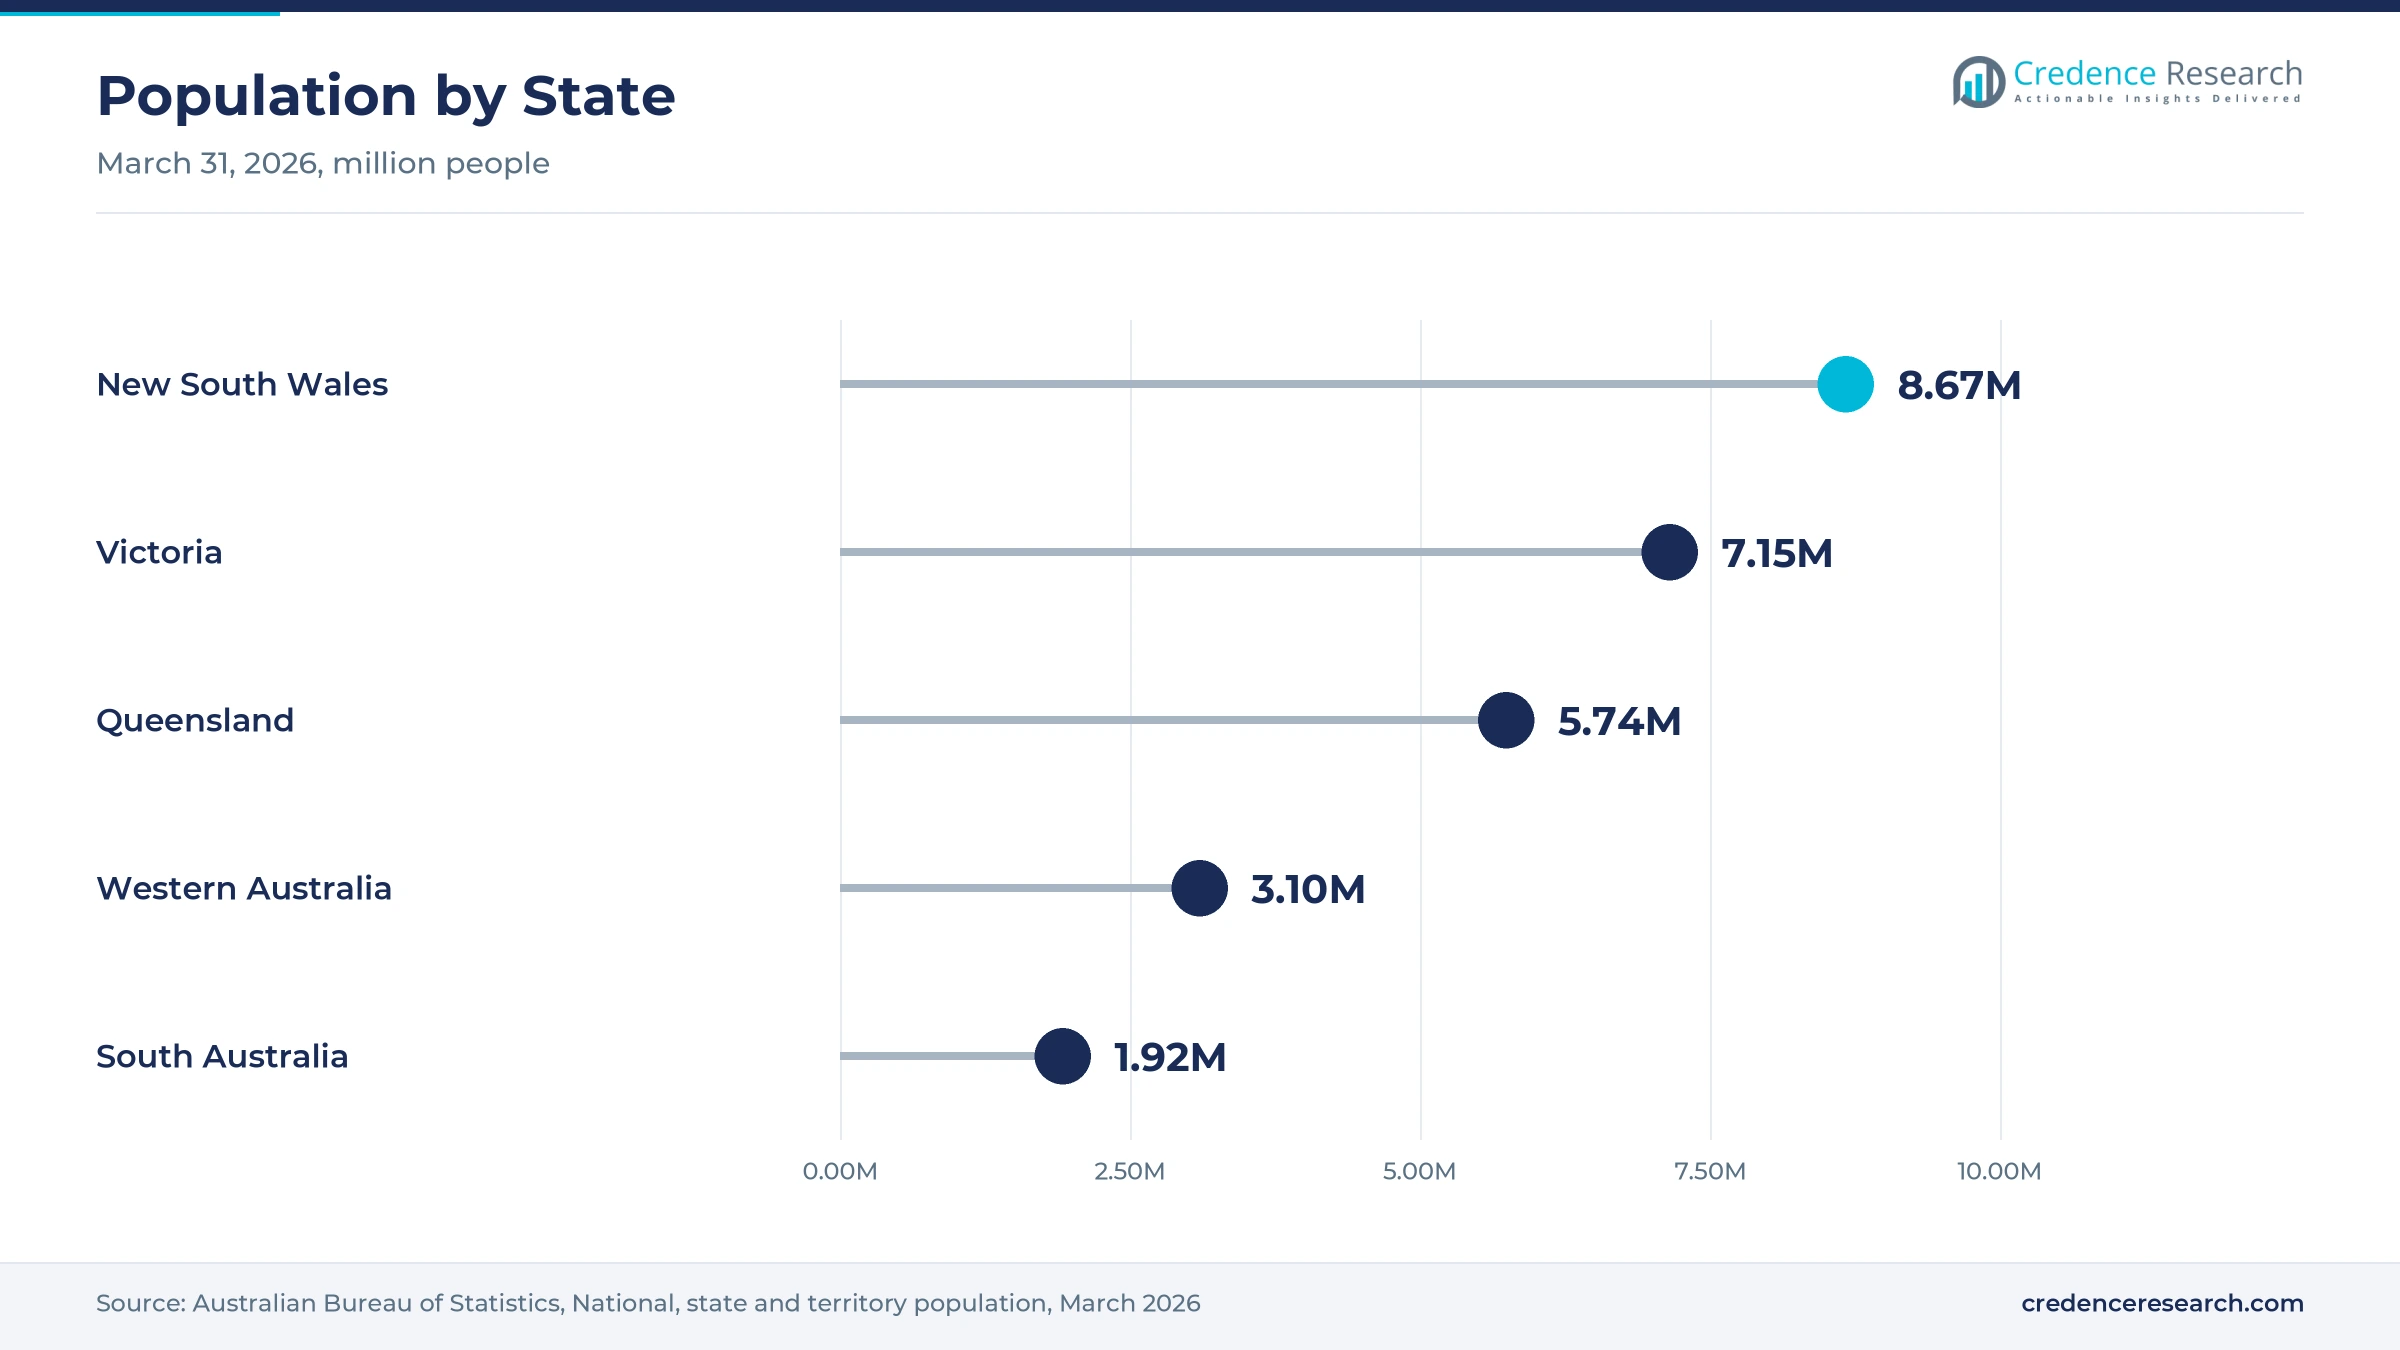
Australian blow molding plants are spread across five mainland capitals and several regional towns, which raises the cost of field service for overseas machine makers. Population is concentrated in New South Wales, Victoria and Queensland, while Western Australia sits far from the east coast supply base. As a result, suppliers rely on agents and spare parts warehouses, and plants in remote areas often hold larger stocks of critical parts.
How does import dependence affect lead times and pricing?
Leading machine suppliers such as Krones, Sidel and Aoki build their equipment in Europe and Japan, which ties pricing and delivery to overseas production schedules. Local makers such as Telford Smith supply part of the equipment base, yet high-speed beverage lines still come from overseas builders. In turn, converters plan purchases well ahead of product launches, and they lean on local agents for installation, training and mould adjustments after commissioning.
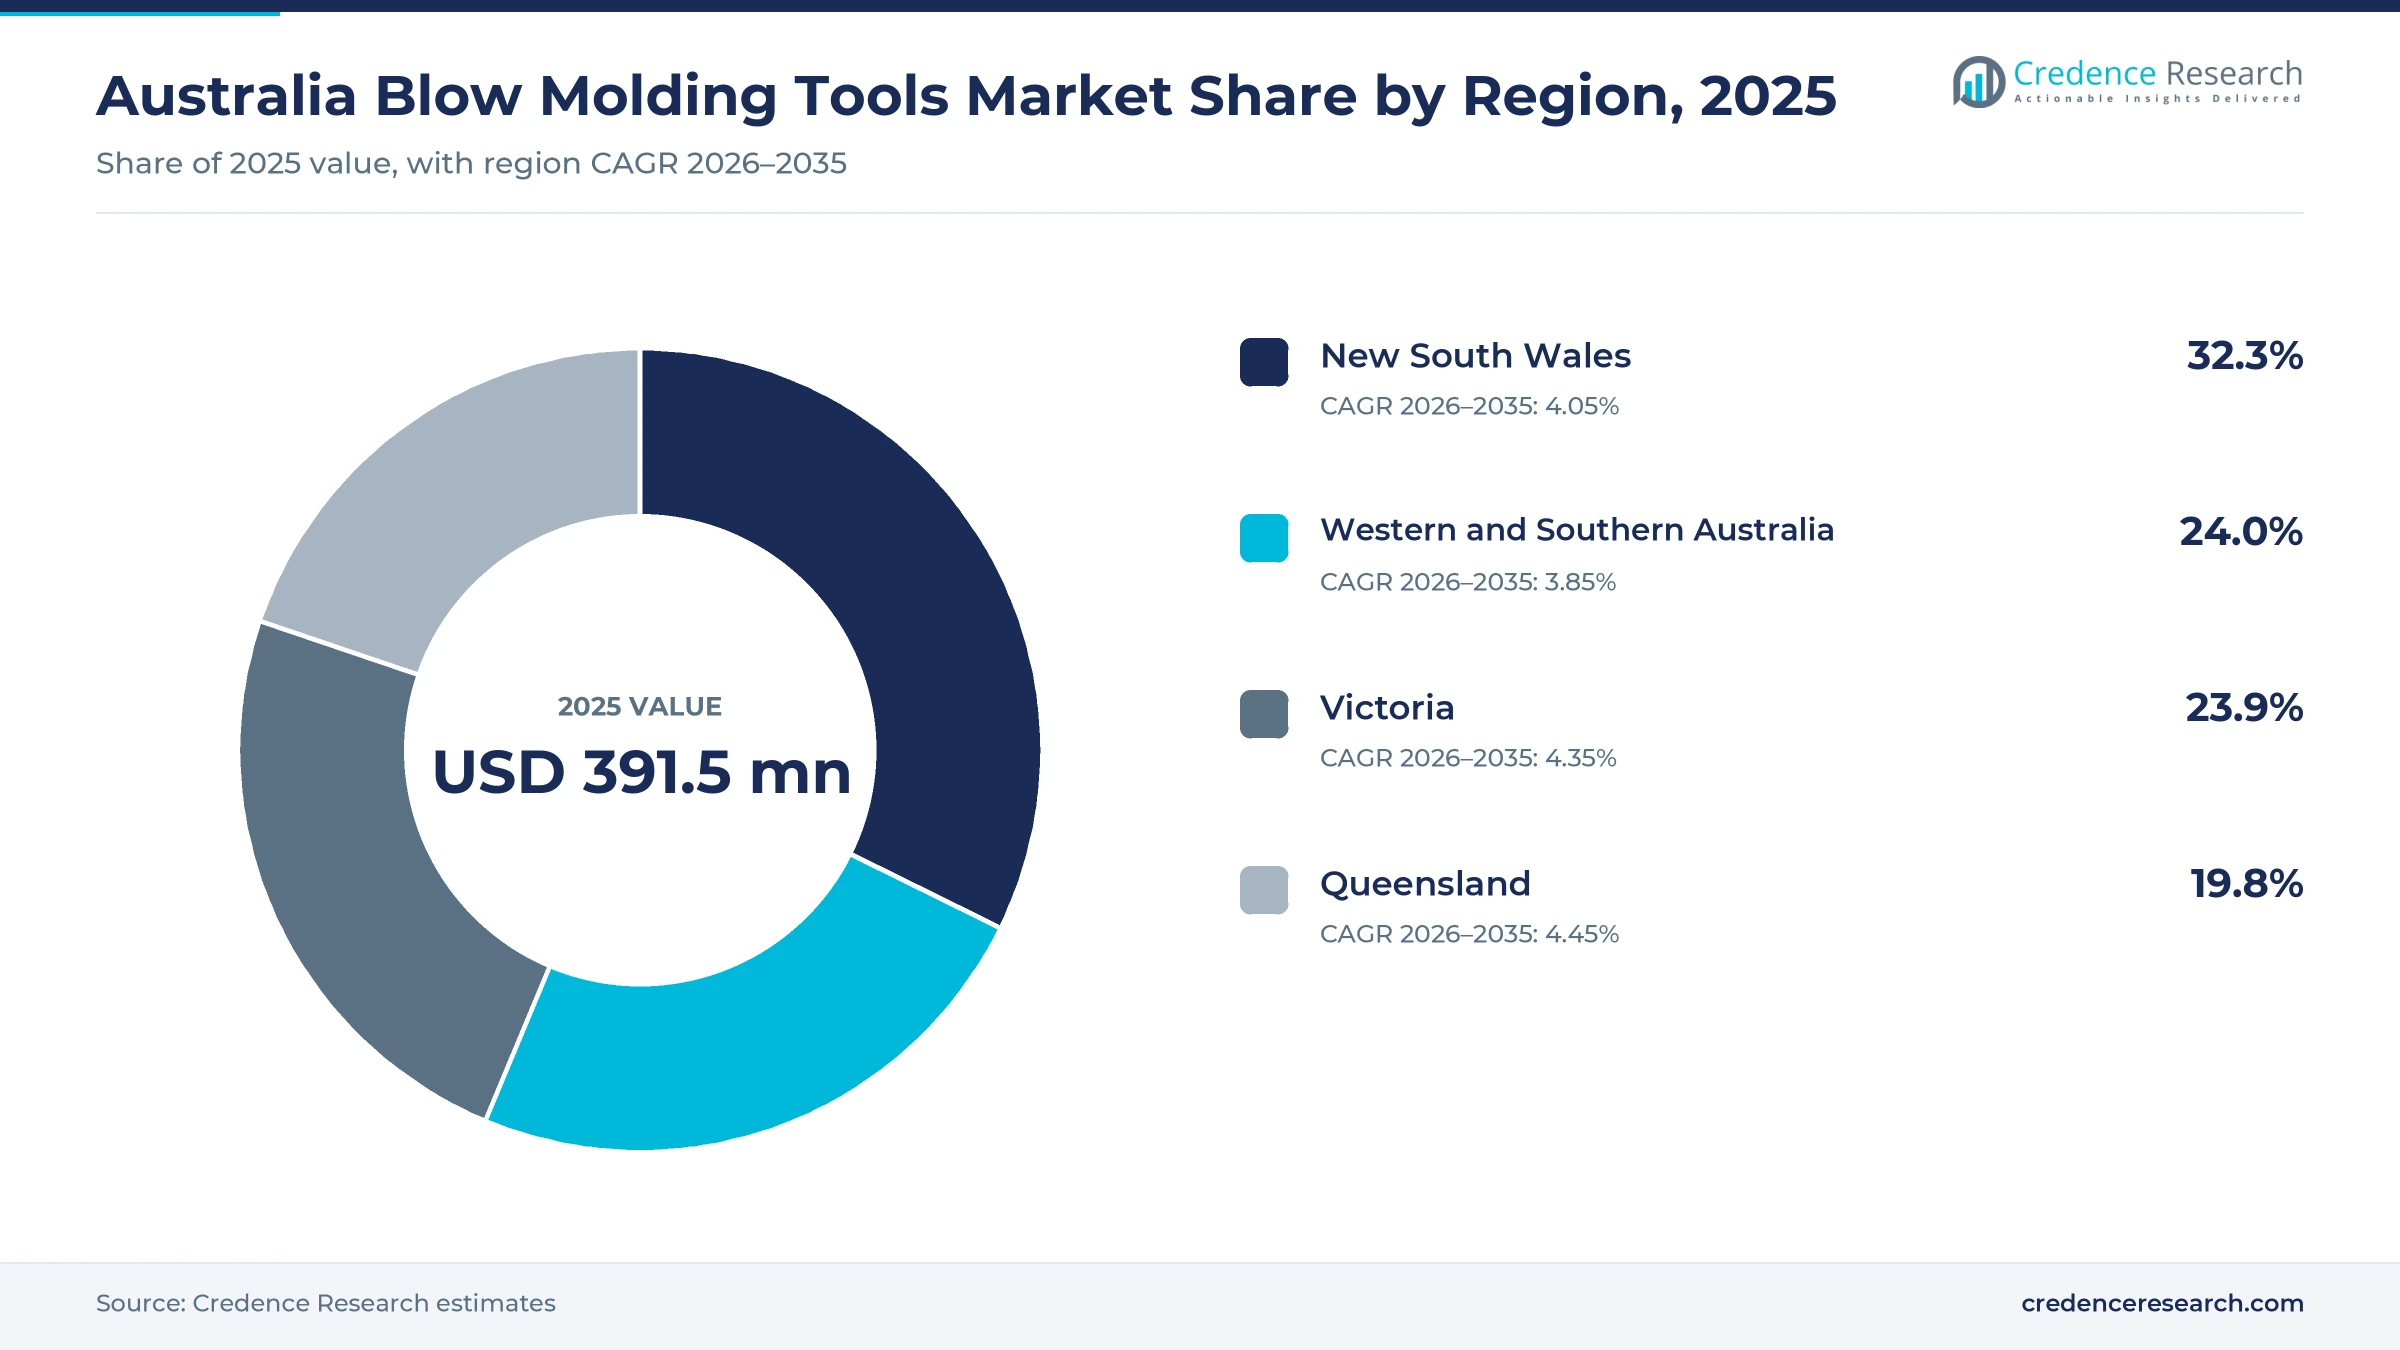
New South Wales leads as Queensland grows fastest to 2035
| Region | Value, 2025 (USD million) | Share, 2025 | CAGR, 2026–2035 |
|---|---|---|---|
| New South Wales | 126.5 | 32.3% | 4.05% |
| Western and Southern Australia | 94.0 | 24.0% | 3.85% |
| Victoria | 93.6 | 23.9% | 4.35% |
| Queensland | 77.5 | 19.8% | 4.45% |
Sydney beverage plants and supplier offices anchor NSW
New South Wales held a 32.3% share of 2025 value and grows at 4.05% a year, because Sydney combines the largest population with the main offices of several machine suppliers. The state had 8.67 million residents at March 31, 2026, according to the Australian Bureau of Statistics. Krones Pacific operates from Silverwater, and SMC runs its head office, warehouse and local production at Castle Hill. The Albury recycled PET plant in southern New South Wales also supplies Pact Group and Asahi bottle lines.
Victoria pairs recycling plants with machinery agents
Victoria held a 23.9% share of 2025 value and grows at 4.35% a year, because Melbourne hosts recycling plants, converters and machinery agents. The state had 7.15 million residents at March 31, 2026, after growth of 1.6% over the year. Pact's Laverton plant makes food-grade recycled HDPE and PP resin, and Asahi cites a recycled PET plant in Altona. Sidel Oceania is based in Collingwood, while Telford Smith in Melbourne and Tasman Machinery in Braeside supply machines and parts.
Why is Queensland the fastest-growing region?
Queensland held a 19.8% share of 2025 value and grows fastest at 4.45% a year, because its population grows quickly and beverage plants keep adding capacity. The state had 5.74 million residents at March 31, 2026, after growth of 1.6% over the year. Asahi's $55 million Wulkuraka upgrade added a hot-fill and blow-fill line and nearly doubled site capacity. SMC also runs sales offices in Brisbane and Townsville for automation parts.
Western and Southern Australia combine dairy and juice lines
Western and Southern Australia held a 24.0% share of 2025 value and grows at 3.85% a year, led by Western Australia and South Australia. Western Australia had the fastest population growth of any state at 2.1% to March 2026, and Visy makes recycled milk bottles at Forrestfield. In South Australia, Bickford's runs a Sidel aseptic PET line in Adelaide. SMC serves both states from offices in Perth and Adelaide.
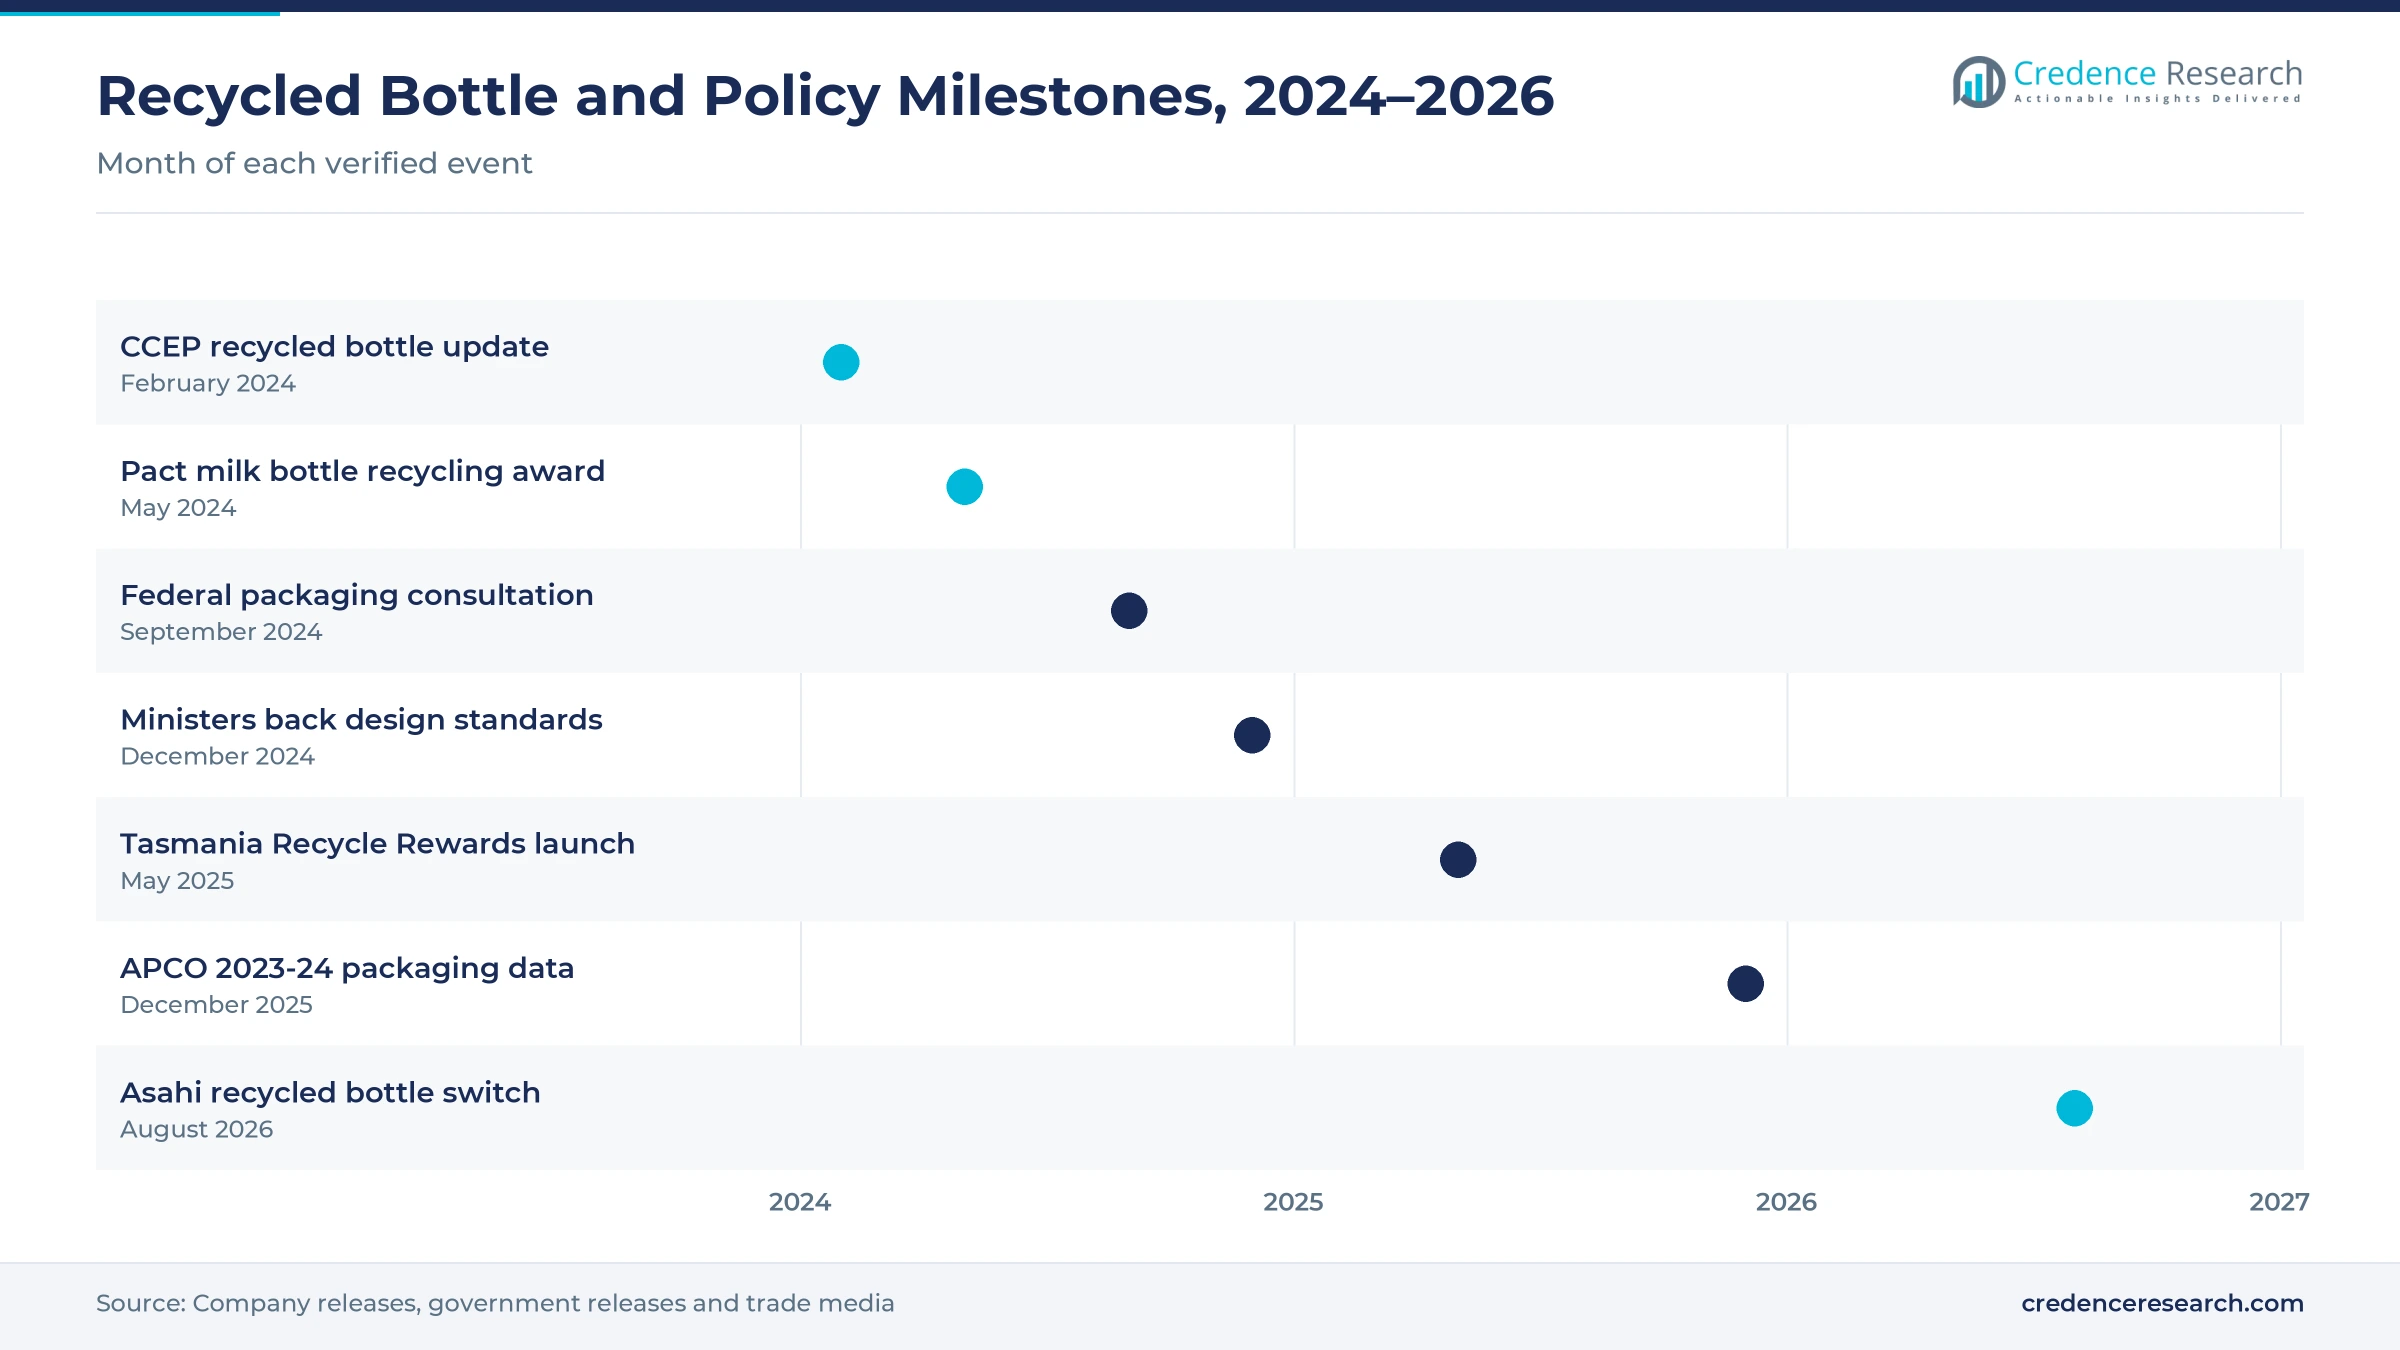
Recycled bottle and packaging policy milestones since 2024
| Development | Status and market relevance |
|---|---|
| In February 2024, Coca-Cola Europacific Partners said seven out of 10 of its Australian PET bottles use 100% recycled plastic. | Raises the share of recycled PET running through beverage molding lines |
| In September 2024, the federal environment department opened consultation on national packaging regulation. | Options include mandatory packaging requirements and extended producer responsibility |
| In May 2025, Tasmania launched its Recycle Rewards container refund scheme with a 10-cent refund. | Adds a refund scheme in Tasmania and widens clean bottle feedstock |
| In December 2025, the Australian Packaging Covenant Organisation released 2023-24 packaging data. | Showed 20% plastic packaging recycling and 16% recycled content in rigid plastics |
| In August 2026, Asahi Beverages moved its Australian soft drink and water bottles to recycled plastic. | Adds about 350 million recycled PET bottles a year to local molding lines |
Four molding processes that decide container economics
- Extrusion blow molding forms a hot parison of HDPE or PP inside a mould, which suits handled milk, juice and chemical containers.
- Injection-stretch blow molding reheats PET preforms and stretches them in two directions, which gives light, clear beverage bottles at high speed.
- Injection blow molding molds a preform on a core rod and blows it in a second station, which suits small, precise pharmaceutical bottles.
- Hybrid and multilayer processes combine extrusion or injection steps with barrier layers, which helps converters run recycled resin in sensitive packs.
Need a Custom Version of This Report?
Tailor the scope, geography, or segments to your exact requirements.
- Custom geography or segment scope
- Direct access to our analyst team
Global machine makers and local agents serve converters
Competition combines European and Japanese machine builders with local subsidiaries and engineering agents. Krones has served Australia directly through Krones Pacific since buying back its agency from JL Lennard on Aug. 1, 2016, while Sidel supplies beverage and food lines through Sidel Oceania in Collingwood. SMC competes in pneumatic valves and controls that blow molding machines use, backed by local production in Sydney. Aoki and MEPER machines reach smaller converters through Tasman Machinery and Telford Smith, which also supply used machines and parts. Buyers compare suppliers on recycled resin performance, changeover time, energy use and the speed of local service, and mould makers compete on lightweight bottle designs that keep strength while cutting resin use.
Which machine builders and agents serve Australian plants?
| Company | Type | Role in the market |
|---|---|---|
| Krones | Global machine builder | Serves Australia directly through Krones Pacific in Silverwater since August 2016 |
| Sidel | Global machine builder | Supplies PET lines through Sidel Oceania, including the Bickford's aseptic line |
| Aoki Technical Laboratory | Japanese machine builder | Sells one-step stretch machines through Tasman Machinery in Braeside |
| SMC Corporation | Automation components maker | Runs a Castle Hill head office with local production and five sales offices |
| MEPER | Italian machine builder | Offers blow molding machines in Australia through Telford Smith |
| Telford Smith | Local machinery supplier | Supplies new and used molding and recycling machinery from Melbourne |
| Serac | French packaging machine builder | Showed its Roll N Blow bottle forming system in Australia through Icon Equipment |
Credence Research view on Australian molding tools
Credence Research's view is that Australian blow molding spending will grow through refits and recycled resin qualification more than through new plant construction. Machines stay the largest product type, while moulds and tooling grow fastest as brand owners redesign bottles for recycled PET and HDPE. New South Wales keeps the largest base, and Queensland gains from beverage plant expansion. Suppliers that combine recycled resin know-how, quick changeovers and local parts stock should win the most orders from converters and captive plants by 2035.
Model inputs from packaging data and public statistics
The report uses 2025 as the base year on a calendar basis, and market values come from the Credence Research model. That model draws on national packaging recovery data, official population and manufacturing statistics, government and finance agency releases, trade media and company announcements. Segment splits, regional shares and regional growth rates are Credence Research estimates. Sources used are public web pages, and no interviews or surveys were conducted.
Recycled content and tooling refits lead growth to 2035
The Australia blow molding tools market is expected to reach USD 596.9 million by 2035, a 4.15% CAGR during 2026–2035, as converters run more recycled resin, cut bottle weight and replace older machines. Growth should be strongest in moulds and tooling, pharmaceutical packaging, small containers and Queensland, because these areas gain most from redesigns and new beverage capacity. Feedstock quality, policy timing and import lead times could slow orders, while deposit schemes, national packaging rules and local service networks should support steady demand through the forecast period.
Frequently Asked Questions
How big is the Australia blow molding tools market?
Which product type leads Australian spending?
Which region leads the market?
How do recycled content targets affect molding equipment?
Which technology leads the market?
How do container deposit schemes support the market?
Who are the leading companies in the market?
What are the main challenges for the market?
Table of Content
Chapter 1 Market Segmentation
- 1.1 Segmentation Framework
- 1.1.1 Product and Service Classification
- 1.1.2 Application and End-Use Classification
- 1.1.3 Technology and Solution Classification
- 1.1.4 Customer and Distribution Channel Classification
- 1.1.5 Geographic Segmentation
- 1.1.6 Market Segment Definitions and Boundaries
- 1.2 By Product Type
- 1.2.1 Blow Moulding Machines
- 1.2.2 Moulds and Tooling
- 1.2.3 Dedicated Parts and Accessories
- 1.2.4 Dedicated Ancillary Equipment
- 1.3 By End-Use Industry
- 1.3.1 Food and Beverage Packaging
- 1.3.2 Personal Care and Household Products
- 1.3.3 Pharmaceutical Packaging
- 1.3.4 Technical and Non-Food Applications
- 1.4 By Application
- 1.4.1 Small Containers up to 2 Litres
- 1.4.2 Containers above 2 to 20 Litres
- 1.4.3 Containers above 20 Litres
- 1.4.4 Non-Container Hollow Components
- 1.5 By Technology
- 1.5.1 Extrusion Blow Moulding
- 1.5.2 Injection-Stretch Blow Moulding
- 1.5.3 Injection Blow Moulding
- 1.5.4 Specialty Hybrid Blow Moulding
Chapter 2 Introduction
- 2.1 Report Objectives and Scope
- 2.2 Product Definition and Industry Terminology
- 2.3 Market Inclusions and Exclusions
- 2.4 Research Process
- 2.4.1 Primary Research and Expert Interviews
- 2.4.2 Secondary Research and Source Review
- 2.4.3 Top-Down and Bottom-Up Estimation
- 2.4.4 Data Triangulation and Verification
- 2.5 Market Size Measurement Basis
- 2.5.1 2025: USD 391.5 million → 2035: USD 596.9 million
- 2.6 Historical and Forecast Reference Periods
- 2.6.1 Historical Period: 2018-2025
- 2.6.2 Base Year: 2025
- 2.6.3 Forecast Period: 2025-2035
- 2.7 Research Assumptions and Limitations
Chapter 3 Executive Summary
- 3.1 Market Snapshot and Key Findings
- 3.2 Base-Year Market Size, 2025
- 3.3 Forecast Market Size, 2035
- 3.4 Revenue and Volume Growth Outlook
- 3.5 Key Demand and Supply Indicators
- 3.6 Leading Market Segments
- 3.7 Fastest-Growing Market Opportunities
- 3.8 Regional Performance Highlights
- 3.9 Technology and Industry Transformation
- 3.10 Competitive Landscape Summary
- 3.11 Analyst View and Strategic Implications
Chapter 4 Australia Blow Molding Tools Market Trends and Developments
- 4.1 Historical Industry Development, 2018-2025
- 4.2 Recent Market Trends and Developments
- 4.3 Demand and Customer Behavior Trends
- 4.4 Technology and Product Innovation
- 4.5 Artificial Intelligence, Automation and Digitalization
- 4.6 Local Manufacturing and Supply Chain Realignment
- 4.7 Industry Partnerships, Mergers and Acquisitions
- 4.8 Sustainability and Circular Economy Developments
- 4.9 Government and Private Sector Investment Trends
- 4.10 Emerging Business Models and Commercialization
- 4.11 Industry Developments and Announcements
Chapter 5 Australia Blow Molding Tools Market Production, Supply and Demand Analysis
- 5.1 Demand Trend and Consumption Analysis, 2018-2025
- 5.2 Demand Forecast, 2025-2035
- 5.3 Production and Output Trend, 2018-2025
- 5.4 Production and Output Forecast, 2025-2035
- 5.5 Installed Capacity and Capacity Utilization
- 5.6 Company-Wise Production Plants and Statistics
- 5.6.1 Installed Production Capacity
- 5.6.2 Actual Production
- 5.6.3 Planned Capacity and Expansion Targets
- 5.7 Supply Chain Structure and Procurement Trends
- 5.8 Supply-Demand Gap and Bottlenecks
- 5.9 Import Dependence and Sourcing Structure
- 5.10 Contract Manufacturing and Outsourcing
- 5.11 Regional Supply and Demand Concentration
Chapter 6 Australia Blow Molding Tools Market Pricing Analysis
- 6.1 Pricing Structure and Measurement
- 6.2 Historical Pricing Trends, 2018-2025
- 6.3 Pricing Outlook, 2025-2035
- 6.4 Average Selling Price and Unit Economics
- 6.5 Pricing by Product and Market Segment
- 6.6 Geographic Pricing Differences
- 6.7 Key Input, Energy, Labor and Logistics Costs
- 6.8 Contract Pricing and Purchasing Models
- 6.9 Pricing Sensitivity and Competitive Positioning
- 6.10 Price, Margin and Profitability Implications
Chapter 7 Australia Blow Molding Tools Market Dynamics
- 7.1 Market Growth Drivers
- 7.1.1 Demand-Side Drivers
- 7.1.2 Technology and Innovation Drivers
- 7.1.3 Infrastructure and Investment Drivers
- 7.1.4 Regulatory and Policy Drivers
- 7.2 Market Restraints
- 7.2.1 Cost and Affordability Constraints
- 7.2.2 Technology and Adoption Barriers
- 7.2.3 Supply Chain and Operational Constraints
- 7.3 Market Challenges
- 7.3.1 Competitive Pressure and Margin Erosion
- 7.3.2 Skills, Infrastructure and Implementation Gaps
- 7.4 Emerging Market Opportunities
- 7.5 Market Dynamics Impact and Time-Horizon Assessment
Chapter 8 Australia Blow Molding Tools Value Chain Analysis
- 8.1 Industry Value Chain Overview
- 8.2 Upstream Suppliers and Critical Inputs
- 8.3 Technology and Component Providers
- 8.4 Manufacturing or Service Delivery
- 8.5 Distribution, Channel Partners and Integrators
- 8.6 Downstream Applications and End Users
- 8.7 Value Addition and Profit Pools
- 8.8 Vertical Integration and Outsourcing
- 8.9 Supplier Concentration and Risk
- 8.10 Supply Chain Localization and Resilience
Chapter 9 Australia Blow Molding Tools Market Regulations and Policies
- 9.1 Relevant Laws, Standards and Compliance Frameworks
- 9.2 Product, Service, Safety and Quality Requirements
- 9.3 Government Policies, Incentives and Subsidies
- 9.4 Imports, Exports and Trade Barriers
- 9.5 Public Procurement and Local Content Requirements
- 9.6 Environmental and Sustainability Compliance
- 9.7 Upcoming Policy Changes and Market Implications
Chapter 10 Australia Blow Molding Tools Market Hotspots and Opportunities
- 10.1 Market Opportunity Mapping and Growth Hotspots
- 10.2 High-Growth Applications and Customer Groups
- 10.3 Underserved Markets and White-Space Opportunities
- 10.4 Emerging Technology and Product Opportunities
- 10.5 New Capacity and Investment Hotspots
- 10.6 Market Entry and Expansion Opportunities
- 10.7 Distribution and Partnership Opportunities
- 10.8 Near-Term and Long-Term Commercial Potential
- 10.9 Opportunity Attractiveness and Execution Risks
Chapter 11 Australia Blow Molding Tools Market Outlook, 2025-2035
- 11.1 Market Size and Analysis
- 11.1.1 Revenue (Market Measurement: 2025: USD 391.5 million → 2035: USD 596.9 million)
- 11.1.2 Market Volume and Quantity Sold
- 11.1.3 Historical Market Size, 2018-2025
- 11.1.4 Base-Year Market Size, 2025
- 11.2 Market Forecast, 2025-2035
- 11.2.1 Revenue Forecast to 2035
- 11.2.2 Volume Forecast to 2035
- 11.2.3 CAGR and Year-on-Year Growth
- 11.2.4 Incremental Revenue Opportunity
- 11.3 Forecast Assumptions and Scenario Analysis
- 11.3.1 Base-Case Forecast
- 11.3.2 Optimistic and Conservative Scenarios
- 11.3.3 Technology, Pricing and Policy Sensitivities
- 11.4 Market Attractiveness and Growth Outlook
Chapter 12 Australia Blow Molding Tools Market Segmentation and Outlook
- 12.1 Segmentation Summary and Market Shares, 2025
- 12.2 Largest and Fastest-Growing Segments
- 12.3 By Product Type - Market Size and Forecast, 2025-2035
- 12.3.1 Segment Definition and Scope
- 12.3.2 Historical Market Size, 2018-2025
- 12.3.3 Revenue Forecast, 2025-2035
- 12.3.4 Volume Forecast, 2025-2035
- 12.3.5 Base-Year Market Share, 2025
- 12.3.6 Segment CAGR and Growth Drivers
- 12.3.7 Subsegment Market Size and Forecast
- 12.3.7.1 Blow Moulding Machines
- 12.3.7.2 Moulds and Tooling
- 12.3.7.3 Dedicated Parts and Accessories
- 12.3.7.4 Dedicated Ancillary Equipment
- 12.3.8 Subsegment Pricing and Adoption Trends
- 12.3.9 Leading Suppliers and Competition
- 12.3.10 Regional Demand and Opportunities
- 12.4 By End-Use Industry - Market Size and Forecast, 2025-2035
- 12.4.1 Segment Definition and Scope
- 12.4.2 Historical Market Size, 2018-2025
- 12.4.3 Revenue Forecast, 2025-2035
- 12.4.4 Volume Forecast, 2025-2035
- 12.4.5 Base-Year Market Share, 2025
- 12.4.6 Segment CAGR and Growth Drivers
- 12.4.7 Subsegment Market Size and Forecast
- 12.4.7.1 Food and Beverage Packaging
- 12.4.7.2 Personal Care and Household Products
- 12.4.7.3 Pharmaceutical Packaging
- 12.4.7.4 Technical and Non-Food Applications
- 12.4.8 Subsegment Pricing and Adoption Trends
- 12.4.9 Leading Suppliers and Competition
- 12.4.10 Regional Demand and Opportunities
- 12.5 By Application - Market Size and Forecast, 2025-2035
- 12.5.1 Segment Definition and Scope
- 12.5.2 Historical Market Size, 2018-2025
- 12.5.3 Revenue Forecast, 2025-2035
- 12.5.4 Volume Forecast, 2025-2035
- 12.5.5 Base-Year Market Share, 2025
- 12.5.6 Segment CAGR and Growth Drivers
- 12.5.7 Subsegment Market Size and Forecast
- 12.5.7.1 Small Containers up to 2 Litres
- 12.5.7.2 Containers above 2 to 20 Litres
- 12.5.7.3 Containers above 20 Litres
- 12.5.7.4 Non-Container Hollow Components
- 12.5.8 Subsegment Pricing and Adoption Trends
- 12.5.9 Leading Suppliers and Competition
- 12.5.10 Regional Demand and Opportunities
- 12.6 By Technology - Market Size and Forecast, 2025-2035
- 12.6.1 Segment Definition and Scope
- 12.6.2 Historical Market Size, 2018-2025
- 12.6.3 Revenue Forecast, 2025-2035
- 12.6.4 Volume Forecast, 2025-2035
- 12.6.5 Base-Year Market Share, 2025
- 12.6.6 Segment CAGR and Growth Drivers
- 12.6.7 Subsegment Market Size and Forecast
- 12.6.7.1 Extrusion Blow Moulding
- 12.6.7.2 Injection-Stretch Blow Moulding
- 12.6.7.3 Injection Blow Moulding
- 12.6.7.4 Specialty Hybrid Blow Moulding
- 12.6.8 Subsegment Pricing and Adoption Trends
- 12.6.9 Leading Suppliers and Competition
- 12.6.10 Regional Demand and Opportunities
- 12.7 Segment Growth Comparison
- 12.8 Segment Attractiveness and Priority Matrix
Chapter 13 Australia Blow Molding Tools End-Use and Application Market Outlook
- 13.1 End-Use Industry and Customer Demand Structure
- 13.2 Leading Applications and Customer Groups
- 13.3 End-Use Market Size, Share and Forecast
- 13.4 Major End-Use Industry Deep Dives
- 13.4.1 Customer Requirements and Use Cases
- 13.4.2 Demand and Replacement Cycles
- 13.4.3 Technical and Regulatory Considerations
- 13.4.4 Purchasing and Procurement Models
- 13.4.5 Leading Vendors and Distribution Channels
- 13.4.6 Forecast and Commercial Opportunities
- 13.5 Emerging Applications and Cross-Segment Demand
- 13.6 End-Use Industry Investment Priorities
Chapter 14 Australia Blow Molding Tools Geographic Market Outlook, 2025-2035
- 14.1 Domestic Market Distribution and Demand Clusters
- 14.2 State- or Province-Wise Market Size and Forecast, 2025-2035
- 14.3 City and Metropolitan Market Outlook
- 14.4 Industrial, Manufacturing and Commercial Clusters
- 14.5 Geographic Concentration of Key End Users
- 14.6 Local Pricing and Purchasing Differences
- 14.7 Domestic Production Facilities and Capacity Map
- 14.8 Local Infrastructure and Project Pipeline
- 14.9 State-Level Policy and Incentive Differences
- 14.10 Subnational Investment Hotspots and Opportunities
- 14.11 Distribution and Logistics Networks
- 14.12 Domestic Competitive Footprint
Chapter 15 Australia Blow Molding Tools Technology, Innovation and Sustainability Outlook
- 15.1 Technology Landscape and Maturity
- 15.2 Product, Process and Service Innovation
- 15.3 AI, Automation and Digital Tools in the Industry
- 15.4 Technology Adoption and Performance Benchmarking
- 15.5 Innovation Pipeline and R&D Investment
- 15.6 Patent and Intellectual Property Trends
- 15.7 Energy Efficiency and Resource Management
- 15.8 Sustainability, Recycling and Circularity
- 15.9 Technology Roadmap, 2025-2035
- 15.10 Risks of Obsolescence and Technology Substitution
Chapter 16 Australia Blow Molding Tools Market Key Strategic Imperatives
- 16.1 Growth and Market Entry Priorities
- 16.2 High-Return Products and Segments
- 16.3 Pricing, Profitability and Cost Optimization
- 16.4 Technology Investment and Product Differentiation
- 16.5 Supply Chain Localization and Resilience
- 16.6 Distribution and Customer Acquisition
- 16.7 Partnership, Acquisition and Capacity Strategy
- 16.8 Regional Expansion Priorities
- 16.9 Short-, Medium- and Long-Term Actions
Chapter 17 Competition Outlook
- 17.1 Industry Competition Characteristics
- 17.2 Market Structure and Concentration
- 17.3 Market Share and Competitive Positioning, 2025
- 17.4 Company-Wise Revenue and Product Benchmarking
- 17.5 Production and Service Capacity Benchmarking
- 17.6 Technology, Pricing and Differentiation
- 17.7 Regional Footprint and Distribution Strength
- 17.8 Mergers, Acquisitions and Strategic Alliances
- 17.9 New Entrants and Competitive Threats
- 17.10 Porter's Five Forces and Industry Attractiveness
- 17.11 Competitive Outlook, 2025-2035
Chapter 18 Company Profiles
- 18.1 Company Coverage and Selection Criteria
- 18.2 Krones
- 18.2.1 Business Description
- 18.2.2 Company Ownership and Geographic Presence
- 18.2.3 Product and Service Portfolio
- 18.2.4 Manufacturing and Operating Footprint
- 18.2.5 Production Capacity and Expansion Plans
- 18.2.6 Financial Performance and Investment
- 18.2.7 Market Share and Competitive Position
- 18.2.8 Technology and Innovation Capabilities
- 18.2.9 Strategic Alliances or Partnerships
- 18.2.10 Recent Developments
- 18.2.11 Growth Strategy and Outlook
- 18.3 Sidel
- 18.4 Nissei ASB Machine
- 18.5 Aoki Technical Laboratory
- 18.6 SMC Corporation
- 18.7 Graham Engineering
- 18.8 W. Müller
- 18.9 MEPER
- 18.10 Serac
- 18.11 Telford Smith
- 18.12 Other Relevant Market Participants
Note: Every listed company is profiled on the structure shown under the first company. The company list is preliminary and may change based on research findings, market developments, data availability and client requirements.
Chapter 19 Disclaimer
- 19.1 Research and Forecast Disclaimer
- 19.2 Data Source and Estimation Limitations
Note: The depth of individual sections depends on data availability for this market. Volume, capacity, trade and other unit-based metrics are included where applicable.

