
Inter-island cargo and export lanes define the market
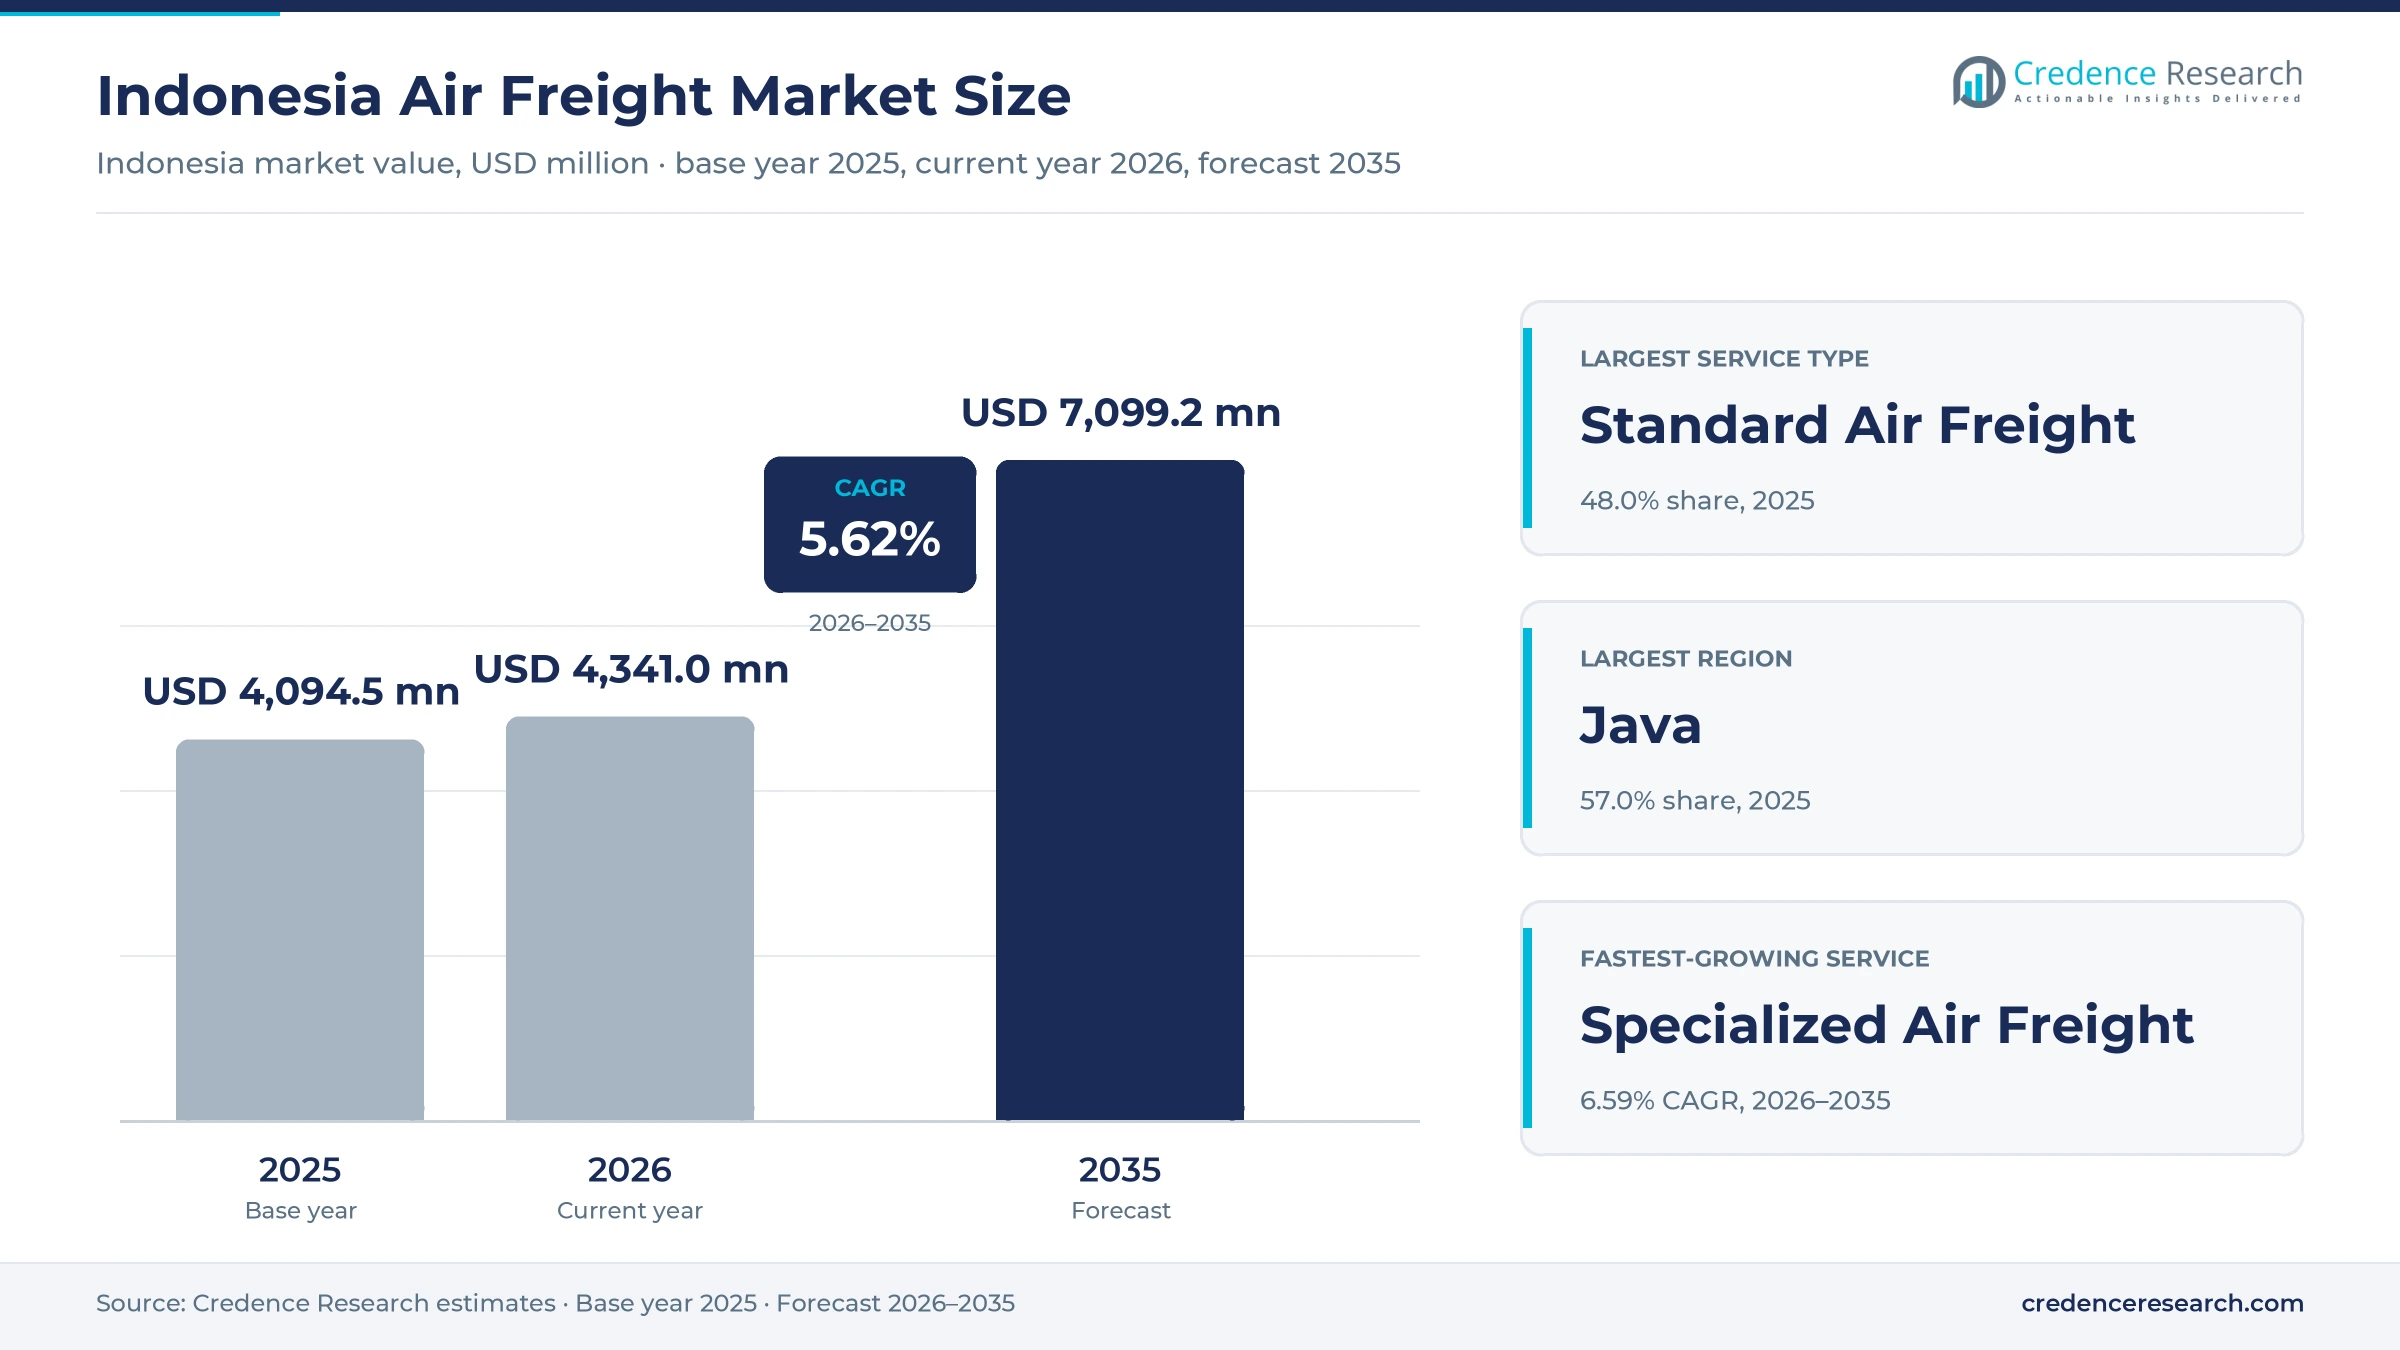
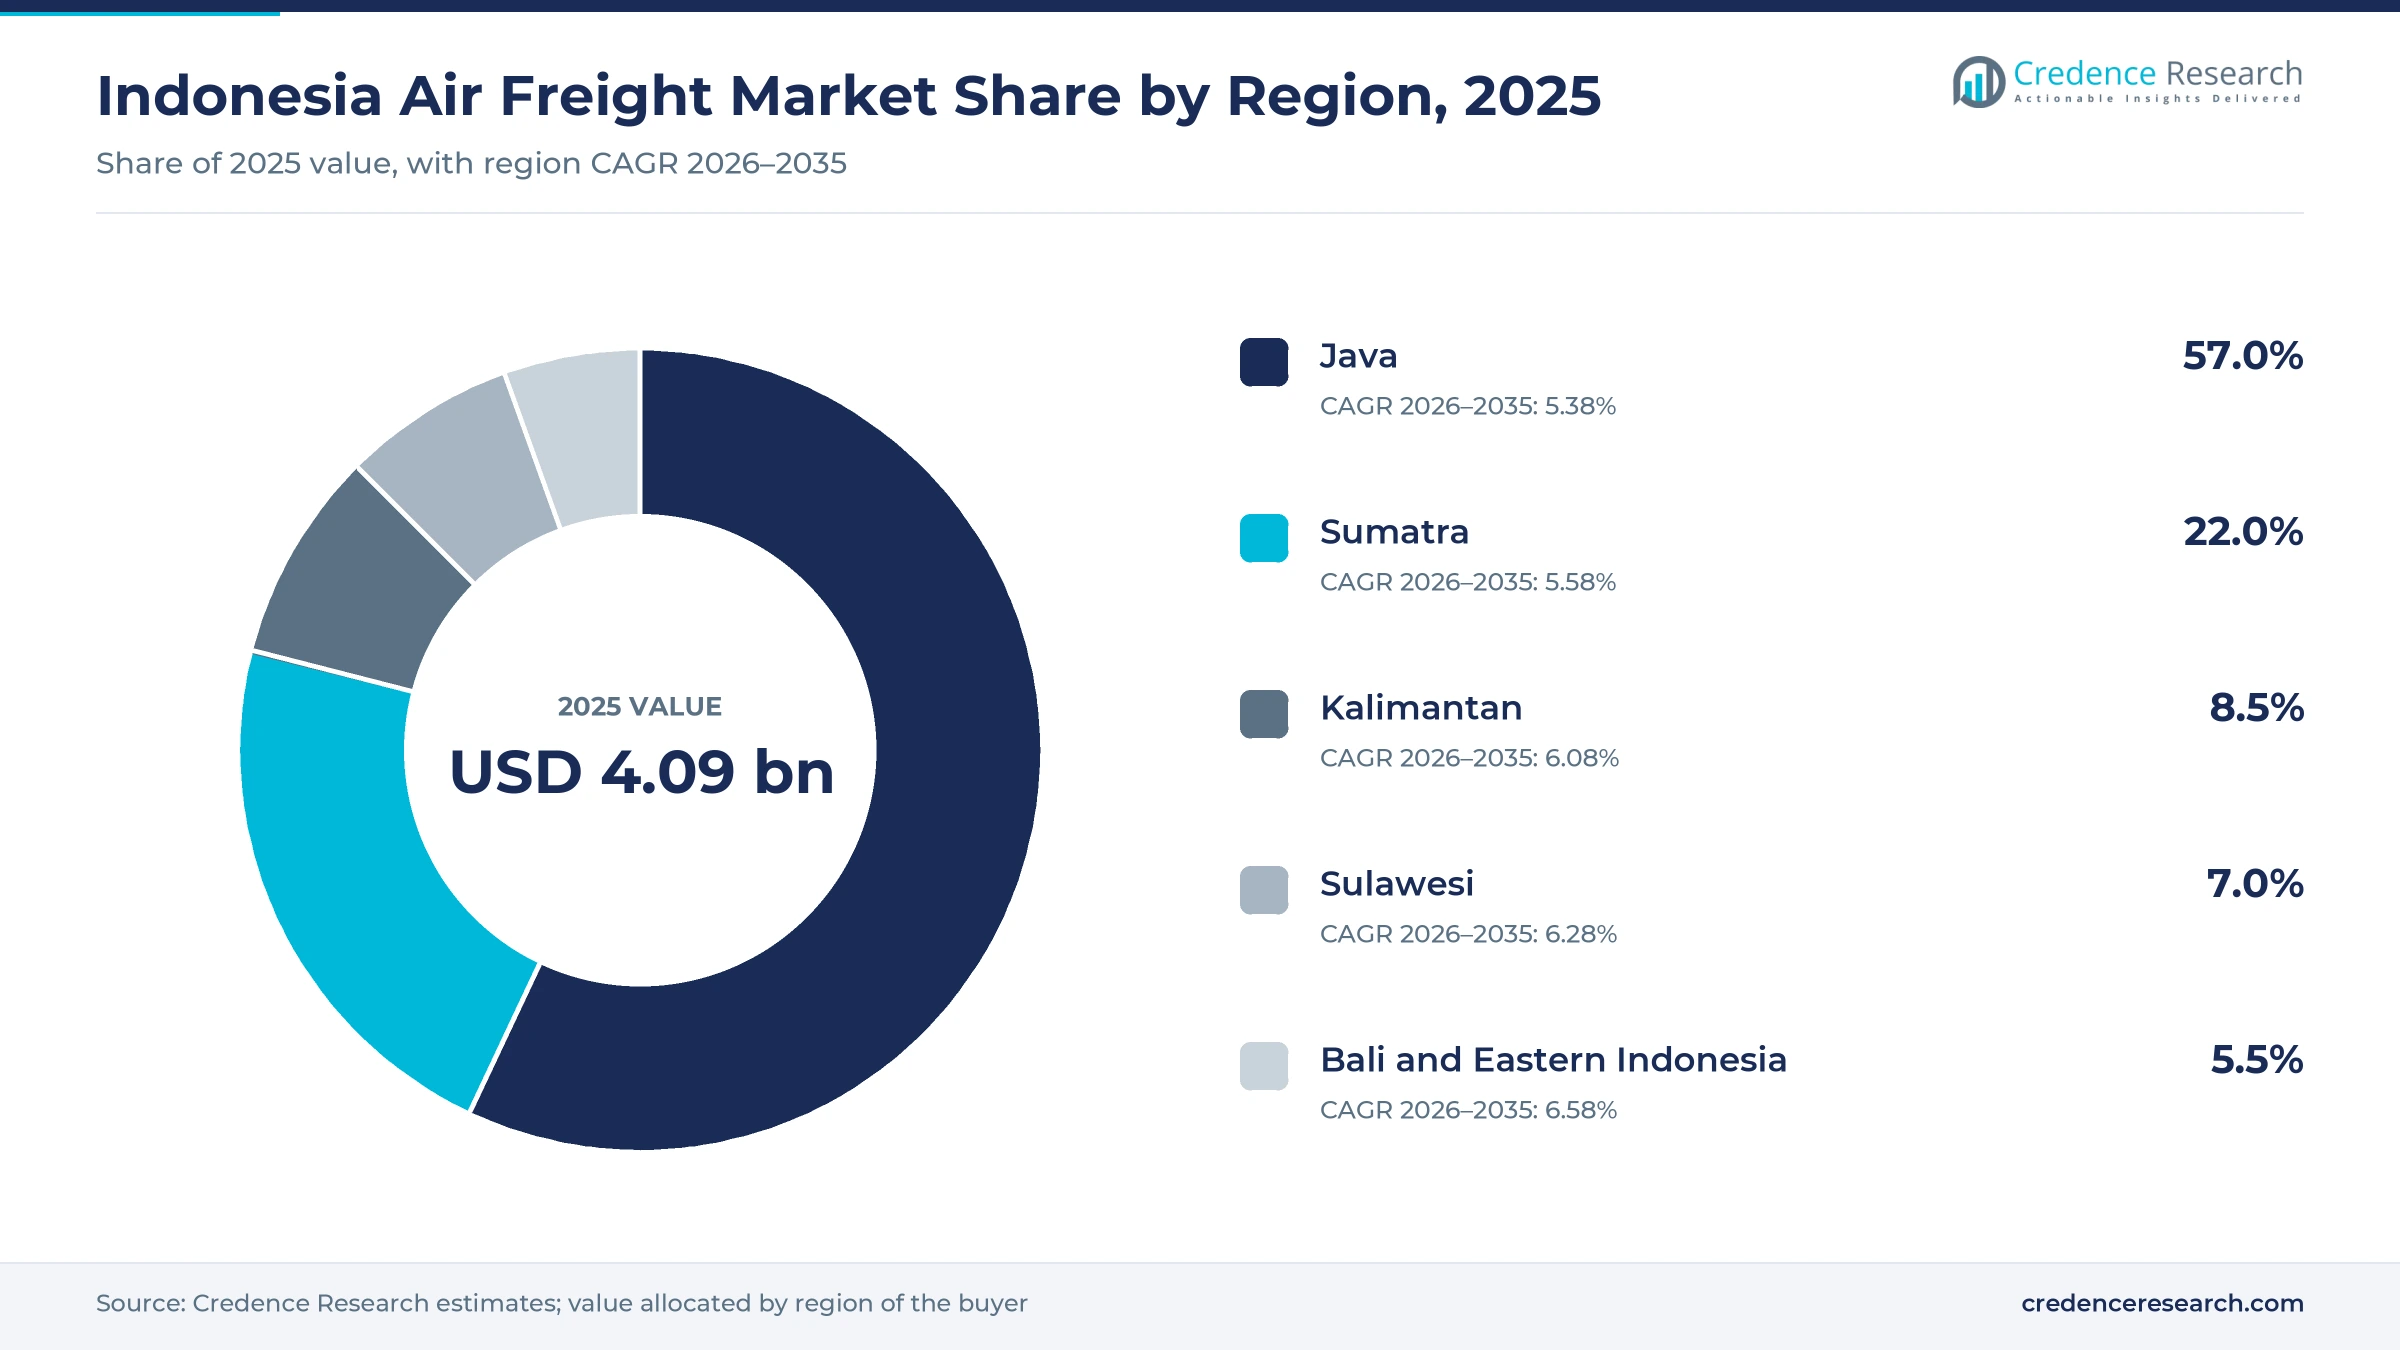
The Indonesia air freight market was valued at USD 4.09 billion in 2025 and is projected to increase from USD 4.34 billion in 2026 to USD 7.10 billion by 2035, registering a CAGR of 5.62% during 2026–2035. Demand comes from online merchants shipping between islands, electronics and semiconductor supply chains, and fresh seafood sold to Asian buyers. Java held the largest regional share, 57.0% in 2025, because Soekarno-Hatta airport and Juanda airport concentrate cargo, manufacturing and consumer spending on the island. Bali and Eastern Indonesia is the fastest-growing region at 6.58% a year, helped by direct export links from Denpasar and by new international airport designations. A major commercial change came in 2025, when DHL Express opened a Surabaya gateway and Garuda Indonesia moved cargo booking onto a digital platform. Domestic tonnage rose 9.07% in 2024, according to Statistics Indonesia data, which shows how much inter-island trade relies on aircraft.
What does Indonesia air freight cover, and how do shippers buy it?
The market counts spending on cargo flown within Indonesia and to or from the country, including airline cargo sales, forwarding, integrated express and airport cargo handling. Shippers buy through forwarders, directly from airline cargo desks, or through door-to-door express accounts with integrators, and large buyers usually run several of these channels at once.
Sea freight, trucking without an air leg and purely domestic courier work on the ground are excluded from the count. The value chain runs from the shipper through a forwarder or regulated agent, a terminal operator, the carrier and customs, before a final delivery partner completes the shipment.
Indonesia Air Freight Market Insights
- The market grows from USD 4.09 billion in 2025 to USD 7.10 billion by 2035, a 5.62% CAGR built on inter-island parcels, electronics inputs and perishable exports.
- Java held 57.0% of 2025 value, because Soekarno-Hatta alone handled 195,224 tons of international cargo from January through August 2026, according to Statistics Indonesia data.
- Standard Air Freight led service types with 48.0% of 2025 value, while Specialized Air Freight is the fastest type at 6.59% a year.
- Decree KM 37 of 2025 named 36 international airports, including five in Kalimantan and three in Sulawesi, which widens the map for direct export cargo.
- DHL Express invested more than EUR 9 million in a Surabaya gateway in December 2025, and FedEx widened dangerous goods acceptance, sharpening competition for high-value cargo.
General cargo leads while specialized freight grows fastest
Why general cargo leads and specialized freight grows fastest
Based on service type, the market is categorized into Standard Air Freight, Express and Time-Definite Air Freight, Specialized Air Freight and Charter Air Freight. Standard Air Freight led with 48.0% of 2025 value because consolidated general cargo carries much of the 666.4 thousand tons of domestic freight that Statistics Indonesia recorded in 2024. Specialized Air Freight grows fastest at 6.59% a year, as FedEx widened dangerous goods acceptance in Greater Jakarta and Batam on Oct. 1, 2025, from Class 9 alone to all classes except explosives and radioactive material.
How domestic tonnage and export lanes split the market
Based on shipment flow, the market is categorized into Domestic Inter-Island, International Inbound, International Outbound and Transshipment. Domestic Inter-Island led with 38.0% of 2025 value because domestic cargo reached 666.4 thousand tons in 2024, while international cargo reached 272,578 tons in the first eight months of 2026, according to Statistics Indonesia data cited by GoodStats. International Outbound grows fastest at 6.09% a year, as the same data show 144,048 tons loaded against 128,530 tons unloaded, and FedEx now sends Bali exports directly to Singapore.
Why belly space leads and integrators gain ground
Based on aircraft capacity type, the market is categorized into Passenger Belly Capacity, Dedicated Freighter Capacity, Integrator-Controlled Capacity and Chartered Capacity. Passenger Belly Capacity led with 52.0% of 2025 value because Garuda Indonesia sells lift on scheduled lanes from Jakarta to Singapore, Tokyo, Jeddah, Shanghai and Sydney, while MY Indo Airlines listed only a narrow-body freighter fleet in 2022. Integrator-Controlled Capacity grows fastest at 6.51% a year, as DHL Express opened a 10,000-square-meter Surabaya gateway in December 2025, with dedicated flights to Singapore that use unit load devices built on site.
How online retail and healthcare shape end-use demand
Based on end-use industry, the market is categorized into E-Commerce and Retail, Electronics and High Technology, Healthcare and Pharmaceuticals, Perishables and Food, and Industrial and Automotive. E-Commerce and Retail led with 34.0% of 2025 value because online sales were projected to reach US$71 billion in 2025, according to the e-Conomy SEA study by Google, Temasek and Bain. Healthcare and Pharmaceuticals grows fastest at 6.57% a year, as a 2025 regulation from the food and drug agency BPOM tightened rules for vaccines and other temperature-sensitive products that also need pharmaceutical cold chain packaging.
| Segment Group | Leading Sub-segment | Share, 2025 | Fastest-growing Sub-segment | CAGR, 2026–2035 |
|---|---|---|---|---|
| By Service Type | Standard Air Freight | 48.0% | Specialized Air Freight | 6.59% |
| By Shipment Flow | Domestic Inter-Island | 38.0% | International Outbound | 6.09% |
| By Aircraft Capacity Type | Passenger Belly Capacity | 52.0% | Integrator-Controlled Capacity | 6.51% |
| By End-Use Industry | E-Commerce and Retail | 34.0% | Healthcare and Pharmaceuticals | 6.57% |
Request a Free Sample
Fill in your details and we'll send you a free sample report.
- Sample data tables & charts
- Research methodology
Commerce, electronics and new gateways lift cargo demand
Digital commerce pushes time-definite distribution
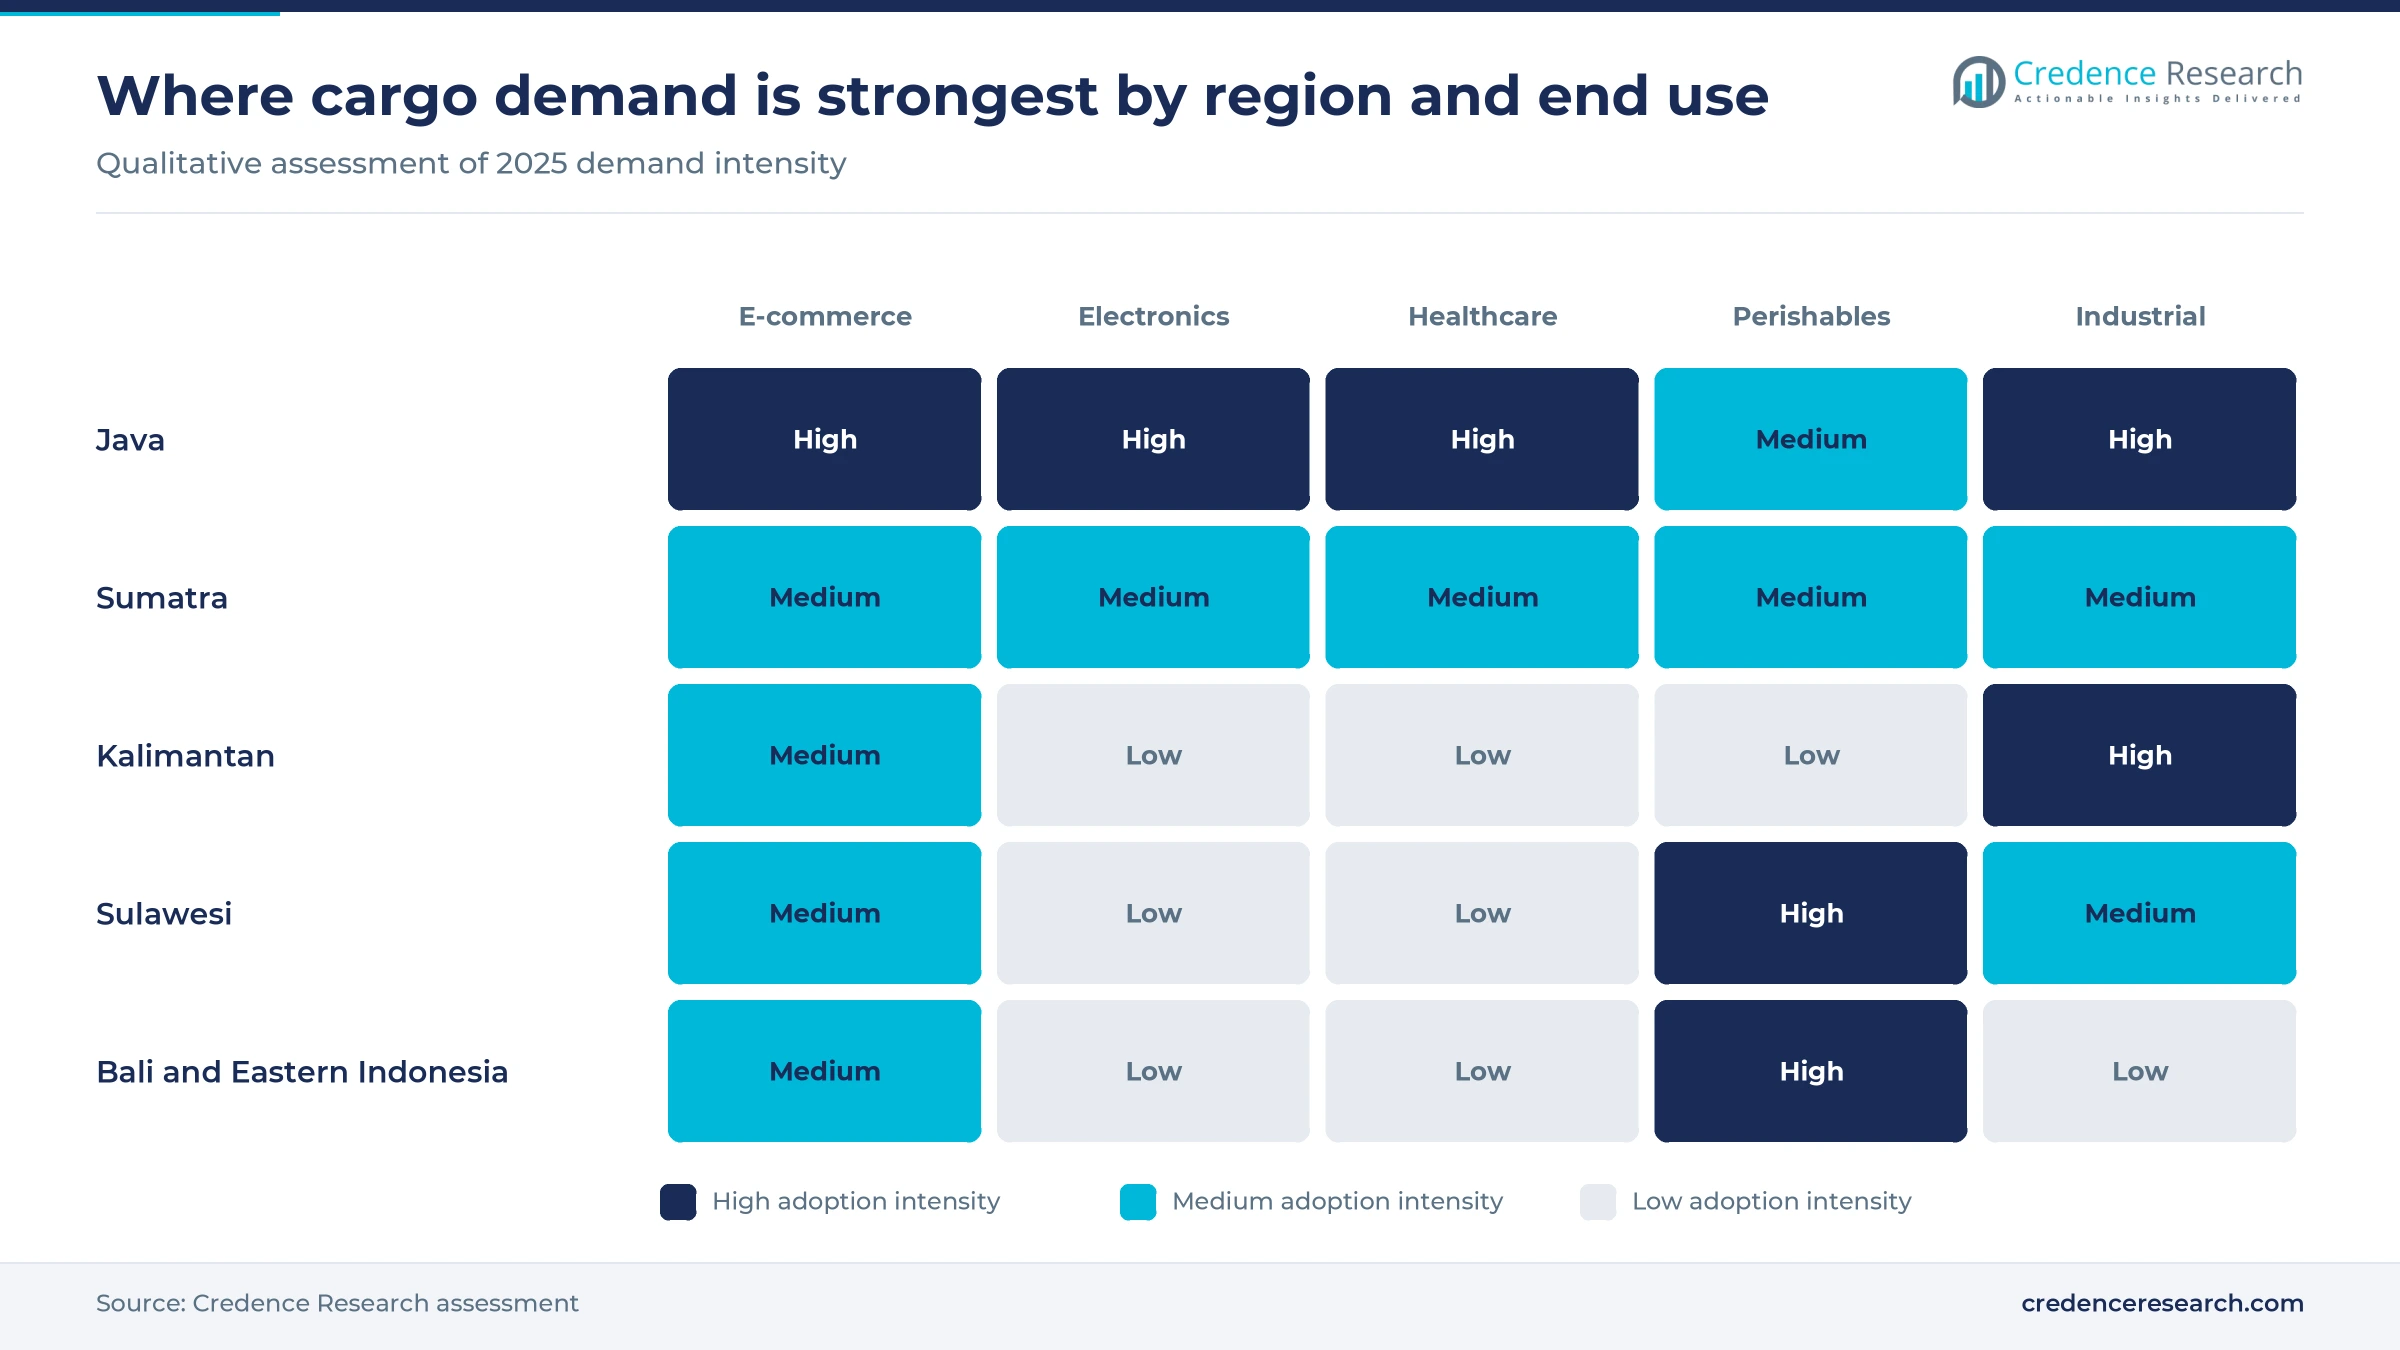
Online retail creates small, frequent parcels that island geography makes difficult to serve by sea within promised delivery windows. Google, Temasek and Bain projected in November 2025 that online sales would grow more than 14% to US$71 billion that year. The same study counted 2.6 billion video commerce transactions, up 90%, and 800 thousand online sellers, up 75%. Teleport, the AirAsia cargo partner active in Indonesia, expects online shipments to rise from 11% to 20% of Southeast Asian air cargo volume by 2029, according to Stat Times in April 2025. As a result, E-Commerce and Retail holds 34.0% of 2025 value. Trade Ministry regulation 31 of 2023 sets a US$100 minimum for direct foreign sales, which favors domestic sellers and their inter-island parcels.
High-value electronics trade relies on speed
Electronics supply chains pay for air transport because their components carry high value and interruptions stop assembly lines. Statistics Indonesia counted semiconductor imports of about US$4.87 billion from January through November 2025, nearly double the US$2.33 billion of 2020, according to Investortrust. Industry Minister Agus Gumiwang Kartasasmita cited annual mobile phone output of 30 million to 60 million units at a January 2026 summit in Bandung, and Infineon runs assembly and testing in Batam. Carriers are adapting their products to this demand, because FedEx now accepts lithium batteries under wider dangerous goods rules. DHL Express also launched Heavy Weight Express in June 2026, carrying up to 1,000 kilograms per piece for technology and machinery shippers.
Island geography and new gateways support cargo flights
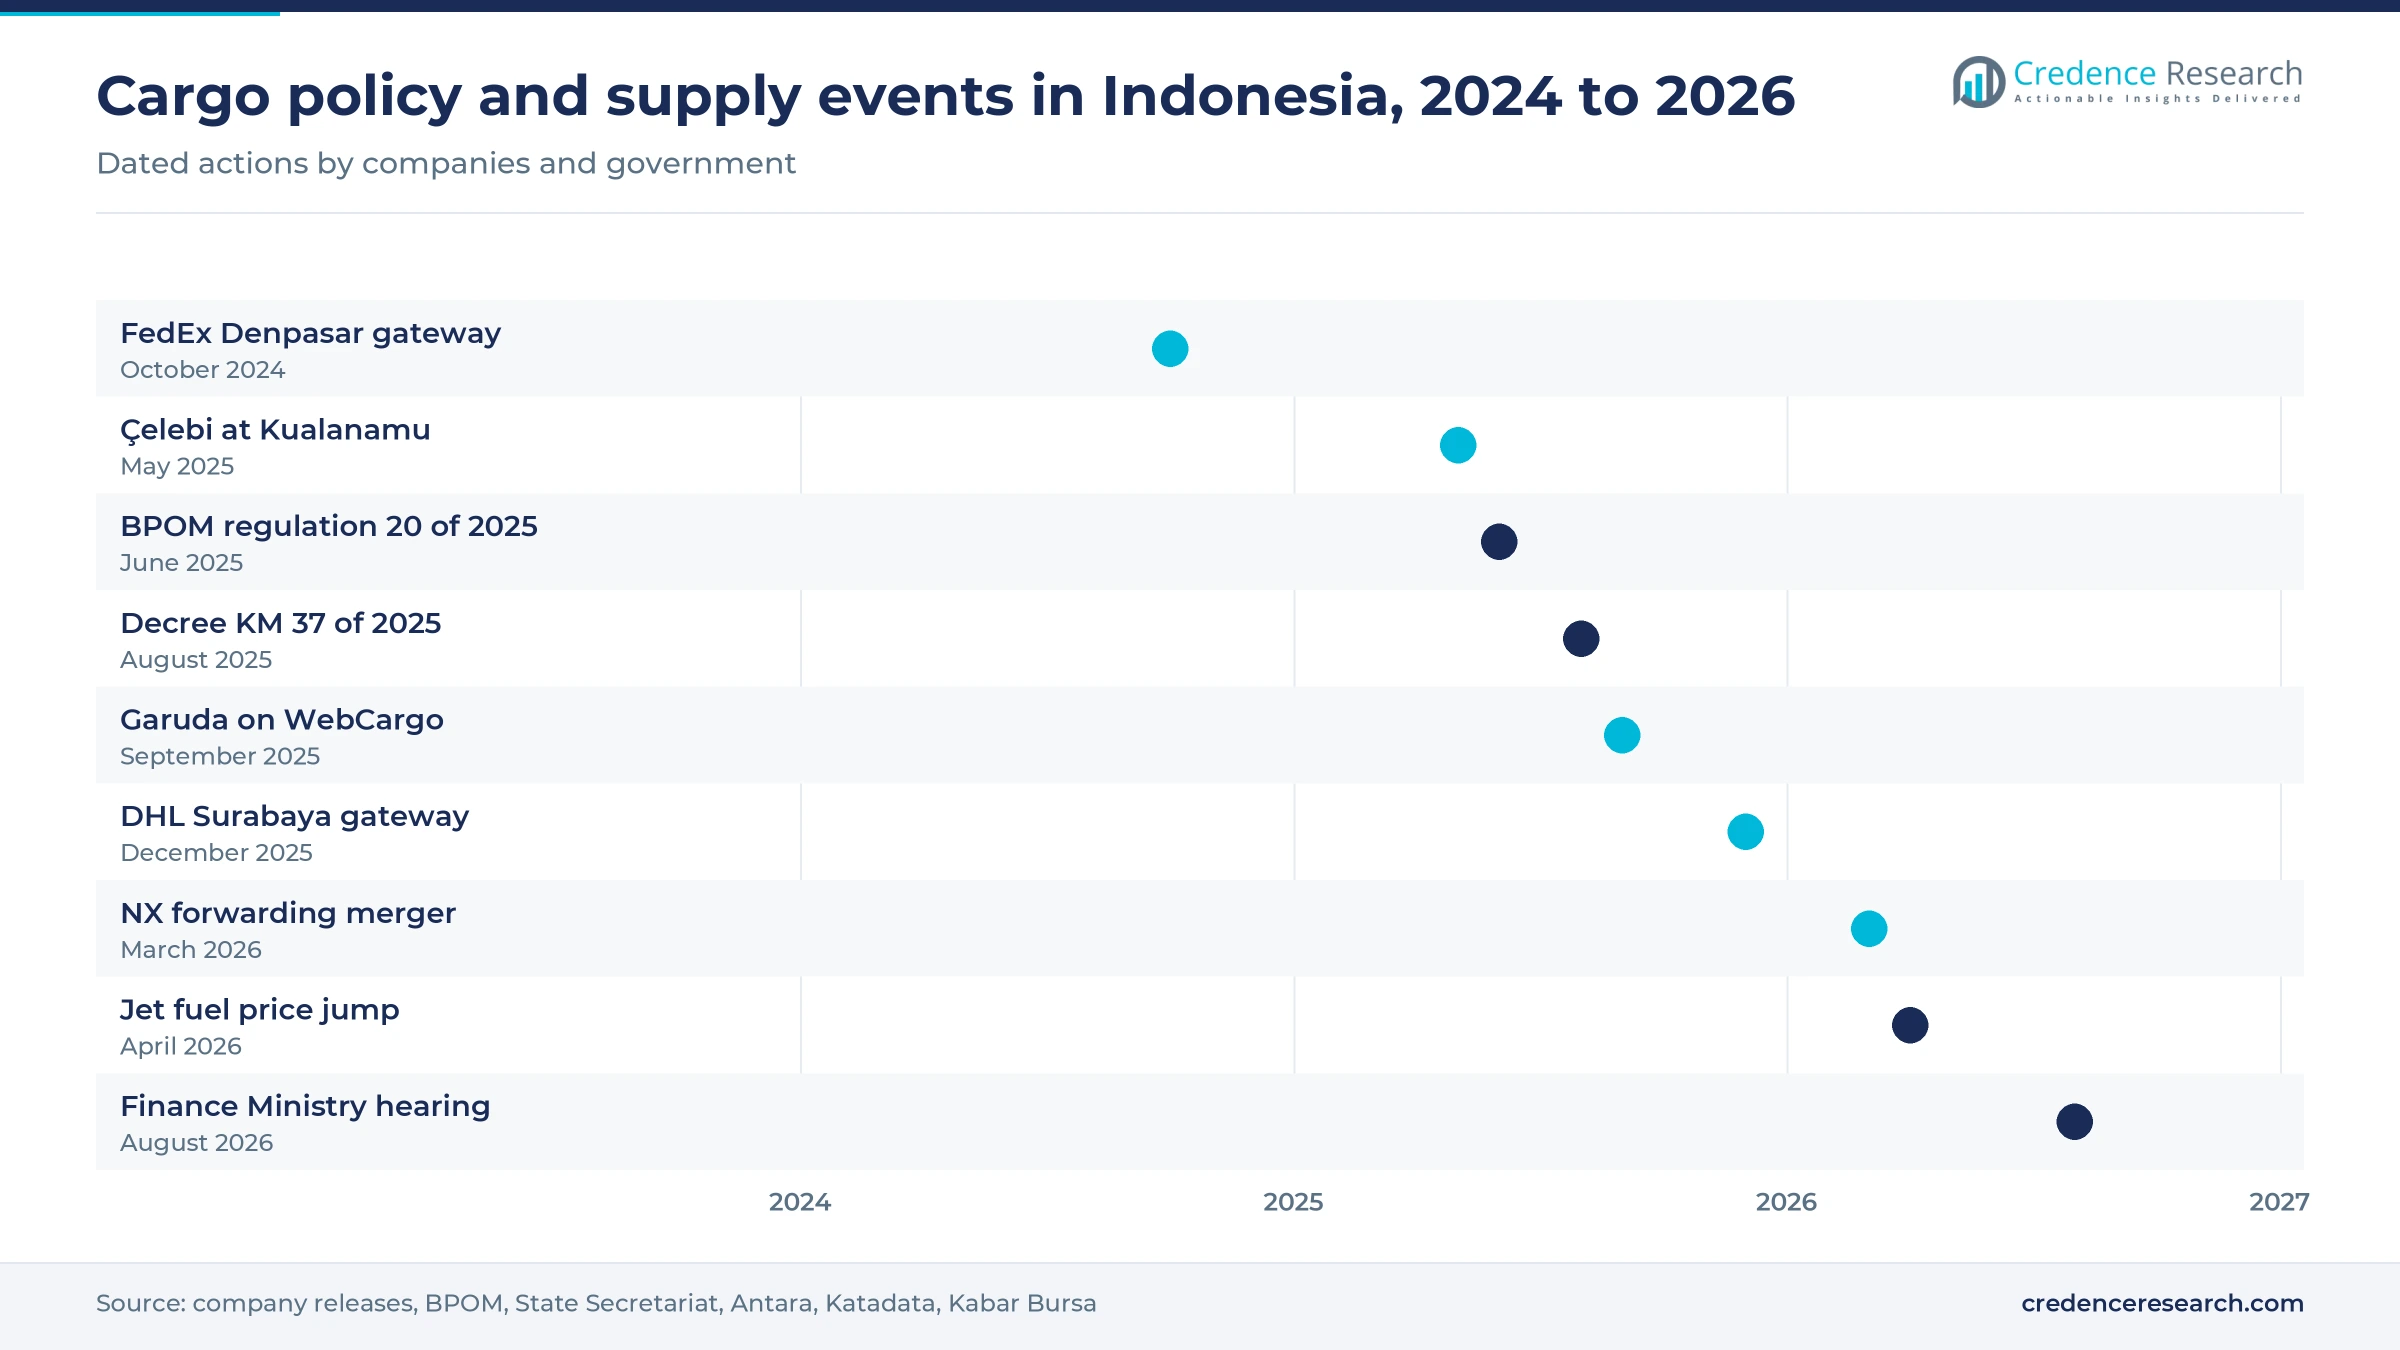
Aircraft remain the practical link for urgent goods between thousands of islands, and airport policy now widens that network. Domestic air cargo reached 666.4 thousand tons in 2024, up 9.07%, according to Supply Chain Indonesia analysis of Statistics Indonesia data. Transportation Ministry decree KM 37 of 2025 named 36 international airports, including five in Kalimantan, three in Sulawesi and eight across Nusa Tenggara, Maluku and Papua. IDX Channel reported in September 2025 that the ministry subsidizes 44 pioneer cargo routes with Rp108.40 billion, plus Rp7.23 billion for 1,583 drums of cargo fuel. Terminal investment is following, since Çelebi Aviation began running an 8,000-square-meter terminal at Kualanamu in May 2025, after that site handled 58,000 tons.
Express gateways bring direct service beyond Jakarta
Integrators are moving customs clearance and aircraft loading closer to exporters, which cuts transit time and opens new shipper groups outside the capital. DHL Express invested more than EUR 9 million in a 10,000-square-meter Surabaya gateway in December 2025, about 15 minutes from Juanda airport, and it runs seven gateways nationwide. FedEx opened a Denpasar gateway in October 2024, so Bali exports fly directly to Singapore rather than through Jakarta, with clearance at the local Ngurah Rai customs office. FedEx also cut one day from inbound delivery to Jakarta, according to its May 2025 anniversary statement. These moves support Integrator-Controlled Capacity, which grows at 6.51% a year as exporters in East Java and Bali gain direct access.
Digital booking and forwarder mergers reshape the market
Shift toward digital booking and paperless cargo
Cargo sales in Indonesia are shifting from phone and email quotes toward instant online booking, which changes how forwarders compare carriers. Garuda Indonesia made its capacity available exclusively through WebCargo by Freightos in September 2025, giving about 10,000 forwarder offices live pricing, according to Stat Times. The listed lanes run from Jakarta to five cities and from Denpasar to Sydney, Tokyo Narita and Hong Kong. Çelebi Aviation brought barcode scanners, handheld devices and e-AWB systems to its 8,000-square-meter Kualanamu terminal in 2025, so documents move digitally on the ground as well. DHL Express added case owners and proactive tracking for shipments of up to 3,000 kilograms in June 2026, which shows that visibility has become a selling point for Standard Air Freight and premium products alike.
Rise of larger forwarders through consolidation
Global forwarders are combining their Indonesian units, and this concentrates buying power when they negotiate block space with airlines. Nippon Express merged its air forwarding company into PT NX Lemo Indonesia Logistik on March 1, 2026, placing air and ocean forwarding services in one company, according to Antara. DSV expects to finish integrating Schenker worldwide by the end of 2026, Stat Times reported in February 2026, and its Indonesia page now lists Schenker tools alongside air services. Kuehne+Nagel, active in Indonesia since 1992, bought Wira Logistics in 2018 to build warehousing and distribution for online retail. As a result, large enterprise shippers can place air, ocean and warehousing contracts with fewer partners, while smaller forwarders face tighter margins.
Opening in regulated cold-chain and dangerous goods cargo
Regulated cargo offers an opening for operators that can document temperature and handling, because rules now demand more proof. BPOM regulation 20 of 2025, set on June 24, 2025, adds detailed provisions for cold chain products and covers vaccines and plasma-derived products. Çelebi Aviation offers pharmaceutical and dangerous goods handling at Kualanamu, with Envirotainer stock and ULD repair among its value-added services. FedEx opened most dangerous goods classes to shippers in Greater Jakarta and Batam on Oct. 1, 2025, including medical equipment and chemicals. These steps support Healthcare and Pharmaceuticals at 6.57% a year, and they leave room for certified terminals at second-tier airports such as Makassar, Balikpapan and Manado.
Opportunity in direct perishable exports from outer islands
Direct perishable lanes offer exporters an opportunity to keep fresh goods out of Jakarta transit and to capture better prices abroad. Bali quarantine officials certified Rp4.07 trillion of exports from January through November 2025, with 53,471 fish certificates, according to Antara. Tuna, grouper, mangosteen and cut flowers are among the listed goods, and fish buyers include Taiwan, China, Singapore and Malaysia. Garuda Indonesia now sells digital capacity from Denpasar to Tokyo Narita, Hong Kong and Sydney, which supports these shipments. An earlier Garuda service showed the Manado potential, loading 14 tons of cargo there after 6 tons of Bali tuna on a Narita flight in February 2022, according to Kontan. Better chilled facilities would help Bali and Eastern Indonesia, the fastest-growing region in this report.
Fuel, airport fees and thin freighter fleets squeeze margins
Jet fuel swings raise cargo rates
Jet fuel is the most volatile cost for carriers, and it passes quickly into cargo surcharges. Katadata reported that the domestic price at Soekarno-Hatta jumped 72.45% on April 1, 2026, to Rp23,551.08 per liter, while the international price rose 80.32%. The carrier association INACA puts fuel at about 40% of operating costs. A price cut on July 1, 2026, brought only partial relief, because INACA said the rupiah had not recovered. Forwarders and small exporters absorb these swings through shorter rate validity.
Airport charges and uneven weight rules raise logistics costs
Inter-island shippers complain that airport and handling charges stack up before any aircraft departs. The express and logistics association Asperindo raised JASPER, JASTER and ground handling costs, plus inconsistent volumetric weight formulas among airlines, at a Finance Ministry hearing on Aug. 26, 2026, according to Kabar Bursa. Finance Minister Purbaya Yudhi Sadewa backed standardization, and the Transportation Ministry will speed up a regulation on cost components. Until it takes effect, express operators and merchants cannot easily compare or predict their landed air costs.
Carrier lift has not returned to earlier levels
Indonesian carriers have not rebuilt their earlier cargo output, which leaves shippers dependent on foreign airlines and passenger schedules. World Bank data show 870.5 million ton-kilometers in 2023, against 1,131.9 million in 2018. Dedicated lift is thin, since MY Indo Airlines listed only narrow-body Boeing 737 freighters in 2022. This gap affects outer-island shippers most, because belly space on small aircraft limits pallet sizes. Investment in cargo handling equipment can raise throughput, but it cannot replace aircraft.
Volcanic ash and floods interrupt cargo schedules
Natural hazards disrupt schedules and pull scarce aircraft toward emergency work across the archipelago. The Lewotobi Laki-Laki eruption canceled at least two dozen Bali flights on June 18, 2025, according to The Jakarta Post, which delayed any cargo booked in those aircraft. After the Sumatra floods, the armed forces commander reported 17,532.81 tons of aid delivered by Dec. 7, 2025, using air, helicopter and naval assets. Perishable and pharmaceutical shippers face the highest losses, so they increasingly need backup routes and contingency plans.
Java dominates while Eastern Indonesia grows fastest
| Region | Value, 2025 (USD billion) | Share, 2025 | CAGR, 2026–2035 |
|---|---|---|---|
| Java | 2.33 | 57.0% | 5.38% |
| Sumatra | 0.90 | 22.0% | 5.58% |
| Kalimantan | 0.35 | 8.5% | 6.08% |
| Sulawesi | 0.29 | 7.0% | 6.28% |
| Bali and Eastern Indonesia | 0.23 | 5.5% | 6.58% |
Java anchors national cargo through Jakarta and Surabaya
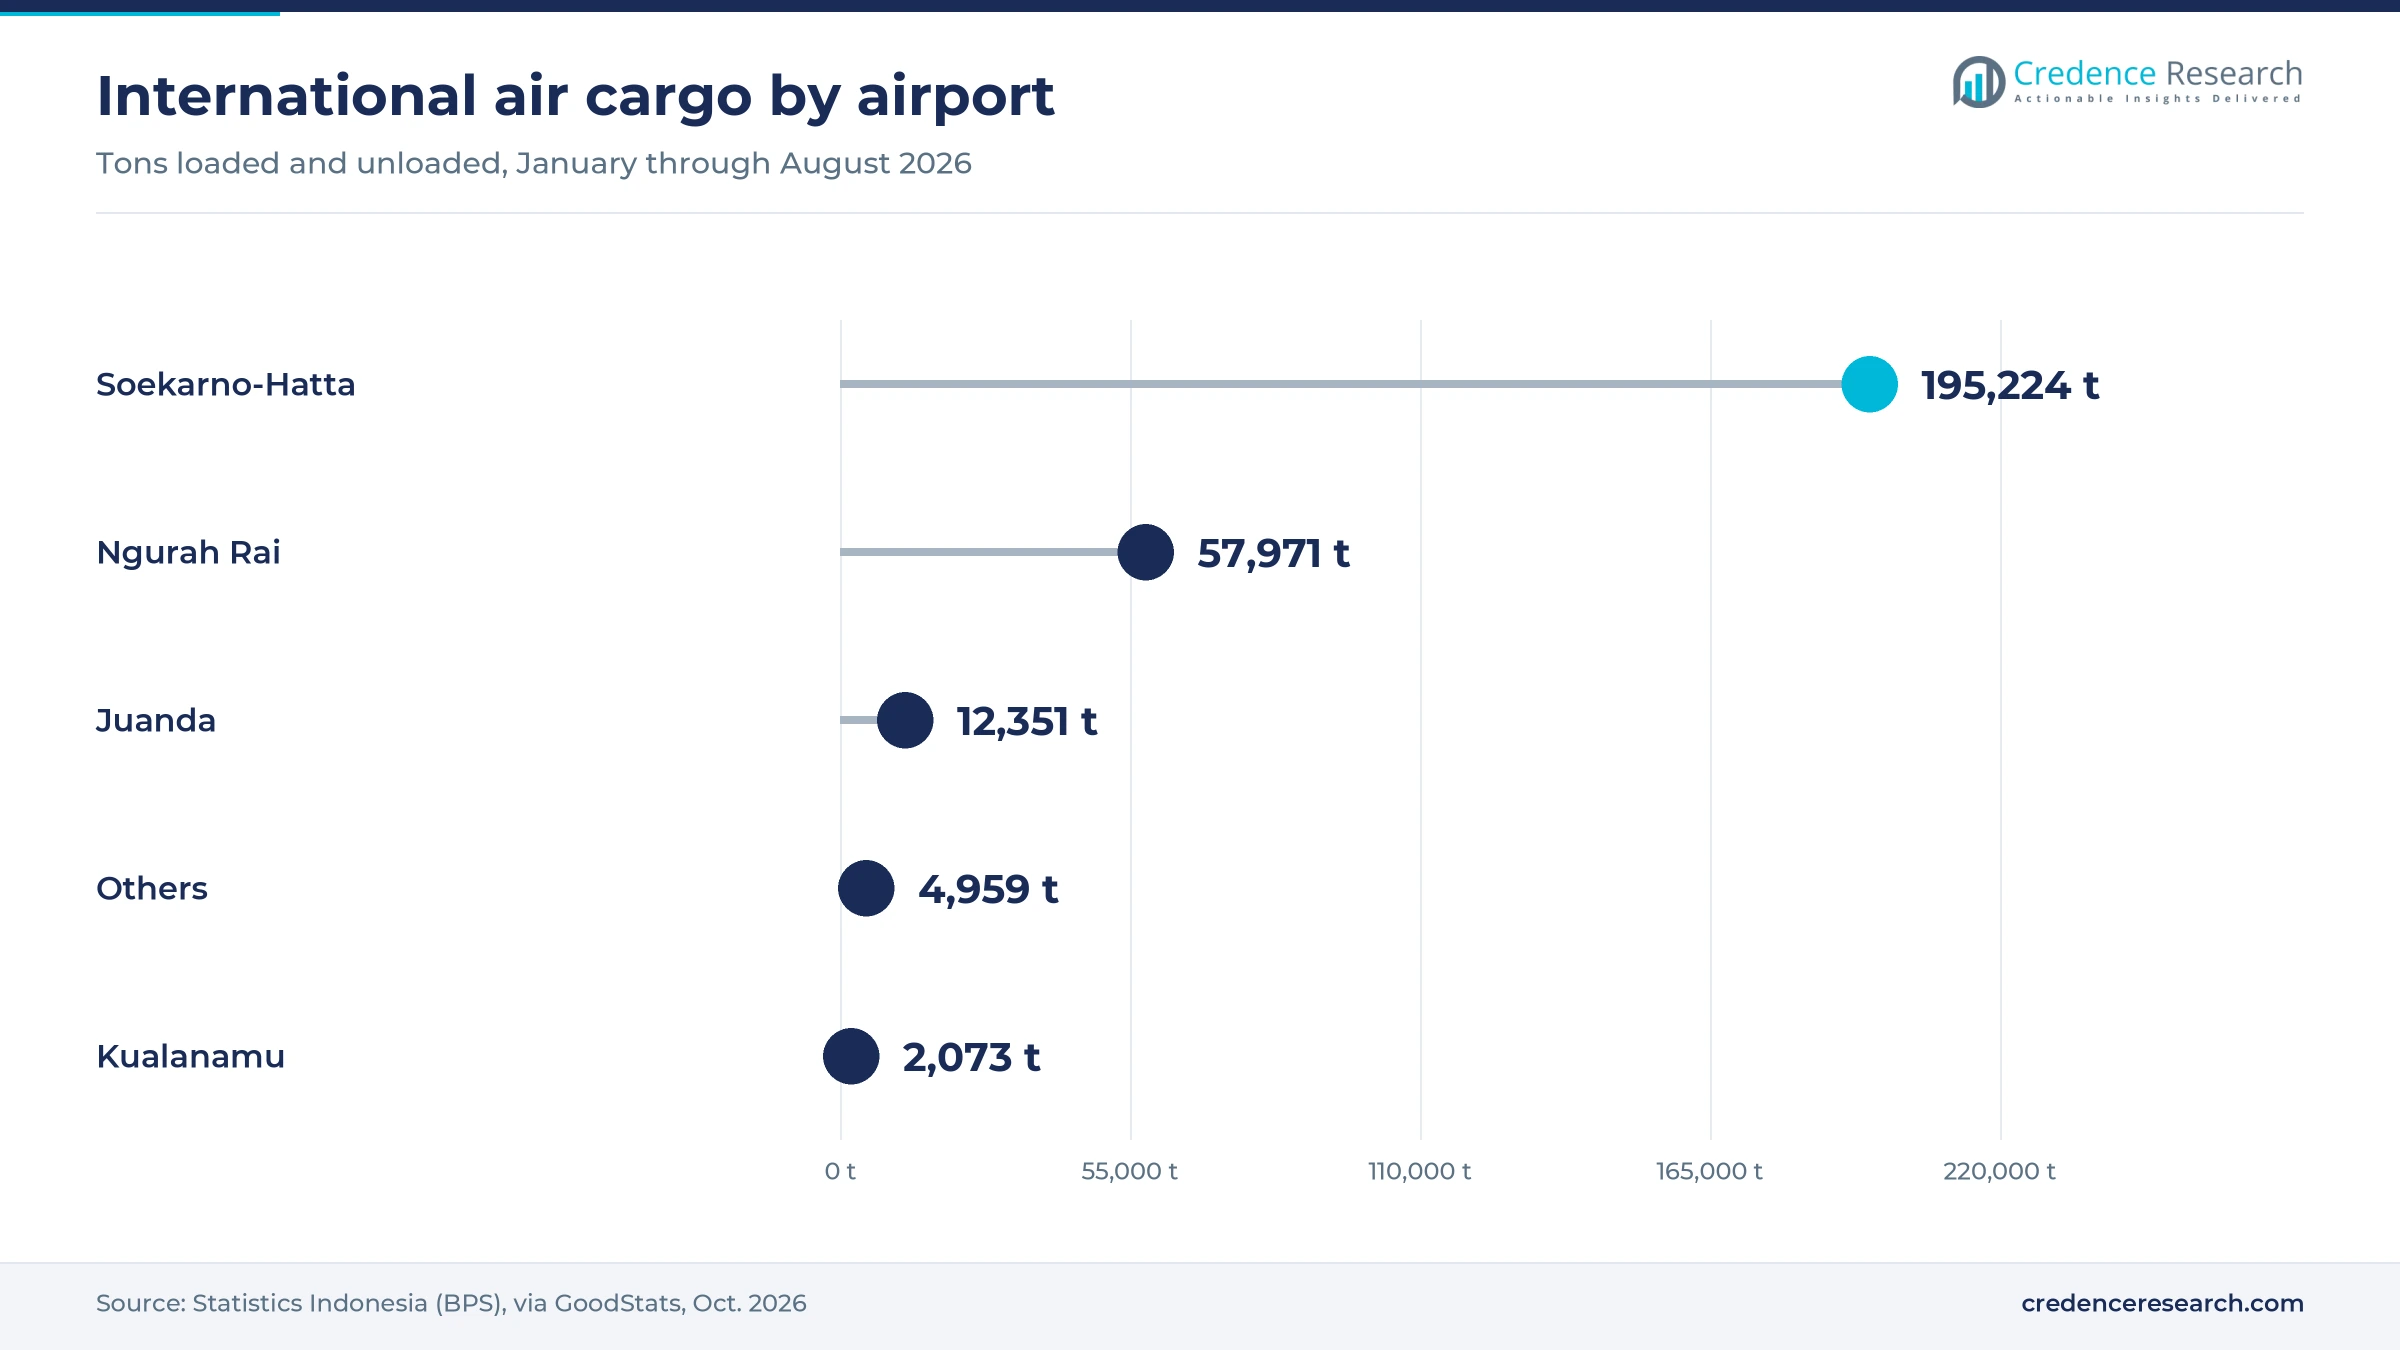
Java held 57.0% of 2025 value and grows at 5.38% a year, which is slower than the outer islands from a far larger base. The island produced 56.93% of national regional output in 2025, according to Statistics Indonesia data published by GoodStats. Soekarno-Hatta handled 195,224 tons of international cargo from January through August 2026, and Juanda handled 12,351 tons. DHL Express strengthened East Java further with its Surabaya gateway, so exporters there can reach Singapore without first trucking goods to Jakarta.
Sumatra leans on Kualanamu and resource trade
Sumatra held 22.0% of 2025 value and grows at 5.58% a year, broadly in line with its 22.22% share of national output in 2025. Kualanamu in Medan handled 58,000 tons in the year before Çelebi Aviation began running its terminal in May 2025. International cargo there remains small, at 2,073 tons from January through August 2026, according to Statistics Indonesia data. This means most Sumatran air cargo moves through domestic lanes, and the November 2025 floods showed how much remote districts depended on aircraft.
Kalimantan gains from new international status
Kalimantan held 8.5% of 2025 value and grows at 6.08% a year, helped by mining, energy and construction supply needs. The region produced 8.12% of national output in 2025, according to Statistics Indonesia data. Decree KM 37 of 2025 gave international status to Balikpapan, Samarinda, Banjarbaru, Pontianak and Tarakan, which allows operators to plan direct cross-border service. DSV lists a Balikpapan office, which shows that global forwarders already maintain a presence in East Kalimantan.
Sulawesi combines seafood lanes with industrial growth
Sulawesi held 7.0% of 2025 value and grows at 6.28% a year, the second-fastest pace among the five regions. It produced 7.22% of national output in 2025, according to Statistics Indonesia data. Makassar, Manado and Palu all kept or gained international status under decree KM 37 of 2025. Manado has already proven useful for fishery exports, handling 16.6 million kilograms of cargo in 2021 and loading 14 tons onto a Narita service in February 2022, according to Kontan.
Bali and Eastern Indonesia lead growth from a small base
Bali and Eastern Indonesia held 5.5% of 2025 value and grows fastest at 6.58% a year. Bali plus Nusa Tenggara contributed 2.82% of national output in 2025, and Maluku plus Papua contributed 2.69%, according to Statistics Indonesia data. Ngurah Rai handled 57,971 tons of international cargo from January through August 2026, the second-largest total nationally. Pioneer cargo routes and eight international airports named under decree KM 37 of 2025 extend this reach into Nusa Tenggara, Maluku and Papua.
Gateways and booking deals marked 2025 and 2026
| Development | Status and market relevance |
|---|---|
| In May 2025, Çelebi Aviation began cargo operations at Kualanamu with an 8,000-square-meter terminal offering cold chain and dangerous goods handling. | Operating, with phased upgrades; it adds regulated capacity in Sumatra. |
| In September 2025, Garuda Indonesia made its cargo capacity available exclusively through WebCargo by Freightos for about 10,000 forwarder offices. | Live, starting with lanes from Jakarta and Denpasar; it speeds forwarder rate comparison. |
| In October 2025, FedEx widened dangerous goods acceptance in Greater Jakarta and Batam to all classes except Class 1 and Class 7. | Effective Oct. 1, 2025; it opens express lanes to chemicals, batteries and medical equipment. |
| In December 2025, DHL Express inaugurated its 10,000-square-meter Surabaya gateway and service center after investing more than EUR 9 million. | Operating; dedicated Singapore flights serve exporters across East Java. |
| In March 2026, Nippon Express merged its air forwarding company into PT NX Lemo Indonesia Logistik, combining air and ocean forwarding. | Effective March 1, 2026; shippers now deal with one contact company. |
Screening, tracking and cold-chain tools lift standards
- Electronic air waybills replace paper documents at terminals such as Kualanamu, where Çelebi Aviation paired them with barcode scanners and handheld devices in 2025.
- Regulated agent screening now sits inside gateways such as the DHL Express Surabaya facility, so shipments can be cleared for flight before reaching the airport.
- Warehouse management systems give real-time tracking at terminals, and Gapura Angkasa uses one across its Jakarta cargo buildings of about 13,380 square meters.
- Active temperature containers protect vaccines and biologics in flight, with Envirotainer stock offered at Kualanamu as BPOM rules demand tighter documentation of cold chain products.
Need a Custom Version of This Report?
Tailor the scope, geography, or segments to your exact requirements.
- Custom geography or segment scope
- Direct access to our analyst team
Integrators and global forwarders compete with Garuda
Competition splits into three broad groups that often work together. Garuda Indonesia Cargo sells scheduled lift and moved international booking to WebCargo in September 2025, while PT Angkasa Pura Logistik offers regulated agent, terminal, forwarding and warehouse services with a focus on central and eastern airports. Integrators DHL Express, FedEx and UPS sell door-to-door products and control their own networks, which lets them win urgent electronics and document traffic. Global forwarders such as DSV, Kuehne+Nagel and Nippon Express compete on block space, customs skills and contract logistics, and consolidation gives them greater bargaining power with airlines. Terminal operators including Çelebi Aviation and Gapura Angkasa influence service quality, because cold-chain and dangerous goods handling can decide where regulated cargo flows. Kualanamu's 8,000-square-meter terminal shows that demand from regulated shippers now shapes investment in the Indonesia air freight market. Price matters most on standard lanes, while reliability and documentation decide healthcare and high-technology accounts.
Companies profiled and their roles in this market
| Company | Type | Role in the market |
|---|---|---|
| Garuda Indonesia Cargo | National carrier | Sells scheduled cargo capacity from Jakarta and Denpasar through WebCargo by Freightos since September 2025 |
| DHL Express Indonesia | Integrator | Runs seven gateways, opened a Surabaya facility in December 2025 and launched Heavy Weight Express in June 2026 |
| FedEx Indonesia | Integrator | Marked 40 years in 2025, runs a Denpasar gateway and widened dangerous goods service in Jakarta and Batam |
| UPS Indonesia | Integrator | Formed a delivery alliance with JNE in 2010, according to Post & Parcel |
| PT Angkasa Pura Logistik | Airport logistics | Offers regulated agent, cargo terminal, forwarding and warehouse services from 17 branches |
| DSV Indonesia (including Schenker) | Global forwarder | Lists air services and Indonesian offices, and is integrating Schenker worldwide by the end of 2026 |
| Kuehne+Nagel Indonesia | Global forwarder | Active since 1992 and expanded distribution through the 2018 purchase of Wira Logistics |
| Nippon Express Indonesia | Global forwarder | Moved air forwarding into PT NX Lemo Indonesia Logistik on March 1, 2026 |
Handling costs will decide who wins inter-island volume
Credence Research's view is that handling and airport costs, rather than aircraft alone, will decide who captures inter-island volume through 2035. Asperindo's complaints at the August 2026 hearing show that charges and weight rules matter to merchants as much as flight frequency does. Operators that publish clear all-in prices, as DHL Express does with Heavy Weight Express, should win accounts from shippers tired of unpredictable bills. Exporters in Bali, Surabaya and Medan should also test direct lanes now, because new gateways reduce Jakarta transit. The largest uncertainty remains jet fuel, after the 72.45% domestic price jump of April 2026.
How Credence Research built these estimates
The report uses 2025 as the base year, 2026 as the first forecast year and 2035 as the final forecast year. Market values come from the Credence Research model, and segment and regional splits are Credence Research estimates. Evidence comes from public sources opened for this report, including Statistics Indonesia data, World Bank data, government decrees, regulator statements, company releases and named news publishers. No interviews or surveys were conducted for this edition, and the shares should be read as modeled estimates rather than reported statistics.
Outer-island gateways and cold chains shape growth to 2035
The market is forecast to reach USD 7.10 billion by 2035, with growth at 5.62% a year from USD 4.34 billion in 2026. Volume should spread beyond Jakarta as Surabaya, Denpasar and Kualanamu build direct export habits, and as the airports designated international in 2025 attract cargo operators. Cold-chain rules should move healthcare freight toward certified terminals, while mergers among forwarders should reshape airline buying. The pending Transportation Ministry rule on cost components will matter for inter-island pricing, and jet fuel will remain the main swing factor for rates. Fleet renewal will decide how much of this growth stays with Indonesian carriers.
Frequently Asked Questions
How big is the Indonesia air freight market?
Which region leads the Indonesia air freight market?
Which service type is largest?
Which end-use industry grows fastest?
What drives cargo demand between Indonesian islands?
How did jet fuel affect Indonesian air cargo costs in 2026?
Which airports matter most for international air cargo?
Who are the main companies in Indonesian air freight?
Table of Content
Chapter 1 Market Segmentation
- 1.1 Segmentation Framework
- 1.1.1 Product and Service Classification
- 1.1.2 Application and End-Use Classification
- 1.1.3 Technology and Solution Classification
- 1.1.4 Customer and Distribution Channel Classification
- 1.1.5 Geographic Segmentation
- 1.1.6 Market Segment Definitions and Boundaries
- 1.2 By Service Type
- 1.2.1 Standard Air Freight
- 1.2.2 Express and Time-Definite Air Freight
- 1.2.3 Specialized Air Freight
- 1.2.4 Charter Air Freight
- 1.3 By Shipment Flow
- 1.3.1 Domestic Inter-Island
- 1.3.2 International Inbound
- 1.3.3 International Outbound
- 1.3.4 Transshipment
- 1.4 By Aircraft Capacity Type
- 1.4.1 Passenger Belly Capacity
- 1.4.2 Dedicated Freighter Capacity
- 1.4.3 Integrator-Controlled Capacity
- 1.4.4 Chartered Capacity
- 1.5 By End-Use Industry
- 1.5.1 E-Commerce and Retail
- 1.5.2 Electronics and High Technology
- 1.5.3 Healthcare and Pharmaceuticals
- 1.5.4 Perishables and Food
- 1.5.5 Industrial and Automotive
Chapter 2 Introduction
- 2.1 Report Objectives and Scope
- 2.2 Product Definition and Industry Terminology
- 2.3 Market Inclusions and Exclusions
- 2.4 Research Process
- 2.4.1 Primary Research and Expert Interviews
- 2.4.2 Secondary Research and Source Review
- 2.4.3 Top-Down and Bottom-Up Estimation
- 2.4.4 Data Triangulation and Verification
- 2.5 Market Size Measurement Basis
- 2.5.1 2025: USD 4.09 billion → 2035: USD 7.10 billion
- 2.6 Historical and Forecast Reference Periods
- 2.6.1 Historical Period: 2018-2025
- 2.6.2 Base Year: 2025
- 2.6.3 Forecast Period: 2025-2035
- 2.7 Research Assumptions and Limitations
Chapter 3 Executive Summary
- 3.1 Market Snapshot and Key Findings
- 3.2 Base-Year Market Size, 2025
- 3.3 Forecast Market Size, 2035
- 3.4 Revenue and Volume Growth Outlook
- 3.5 Key Demand and Supply Indicators
- 3.6 Leading Market Segments
- 3.7 Fastest-Growing Market Opportunities
- 3.8 Regional Performance Highlights
- 3.9 Technology and Industry Transformation
- 3.10 Competitive Landscape Summary
- 3.11 Analyst View and Strategic Implications
Chapter 4 Indonesia Air Freight Market Trends and Developments
- 4.1 Historical Industry Development, 2018-2025
- 4.2 Recent Market Trends and Developments
- 4.3 Demand and Customer Behavior Trends
- 4.4 Technology and Product Innovation
- 4.5 Artificial Intelligence, Automation and Digitalization
- 4.6 Local Manufacturing and Supply Chain Realignment
- 4.7 Industry Partnerships, Mergers and Acquisitions
- 4.8 Sustainability and Circular Economy Developments
- 4.9 Government and Private Sector Investment Trends
- 4.10 Emerging Business Models and Commercialization
- 4.11 Industry Developments and Announcements
Chapter 5 Indonesia Air Freight Market Production, Supply and Demand Analysis
- 5.1 Demand Trend and Consumption Analysis, 2018-2025
- 5.2 Demand Forecast, 2025-2035
- 5.3 Production and Output Trend, 2018-2025
- 5.4 Production and Output Forecast, 2025-2035
- 5.5 Installed Capacity and Capacity Utilization
- 5.6 Company-Wise Production Plants and Statistics
- 5.6.1 Installed Production Capacity
- 5.6.2 Actual Production
- 5.6.3 Planned Capacity and Expansion Targets
- 5.7 Supply Chain Structure and Procurement Trends
- 5.8 Supply-Demand Gap and Bottlenecks
- 5.9 Import Dependence and Sourcing Structure
- 5.10 Contract Manufacturing and Outsourcing
- 5.11 Regional Supply and Demand Concentration
Chapter 6 Indonesia Air Freight Market Pricing Analysis
- 6.1 Pricing Structure and Measurement
- 6.2 Historical Pricing Trends, 2018-2025
- 6.3 Pricing Outlook, 2025-2035
- 6.4 Average Selling Price and Unit Economics
- 6.5 Pricing by Product and Market Segment
- 6.6 Geographic Pricing Differences
- 6.7 Key Input, Energy, Labor and Logistics Costs
- 6.8 Contract Pricing and Purchasing Models
- 6.9 Pricing Sensitivity and Competitive Positioning
- 6.10 Price, Margin and Profitability Implications
Chapter 7 Indonesia Air Freight Market Dynamics
- 7.1 Market Growth Drivers
- 7.1.1 Demand-Side Drivers
- 7.1.2 Technology and Innovation Drivers
- 7.1.3 Infrastructure and Investment Drivers
- 7.1.4 Regulatory and Policy Drivers
- 7.2 Market Restraints
- 7.2.1 Cost and Affordability Constraints
- 7.2.2 Technology and Adoption Barriers
- 7.2.3 Supply Chain and Operational Constraints
- 7.3 Market Challenges
- 7.3.1 Competitive Pressure and Margin Erosion
- 7.3.2 Skills, Infrastructure and Implementation Gaps
- 7.4 Emerging Market Opportunities
- 7.5 Market Dynamics Impact and Time-Horizon Assessment
Chapter 8 Indonesia Air Freight Value Chain Analysis
- 8.1 Industry Value Chain Overview
- 8.2 Upstream Suppliers and Critical Inputs
- 8.3 Technology and Component Providers
- 8.4 Manufacturing or Service Delivery
- 8.5 Distribution, Channel Partners and Integrators
- 8.6 Downstream Applications and End Users
- 8.7 Value Addition and Profit Pools
- 8.8 Vertical Integration and Outsourcing
- 8.9 Supplier Concentration and Risk
- 8.10 Supply Chain Localization and Resilience
Chapter 9 Indonesia Air Freight Market Regulations and Policies
- 9.1 Relevant Laws, Standards and Compliance Frameworks
- 9.2 Product, Service, Safety and Quality Requirements
- 9.3 Government Policies, Incentives and Subsidies
- 9.4 Imports, Exports and Trade Barriers
- 9.5 Public Procurement and Local Content Requirements
- 9.6 Environmental and Sustainability Compliance
- 9.7 Upcoming Policy Changes and Market Implications
Chapter 10 Indonesia Air Freight Market Hotspots and Opportunities
- 10.1 Market Opportunity Mapping and Growth Hotspots
- 10.2 High-Growth Applications and Customer Groups
- 10.3 Underserved Markets and White-Space Opportunities
- 10.4 Emerging Technology and Product Opportunities
- 10.5 New Capacity and Investment Hotspots
- 10.6 Market Entry and Expansion Opportunities
- 10.7 Distribution and Partnership Opportunities
- 10.8 Near-Term and Long-Term Commercial Potential
- 10.9 Opportunity Attractiveness and Execution Risks
Chapter 11 Indonesia Air Freight Market Outlook, 2025-2035
- 11.1 Market Size and Analysis
- 11.1.1 Revenue (Market Measurement: 2025: USD 4.09 billion → 2035: USD 7.10 billion)
- 11.1.2 Market Volume and Quantity Sold
- 11.1.3 Historical Market Size, 2018-2025
- 11.1.4 Base-Year Market Size, 2025
- 11.2 Market Forecast, 2025-2035
- 11.2.1 Revenue Forecast to 2035
- 11.2.2 Volume Forecast to 2035
- 11.2.3 CAGR and Year-on-Year Growth
- 11.2.4 Incremental Revenue Opportunity
- 11.3 Forecast Assumptions and Scenario Analysis
- 11.3.1 Base-Case Forecast
- 11.3.2 Optimistic and Conservative Scenarios
- 11.3.3 Technology, Pricing and Policy Sensitivities
- 11.4 Market Attractiveness and Growth Outlook
Chapter 12 Indonesia Air Freight Market Segmentation and Outlook
- 12.1 Segmentation Summary and Market Shares, 2025
- 12.2 Largest and Fastest-Growing Segments
- 12.3 By Service Type - Market Size and Forecast, 2025-2035
- 12.3.1 Segment Definition and Scope
- 12.3.2 Historical Market Size, 2018-2025
- 12.3.3 Revenue Forecast, 2025-2035
- 12.3.4 Volume Forecast, 2025-2035
- 12.3.5 Base-Year Market Share, 2025
- 12.3.6 Segment CAGR and Growth Drivers
- 12.3.7 Subsegment Market Size and Forecast
- 12.3.7.1 Standard Air Freight
- 12.3.7.2 Express and Time-Definite Air Freight
- 12.3.7.3 Specialized Air Freight
- 12.3.7.4 Charter Air Freight
- 12.3.8 Subsegment Pricing and Adoption Trends
- 12.3.9 Leading Suppliers and Competition
- 12.3.10 Regional Demand and Opportunities
- 12.4 By Shipment Flow - Market Size and Forecast, 2025-2035
- 12.4.1 Segment Definition and Scope
- 12.4.2 Historical Market Size, 2018-2025
- 12.4.3 Revenue Forecast, 2025-2035
- 12.4.4 Volume Forecast, 2025-2035
- 12.4.5 Base-Year Market Share, 2025
- 12.4.6 Segment CAGR and Growth Drivers
- 12.4.7 Subsegment Market Size and Forecast
- 12.4.7.1 Domestic Inter-Island
- 12.4.7.2 International Inbound
- 12.4.7.3 International Outbound
- 12.4.7.4 Transshipment
- 12.4.8 Subsegment Pricing and Adoption Trends
- 12.4.9 Leading Suppliers and Competition
- 12.4.10 Regional Demand and Opportunities
- 12.5 By Aircraft Capacity Type - Market Size and Forecast, 2025-2035
- 12.5.1 Segment Definition and Scope
- 12.5.2 Historical Market Size, 2018-2025
- 12.5.3 Revenue Forecast, 2025-2035
- 12.5.4 Volume Forecast, 2025-2035
- 12.5.5 Base-Year Market Share, 2025
- 12.5.6 Segment CAGR and Growth Drivers
- 12.5.7 Subsegment Market Size and Forecast
- 12.5.7.1 Passenger Belly Capacity
- 12.5.7.2 Dedicated Freighter Capacity
- 12.5.7.3 Integrator-Controlled Capacity
- 12.5.7.4 Chartered Capacity
- 12.5.8 Subsegment Pricing and Adoption Trends
- 12.5.9 Leading Suppliers and Competition
- 12.5.10 Regional Demand and Opportunities
- 12.6 By End-Use Industry - Market Size and Forecast, 2025-2035
- 12.6.1 Segment Definition and Scope
- 12.6.2 Historical Market Size, 2018-2025
- 12.6.3 Revenue Forecast, 2025-2035
- 12.6.4 Volume Forecast, 2025-2035
- 12.6.5 Base-Year Market Share, 2025
- 12.6.6 Segment CAGR and Growth Drivers
- 12.6.7 Subsegment Market Size and Forecast
- 12.6.7.1 E-Commerce and Retail
- 12.6.7.2 Electronics and High Technology
- 12.6.7.3 Healthcare and Pharmaceuticals
- 12.6.7.4 Perishables and Food
- 12.6.7.5 Industrial and Automotive
- 12.6.8 Subsegment Pricing and Adoption Trends
- 12.6.9 Leading Suppliers and Competition
- 12.6.10 Regional Demand and Opportunities
- 12.7 Segment Growth Comparison
- 12.8 Segment Attractiveness and Priority Matrix
Chapter 13 Indonesia Air Freight End-Use and Application Market Outlook
- 13.1 End-Use Industry and Customer Demand Structure
- 13.2 Leading Applications and Customer Groups
- 13.3 End-Use Market Size, Share and Forecast
- 13.4 Major End-Use Industry Deep Dives
- 13.4.1 Customer Requirements and Use Cases
- 13.4.2 Demand and Replacement Cycles
- 13.4.3 Technical and Regulatory Considerations
- 13.4.4 Purchasing and Procurement Models
- 13.4.5 Leading Vendors and Distribution Channels
- 13.4.6 Forecast and Commercial Opportunities
- 13.5 Emerging Applications and Cross-Segment Demand
- 13.6 End-Use Industry Investment Priorities
Chapter 14 Indonesia Air Freight Geographic Market Outlook, 2025-2035
- 14.1 Domestic Market Distribution and Demand Clusters
- 14.2 State- or Province-Wise Market Size and Forecast, 2025-2035
- 14.3 City and Metropolitan Market Outlook
- 14.4 Industrial, Manufacturing and Commercial Clusters
- 14.5 Geographic Concentration of Key End Users
- 14.6 Local Pricing and Purchasing Differences
- 14.7 Domestic Production Facilities and Capacity Map
- 14.8 Local Infrastructure and Project Pipeline
- 14.9 State-Level Policy and Incentive Differences
- 14.10 Subnational Investment Hotspots and Opportunities
- 14.11 Distribution and Logistics Networks
- 14.12 Domestic Competitive Footprint
Chapter 15 Indonesia Air Freight Technology, Innovation and Sustainability Outlook
- 15.1 Technology Landscape and Maturity
- 15.2 Product, Process and Service Innovation
- 15.3 AI, Automation and Digital Tools in the Industry
- 15.4 Technology Adoption and Performance Benchmarking
- 15.5 Innovation Pipeline and R&D Investment
- 15.6 Patent and Intellectual Property Trends
- 15.7 Energy Efficiency and Resource Management
- 15.8 Sustainability, Recycling and Circularity
- 15.9 Technology Roadmap, 2025-2035
- 15.10 Risks of Obsolescence and Technology Substitution
Chapter 16 Indonesia Air Freight Market Key Strategic Imperatives
- 16.1 Growth and Market Entry Priorities
- 16.2 High-Return Products and Segments
- 16.3 Pricing, Profitability and Cost Optimization
- 16.4 Technology Investment and Product Differentiation
- 16.5 Supply Chain Localization and Resilience
- 16.6 Distribution and Customer Acquisition
- 16.7 Partnership, Acquisition and Capacity Strategy
- 16.8 Regional Expansion Priorities
- 16.9 Short-, Medium- and Long-Term Actions
Chapter 17 Competition Outlook
- 17.1 Industry Competition Characteristics
- 17.2 Market Structure and Concentration
- 17.3 Market Share and Competitive Positioning, 2025
- 17.4 Company-Wise Revenue and Product Benchmarking
- 17.5 Production and Service Capacity Benchmarking
- 17.6 Technology, Pricing and Differentiation
- 17.7 Regional Footprint and Distribution Strength
- 17.8 Mergers, Acquisitions and Strategic Alliances
- 17.9 New Entrants and Competitive Threats
- 17.10 Porter's Five Forces and Industry Attractiveness
- 17.11 Competitive Outlook, 2025-2035
Chapter 18 Company Profiles
- 18.1 Company Coverage and Selection Criteria
- 18.2 Garuda Indonesia Cargo
- 18.2.1 Business Description
- 18.2.2 Company Ownership and Geographic Presence
- 18.2.3 Product and Service Portfolio
- 18.2.4 Manufacturing and Operating Footprint
- 18.2.5 Production Capacity and Expansion Plans
- 18.2.6 Financial Performance and Investment
- 18.2.7 Market Share and Competitive Position
- 18.2.8 Technology and Innovation Capabilities
- 18.2.9 Strategic Alliances or Partnerships
- 18.2.10 Recent Developments
- 18.2.11 Growth Strategy and Outlook
- 18.3 DHL Global Forwarding Indonesia
- 18.4 Kuehne+Nagel Indonesia
- 18.5 PT Angkasa Pura Logistik
- 18.6 CEVA Logistics Indonesia
- 18.7 DSV Air & Sea Indonesia
- 18.8 DB Schenker Indonesia
- 18.9 Nippon Express Indonesia
- 18.10 FedEx Indonesia
- 18.11 UPS Indonesia
- 18.12 Other Relevant Market Participants
Note: Every listed company is profiled on the structure shown under the first company. The company list is preliminary and may change based on research findings, market developments, data availability and client requirements.
Chapter 19 Disclaimer
- 19.1 Research and Forecast Disclaimer
- 19.2 Data Source and Estimation Limitations
Note: The depth of individual sections depends on data availability for this market. Volume, capacity, trade and other unit-based metrics are included where applicable.

