Record port and airfreight volumes anchor Singapore demand
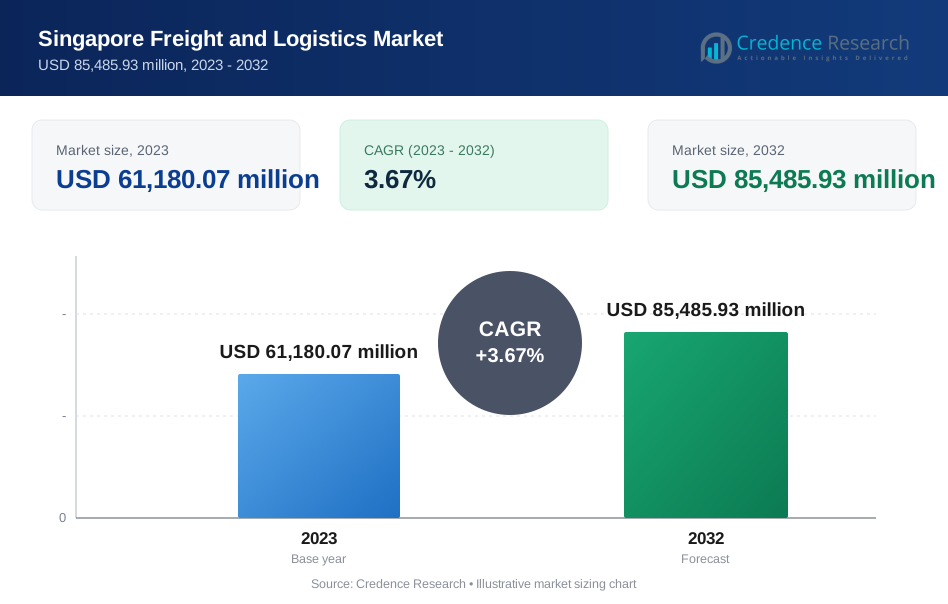
The Singapore freight and logistics market was valued at USD 65.75 billion in 2025 and is projected to increase from USD 68.17 billion in 2026 to USD 94.29 billion by 2035, registering a CAGR of 3.67% during 2026–2035. Demand comes from container transshipment, semiconductor and pharmaceutical exports, marine fuel supply and domestic parcels moving through a compact hub. Western Singapore held the largest regional share, 46.0% in 2025, because Tuas Port, Jurong and the Tuas Biomedical Park cluster sit in the same corridor, and Western Singapore is also the fastest-growing zone at 4.0% a year. The commercial change now under way is the shift of PSA terminals from the city to fully automated berths at Tuas, which moves truck routes, depots and warehouse leases westward. Pharmaceutical logistics is also pulling new capital into temperature-controlled space at Jurong and Changi, while a sharp rise in fuel prices during 2026 tested operating margins across sea and road services.
What do logistics services in Singapore include, and who buys them?
Logistics services in Singapore cover ocean, air and road freight, forwarding, contract warehousing, third-party logistics, cold chain handling and last-mile parcel delivery. The market value is modeled on gross freight and logistics receipts earned from Singapore, so it includes ocean carrier income as well as forwarder and warehouse fees. Buyers range from semiconductor and drug makers to online retailers and energy traders, and many use the city as a regional distribution base rather than a final market.
Passenger transport, marine fuel commodity value and logistics property rents paid between landlords are excluded from the figure. Rail is also left out because Singapore moves its freight by sea, air and road, with cross-border cargo crossing to Johor by truck. Value flows from shippers to forwarders and integrators, who then buy capacity from carriers, terminal operators, ground handlers and trucking firms.
Singapore Freight and Logistics Market Insights
- The market grows from USD 65.75 billion in 2025 to USD 94.29 billion by 2035, a steady 3.67% CAGR that reflects a mature hub adding capacity at Tuas rather than a young market.
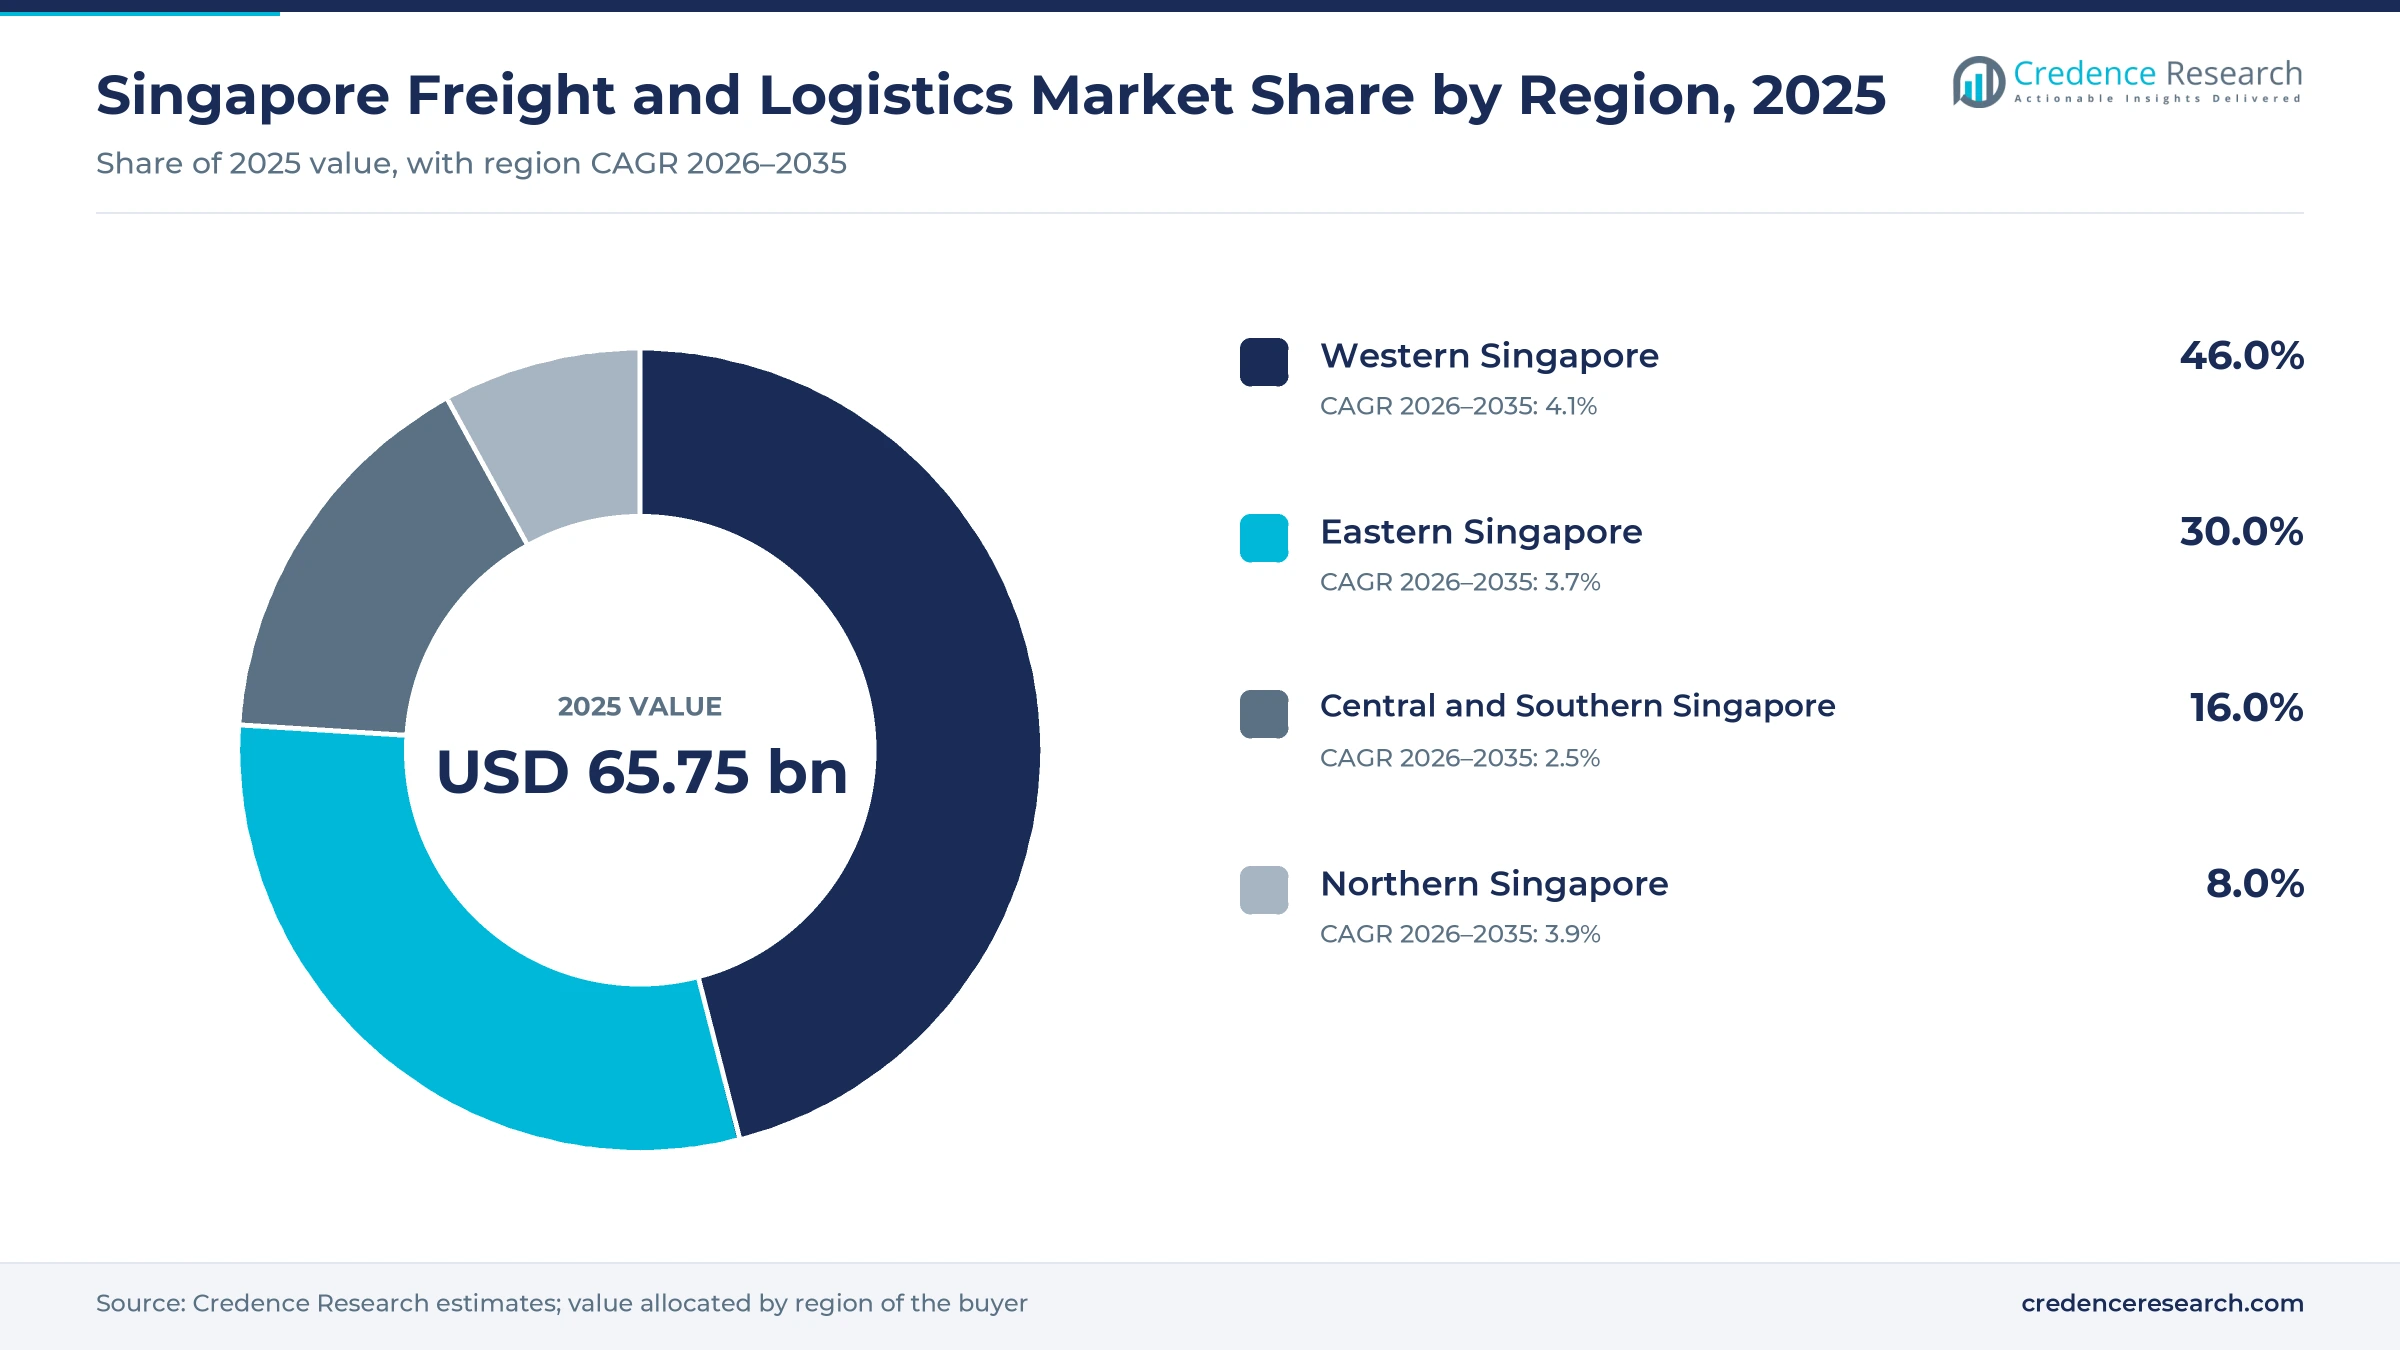
- Western Singapore led with 46.0% of 2025 value, as PSA moves its city terminals to Tuas Port and warehouse demand follows the same corridor.
- Sea Freight held 58.0% of 2025 value because transshipment dominates cargo flows, while Cold Chain Logistics is the fastest service line at 5.1% a year.
- Tuas Port passed 25 million TEUs handled since September 2022 and runs 14 berths, with 18 scheduled by 2027, according to Port Technology International.
- DHL Group announced two new Singapore pharma sites on Sept. 4, 2026, showing that fresh capital is moving into temperature-controlled space rather than general warehousing.
Sea cargo and forwarding lead while cold chain grows fastest
Why does sea freight lead and air freight grow fastest?
Based on transportation mode, the market is categorized into sea freight, air freight and road freight. Sea Freight led with 58.0% of 2025 value because water transport made up 65.9% of transportation and storage value added, according to the Economic Survey of Singapore 2025 published by the Ministry of Trade and Industry. Air Freight grows fastest at 4.2% a year as chips bound for AI, electric vehicle and cleantech uses favor fast delivery, and Changi handled 4.5% more cargo in 2025 according to Air Cargo Week. Road freight mainly feeds these two gateways and the truck lanes crossing to Johor.
How do forwarding and cold chain services differ in growth?
Based on logistics services, the market is categorized into freight forwarding, third-party logistics, warehousing and storage, last-mile delivery and cold chain logistics. Freight Forwarding led with 34.0% of 2025 value because transshipment shippers buy international lanes through forwarders, and GEODIS opened a container freight station in the Keppel DistriPark free trade zone in April 2024. Cold Chain Logistics grows fastest at 5.1% a year as pharmaceutical space is added, with DHL Supply Chain set to reach about 16,000 square meters and 12,000 pallet positions in Singapore once its second hub opens, according to the company in September 2026.
Which industries buy the most logistics services?
Based on end-user, the market is categorized into manufacturing, e-commerce and retail, oil and gas, chemicals, pharmaceutical and healthcare, and others, which include automotive and aerospace cargo. Manufacturing led with 36.0% of 2025 value because manufacturing output rose 8.7% in 2025, with electronics up 12.7%, according to the Economic Survey of Singapore 2025. Pharmaceutical and Healthcare grows fastest at 5.0% a year as biomedical output climbed 16.3% in 2025 in the same survey, and Kuehne + Nagel opened its 50,000-square-meter western hub with more than 40% chilled storage, according to Air Cargo Week in January 2016.
| Segment Group | Leading Sub-segment | Share, 2025 | Fastest-growing Sub-segment | CAGR, 2026–2035 |
|---|---|---|---|---|
| By Transportation Mode | Sea Freight | 58.0% | Air Freight | 4.2% |
| By Logistics Services | Freight Forwarding | 34.0% | Cold Chain Logistics | 5.1% |
| By End-User | Manufacturing | 36.0% | Pharmaceutical and Healthcare | 5.0% |
Request a Free Sample
Fill in your details and we'll send you a free sample report.
- Sample data tables & charts
- Research methodology
Transshipment, chips and pharma lift cargo through the hub
Transshipment volume keeps setting port records
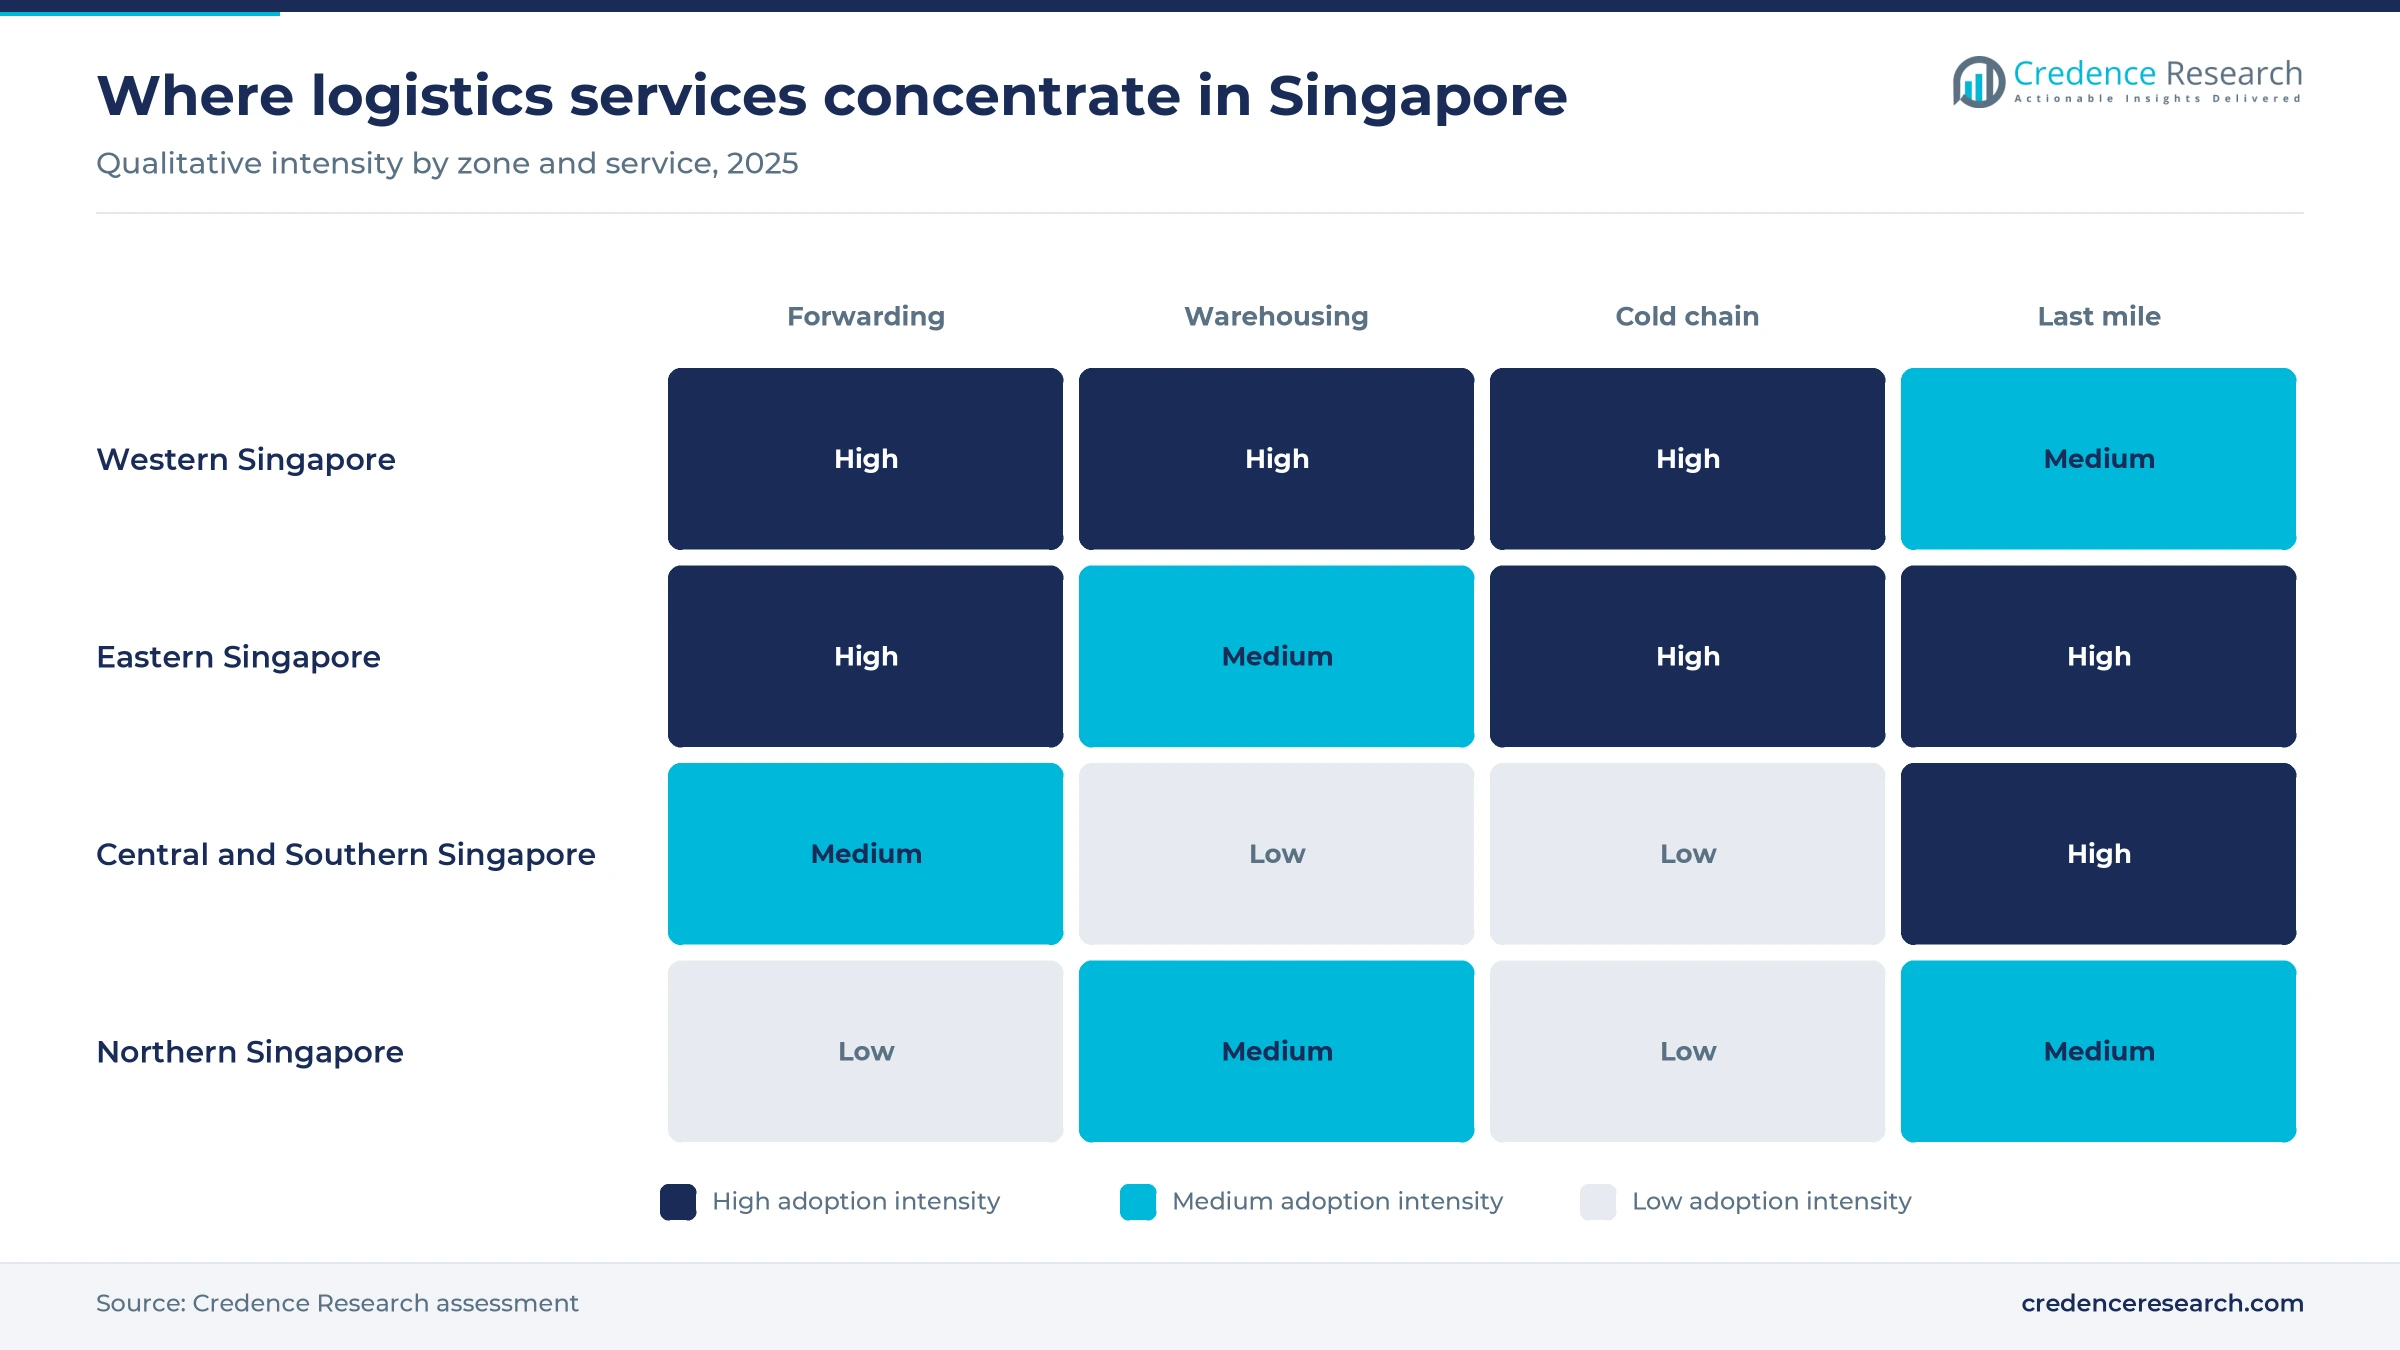
Transshipment remains the base load of the market because most containers calling here change ships rather than enter the economy. The Maritime and Port Authority of Singapore reported 44.66 million TEUs in 2025, up 8.6% from 2024, along with 3.22 billion gross tons of vessel arrivals, up 3.5%. Marine fuel sales also reached a record 56.77 million metric tons, which brings more ship calls and ancillary services. This reliability has a measurable foundation, since the World Bank report Connecting to Compete 2023 put Singapore first of 139 economies with a score of 4.3 and an import dwell time of about three days. As a result, Sea Freight keeps 58.0% of 2025 value.
Semiconductor and AI cargo fills Changi freighters
Electronics exports are the main reason air cargo keeps growing despite tariff uncertainty. Changi Airport handled 2.08 million metric tons of airfreight in 2025, up 4.5%, and Air Cargo Week linked much of that gain to semiconductors serving AI, electric vehicle and cleantech uses. Carriers responded with capacity, as JD Airlines added three weekly Shenzhen freighter flights and FedEx Express added nonstop freighters to Anchorage. Official trade data supports the same picture, because Enterprise Singapore reported on Jan. 16, 2026, that non-oil domestic exports rose 4.8% in 2025 while electronics exports climbed 24.9% in December. This mix favors Air Freight, which grows at 4.2% a year.
Biomedical output pulls capital into pharma logistics
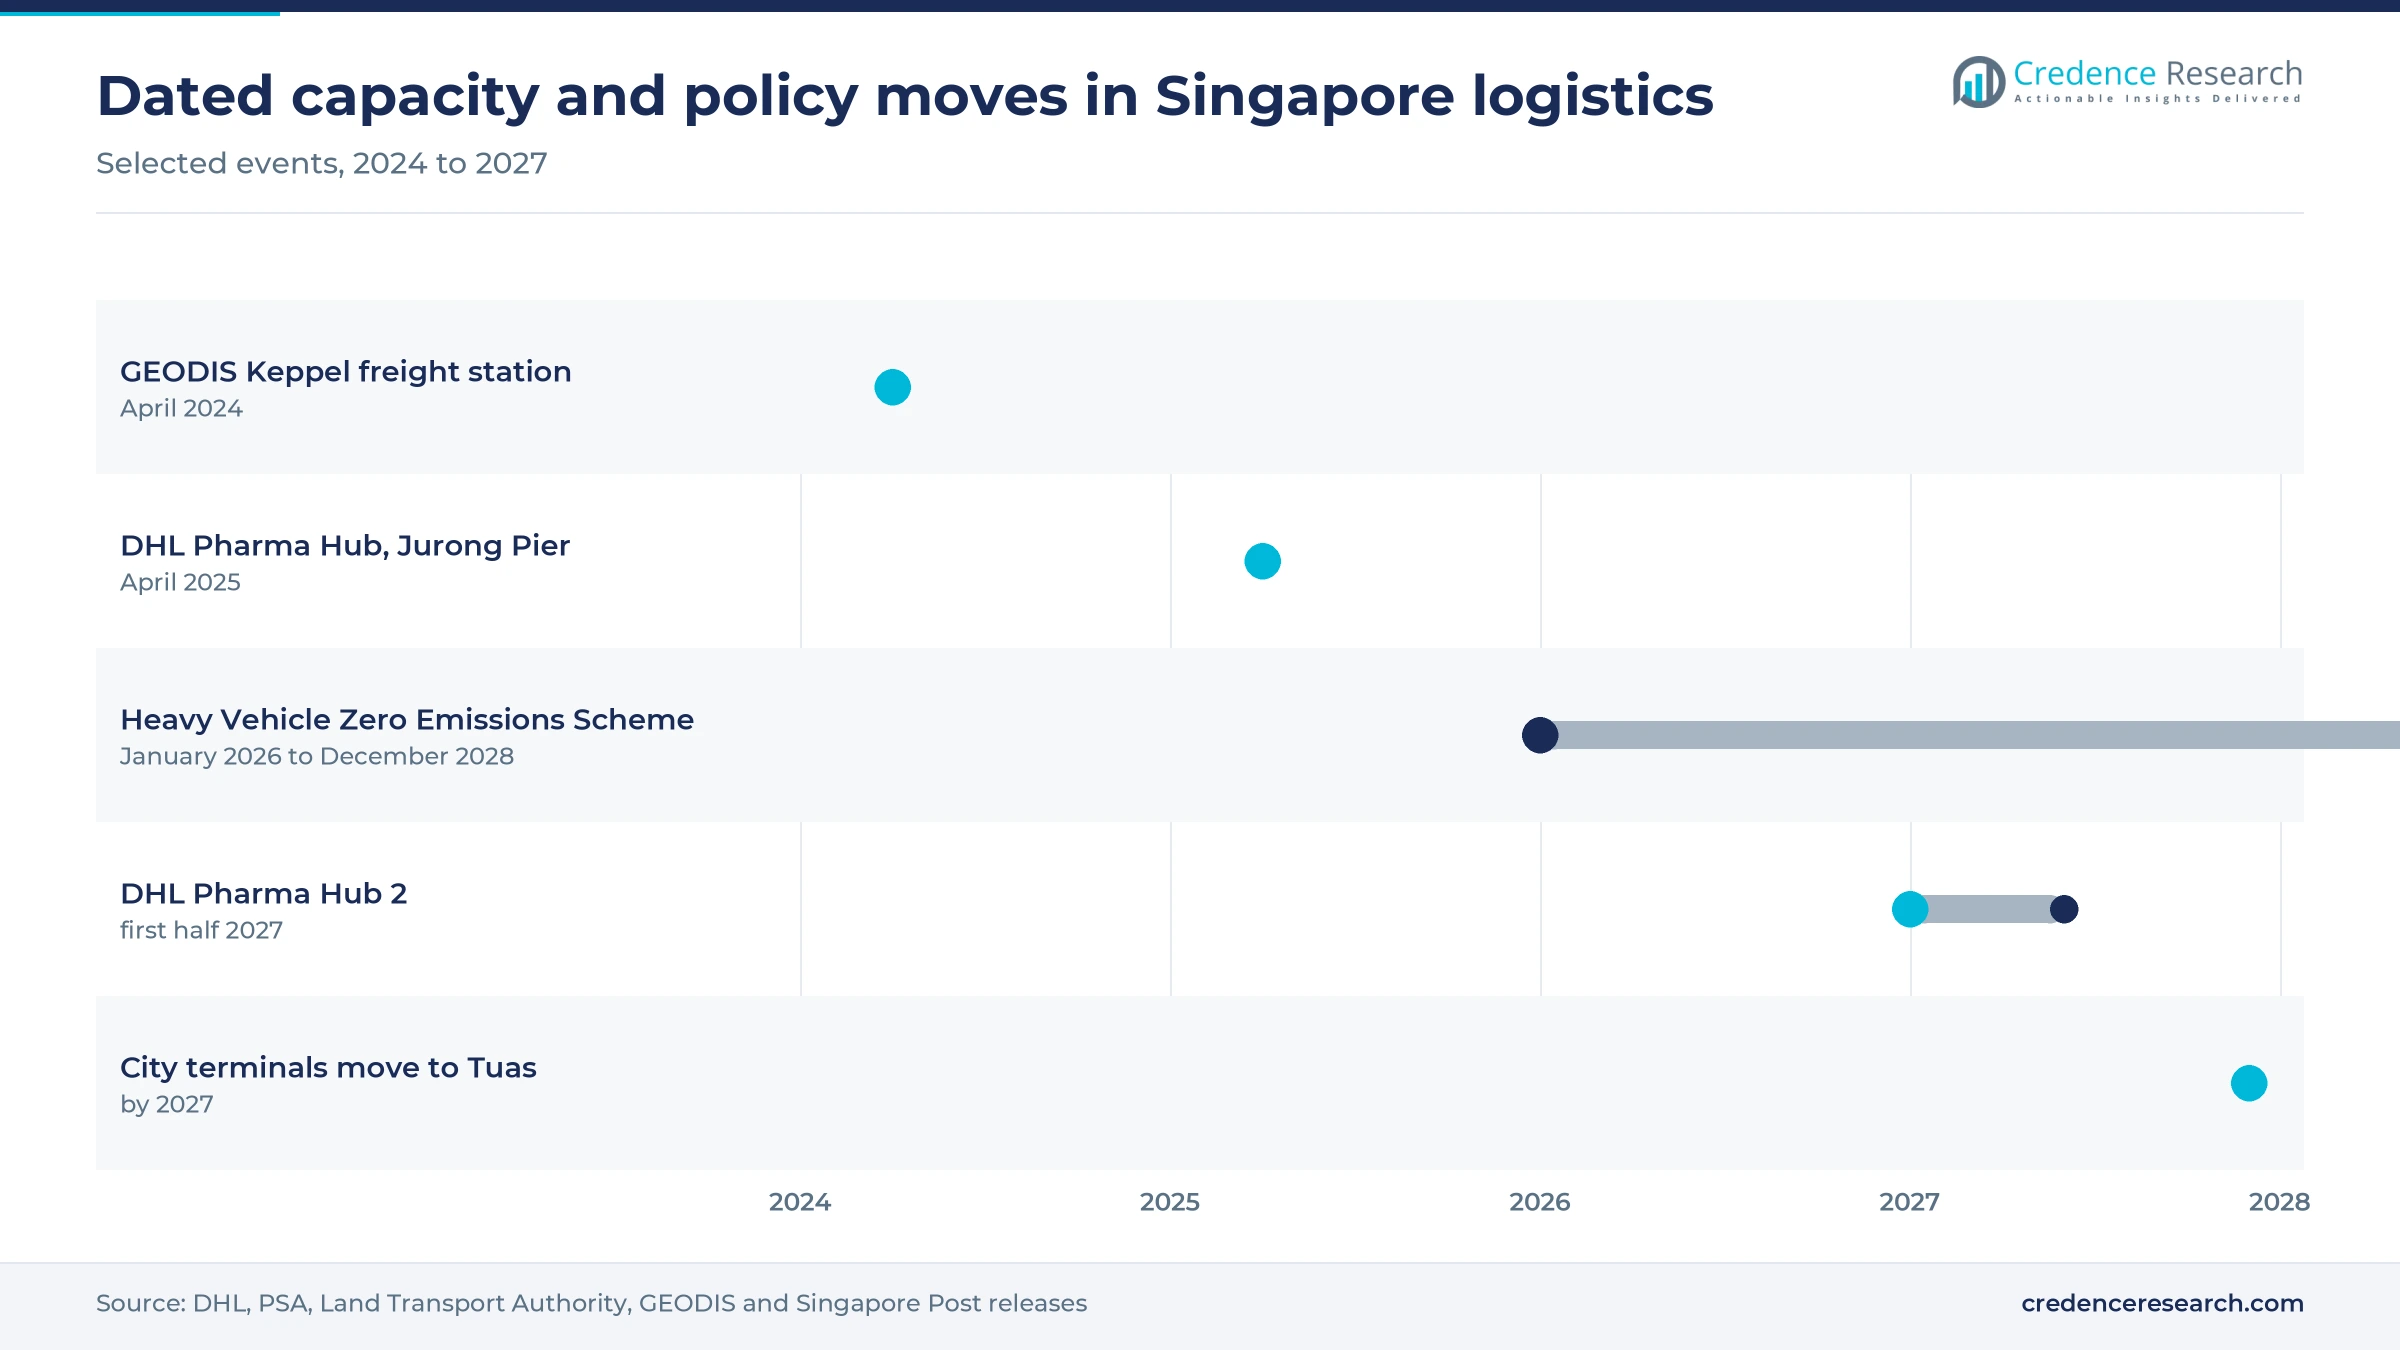
Biomedical manufacturing is creating demand that general warehouses cannot serve, which explains the recent run of specialized projects. The Economic Survey of Singapore 2025 recorded biomedical output growth of 16.3%, well above the 8.7% rise for all manufacturing. DHL Group responded on Sept. 4, 2026, with a S$22 million Coldchain Hub at Changi Nexus One and a second pharma hub holding about 7,680 pallet positions. Malay Mail carried the April 2025 company release on its earlier 8,200-square-meter site at 8 Jurong Pier. UPS Healthcare also runs an 8,700-square-meter facility at Gul Circle, according to BioSpectrum Asia in May 2023. These sites support Pharmaceutical and Healthcare, which grows at 5.0% a year.
Domestic parcels and Johor links widen the customer base
Local parcels and cross-border flows are widening demand beyond port and airport cargo. Singapore Post reported domestic e-commerce volume growth of 8.1% in fiscal 2025/26 and commissioned a S$30 million automated sorter that lifts daily capacity from about 100,000 to as many as 300,000 small and medium items. Parcel demand also benefits as online channels took 15.7% of retail sales in August 2026, and 63.7% for computer and telecommunications equipment, according to the Singapore Department of Statistics. Across the border, the Economic Development Board said in March 2026 that a single transshipment permit for land intermodal cargo halves the permits needed and cuts processing time by 50%. This cross-border traffic supports the 8.0% market share held by the northern zone.
Automation, pharma space and green trucks reshape operations
Shift to fully automated berths at Tuas
The largest structural trend is the shift from city terminals to automated berths in the far west. PSA has said its Tanjong Pagar, Keppel and Brani terminals will move to Tuas by 2027, with Pasir Panjang following by the 2040s and ultimate capacity reaching 65 million TEUs a year. Progress is already visible, because Port Technology International reported 25 million TEUs handled at Tuas since September 2022, with 14 berths working and 18 scheduled by 2027. As a result, truck routes, depots and bonded warehouses should follow along the same corridor. DSV also chose Tukang Innovation Drive for its 720,000-square-foot DSV Pearl warehouse, according to the Economic Development Board, close to this western corridor.
Rise of electric heavy goods vehicles
Electric trucks have moved from pilot volumes to a meaningful share of new registrations in a short period. The Land Transport Authority began a S$40,000 Heavy Vehicle Zero Emissions Scheme on Jan. 1, 2026, which runs through Dec. 31, 2028, alongside a charger grant covering up to 50% of installation costs. The Ministry of Transport told Parliament on Aug. 4, 2026, that electric heavy vehicles rose from under 1% of registrations in 2025 to over 30% by June 2026. About 52,000 heavy vehicles produce around 31% of land transport emissions, according to the Land Transport Authority, so the fleet remains a clear policy target. Fleet buyers should therefore plan charging at depots before renewing older trucks.
Opportunity in GDP-compliant pharma space near gateways
Specialized pharmaceutical handling near Changi and Tuas is the clearest opening for providers with validated processes. DHL Global Forwarding plans 3,047 square meters of temperature-controlled space at Changi for late 2027, while its second supply chain hub is due in the first half of 2027, which shows the lead times involved. Kuehne + Nagel opened its western hub with 46,000 square meters of warehousing near pharma and healthcare sites, according to Air Cargo Week in January 2016. Providers also compete with pharmaceutical distribution specialists worldwide for the same accounts. Double-digit biomedical output growth suggests room for smaller operators offering validated overflow, packing and relabeling capacity.
Opportunity in twinned Johor and Singapore supply chains
Twinned operations across the Causeway offer an opening for providers able to manage customs, inventory and trucking as one service. The Economic Development Board noted in March 2026 that the single permit saves a S$40 fee per application, and UPS has opened a bonded warehouse at Senai Airport so customers can defer duties. YCH Group also signed a memorandum with Sime Darby Property on Jan. 16, 2025, around a RM 500 million facility at Bandar Bukit Raja, which is modeled on its Supply Chain City in Singapore. These moves favor firms pairing high-value stock in Singapore with lower-cost space in Johor, and they connect naturally with growth in Malaysian temperature-controlled storage for regional food and drug cargo.
Fuel shocks, tariffs and land costs squeeze local operators
Fuel price spike after war disrupted 2026 shipping routes
Fuel has become the most volatile cost line for sea and road operators in 2026. The Star, citing The Straits Times in May 2026, reported that very low sulfur fuel oil peaked at US$1,450 a metric ton on March 9, up about 182% from Feb. 27, before falling below US$1,000. Carriers and truckers without surcharge clauses are the most exposed to that kind of swing. Contracts with quarterly fuel adjustment and more slow steaming are the common responses, although slower sailings can lengthen transit promises to shippers.
U.S. tariffs on electronics and branded drugs
U.S. trade policy threatens two of the most valuable cargo streams through Singapore. Reuters reported in September 2025 that about S$4 billion a year in pharmaceutical exports could face a 100% tariff on branded drugs, while other exports face a 10% baseline, and The Sun reported in October 2025 that the start date was postponed. Pharmaceutical shippers and their forwarders are most exposed, because front-loading and sudden pauses distort volumes. Providers can limit the effect by spreading customers across lanes and pricing peak capacity separately.
Warehouse rents and vacancy pull in opposite directions
Land scarcity keeps rents rising even as new supply lifts vacancy, which complicates long-term leasing decisions. Real Estate Asia reported in February 2026 that the JTC warehouse rental index rose 3.0% in 2025 to a record, while prime logistics rents reached S$1.83 per square foot. Warehouse vacancy in the Singapore market also rose to 10.2% from 8.5% a year earlier. Smaller operators in older buildings feel this most, because tenants favor newer ramp-up space. Multi-story automation and robotic picking systems help offset the higher rent per pallet.
Vehicle quota costs and carbon tax raise road costs
Road operators face rising fleet and energy costs in a market with limited vehicle growth. The Ministry of Transport confirmed on Aug. 4, 2026, that Category C goods vehicles receive only 0.25% annual growth, after a parliamentary question cited a record S$95,000 premium. The National Climate Change Secretariat also lists a carbon tax of S$45 per metric ton for 2026 and 2027, up from S$25 in 2024. Small trucking firms carry this burden directly, so consolidating routes and sharing loads are their practical responses.
Western Singapore gains as port activity shifts to Tuas
| Region | Value, 2025 (USD billion) | Share, 2025 | CAGR, 2026–2035 |
|---|---|---|---|
| Western Singapore | 30.25 | 46.0% | 4.0% |
| Eastern Singapore | 19.73 | 30.0% | 3.6% |
| Central and Southern Singapore | 10.52 | 16.0% | 2.5% |
| Northern Singapore | 5.26 | 8.0% | 3.9% |
Western Singapore gains from Tuas and Jurong
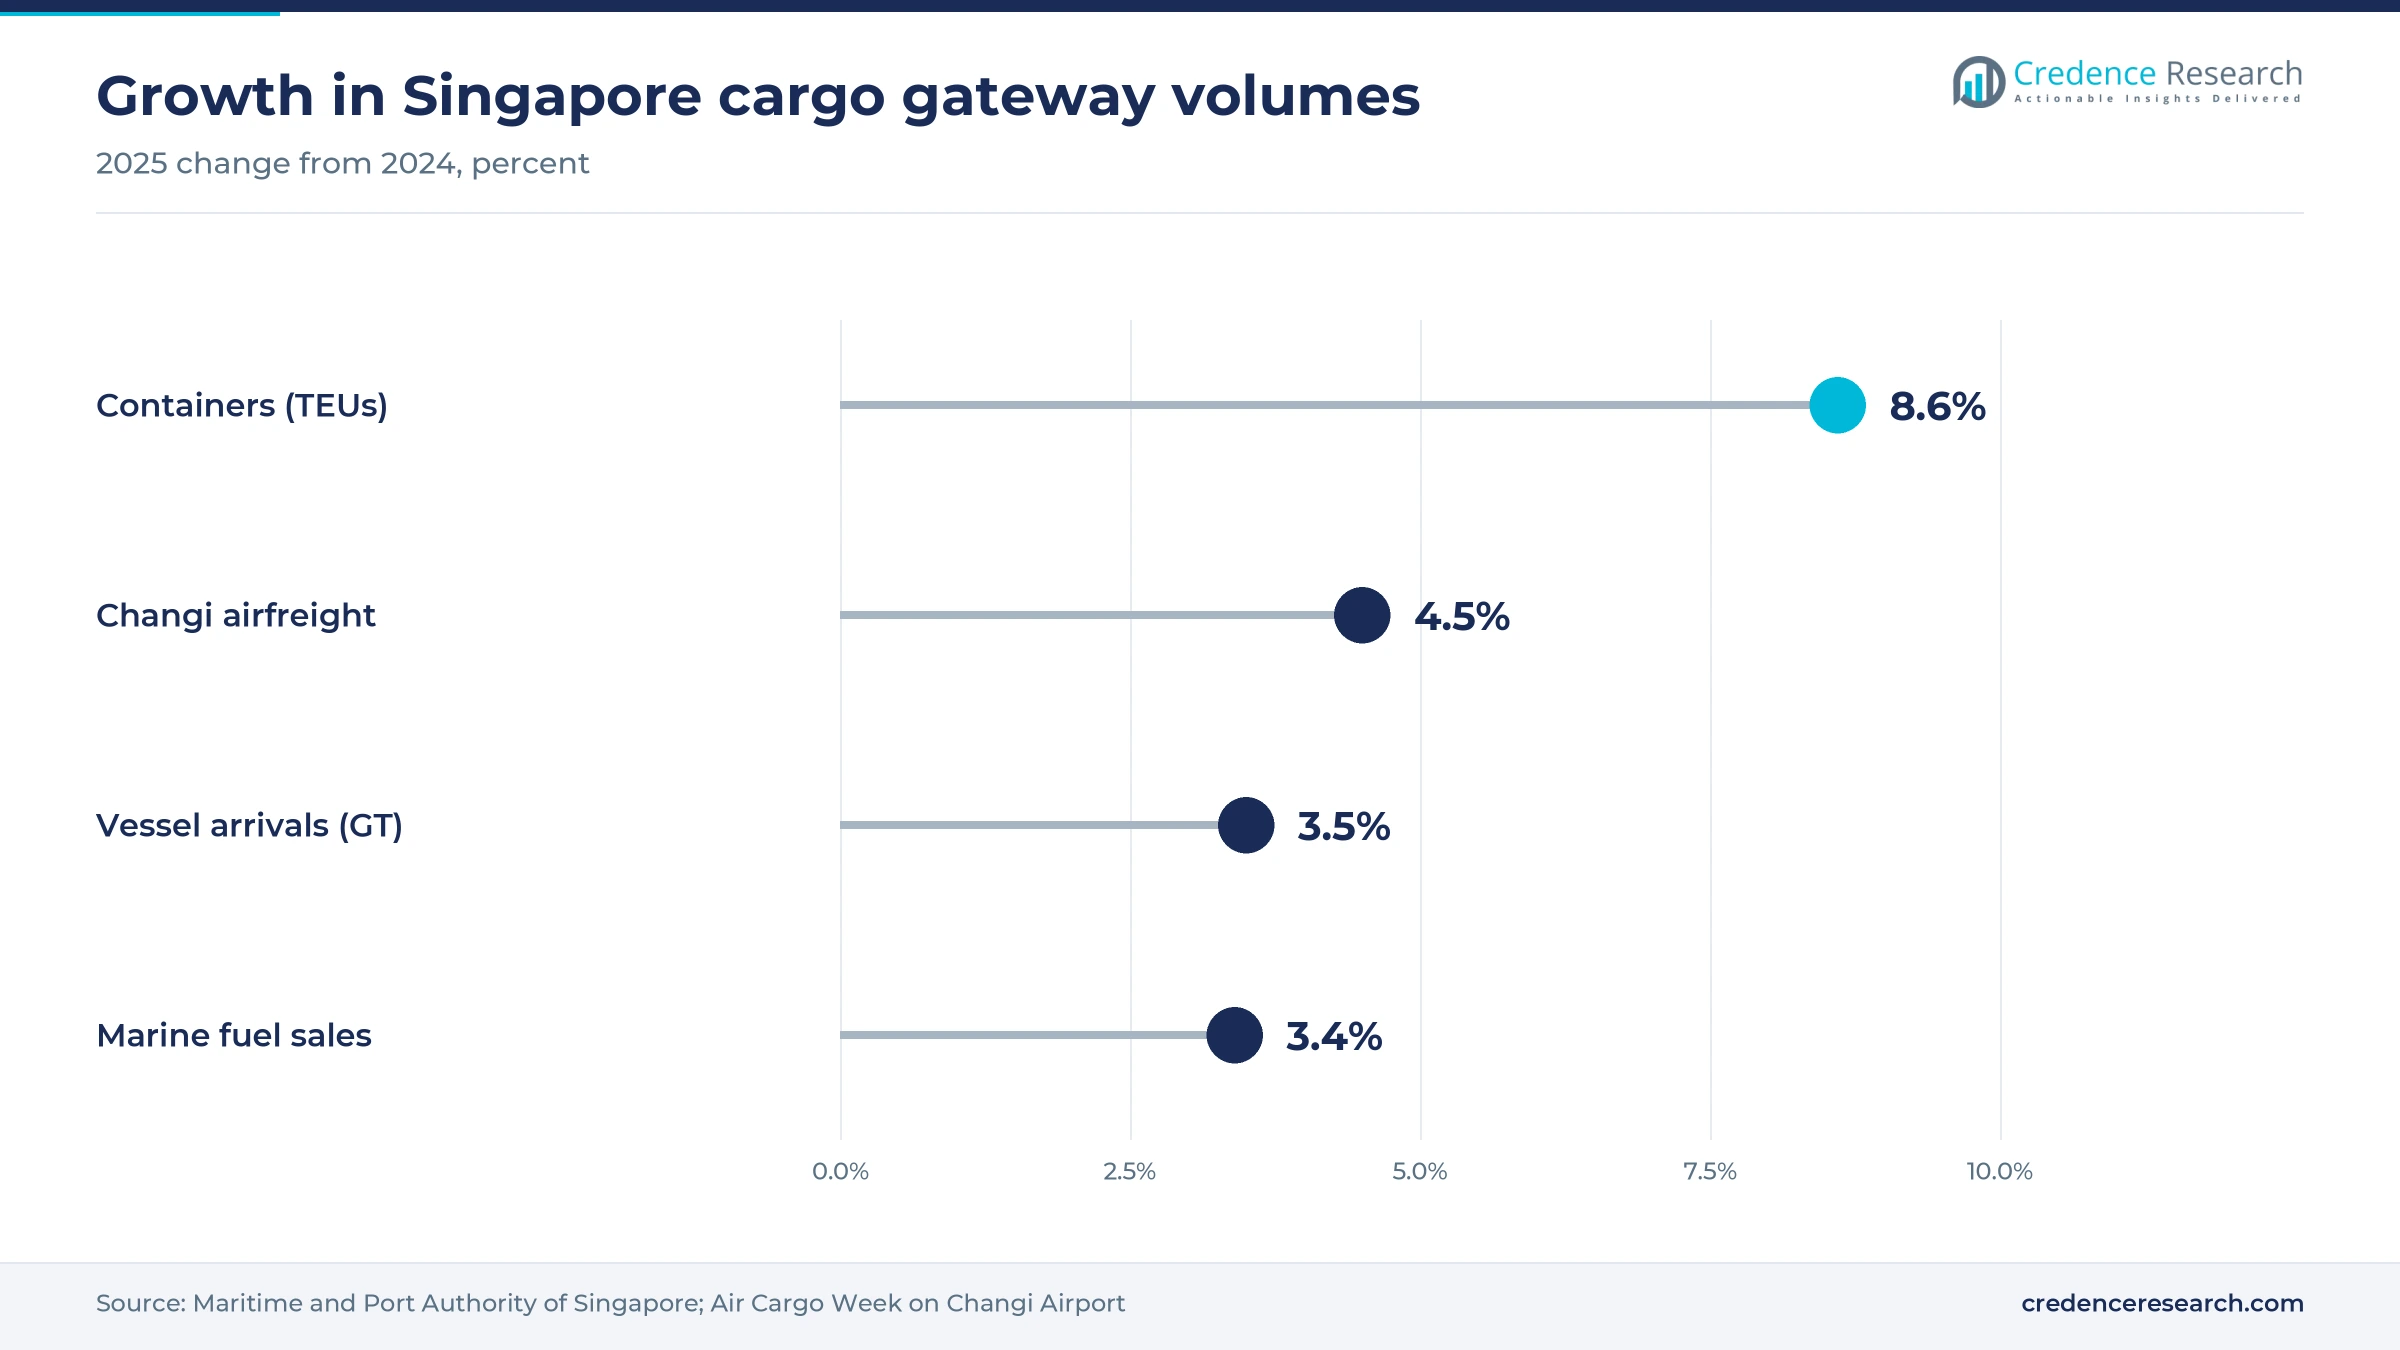
Western Singapore held a 46.0% share of the 2025 market and grows at 4.0% a year, because port activity and pharma warehousing are concentrating there. Tuas Port already runs 14 berths, with 18 scheduled by 2027 according to Port Technology International, and DHL opened its first Singapore pharma hub at 8 Jurong Pier in April 2025. UPS Healthcare at Gul Circle and DSV Pearl on Tukang Innovation Drive add to the same cluster, which should also attract depots and truck parks as terminals move.
Eastern Singapore rests on Changi airfreight
Eastern Singapore held a 30.0% share of the 2025 market and grows at 3.6% a year, supported by airfreight, express parcels and regional e-commerce. Changi handled 2.08 million metric tons of airfreight in 2025, while UPS alone operates 22 weekly flights there, according to the Economic Development Board. DHL plans its Coldchain Hub inside the Changi free trade zone for late 2027, and JD Airlines added Shenzhen freighter flights in 2025. Air Cargo Week named China as the largest cargo market for Changi.
Central and Southern Singapore loses terminal volume
Central and Southern Singapore held a 16.0% share of the 2025 market and grows at 2.5% a year, the slowest pace of the four zones. PSA has said its Tanjong Pagar, Keppel and Brani terminals will move to Tuas by 2027, which removes direct terminal activity from this zone over time. Forwarding and consolidation still matter here, as the GEODIS container freight station at Keppel DistriPark shows, and Pasir Panjang keeps operating until its move in the 2040s, according to PSA.
Northern Singapore serves Johor truck flows
Northern Singapore held an 8.0% share of the 2025 market and grows at 3.9% a year, mainly on cross-border trucking through Woodlands to Johor. The Economic Development Board reported in March 2026 that Singapore Customs now issues one permit instead of two for land intermodal transshipment, which saves a S$40 fee per application. Kuehne + Nagel also told the board that customs and permit steps have become noticeably faster, so light assembly and regional distribution tied to Johor should keep this zone growing from a small base.
Dated investments show capacity moving west and into pharma
| Development | Status and market relevance |
|---|---|
| In April 2025, DHL Supply Chain opened an 8,200-square-meter Pharma Hub at 8 Jurong Pier with 15 to 25 degree Celsius and 2 to 8 degree Celsius zones | Operating, part of a 500 million euro Asia Pacific life sciences investment |
| In January 2026, Singapore Post became the exclusive SkyNet Worldwide Express partner in Singapore, covering more than 180 countries and territories | In effect, widening its cross-border parcel reach as international e-commerce volume fell 57.9% |
| In January 2026, the Land Transport Authority started the S$40,000 Heavy Vehicle Zero Emissions Scheme for electric goods vehicles above 3,500 kilograms | Running through December 2028, already changing truck registrations |
| In September 2026, DHL Group announced a S$22 million Coldchain Hub at Changi and a second Pharma Hub of more than 8,000 square meters | Planned, with the second hub due in the first half of 2027 and the Changi site in late 2027 |
Automation and digital bunkering lower handling costs
- Automated terminals at Tuas underpin what PSA calls the largest fully automated container terminal in the world, with 26 kilometers of deepwater berths planned by the 2040s.
- Digital bunkering became standard for all Singapore suppliers by August 2025, according to the Maritime and Port Authority, a step that moves bunker paperwork into digital records.
- Automated parcel sorting at Singapore Post uses 3D sorting technology, and the company is also trialing autonomous vehicles with Zelostech inside its logistics hub.
- High-rise warehousing such as the Fusionaris system from YCH Group combines automated storage and retrieval with a ramp-up building to use scarce land more intensively.
Need a Custom Version of This Report?
Tailor the scope, geography, or segments to your exact requirements.
- Custom geography or segment scope
- Direct access to our analyst team
Global forwarders and local integrators share the hub
Competition splits between global networks and local integrators, with buyers usually separating international lanes from in-country contracts. DHL, Kuehne + Nagel, DSV and GEODIS compete for forwarding and regional distribution mandates, and each has invested in dedicated Singapore sites. GEODIS strengthened its local contract logistics base by buying Keppel Logistics in July 2022, while DSV committed to its largest Singapore warehouse with LOGOS. UPS and FedEx compete on express lanes through Changi, where FedEx added Anchorage freighters in 2025. Singapore Post holds the domestic letter network and now sells access to it, with FedEx acceptance points rising from six to 43 and DHL Express extended islandwide. YCH Group competes as a local integrator, and it markets a 7PL approach that overlaps with fourth party logistics, where one provider manages other contractors. Forwarding networks worldwide set pricing pressure on the lanes that these firms sell.
Companies profiled and their roles in this market
| Company | Type | Role in the market |
|---|---|---|
| DHL Group | Global integrator | Express at Changi, forwarding and pharma contract logistics at Jurong |
| Kuehne + Nagel International AG | Global forwarder | 50,000-square-meter western hub serving high-tech and pharma customers |
| DSV A/S | Global forwarder | DSV Pearl five-story ramp-up warehouse on Tukang Innovation Drive |
| GEODIS | Global forwarder | Keppel DistriPark freight station and former Keppel Logistics contract sites |
| United Parcel Service | Express integrator | 22 weekly Changi flights and a Gul Circle healthcare facility |
| FedEx Corporation | Express integrator | Nonstop Anchorage freighters on the Singapore to U.S. lane |
| Singapore Post Limited | National post | Domestic e-commerce delivery and Regional eCommerce Logistics Hub |
| YCH Group Pte Ltd | Local integrator | Supply Chain City campus and regional contract logistics since 1955 |
Capacity is secured, so margin now decides the winners
Credence Research's view is that the market is not short of capacity, since Tuas and new warehouses keep adding space ahead of demand. Margin rather than volume is therefore the main contest among providers. Providers that convert fuel, permit and rent swings into contract terms will hold their position better than those selling on volume, because a mature hub leaves little room to absorb shocks. Pharma space looks attractive today, yet several large sites arrive in 2027, so later entrants should target validated overflow and packing rather than building more large-format cold rooms.
Modeled values built on official Singapore statistics
The report uses 2025 as the base year and 2035 as the forecast year, with 2026 to 2035 as the CAGR period. Market values come from the Credence Research model, which brings the earlier published estimate forward to 2025 and checks it against official transport value added. Segment and zone splits are Credence Research estimates drawn from public data. Source types are government statistics, regulator releases, company announcements and trade publications. No interviews or surveys were conducted for this edition of the report.
Tuas consolidation sets the pace of demand through 2035
The market reaches USD 94.29 billion by 2035 as Singapore absorbs more transshipment at Tuas and keeps higher-value air and pharma flows. Annual growth looks modest because the hub is mature and land is limited, yet the mix improves as chilled and automated services expand. Route changes after the 2026 shipping disruption could help or hurt volumes in any single year, while U.S. tariff rules remain the largest policy unknown. Electric truck adoption and the 2040s consolidation of Pasir Panjang will shape operating costs across the western corridor later in the forecast.
Frequently Asked Questions
What is the Singapore logistics market size?
What is the largest segment of the Singapore freight and logistics market?
What are the main freight and logistics market trends in Singapore?
Which logistics services in Singapore are growing fastest?
Are there fourth party logistics providers in Singapore?
How does Singapore rank on logistics performance?
Which companies operate in the Singapore freight and logistics market?
Which part of Singapore leads the logistics market?
Table of Content
Chapter 1 Market Segmentation
- 1.1 Segmentation Framework
- 1.1.1 Product and Service Classification
- 1.1.2 Application and End-Use Classification
- 1.1.3 Technology and Solution Classification
- 1.1.4 Customer and Distribution Channel Classification
- 1.1.5 Geographic Segmentation
- 1.1.6 Market Segment Definitions and Boundaries
- 1.2 By Transportation Mode
- 1.2.1 Sea Freight
- 1.2.2 Air Freight
- 1.2.3 Road Freight
- 1.3 By Logistics Services
- 1.3.1 Freight Forwarding
- 1.3.2 Third-Party Logistics
- 1.3.3 Warehousing and Storage
- 1.3.4 Last-Mile Delivery
- 1.3.5 Cold Chain Logistics
- 1.4 By End-User
- 1.4.1 Manufacturing
- 1.4.2 E-commerce and Retail
- 1.4.3 Oil and Gas
- 1.4.4 Chemicals
- 1.4.5 Pharmaceutical and Healthcare
- 1.4.6 Others
Chapter 2 Introduction
- 2.1 Report Objectives and Scope
- 2.2 Product Definition and Industry Terminology
- 2.3 Market Inclusions and Exclusions
- 2.4 Research Process
- 2.4.1 Primary Research and Expert Interviews
- 2.4.2 Secondary Research and Source Review
- 2.4.3 Top-Down and Bottom-Up Estimation
- 2.4.4 Data Triangulation and Verification
- 2.5 Market Size Measurement Basis
- 2.5.1 2025: USD 65.75 billion → 2035: USD 94.29 billion
- 2.6 Historical and Forecast Reference Periods
- 2.6.1 Historical Period: 2018-2025
- 2.6.2 Base Year: 2025
- 2.6.3 Forecast Period: 2025-2035
- 2.7 Research Assumptions and Limitations
Chapter 3 Executive Summary
- 3.1 Market Snapshot and Key Findings
- 3.2 Base-Year Market Size, 2025
- 3.3 Forecast Market Size, 2035
- 3.4 Revenue and Volume Growth Outlook
- 3.5 Key Demand and Supply Indicators
- 3.6 Leading Market Segments
- 3.7 Fastest-Growing Market Opportunities
- 3.8 Regional Performance Highlights
- 3.9 Technology and Industry Transformation
- 3.10 Competitive Landscape Summary
- 3.11 Analyst View and Strategic Implications
Chapter 4 Singapore Freight and Logistics Market Trends and Developments
- 4.1 Historical Industry Development, 2018-2025
- 4.2 Recent Market Trends and Developments
- 4.3 Demand and Customer Behavior Trends
- 4.4 Technology and Product Innovation
- 4.5 Artificial Intelligence, Automation and Digitalization
- 4.6 Local Manufacturing and Supply Chain Realignment
- 4.7 Industry Partnerships, Mergers and Acquisitions
- 4.8 Sustainability and Circular Economy Developments
- 4.9 Government and Private Sector Investment Trends
- 4.10 Emerging Business Models and Commercialization
- 4.11 Industry Developments and Announcements
Chapter 5 Singapore Freight and Logistics Market Production, Supply and Demand Analysis
- 5.1 Demand Trend and Consumption Analysis, 2018-2025
- 5.2 Demand Forecast, 2025-2035
- 5.3 Production and Output Trend, 2018-2025
- 5.4 Production and Output Forecast, 2025-2035
- 5.5 Installed Capacity and Capacity Utilization
- 5.6 Company-Wise Production Plants and Statistics
- 5.6.1 Installed Production Capacity
- 5.6.2 Actual Production
- 5.6.3 Planned Capacity and Expansion Targets
- 5.7 Supply Chain Structure and Procurement Trends
- 5.8 Supply-Demand Gap and Bottlenecks
- 5.9 Import Dependence and Sourcing Structure
- 5.10 Contract Manufacturing and Outsourcing
- 5.11 Regional Supply and Demand Concentration
Chapter 6 Singapore Freight and Logistics Market Pricing Analysis
- 6.1 Pricing Structure and Measurement
- 6.2 Historical Pricing Trends, 2018-2025
- 6.3 Pricing Outlook, 2025-2035
- 6.4 Average Selling Price and Unit Economics
- 6.5 Pricing by Product and Market Segment
- 6.6 Geographic Pricing Differences
- 6.7 Key Input, Energy, Labor and Logistics Costs
- 6.8 Contract Pricing and Purchasing Models
- 6.9 Pricing Sensitivity and Competitive Positioning
- 6.10 Price, Margin and Profitability Implications
Chapter 7 Singapore Freight and Logistics Market Dynamics
- 7.1 Market Growth Drivers
- 7.1.1 Demand-Side Drivers
- 7.1.2 Technology and Innovation Drivers
- 7.1.3 Infrastructure and Investment Drivers
- 7.1.4 Regulatory and Policy Drivers
- 7.2 Market Restraints
- 7.2.1 Cost and Affordability Constraints
- 7.2.2 Technology and Adoption Barriers
- 7.2.3 Supply Chain and Operational Constraints
- 7.3 Market Challenges
- 7.3.1 Competitive Pressure and Margin Erosion
- 7.3.2 Skills, Infrastructure and Implementation Gaps
- 7.4 Emerging Market Opportunities
- 7.5 Market Dynamics Impact and Time-Horizon Assessment
Chapter 8 Singapore Freight and Logistics Value Chain Analysis
- 8.1 Industry Value Chain Overview
- 8.2 Upstream Suppliers and Critical Inputs
- 8.3 Technology and Component Providers
- 8.4 Manufacturing or Service Delivery
- 8.5 Distribution, Channel Partners and Integrators
- 8.6 Downstream Applications and End Users
- 8.7 Value Addition and Profit Pools
- 8.8 Vertical Integration and Outsourcing
- 8.9 Supplier Concentration and Risk
- 8.10 Supply Chain Localization and Resilience
Chapter 9 Singapore Freight and Logistics Market Regulations and Policies
- 9.1 Relevant Laws, Standards and Compliance Frameworks
- 9.2 Product, Service, Safety and Quality Requirements
- 9.3 Government Policies, Incentives and Subsidies
- 9.4 Imports, Exports and Trade Barriers
- 9.5 Public Procurement and Local Content Requirements
- 9.6 Environmental and Sustainability Compliance
- 9.7 Upcoming Policy Changes and Market Implications
Chapter 10 Singapore Freight and Logistics Market Hotspots and Opportunities
- 10.1 Market Opportunity Mapping and Growth Hotspots
- 10.2 High-Growth Applications and Customer Groups
- 10.3 Underserved Markets and White-Space Opportunities
- 10.4 Emerging Technology and Product Opportunities
- 10.5 New Capacity and Investment Hotspots
- 10.6 Market Entry and Expansion Opportunities
- 10.7 Distribution and Partnership Opportunities
- 10.8 Near-Term and Long-Term Commercial Potential
- 10.9 Opportunity Attractiveness and Execution Risks
Chapter 11 Singapore Freight and Logistics Market Outlook, 2025-2035
- 11.1 Market Size and Analysis
- 11.1.1 Revenue (Market Measurement: 2025: USD 65.75 billion → 2035: USD 94.29 billion)
- 11.1.2 Market Volume and Quantity Sold
- 11.1.3 Historical Market Size, 2018-2025
- 11.1.4 Base-Year Market Size, 2025
- 11.2 Market Forecast, 2025-2035
- 11.2.1 Revenue Forecast to 2035
- 11.2.2 Volume Forecast to 2035
- 11.2.3 CAGR and Year-on-Year Growth
- 11.2.4 Incremental Revenue Opportunity
- 11.3 Forecast Assumptions and Scenario Analysis
- 11.3.1 Base-Case Forecast
- 11.3.2 Optimistic and Conservative Scenarios
- 11.3.3 Technology, Pricing and Policy Sensitivities
- 11.4 Market Attractiveness and Growth Outlook
Chapter 12 Singapore Freight and Logistics Market Segmentation and Outlook
- 12.1 Segmentation Summary and Market Shares, 2025
- 12.2 Largest and Fastest-Growing Segments
- 12.3 By Transportation Mode - Market Size and Forecast, 2025-2035
- 12.3.1 Segment Definition and Scope
- 12.3.2 Historical Market Size, 2018-2025
- 12.3.3 Revenue Forecast, 2025-2035
- 12.3.4 Volume Forecast, 2025-2035
- 12.3.5 Base-Year Market Share, 2025
- 12.3.6 Segment CAGR and Growth Drivers
- 12.3.7 Subsegment Market Size and Forecast
- 12.3.7.1 Sea Freight
- 12.3.7.2 Air Freight
- 12.3.7.3 Road Freight
- 12.3.8 Subsegment Pricing and Adoption Trends
- 12.3.9 Leading Suppliers and Competition
- 12.3.10 Regional Demand and Opportunities
- 12.4 By Logistics Services - Market Size and Forecast, 2025-2035
- 12.4.1 Segment Definition and Scope
- 12.4.2 Historical Market Size, 2018-2025
- 12.4.3 Revenue Forecast, 2025-2035
- 12.4.4 Volume Forecast, 2025-2035
- 12.4.5 Base-Year Market Share, 2025
- 12.4.6 Segment CAGR and Growth Drivers
- 12.4.7 Subsegment Market Size and Forecast
- 12.4.7.1 Freight Forwarding
- 12.4.7.2 Third-Party Logistics
- 12.4.7.3 Warehousing and Storage
- 12.4.7.4 Last-Mile Delivery
- 12.4.7.5 Cold Chain Logistics
- 12.4.8 Subsegment Pricing and Adoption Trends
- 12.4.9 Leading Suppliers and Competition
- 12.4.10 Regional Demand and Opportunities
- 12.5 By End-User - Market Size and Forecast, 2025-2035
- 12.5.1 Segment Definition and Scope
- 12.5.2 Historical Market Size, 2018-2025
- 12.5.3 Revenue Forecast, 2025-2035
- 12.5.4 Volume Forecast, 2025-2035
- 12.5.5 Base-Year Market Share, 2025
- 12.5.6 Segment CAGR and Growth Drivers
- 12.5.7 Subsegment Market Size and Forecast
- 12.5.7.1 Manufacturing
- 12.5.7.2 E-commerce and Retail
- 12.5.7.3 Oil and Gas
- 12.5.7.4 Chemicals
- 12.5.7.5 Pharmaceutical and Healthcare
- 12.5.7.6 Others
- 12.5.8 Subsegment Pricing and Adoption Trends
- 12.5.9 Leading Suppliers and Competition
- 12.5.10 Regional Demand and Opportunities
- 12.6 Segment Growth Comparison
- 12.7 Segment Attractiveness and Priority Matrix
Chapter 13 Singapore Freight and Logistics End-Use and Application Market Outlook
- 13.1 End-Use Industry and Customer Demand Structure
- 13.2 Leading Applications and Customer Groups
- 13.3 End-Use Market Size, Share and Forecast
- 13.4 Major End-Use Industry Deep Dives
- 13.4.1 Customer Requirements and Use Cases
- 13.4.2 Demand and Replacement Cycles
- 13.4.3 Technical and Regulatory Considerations
- 13.4.4 Purchasing and Procurement Models
- 13.4.5 Leading Vendors and Distribution Channels
- 13.4.6 Forecast and Commercial Opportunities
- 13.5 Emerging Applications and Cross-Segment Demand
- 13.6 End-Use Industry Investment Priorities
Chapter 14 Singapore Freight and Logistics Geographic Market Outlook, 2025-2035
- 14.1 Domestic Market Distribution and Demand Clusters
- 14.2 State- or Province-Wise Market Size and Forecast, 2025-2035
- 14.3 City and Metropolitan Market Outlook
- 14.4 Industrial, Manufacturing and Commercial Clusters
- 14.5 Geographic Concentration of Key End Users
- 14.6 Local Pricing and Purchasing Differences
- 14.7 Domestic Production Facilities and Capacity Map
- 14.8 Local Infrastructure and Project Pipeline
- 14.9 State-Level Policy and Incentive Differences
- 14.10 Subnational Investment Hotspots and Opportunities
- 14.11 Distribution and Logistics Networks
- 14.12 Domestic Competitive Footprint
Chapter 15 Singapore Freight and Logistics Technology, Innovation and Sustainability Outlook
- 15.1 Technology Landscape and Maturity
- 15.2 Product, Process and Service Innovation
- 15.3 AI, Automation and Digital Tools in the Industry
- 15.4 Technology Adoption and Performance Benchmarking
- 15.5 Innovation Pipeline and R&D Investment
- 15.6 Patent and Intellectual Property Trends
- 15.7 Energy Efficiency and Resource Management
- 15.8 Sustainability, Recycling and Circularity
- 15.9 Technology Roadmap, 2025-2035
- 15.10 Risks of Obsolescence and Technology Substitution
Chapter 16 Singapore Freight and Logistics Market Key Strategic Imperatives
- 16.1 Growth and Market Entry Priorities
- 16.2 High-Return Products and Segments
- 16.3 Pricing, Profitability and Cost Optimization
- 16.4 Technology Investment and Product Differentiation
- 16.5 Supply Chain Localization and Resilience
- 16.6 Distribution and Customer Acquisition
- 16.7 Partnership, Acquisition and Capacity Strategy
- 16.8 Regional Expansion Priorities
- 16.9 Short-, Medium- and Long-Term Actions
Chapter 17 Competition Outlook
- 17.1 Industry Competition Characteristics
- 17.2 Market Structure and Concentration
- 17.3 Market Share and Competitive Positioning, 2025
- 17.4 Company-Wise Revenue and Product Benchmarking
- 17.5 Production and Service Capacity Benchmarking
- 17.6 Technology, Pricing and Differentiation
- 17.7 Regional Footprint and Distribution Strength
- 17.8 Mergers, Acquisitions and Strategic Alliances
- 17.9 New Entrants and Competitive Threats
- 17.10 Porter's Five Forces and Industry Attractiveness
- 17.11 Competitive Outlook, 2025-2035
Chapter 18 Company Profiles
- 18.1 Company Coverage and Selection Criteria
- 18.2 DHL Group
- 18.2.1 Business Description
- 18.2.2 Company Ownership and Geographic Presence
- 18.2.3 Product and Service Portfolio
- 18.2.4 Manufacturing and Operating Footprint
- 18.2.5 Production Capacity and Expansion Plans
- 18.2.6 Financial Performance and Investment
- 18.2.7 Market Share and Competitive Position
- 18.2.8 Technology and Innovation Capabilities
- 18.2.9 Strategic Alliances or Partnerships
- 18.2.10 Recent Developments
- 18.2.11 Growth Strategy and Outlook
- 18.3 Kuehne + Nagel International AG
- 18.4 DSV A/S
- 18.5 GEODIS
- 18.6 United Parcel Service
- 18.7 FedEx Corporation
- 18.8 Singapore Post Limited
- 18.9 YCH Group Pte Ltd
- 18.10 Other Relevant Market Participants
Note: Every listed company is profiled on the structure shown under the first company. The company list is preliminary and may change based on research findings, market developments, data availability and client requirements.
Chapter 19 Disclaimer
- 19.1 Research and Forecast Disclaimer
- 19.2 Data Source and Estimation Limitations
Note: The depth of individual sections depends on data availability for this market. Volume, capacity, trade and other unit-based metrics are included where applicable.