
Vietnamese eating out blends street stalls, cafes and chains
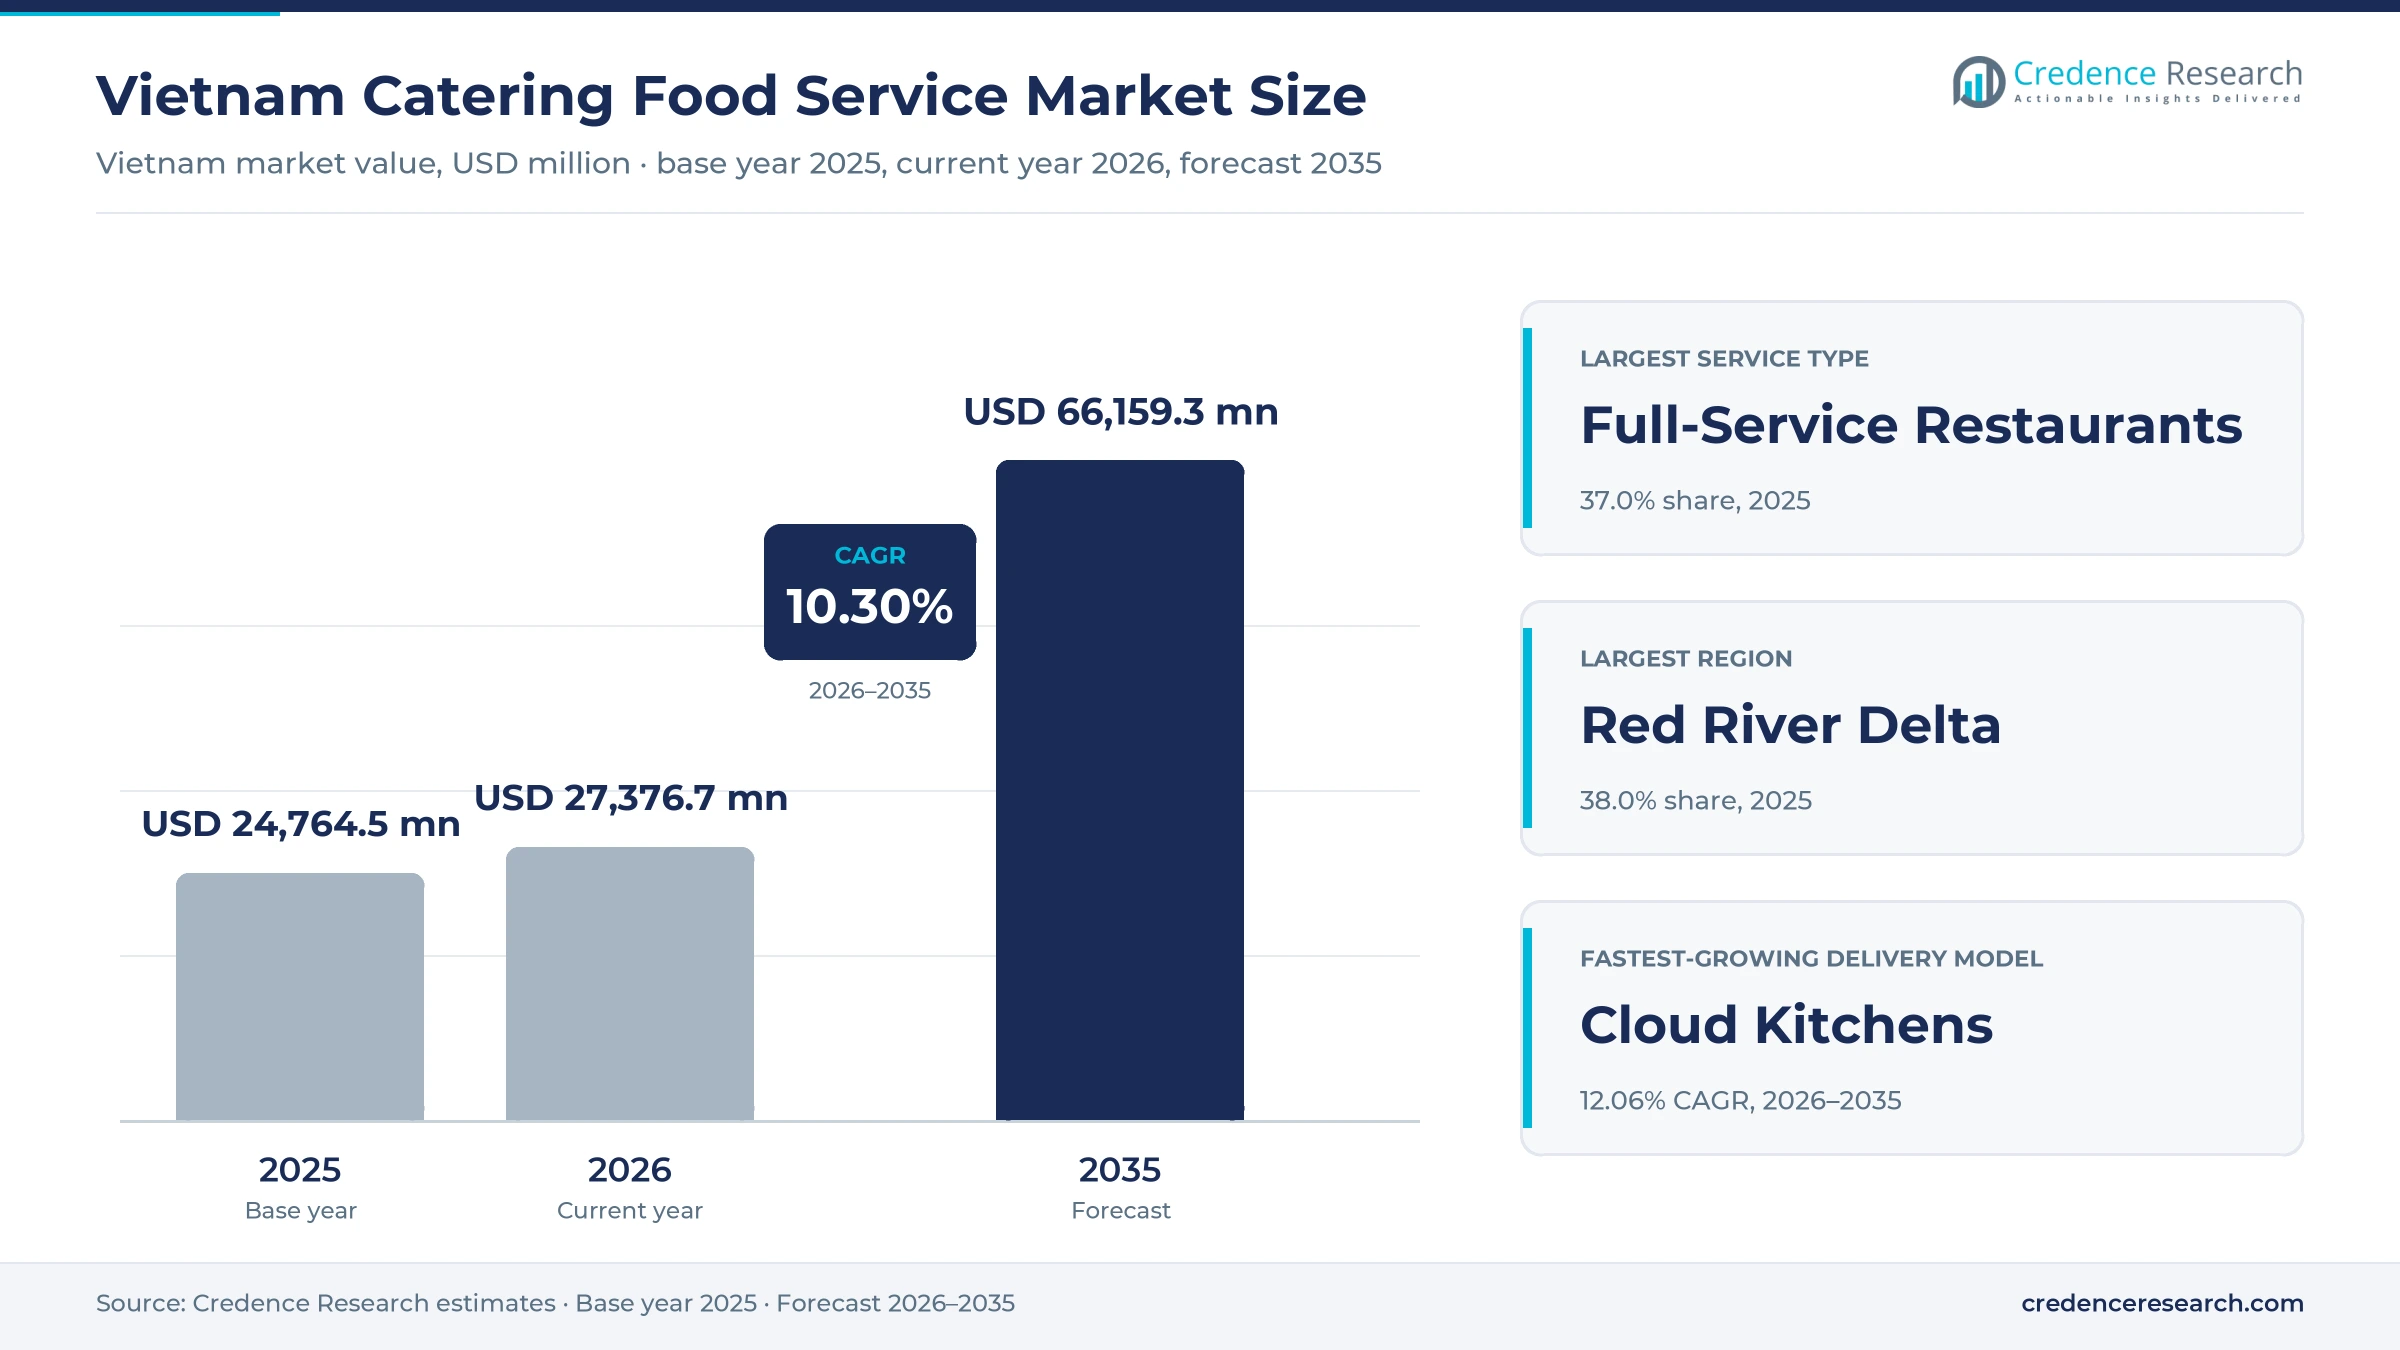
The Vietnam catering food service market was valued at USD 24.76 billion in 2025 and is projected to increase from USD 27.38 billion in 2026 to USD 66.16 billion by 2035, registering a CAGR of 10.30% during 2026–2035. Demand comes from office workers, students, families and visitors who eat out daily at street stalls, restaurants, coffee shops and workplace canteens. The Red River Delta held the largest regional share, 38.0% in 2025, because Hanoi and nearby industrial provinces combine dense offices, factories and visitor flows. Central Vietnam is the fastest-growing region at 10.87% a year, as Da Nang and coastal resorts draw international visitors who spend more per meal. Full-service restaurants led the service mix in 2025, while chain operators add coffee shops, hotpot outlets and fried chicken stores. A value-added tax cut to 8% for a broad range of goods and services, which runs to the end of 2026, also supports household spending.
Which outlets and meal occasions does the estimate cover?
The estimate measures consumer and business spending on prepared meals and drinks served by full-service restaurants, quick-service restaurants, cafes and bars, and contract caterers in Vietnam. It covers dine-in, takeaway, third-party delivery and cloud kitchen orders, along with managed catering for offices, factories, schools and hospitals. Values are stated at current prices and include spending by residents, domestic travelers and international visitors.
The estimate excludes packaged food sold through supermarkets and convenience stores, hotel room revenue, airline catering and food exports. The value chain runs from farms, processors and distributors through central kitchens and outlets to delivery platforms and payment networks that connect operators with diners.
Vietnam Catering Food Service Market Insights
- The Vietnam catering food service market was valued at USD 24.76 billion in 2025 and is projected to reach USD 66.16 billion by 2035, registering a CAGR of 10.30% during 2026–2035.
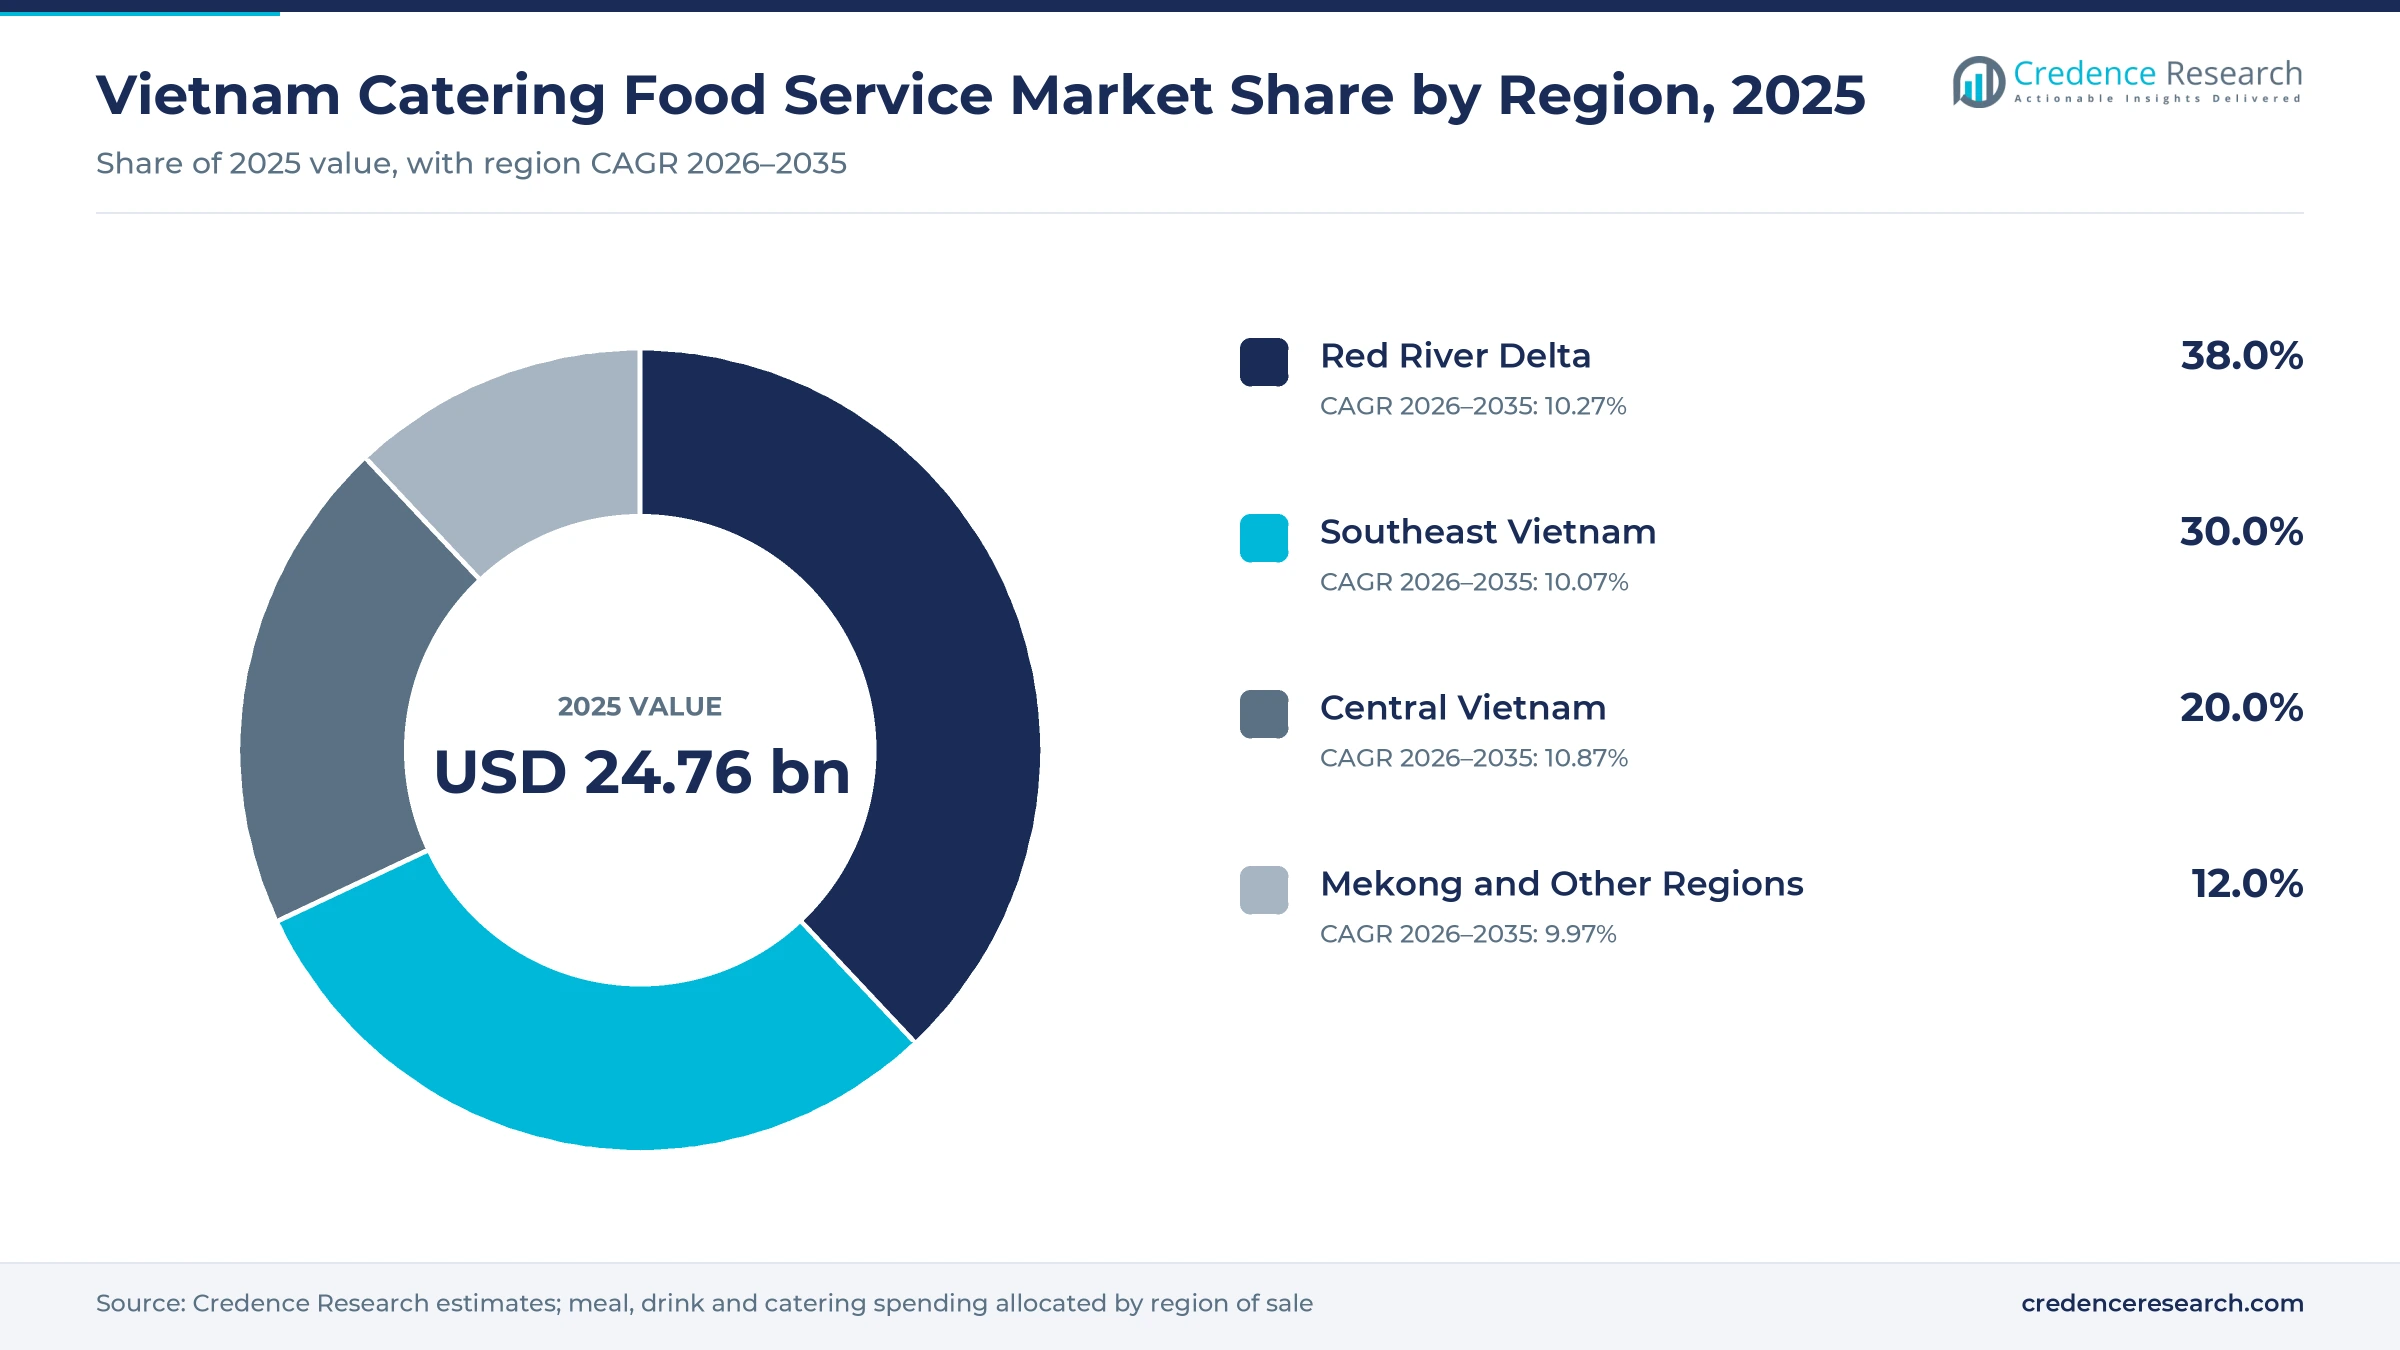
- The Red River Delta held 38.0% of 2025 spending, because Hanoi and nearby provinces combine dense offices, factories and visitor flows.
- Full-service restaurants led with 37.0% of 2025 value, because hotpot, barbecue and family restaurants anchor group dining in Vietnamese cities.
- Vietnam received nearly 21.2 million international visitors in 2025, up 20.4% from 2024 and 17.8% above the 2019 level, according to the government.
- Highlands Coffee ended 2025 with 985 stores after opening 134 outlets during the year, which shows chain formats still expanding quickly.
Full-service dining leads while quick service grows fastest
Why do full-service restaurants lead spending?
Based on service type, the market is categorized into full-service restaurants, quick-service restaurants, cafes and bars, and contract catering. Full-Service Restaurants led with 37.0% of 2025 value, because hotpot, barbecue and family restaurants anchor group meals and celebrations. Quick-Service Restaurants grow fastest at 10.97% a year, as fried chicken, burger and pizza chains open stores beyond Hanoi and Ho Chi Minh City.
How much do hospitality operators add to demand?
Based on customer type, the market is categorized into individual consumers, corporate clients, public institutions and hospitality operators. Individual Consumers led with 70.0% of 2025 value, because most urban residents eat at least one meal or drink outside the home each day. Hospitality Operators grow fastest at 10.77% a year, as hotels and resorts buy outsourced banquets and restaurant operations.
How fast are delivery and cloud kitchens gaining share?
Based on delivery model, the market is categorized into dine-in, takeaway, third-party delivery and cloud kitchens. Dine-In led with 60.0% of 2025 value, because Vietnamese dining remains social and many meals are eaten at stalls, cafes and restaurants. Cloud Kitchens grow fastest at 12.06% a year, as delivery-only brands cut rent costs in dense urban districts.
Which business models are gaining share?
Based on business model, the market is categorized into independent outlets, chained outlets, franchise operations and managed catering contracts. Independent Outlets led with 58.0% of 2025 value, because family-run stalls and shophouse restaurants dominate every town. Franchise Operations grow fastest at 11.25% a year, as coffee and fast-food brands use franchisees to reach provincial cities.
| Segment Group | Leading Sub-segment | Share, 2025 | Fastest-growing Sub-segment | CAGR, 2026–2035 |
|---|---|---|---|---|
| By Service Type | Full-Service Restaurants | 37.0% | Quick-Service Restaurants | 10.97% |
| By Customer Type | Individual Consumers | 70.0% | Hospitality Operators | 10.77% |
| By Delivery Model | Dine-In | 60.0% | Cloud Kitchens | 12.06% |
| By Business Model | Independent Outlets | 58.0% | Franchise Operations | 11.25% |
Request a Free Sample
Fill in your details and we'll send you a free sample report.
- Sample data tables & charts
- Research methodology
Tourists, city diners and chains lift meal spending
How does tourism and destination dining recovery lift spending?
Tourism and destination dining recovery lifts spending, because visitors eat most meals out and spend more per meal than residents. Vietnam received nearly 21.2 million international visitors in 2025, up 20.4% from 2024 and 17.8% above 2019, according to the government news portal. China sent 5.3 million visitors and South Korea about 4.3 million, together close to half of all arrivals. The 2026 Michelin selection, announced on June 4, 2026, named a record 193 establishments, including 72 Bib Gourmand eateries. As a result, hospitality operators grow at 10.77% a year, the fastest customer rate, as culinary tourism draws visitors to Hanoi, Ho Chi Minh City and Da Nang.
Why do urban consumption and outlet density raise meal volume?
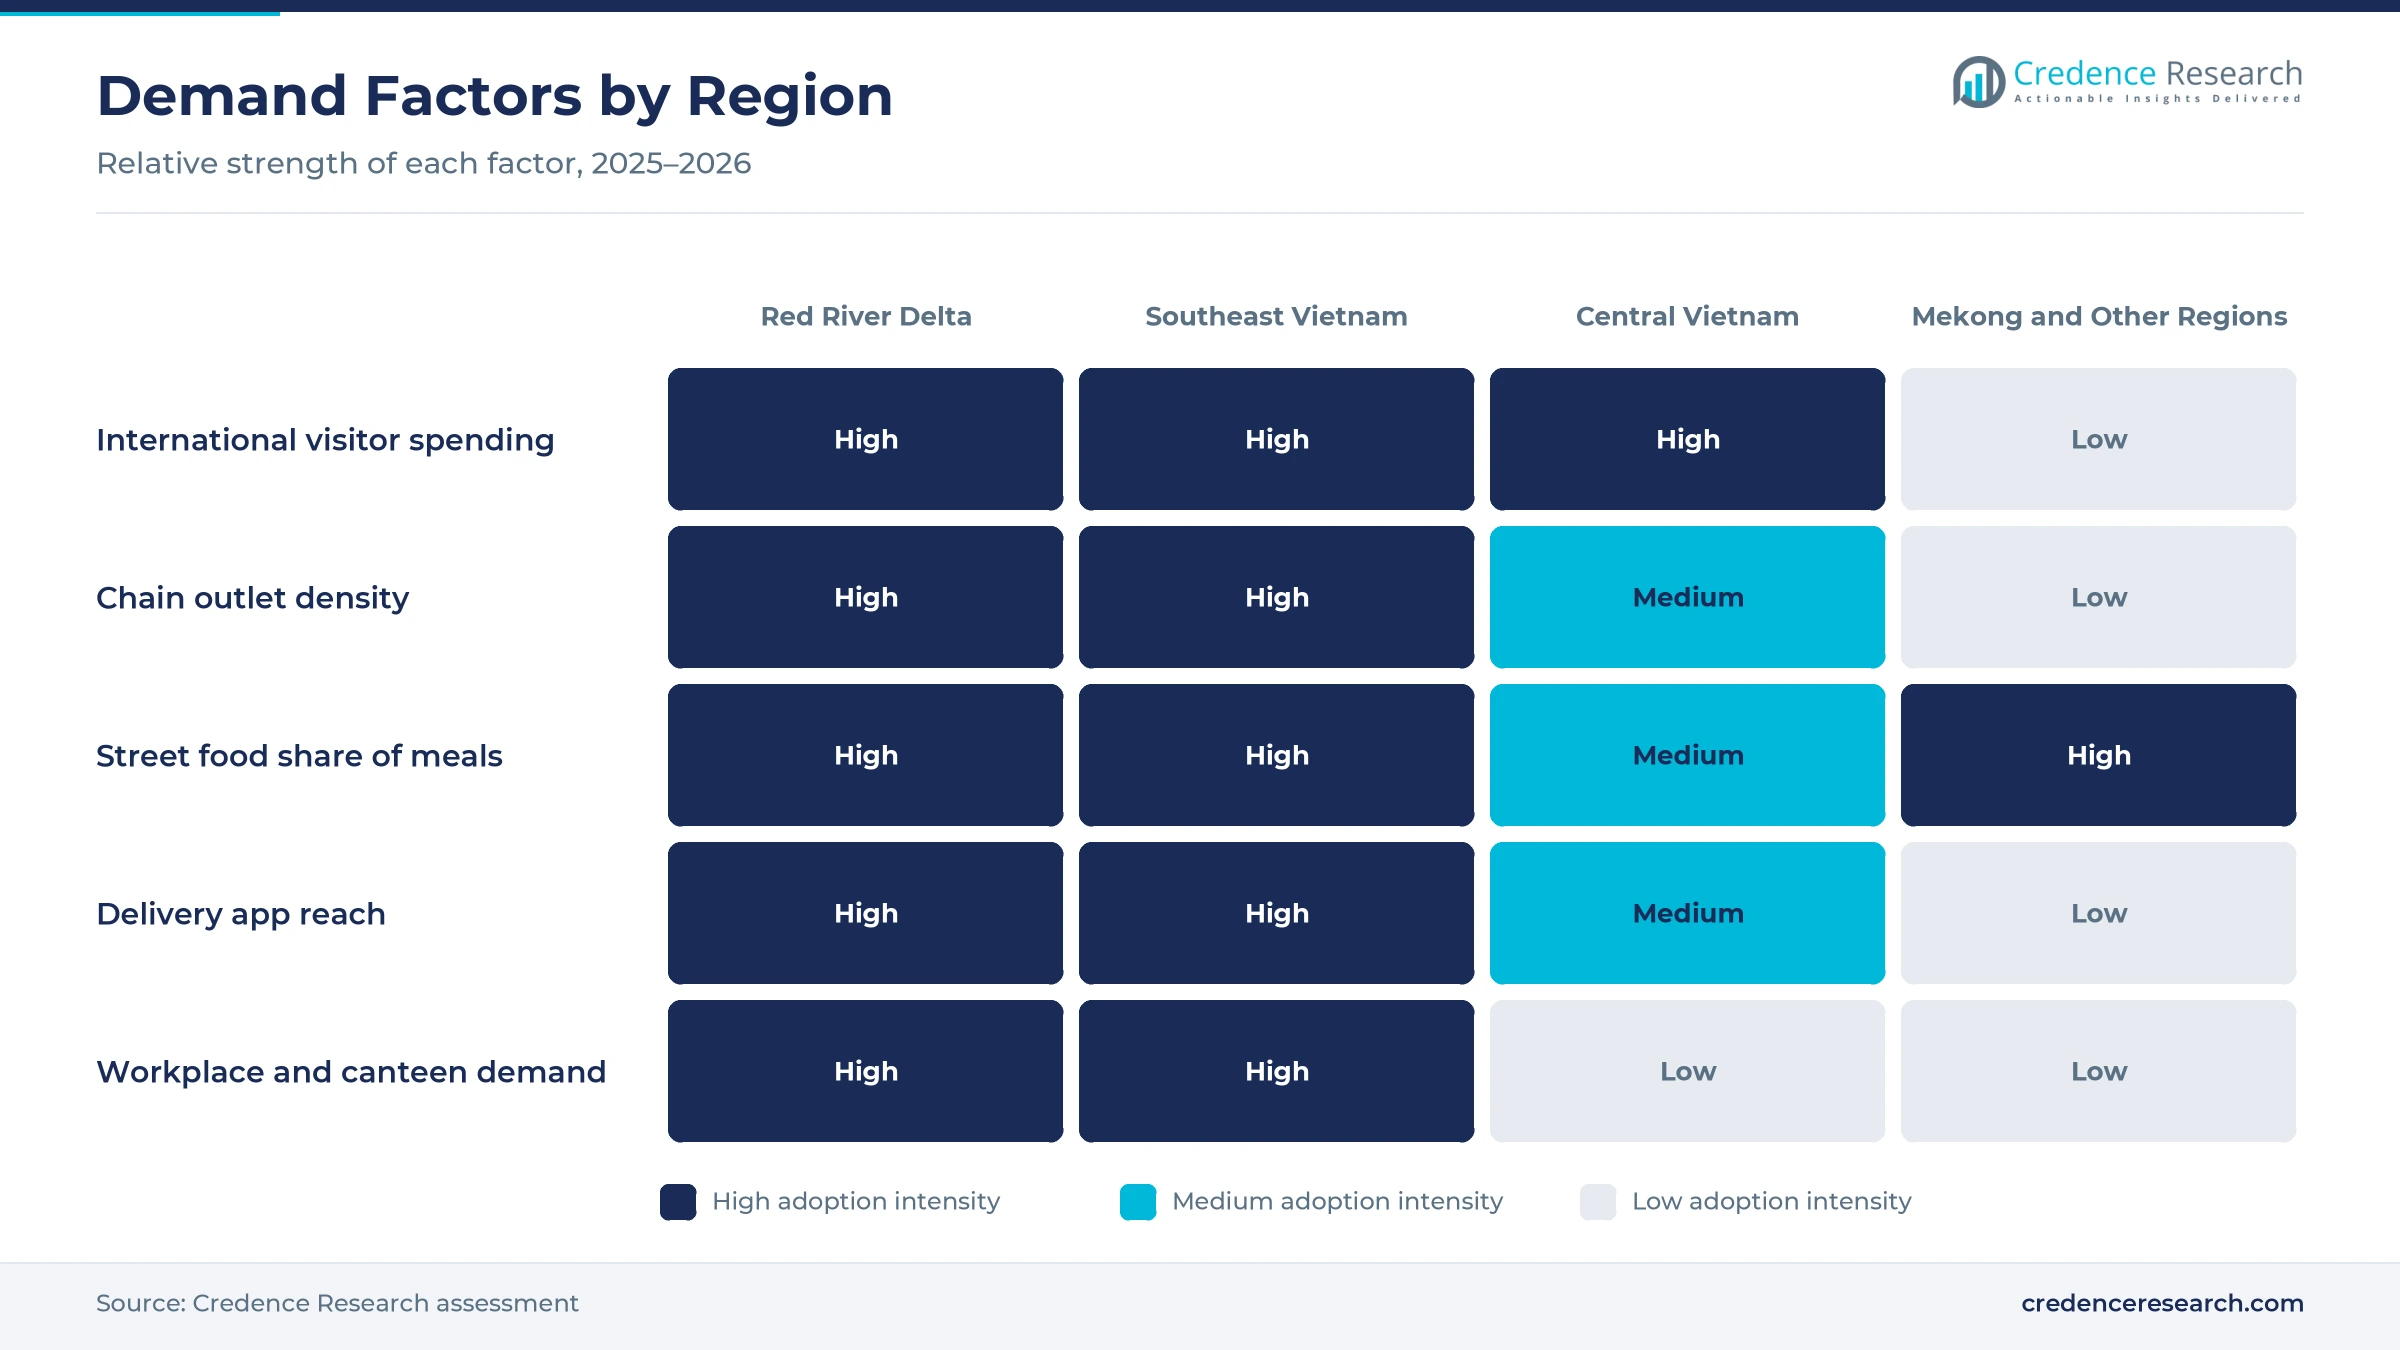
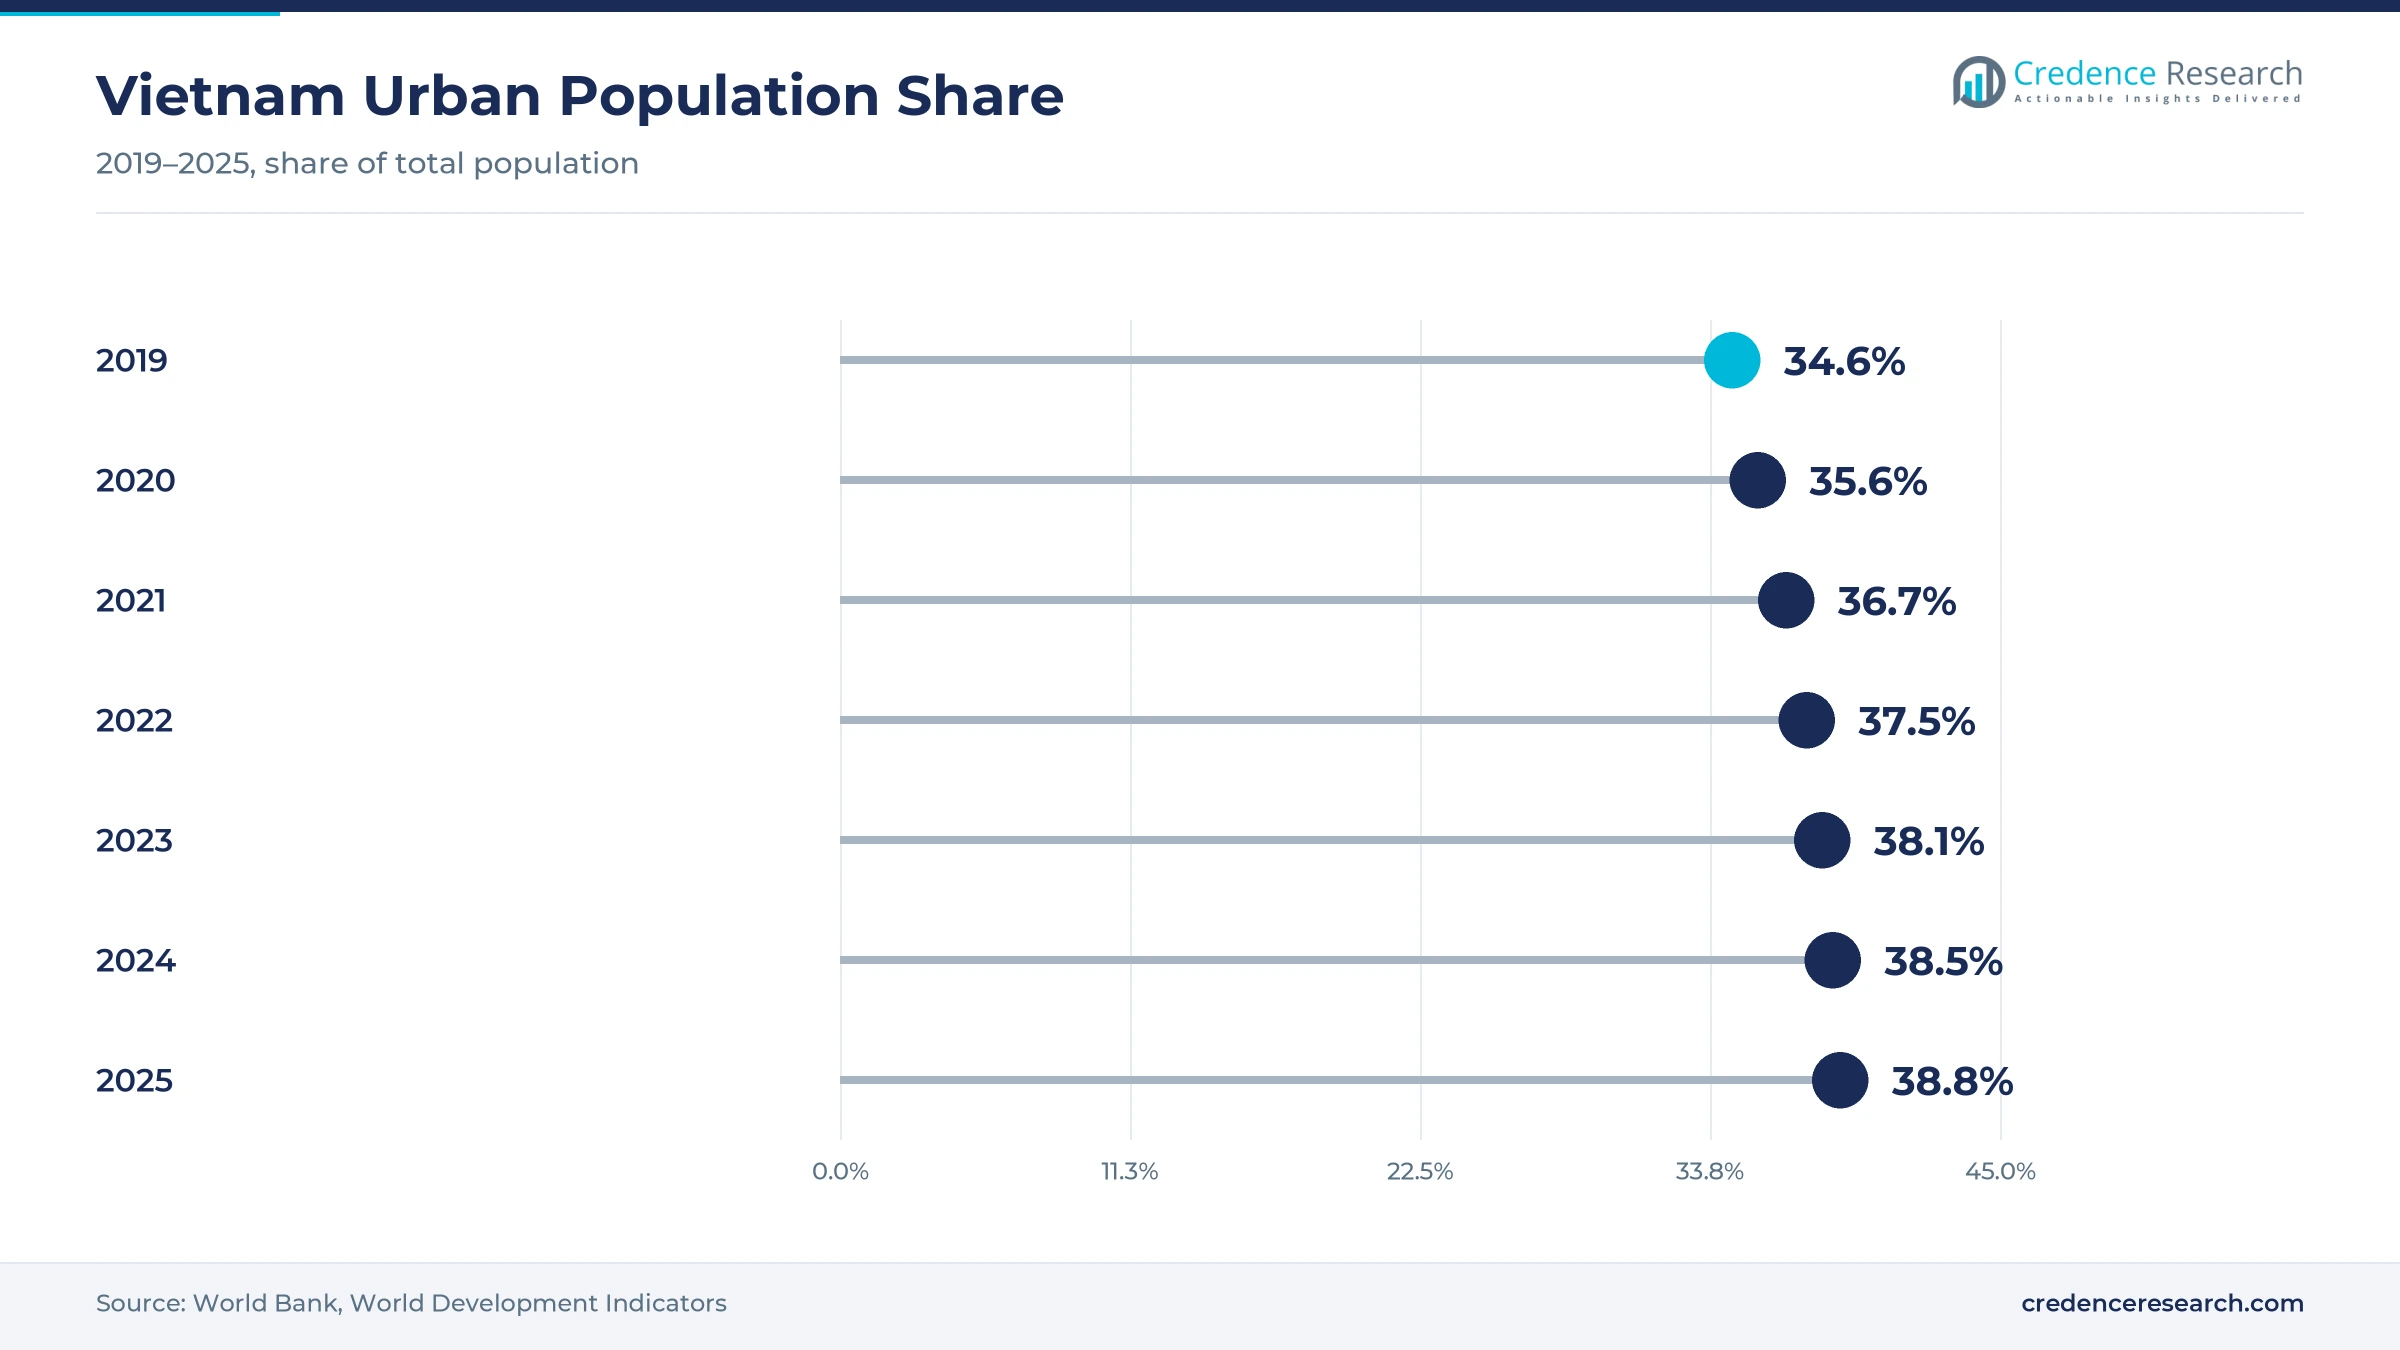
Urban consumption and outlet density raise meal volume, because city households cook less and buy more prepared meals and drinks. Accommodation and catering revenue reached VND 843.1 trillion, nearly $32.1 billion, in 2025, up 14.6% and equal to 12% of total retail sales, according to the National Statistics Office. Urban residents made up 38.8% of the population in 2025, up from 34.6% in 2019, according to World Bank data. GDP per capita also reached an estimated $5,026 in 2025, up from $4,700 in 2024. In turn, full-service restaurants hold 37.0% of 2025 value, while delivery apps extend reach to apartment districts.
How do chain expansion and brand formalization widen reach?
Chain expansion and brand formalization widen reach, because organized operators bring standard menus, hygiene systems and digital payment to new towns. Highlands Coffee ended 2025 with 985 stores after opening 134 outlets during the year, according to Tuoi Tre News. Golden Gate ran nearly 500 restaurants across more than 40 brands in 42 provinces and cities by the end of 2024, serving about 18 million customers a year. Phuc Long reached 202 stores in 34 provinces and cities at the end of 2025 after opening 19 that year. Therefore, franchise operations grow at 11.25% a year, the fastest business model rate, as brands enter provincial cities.
Why do tax relief and economic growth support eating out?
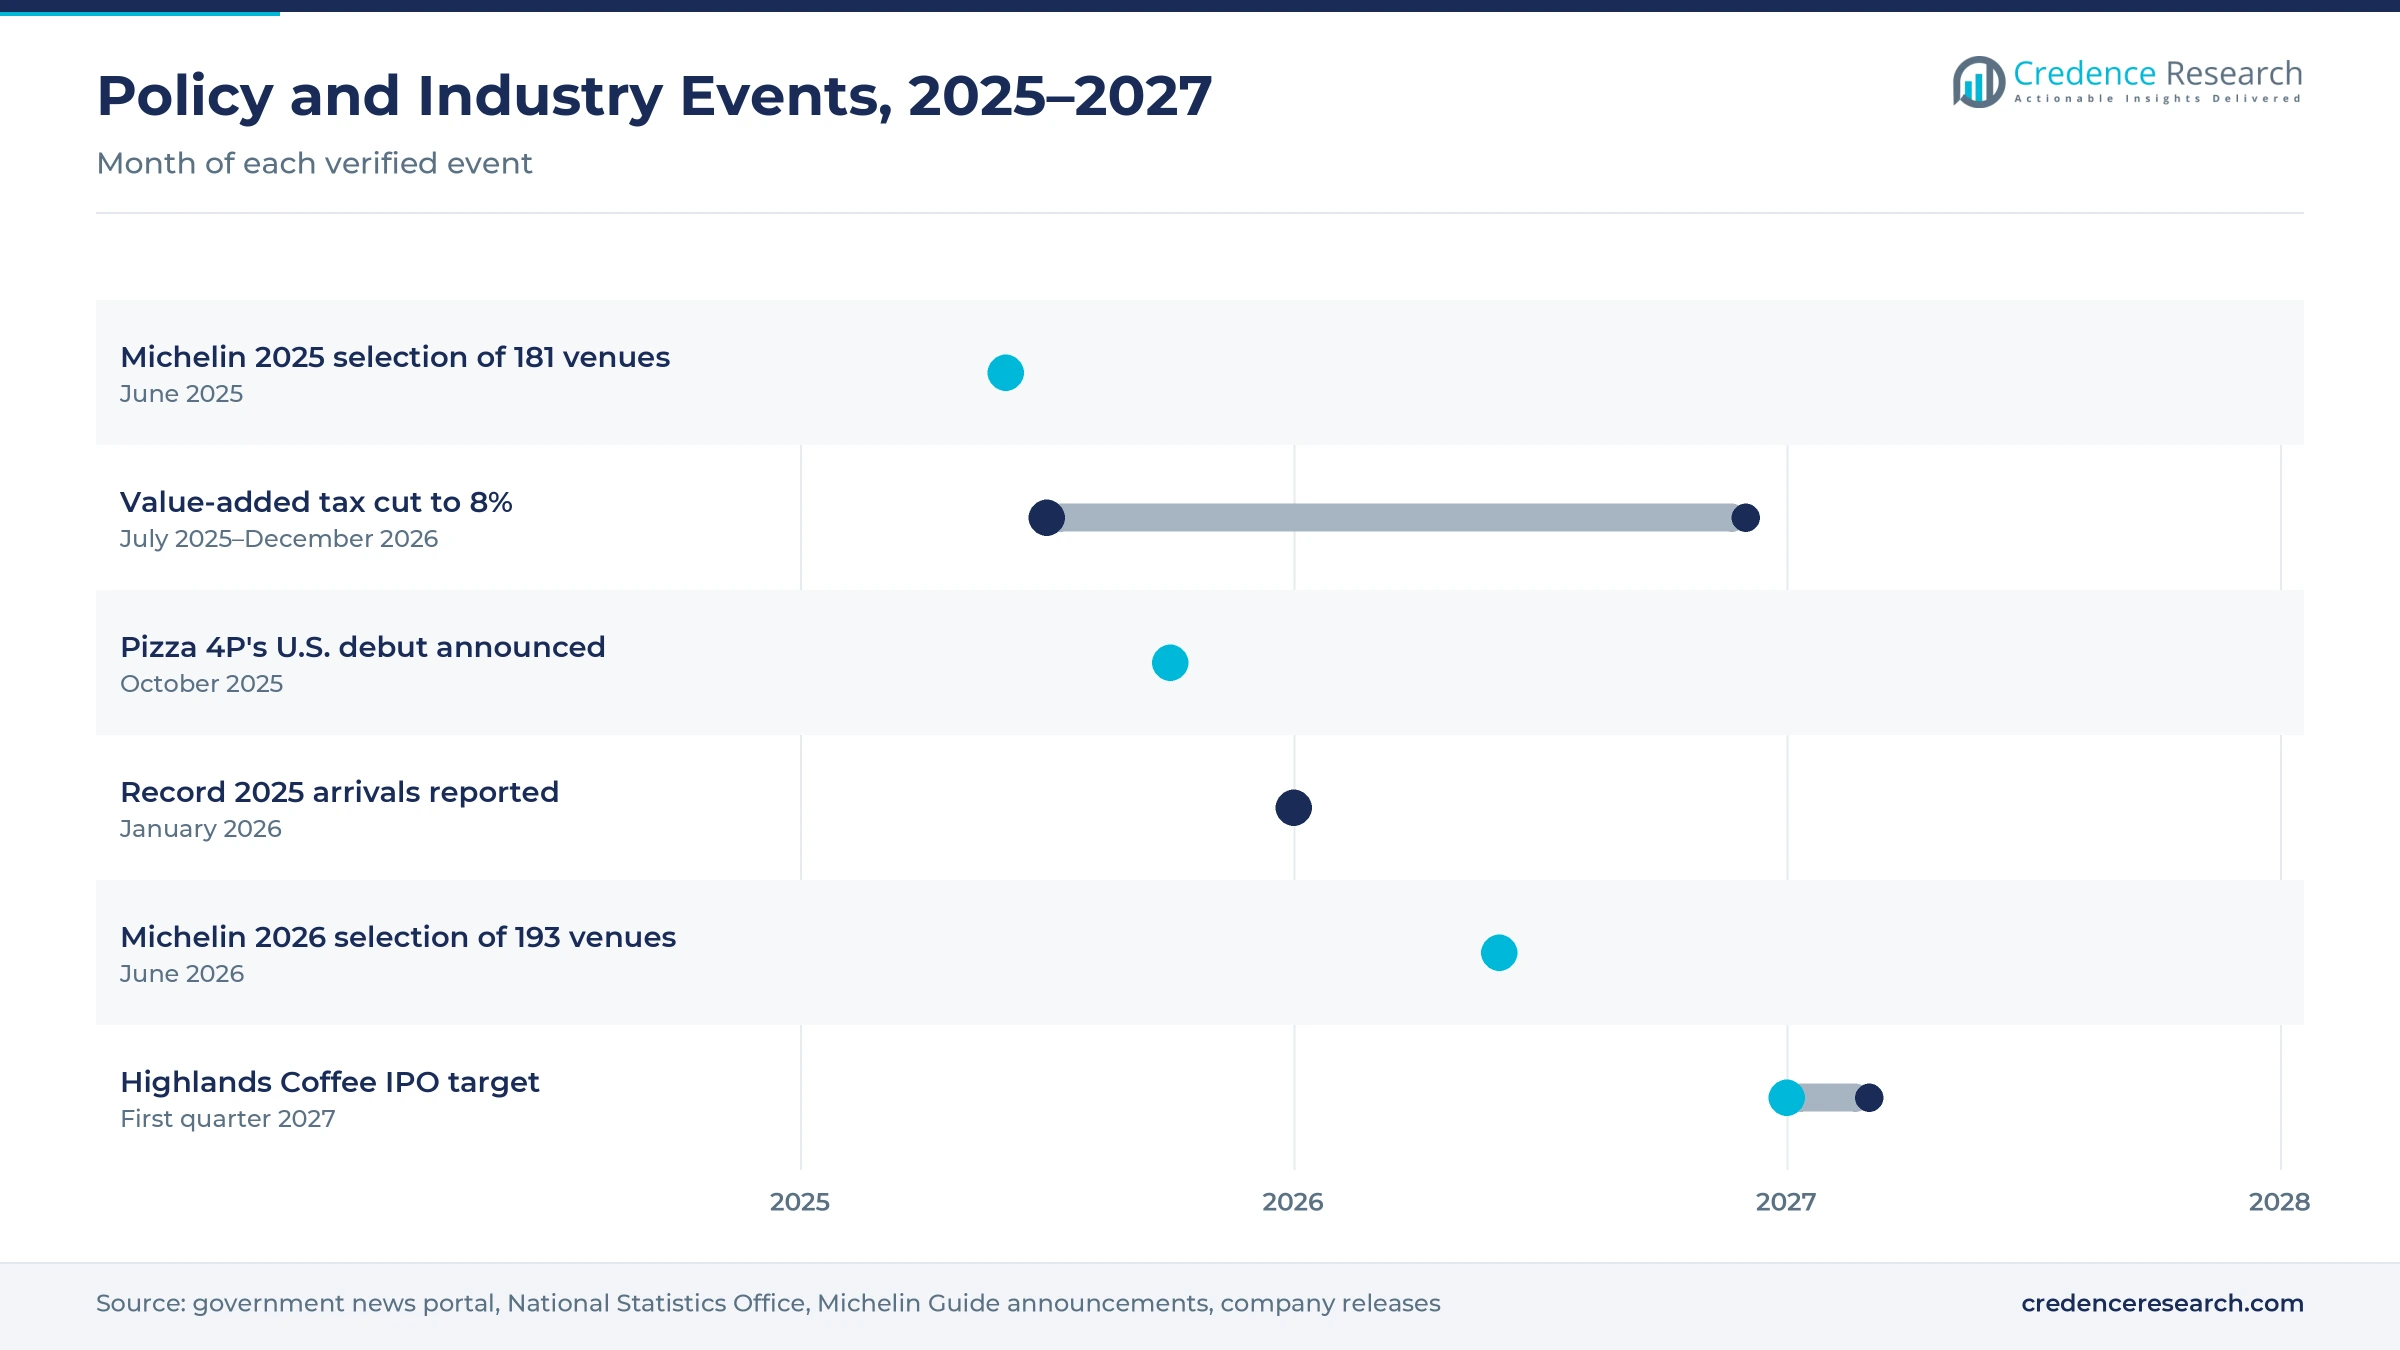
Tax relief and economic growth support eating out, because lower taxes and rising wages leave more room in household budgets for meals outside the home. Resolution No. 204/2025/QH15 cut value-added tax to 8% for a broad range of goods and services from July 1, 2025, to Dec. 31, 2026, according to Vietnam Law Magazine. GDP grew 8.02% in 2025, the second-highest rate since 2011, and services grew 8.62%, according to the National Statistics Office. Accommodation and catering revenue also rose 16.7% in the first nine months of 2026. As a result, individual consumers hold 70.0% of 2025 value as workers spend more on coffee, lunch and weekend meals.
Cafe chains, guide listings and brands abroad reshape dining
How is the rise of coffee and tea chains changing outlets?
The rise of coffee and tea chains is changing outlets, because cafes serve as meeting places, workspaces and takeaway stops in every Vietnamese city. Highlands Coffee owned 851 of its stores directly and franchised 96 at the end of 2025, while 38 stores operated in the Philippines. Jollibee Foods holds a 60% stake in SuperFoods Group, the parent of Highlands Coffee, which shows that regional groups invest in Vietnamese brands. Golden Gate also counts The Coffee House among its brands, alongside Kichi-Kichi, Gogi House and Manwah. In turn, independent outlets still hold 58.0% of 2025 value, while specialty coffee chains compete for prime corner sites.
Why are guide listings shifting diners toward local cuisine?
Guide listings are shifting diners toward local cuisine, because international recognition sends visitors and residents to pho, bun cha and seafood specialists. The 2025 Michelin selection, unveiled on June 5, 2025, in Da Nang, covered 181 establishments with nine one-star restaurants and 63 Bib Gourmand eateries. The 2026 selection added 11 new Bib Gourmand listings and raised the star count to 11, the first time it reached double digits in Vietnam. Ho Chi Minh City added 11 new establishments in 2026, the most of any city. As a result, dine-in keeps 60.0% of 2025 value as diners seek listed restaurants and street eateries.
Can Central Vietnam and European visitors open new demand?
Central Vietnam and European visitors offer a clear opening, because longer-stay travelers eat out at every meal and choose beach and heritage destinations. Vietnam received about 17.7 million international visitors in the first nine months of 2026, up 14.5%, according to Viet Nam News. Arrivals from Europe rose 55.0% in the same period, and the national target for 2026 is 25 million visitors. Da Nang added four new Michelin listings in 2026, including three Bib Gourmand eateries. As a result, Central Vietnam becomes the fastest-growing zone in the forecast, as resorts, seafood restaurants and beach bars expand to serve foreign and domestic travelers.
Is there room for Vietnamese restaurant brands to scale abroad?
Vietnamese restaurant brands have room to scale abroad, because a strong home base lets them test formats before entering new markets. Pizza 4P's, founded in Ho Chi Minh City in 2011, operates more than 30 locations across Asia, including Japan, Cambodia, Indonesia and India, and announced a U.S. debut in Brooklyn in October 2025. Highlands Coffee runs 38 stores in the Philippines, and its board targets an initial public offering in the first quarter of 2027. Golden Gate also runs more than 40 brands, which gives it formats to franchise. In turn, chain operators can use fast casual restaurants formats and capital markets to fund growth through 2035.
Labor, rent and ingredient costs squeeze operator margins
How do labor costs and staff turnover affect operators?
Labor costs and staff turnover affect operators, because restaurants and cafes rely on young cooks, baristas and servers who change jobs often. Higher wage floors raise costs for small outlets that cannot pass them on quickly, which squeezes margins. As a result, owners shorten opening hours or simplify menus during busy seasons. Chains respond with training academies, central kitchens and self-ordering tools, while family outlets rely on relatives to control costs.
Why do rent and site costs pressure chain growth?
Rent and site costs pressure chain growth, because prime corner sites in Hanoi and Ho Chi Minh City command high monthly leases. Coffee and fast-food brands compete for the same street fronts and mall units, which pushes rents higher. In turn, some chains close weak stores and move to smaller kiosks or delivery hubs. Operators respond with site analytics, shared kitchens and expansion into provincial cities where rents are lower.
How does ingredient inflation squeeze small vendors?
Ingredient inflation squeezes small vendors, because pork, beef, rice, cooking oil, herbs and coffee beans make up most of their costs. Price spikes after storms or disease outbreaks hit stalls hardest, as they have little buying power with suppliers. As a result, vendors shrink portions or raise prices, which can drive customers to chains. Larger operators respond with contract buying, central kitchens and menu changes that protect margins.
Why do food safety and hygiene rules raise compliance costs?
Food safety and hygiene rules raise compliance costs, because contract caterers and canteens serve large groups where one incident can affect many workers or students. Inspections, testing and record keeping take time and money for small operators. In turn, factories, schools and hospitals favor certified suppliers with clear sourcing. Operators respond with traceability systems, staff training and partnerships with approved ingredient suppliers.
Red River Delta leads while Central Vietnam grows fastest
| Region | Value, 2025 (USD billion) | Share, 2025 | CAGR, 2026–2035 |
|---|---|---|---|
| Red River Delta | 9.41 | 38.0% | 10.27% |
| Southeast Vietnam | 7.43 | 30.0% | 10.07% |
| Central Vietnam | 4.95 | 20.0% | 10.87% |
| Mekong and Other Regions | 2.97 | 12.0% | 9.97% |
Why does the Red River Delta hold the largest share?
The Red River Delta held 38.0% of 2025 value and grows at 10.27% a year, because Hanoi, Hai Phong and nearby industrial provinces combine government offices, factories and visitor flows. Hanoi had seven new Michelin listings in 2026, including one starred restaurant and three Bib Gourmand eateries. As a result, chains compete on new brands, premium coffee formats and workplace catering for the zone's large factory workforce.
How does Southeast Vietnam add volume?
Southeast Vietnam held 30.0% of 2025 value and grows at 10.07% a year, because Ho Chi Minh City, Binh Duong and Dong Nai host the densest outlet networks and the largest consumer base. Ho Chi Minh City added 11 new Michelin listings in 2026, the most of any city. However, growth is slightly slower because outlet density is already high, so operators compete on delivery, loyalty programs and new formats.
Why is Central Vietnam growing fastest?
Central Vietnam held 20.0% of 2025 value and grows fastest at 10.87% a year, because Da Nang, Hoi An, Hue and Nha Trang attract international visitors who eat out at every meal. Da Nang hosted the Michelin ceremony in June 2025 and added four new listings in 2026. As a result, resorts, seafood restaurants and beach bars lead new outlet openings in the zone.
What shapes demand in the Mekong and other regions?
The Mekong and Other Regions zone held 12.0% of 2025 value and grows at 9.97% a year, because the zone has a large rural population but lower incomes per household. Can Tho anchors urban dining, while provincial towns rely on family-run stalls and markets. However, chains are entering larger towns as franchise formats lower the cost of opening new stores.
Record arrivals, guide awards and tax relief marked 2025
| Development | Status and market relevance |
|---|---|
| In June 2025, the Michelin Guide named a record 181 establishments in Hanoi, Ho Chi Minh City and Da Nang. | Included 63 Bib Gourmand eateries, which supports food tourism |
| In July 2025, a value-added tax cut to 8% took effect for a broad range of goods and services. | Runs to Dec. 31, 2026, which eases prices for many diners |
| In January 2026, the government reported nearly 21.2 million international visitors for 2025. | Marked a record year with arrivals 17.8% above the 2019 level |
| In June 2026, the Michelin Guide named 193 establishments, including 11 starred restaurants. | Star count reached double digits in Vietnam for the first time |
| In October 2026, official data showed about 17.7 million international visitors in nine months. | Reached nearly 71% of the 2026 target of 25 million visitors |
QR payments, apps and central kitchens change operations
- QR code payments let stalls, cafes and restaurants accept bank transfers without card terminals, which speeds checkout at busy hours.
- Delivery and pickup apps connect kitchens with diners across districts, which helps small outlets reach customers beyond walking distance.
- Central kitchens prepare sauces, broths and baked goods for many outlets, which keeps taste consistent and lowers labor needs at each store.
- Loyalty and ordering apps run by coffee and restaurant chains collect order data, which helps them plan menus, staffing and promotions.
Need a Custom Version of This Report?
Tailor the scope, geography, or segments to your exact requirements.
- Custom geography or segment scope
- Direct access to our analyst team
Vietnamese chain groups compete with global brands
Competition is split between thousands of independent stalls and restaurants and a group of Vietnamese and foreign chain operators. Golden Gate ran nearly 500 restaurants across more than 40 brands, including Kichi-Kichi, Gogi House, Manwah and The Coffee House, by the end of 2024. Highlands Coffee ended 2025 with 985 stores, and Jollibee Foods holds a 60% stake in its parent company. Phuc Long operated 202 stores in 34 provinces and cities at the end of 2025. Pizza 4P's, founded in Ho Chi Minh City, runs more than 30 locations across Asia. KFC Vietnam, Lotteria, Jollibee, Trung Nguyen Legend and Redsun-ITI also compete in fast food, coffee and casual dining. Rivals compete on price, location, menu innovation, delivery reach and loyalty programs, while street vendors win on price and convenience.
Companies profiled and their roles in this market
| Company | Type | Role in the market |
|---|---|---|
| Golden Gate Restaurant Group | Multi-brand restaurant group | Ran nearly 500 restaurants across more than 40 brands in 42 provinces |
| Highlands Coffee | Coffee chain | Ended 2025 with 985 stores after opening 134 during the year |
| Phuc Long Heritage | Tea and coffee chain | Operated 202 stores in 34 provinces and cities at the end of 2025 |
| Pizza 4P's | Casual dining chain | Runs more than 30 locations across Asia and plans a U.S. debut |
| The Coffee House | Coffee chain | Operates as a Golden Gate brand in Vietnamese cities |
Credence Research view on chains and tourism
Credence Research's view is that Vietnamese eating-out spending will grow quickly because tourism, urban living and chain expansion keep meals outside the home central to daily life. Coffee chains, hotpot groups and fast-food brands are adding outlets and franchises, while street vendors use QR payments and delivery apps to reach more diners. However, labor, rent and ingredient costs will keep margins tight. Operators that combine affordable menus, local dishes and strong delivery and loyalty programs should gain share fastest through 2035.
How the Vietnamese eating-out estimate was built
The report uses 2025 as the base year on a calendar basis, and market values come from the Credence Research model. That model combines tourism, retail and growth data from government releases, urbanization data from the World Bank, tax policy records and company disclosures on store counts and expansion. Segment and regional splits are Credence Research estimates based on population, tourism and income by zone. Sources used are government releases, company announcements, industry news and statistical databases, and no interviews or surveys were used.
Tourism and chain growth carry meal spending to 2035
Meal and drink spending is expected to reach USD 66.16 billion by 2035, a 10.30% CAGR during 2026–2035, as tourism, urban living and chain expansion keep demand rising. Growth should stay strong through 2028 while chains open stores in provincial cities and visitor numbers climb. After that, delivery, franchising and central Vietnam tourism will carry more growth as outlet density matures in Hanoi and Ho Chi Minh City. Weaker tourism would lower this outlook, while faster income growth would raise it. Quick-service restaurants are expected to grow at 10.97% a year, the fastest service rate in Vietnamese eating-out demand.
Frequently Asked Questions
How big is the Vietnam catering food service market?
Which service type leads eating-out spending in Vietnam?
Which region leads the Vietnam catering food service market?
Which delivery model is growing fastest?
What drives eating-out demand in Vietnam?
How important are tourists to Vietnamese restaurants?
Who are the leading companies in Vietnamese eating out?
What are the main challenges for restaurant operators?
Table of Content
Chapter 1 Market Segmentation
- 1.1 Segmentation Framework
- 1.1.1 Product and Service Classification
- 1.1.2 Application and End-Use Classification
- 1.1.3 Technology and Solution Classification
- 1.1.4 Customer and Distribution Channel Classification
- 1.1.5 Geographic Segmentation
- 1.1.6 Market Segment Definitions and Boundaries
- 1.2 By Service Type
- 1.2.1 Full-Service Restaurants
- 1.2.2 Quick-Service Restaurants
- 1.2.3 Cafes and Bars
- 1.2.4 Contract Catering
- 1.3 By Customer Type
- 1.3.1 Individual Consumers
- 1.3.2 Corporate Clients
- 1.3.3 Public Institutions
- 1.3.4 Hospitality Operators
- 1.4 By Delivery Model
- 1.4.1 Dine-In
- 1.4.2 Takeaway
- 1.4.3 Third-Party Delivery
- 1.4.4 Cloud Kitchens
- 1.5 By Business Model
- 1.5.1 Independent Outlets
- 1.5.2 Chained Outlets
- 1.5.3 Franchise Operations
- 1.5.4 Managed Catering Contracts
Chapter 2 Introduction
- 2.1 Report Objectives and Scope
- 2.2 Product Definition and Industry Terminology
- 2.3 Market Inclusions and Exclusions
- 2.4 Research Process
- 2.4.1 Primary Research and Expert Interviews
- 2.4.2 Secondary Research and Source Review
- 2.4.3 Top-Down and Bottom-Up Estimation
- 2.4.4 Data Triangulation and Verification
- 2.5 Market Size Measurement Basis
- 2.5.1 2025: USD 24.76 billion → 2035: USD 66.16 billion
- 2.6 Historical and Forecast Reference Periods
- 2.6.1 Historical Period: 2018-2025
- 2.6.2 Base Year: 2025
- 2.6.3 Forecast Period: 2025-2035
- 2.7 Research Assumptions and Limitations
Chapter 3 Executive Summary
- 3.1 Market Snapshot and Key Findings
- 3.2 Base-Year Market Size, 2025
- 3.3 Forecast Market Size, 2035
- 3.4 Revenue and Volume Growth Outlook
- 3.5 Key Demand and Supply Indicators
- 3.6 Leading Market Segments
- 3.7 Fastest-Growing Market Opportunities
- 3.8 Regional Performance Highlights
- 3.9 Technology and Industry Transformation
- 3.10 Competitive Landscape Summary
- 3.11 Analyst View and Strategic Implications
Chapter 4 Vietnam Catering Food Service Market Trends and Developments
- 4.1 Historical Industry Development, 2018-2025
- 4.2 Recent Market Trends and Developments
- 4.3 Demand and Customer Behavior Trends
- 4.4 Technology and Product Innovation
- 4.5 Artificial Intelligence, Automation and Digitalization
- 4.6 Local Manufacturing and Supply Chain Realignment
- 4.7 Industry Partnerships, Mergers and Acquisitions
- 4.8 Sustainability and Circular Economy Developments
- 4.9 Government and Private Sector Investment Trends
- 4.10 Emerging Business Models and Commercialization
- 4.11 Industry Developments and Announcements
Chapter 5 Vietnam Catering Food Service Market Supply and Demand Analysis
- 5.1 Demand Trend and Consumption Analysis, 2018-2025
- 5.2 Demand Forecast, 2025-2035
- 5.3 Supply Chain Structure and Procurement Trends
- 5.4 Supply-Demand Gap and Bottlenecks
- 5.5 Import Dependence and Sourcing Structure
- 5.6 Regional Supply and Demand Concentration
Chapter 6 Vietnam Catering Food Service Market Pricing Analysis
- 6.1 Pricing Structure and Measurement
- 6.2 Historical Pricing Trends, 2018-2025
- 6.3 Pricing Outlook, 2025-2035
- 6.4 Pricing by Product and Market Segment
- 6.5 Geographic Pricing Differences
- 6.6 Key Input, Energy, Labor and Logistics Costs
- 6.7 Contract Pricing and Purchasing Models
- 6.8 Pricing Sensitivity and Competitive Positioning
- 6.9 Price, Margin and Profitability Implications
Chapter 7 Vietnam Catering Food Service Market Dynamics
- 7.1 Market Growth Drivers
- 7.1.1 Demand-Side Drivers
- 7.1.2 Technology and Innovation Drivers
- 7.1.3 Infrastructure and Investment Drivers
- 7.1.4 Regulatory and Policy Drivers
- 7.2 Market Restraints
- 7.2.1 Cost and Affordability Constraints
- 7.2.2 Technology and Adoption Barriers
- 7.2.3 Supply Chain and Operational Constraints
- 7.3 Market Challenges
- 7.3.1 Competitive Pressure and Margin Erosion
- 7.3.2 Skills, Infrastructure and Implementation Gaps
- 7.4 Emerging Market Opportunities
- 7.5 Market Dynamics Impact and Time-Horizon Assessment
Chapter 8 Vietnam Catering Food Service Value Chain Analysis
- 8.1 Industry Value Chain Overview
- 8.2 Upstream Suppliers and Critical Inputs
- 8.3 Technology and Component Providers
- 8.4 Manufacturing or Service Delivery
- 8.5 Distribution, Channel Partners and Integrators
- 8.6 Downstream Applications and End Users
- 8.7 Value Addition and Profit Pools
- 8.8 Vertical Integration and Outsourcing
- 8.9 Supplier Concentration and Risk
- 8.10 Supply Chain Localization and Resilience
Chapter 9 Vietnam Catering Food Service Market Regulations and Policies
- 9.1 Relevant Laws, Standards and Compliance Frameworks
- 9.2 Product, Service, Safety and Quality Requirements
- 9.3 Government Policies, Incentives and Subsidies
- 9.4 Imports, Exports and Trade Barriers
- 9.5 Public Procurement and Local Content Requirements
- 9.6 Data Protection, AI and Cybersecurity Compliance
- 9.7 Upcoming Policy Changes and Market Implications
Chapter 10 Vietnam Catering Food Service Market Hotspots and Opportunities
- 10.1 Market Opportunity Mapping and Growth Hotspots
- 10.2 High-Growth Applications and Customer Groups
- 10.3 Underserved Markets and White-Space Opportunities
- 10.4 Emerging Technology and Product Opportunities
- 10.5 New Capacity and Investment Hotspots
- 10.6 Market Entry and Expansion Opportunities
- 10.7 Distribution and Partnership Opportunities
- 10.8 Near-Term and Long-Term Commercial Potential
- 10.9 Opportunity Attractiveness and Execution Risks
Chapter 11 Vietnam Catering Food Service Market Outlook, 2025-2035
- 11.1 Market Size and Analysis
- 11.1.1 Revenue (Market Measurement: 2025: USD 24.76 billion → 2035: USD 66.16 billion)
- 11.1.2 Historical Market Size, 2018-2025
- 11.1.3 Base-Year Market Size, 2025
- 11.2 Market Forecast, 2025-2035
- 11.2.1 Revenue Forecast to 2035
- 11.2.2 CAGR and Year-on-Year Growth
- 11.2.3 Incremental Revenue Opportunity
- 11.3 Forecast Assumptions and Scenario Analysis
- 11.3.1 Base-Case Forecast
- 11.3.2 Optimistic and Conservative Scenarios
- 11.3.3 Technology, Pricing and Policy Sensitivities
- 11.4 Market Attractiveness and Growth Outlook
Chapter 12 Vietnam Catering Food Service Market Segmentation and Outlook
- 12.1 Segmentation Summary and Market Shares, 2025
- 12.2 Largest and Fastest-Growing Segments
- 12.3 By Service Type - Market Size and Forecast, 2025-2035
- 12.3.1 Segment Definition and Scope
- 12.3.2 Historical Market Size, 2018-2025
- 12.3.3 Revenue Forecast, 2025-2035
- 12.3.4 Base-Year Market Share, 2025
- 12.3.5 Segment CAGR and Growth Drivers
- 12.3.6 Subsegment Market Size and Forecast
- 12.3.6.1 Full-Service Restaurants
- 12.3.6.2 Quick-Service Restaurants
- 12.3.6.3 Cafes and Bars
- 12.3.6.4 Contract Catering
- 12.3.7 Subsegment Pricing and Adoption Trends
- 12.3.8 Leading Suppliers and Competition
- 12.3.9 Regional Demand and Opportunities
- 12.4 By Customer Type - Market Size and Forecast, 2025-2035
- 12.4.1 Segment Definition and Scope
- 12.4.2 Historical Market Size, 2018-2025
- 12.4.3 Revenue Forecast, 2025-2035
- 12.4.4 Base-Year Market Share, 2025
- 12.4.5 Segment CAGR and Growth Drivers
- 12.4.6 Subsegment Market Size and Forecast
- 12.4.6.1 Individual Consumers
- 12.4.6.2 Corporate Clients
- 12.4.6.3 Public Institutions
- 12.4.6.4 Hospitality Operators
- 12.4.7 Subsegment Pricing and Adoption Trends
- 12.4.8 Leading Suppliers and Competition
- 12.4.9 Regional Demand and Opportunities
- 12.5 By Delivery Model - Market Size and Forecast, 2025-2035
- 12.5.1 Segment Definition and Scope
- 12.5.2 Historical Market Size, 2018-2025
- 12.5.3 Revenue Forecast, 2025-2035
- 12.5.4 Base-Year Market Share, 2025
- 12.5.5 Segment CAGR and Growth Drivers
- 12.5.6 Subsegment Market Size and Forecast
- 12.5.6.1 Dine-In
- 12.5.6.2 Takeaway
- 12.5.6.3 Third-Party Delivery
- 12.5.6.4 Cloud Kitchens
- 12.5.7 Subsegment Pricing and Adoption Trends
- 12.5.8 Leading Suppliers and Competition
- 12.5.9 Regional Demand and Opportunities
- 12.6 By Business Model - Market Size and Forecast, 2025-2035
- 12.6.1 Segment Definition and Scope
- 12.6.2 Historical Market Size, 2018-2025
- 12.6.3 Revenue Forecast, 2025-2035
- 12.6.4 Base-Year Market Share, 2025
- 12.6.5 Segment CAGR and Growth Drivers
- 12.6.6 Subsegment Market Size and Forecast
- 12.6.6.1 Independent Outlets
- 12.6.6.2 Chained Outlets
- 12.6.6.3 Franchise Operations
- 12.6.6.4 Managed Catering Contracts
- 12.6.7 Subsegment Pricing and Adoption Trends
- 12.6.8 Leading Suppliers and Competition
- 12.6.9 Regional Demand and Opportunities
- 12.7 Segment Growth Comparison
- 12.8 Segment Attractiveness and Priority Matrix
Chapter 13 Vietnam Catering Food Service End-Use and Application Market Outlook
- 13.1 End-Use Industry and Customer Demand Structure
- 13.2 Leading Applications and Customer Groups
- 13.3 End-Use Market Size, Share and Forecast
- 13.4 Major End-Use Industry Deep Dives
- 13.4.1 Customer Requirements and Use Cases
- 13.4.2 Demand and Replacement Cycles
- 13.4.3 Technical and Regulatory Considerations
- 13.4.4 Purchasing and Procurement Models
- 13.4.5 Leading Vendors and Distribution Channels
- 13.4.6 Forecast and Commercial Opportunities
- 13.5 Emerging Applications and Cross-Segment Demand
- 13.6 End-Use Industry Investment Priorities
Chapter 14 Vietnam Catering Food Service Geographic Market Outlook, 2025-2035
- 14.1 Regional Market Size and Country-Level Shares, 2025
- 14.2 Country Market Size Comparison, 2025
- 14.3 Country Market Forecasts, 2025-2035
- 14.4 Subregional Industrial and Demand Clusters
- 14.5 Intra-Regional Pricing and Cost Differences
- 14.6 Cross-Border Trade and Supply Networks
- 14.7 Regional Supply and Demand Balances
- 14.8 Country Opportunity Comparison and Prioritization
Note: Every listed country is covered on the structure shown under the first country.
Chapter 15 Vietnam Catering Food Service Technology, Innovation and Sustainability Outlook
- 15.1 Technology Landscape and Maturity
- 15.2 Product, Process and Service Innovation
- 15.3 AI, Automation and Digital Tools in the Industry
- 15.4 Technology Adoption and Performance Benchmarking
- 15.5 Innovation Pipeline and R&D Investment
- 15.6 Energy Efficiency and Resource Management
- 15.7 Sustainability, Recycling and Circularity
- 15.8 Technology Roadmap, 2025-2035
- 15.9 Risks of Obsolescence and Technology Substitution
Chapter 16 Vietnam Catering Food Service Market Key Strategic Imperatives
- 16.1 Growth and Market Entry Priorities
- 16.2 High-Return Products and Segments
- 16.3 Pricing, Profitability and Cost Optimization
- 16.4 Technology Investment and Product Differentiation
- 16.5 Supply Chain Localization and Resilience
- 16.6 Distribution and Customer Acquisition
- 16.7 Partnership, Acquisition and Capacity Strategy
- 16.8 Regional Expansion Priorities
- 16.9 Short-, Medium- and Long-Term Actions
Chapter 17 Competition Outlook
- 17.1 Industry Competition Characteristics
- 17.2 Market Structure and Concentration
- 17.3 Market Share and Competitive Positioning, 2025
- 17.4 Company-Wise Revenue and Product Benchmarking
- 17.5 Production and Service Capacity Benchmarking
- 17.6 Technology, Pricing and Differentiation
- 17.7 Regional Footprint and Distribution Strength
- 17.8 Mergers, Acquisitions and Strategic Alliances
- 17.9 New Entrants and Competitive Threats
- 17.10 Porter's Five Forces and Industry Attractiveness
- 17.11 Competitive Outlook, 2025-2035
Chapter 18 Company Profiles
- 18.1 Company Coverage and Selection Criteria
- 18.2 Golden Gate Restaurant Group
- 18.2.1 Business Description
- 18.2.2 Company Ownership and Geographic Presence
- 18.2.3 Product and Service Portfolio
- 18.2.4 Manufacturing and Operating Footprint
- 18.2.5 Financial Performance and Investment
- 18.2.6 Market Share and Competitive Position
- 18.2.7 Technology and Innovation Capabilities
- 18.2.8 Strategic Alliances or Partnerships
- 18.2.9 Recent Developments
- 18.2.10 Growth Strategy and Outlook
- 18.3 Highlands Coffee
- 18.4 KFC Vietnam
- 18.5 Lotteria Vietnam
- 18.6 Jollibee Vietnam
- 18.7 Pizza 4P's
- 18.8 Phuc Long Heritage
- 18.9 Trung Nguyen Legend
- 18.10 The Coffee House
- 18.11 Redsun-ITI
- 18.12 Other Relevant Market Participants
Note: Every listed company is profiled on the structure shown under the first company. The company list is preliminary and may change based on research findings, market developments, data availability and client requirements.
Chapter 19 Disclaimer
- 19.1 Research and Forecast Disclaimer
- 19.2 Data Source and Estimation Limitations
Note: The depth of individual sections depends on data availability for this market. Volume, capacity, trade and other unit-based metrics are included where applicable.

