
School milk and imports shape Indonesian dairy demand
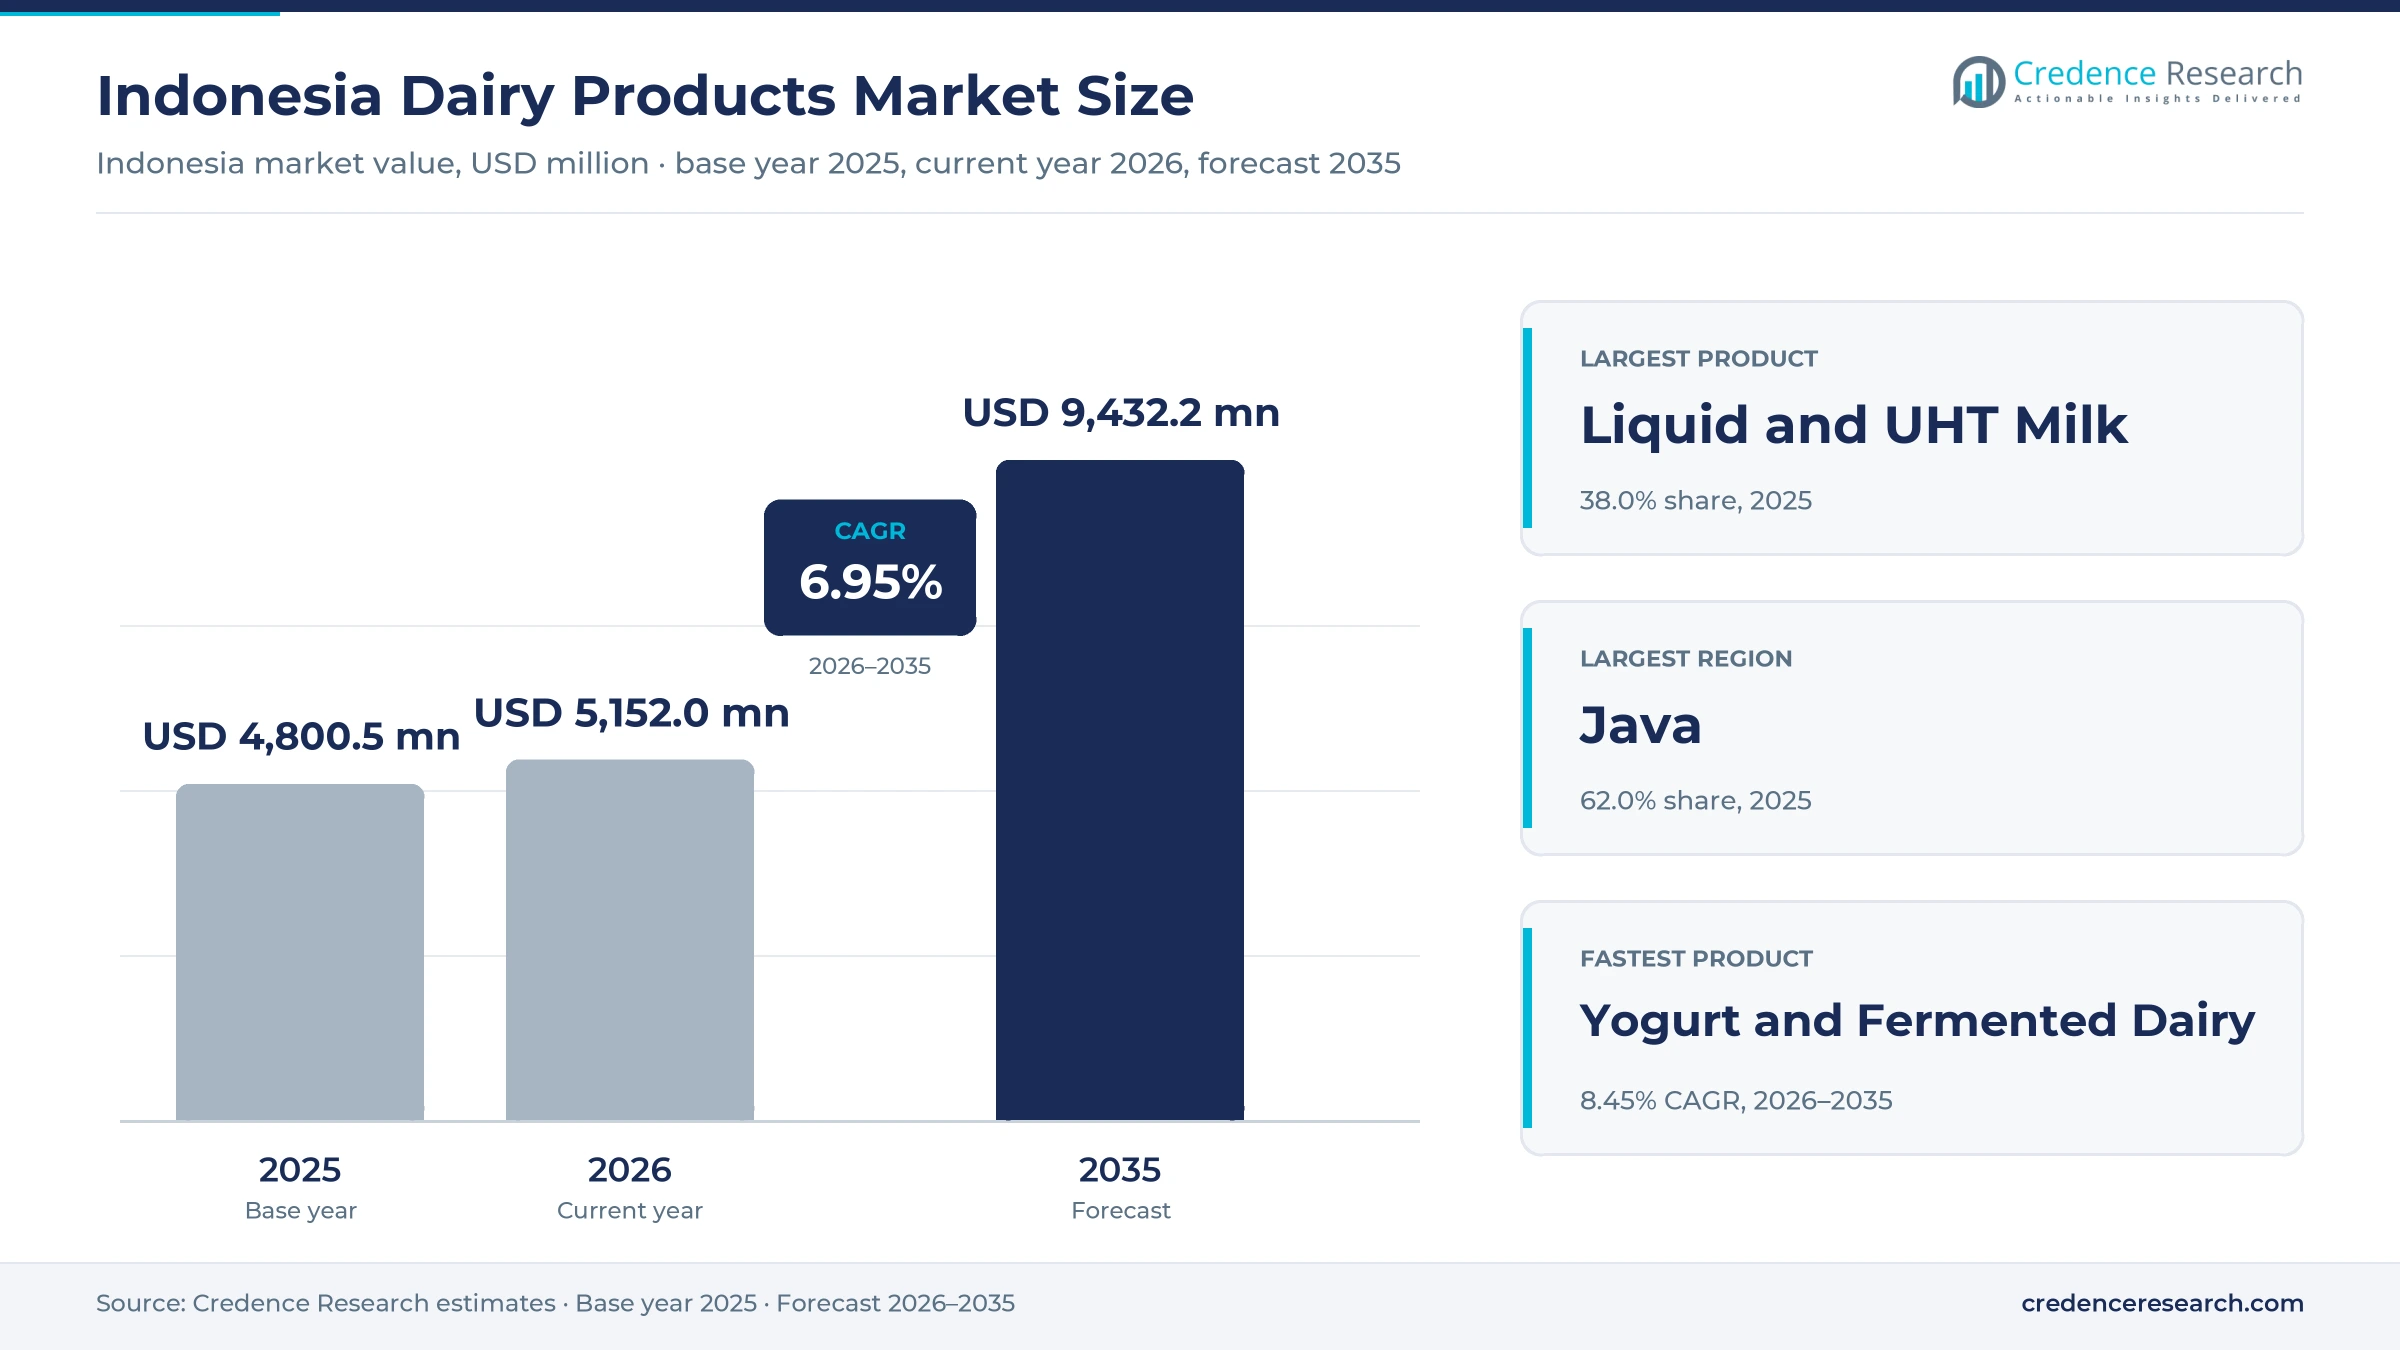
The Indonesia dairy products market was valued at USD 4.80 billion in 2025 and is projected to increase from USD 5.15 billion in 2026 to USD 9.43 billion by 2035, registering a CAGR of 6.95% during 2026–2035. Demand comes from household milk and formula purchases, minimarket shelves and a new public buyer, the Free Nutritious Meals program, which was using packaged milk by 2025. Java held the largest regional share, 62.0% in 2025, because most people, plants and dairy herds sit on the island, while Sulawesi is the fastest-growing region at 7.84% a year. Domestic farms cover only about one fifth of national milk needs, so processors rely on imported powder and reconstitute it locally. A commercial change is also under way, as large processors added lines in West Java for school-sized UHT packs. Meanwhile, a tariff deal with the United States and front-of-pack sugar grades are changing input costs and shelf positioning for sweetened drinks.
What does the Indonesia dairy products market count, and who buys?
The market counts packaged liquid and UHT milk, milk powder and formula, sweetened condensed milk, yogurt and fermented dairy, cheese, butter and ice cream sold in Indonesia. Households buy most volume through minimarkets and neighborhood shops, while bakeries, cafes and public meal kitchens purchase through distributors and direct contracts.
The estimate excludes plant-based drinks, raw milk sold farm to farm and dairy ingredients exported from Indonesia. The value chain runs from smallholder cooperatives, modern farms and importers of skim milk powder through processors in Java to distributors, retailers and nutrition program kitchens across the archipelago.
Indonesia Dairy Products Market Insights
- The market rises from USD 4.80 billion in 2025 to USD 9.43 billion by 2035, a 6.95% CAGR, as public nutrition buying adds volume to steady household purchases.
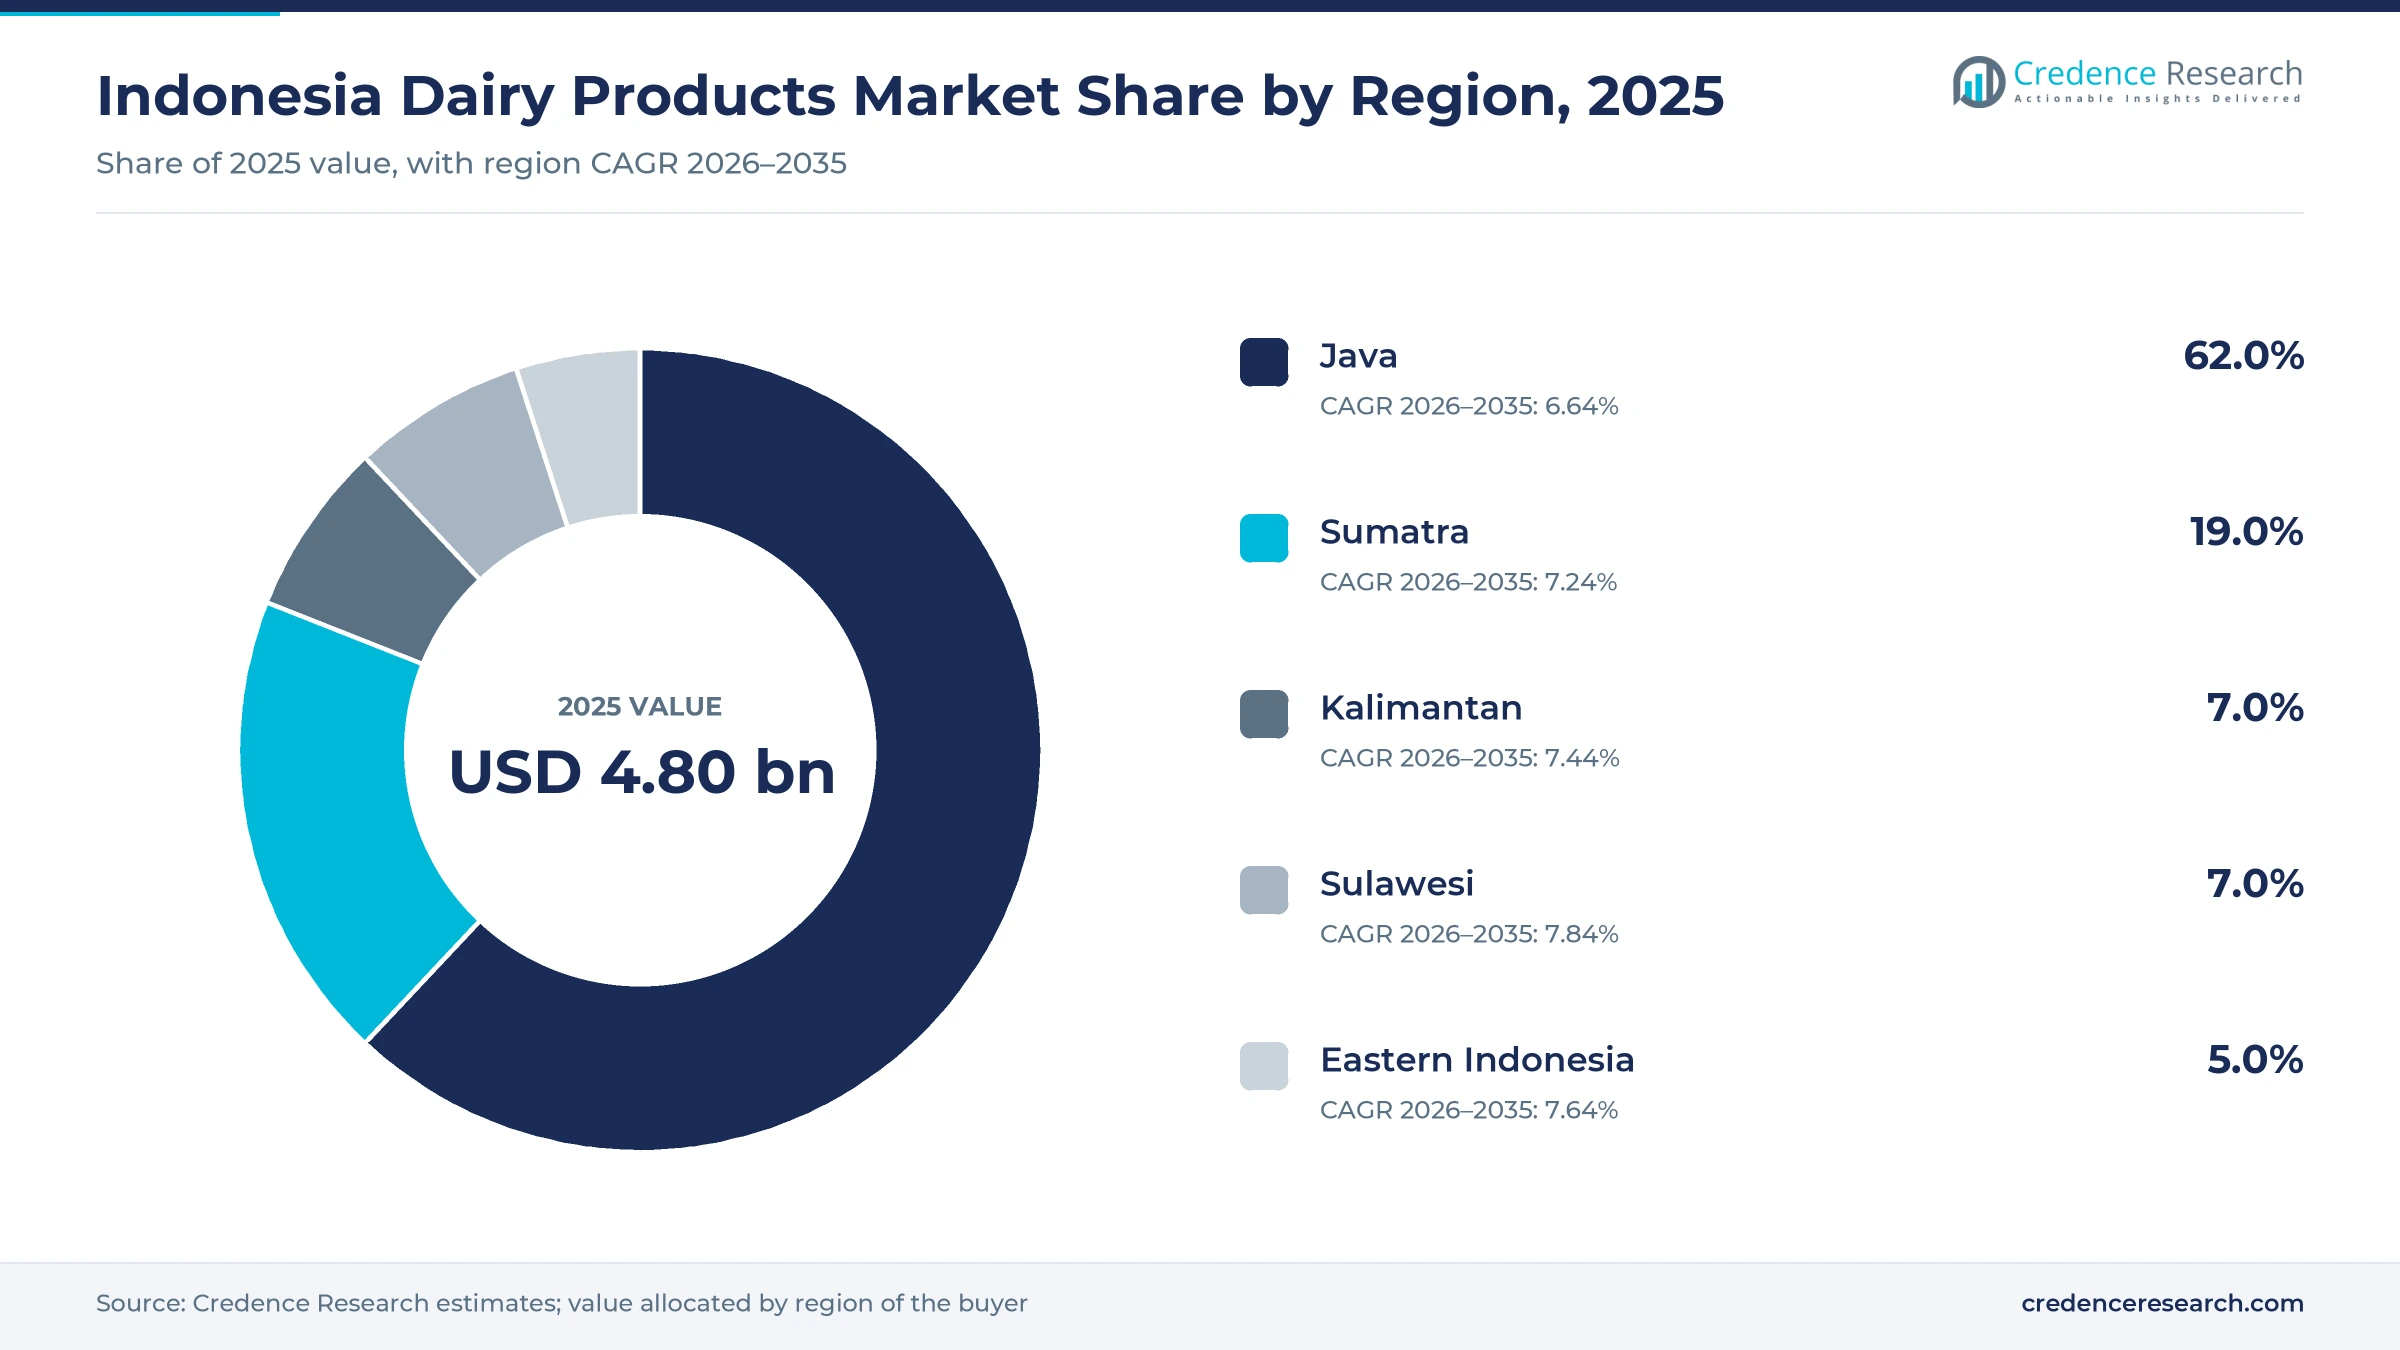
- Java held 62.0% of 2025 value because its plants, herds and dense urban shoppers concentrate supply and demand on one island.
- Liquid and UHT Milk led product sales with 38.0% in 2025 because shelf-stable packs reach shops and schools without refrigerated trucks.
- The Industry Ministry said in June 2026 that school-size processing covers only 49.7% of the program requirement, which opens room for new filling lines.
- Frisian Flag, Ultrajaya, Cimory and Greenfields compete through plant investment, herd expansion and direct distribution rather than through price alone in the premium tier.
UHT milk leads while yogurt and school supply grow fastest
Why does UHT milk lead while yogurt grows fastest?
Based on product type, the market is categorized into liquid and UHT milk, milk powder and formula, sweetened condensed milk, yogurt and fermented dairy, cheese and butter, and ice cream. Liquid and UHT Milk led with 38.0% of 2025 value because USDA tied its projected 2025 demand rise to drinking milk under the Free Nutritious Meals Program, and Frisian Flag's Cikarang plant processes 400,000 kilograms a day into fluid milk and sweetened condensed milk, according to Tempo. Yogurt and Fermented Dairy grows fastest at 8.45% a year as Cimory built a direct route of more than 5,000 agents, mainly on Java, according to an October 2024 profile by the Rhino Insight investor newsletter.
Why do minimarkets lead as public supply accelerates?
Based on distribution channel, the market is categorized into modern retail, traditional retail, institutional supply and e-commerce and direct delivery. Modern Retail led with 46.0% of 2025 value because Databoks counted 24,351 Indomaret and 21,442 Alfamart stores at the end of June 2026, which gives brands a national shelf with one buying decision. Institutional Supply grows fastest at 9.21% a year as the Industry Ministry put the 2026 meal program requirement at 4.8 billion small milk packs, a volume purchased outside conventional shop counters and largely through processors and cooperatives.
How do mass packs and premium chilled dairy divide spending?
Based on price tier, the market is categorized into mass, mid-range and premium products. Mass led with 64.0% of 2025 value because Deputy Industry Minister Faisol Riza said on Dec. 5, 2024, that low purchasing power keeps milk from being a regular household necessity, and Kontan reported that Campina planned lower-priced ice cream for price-sensitive shoppers. Premium grows fastest at 8.31% a year as Cimory sells yogurt and fresh milk under a premium dairy line, while Diamond Food markets Biokul yogurt, according to its profile on Stock Analysis.
| Segment Group | Leading Sub-segment | Share, 2025 | Fastest-growing Sub-segment | CAGR, 2026–2035 |
|---|---|---|---|---|
| By Product Type | Liquid and UHT Milk | 38.0% | Yogurt and Fermented Dairy | 8.45% |
| By Distribution Channel | Modern Retail | 46.0% | Institutional Supply | 9.21% |
| By Price Tier | Mass | 64.0% | Premium | 8.31% |
Request a Free Sample
Fill in your details and we'll send you a free sample report.
- Sample data tables & charts
- Research methodology
State meals, minimarkets and new plants lift dairy sales
Institutional nutrition and household penetration
Public milk purchasing has become the clearest new source of volume because the Free Nutritious Meals program puts dairy onto a state-funded tray. USDA's Foreign Agricultural Service projected that demand would climb from 4.2 million metric tons in 2024 to 5.3 million metric tons in 2025, and it cited a goal of serving milk to more than 82 million beneficiaries daily by 2029. Antara reported 61.96 million recipients and 27,952 kitchens as of April 30, 2026, which shows how far the buying network has already spread. As a result, Institutional Supply is the fastest channel at 9.21% a year, and children who receive milk at school may carry the habit into household baskets over time.
Modern retail and cold-chain expansion
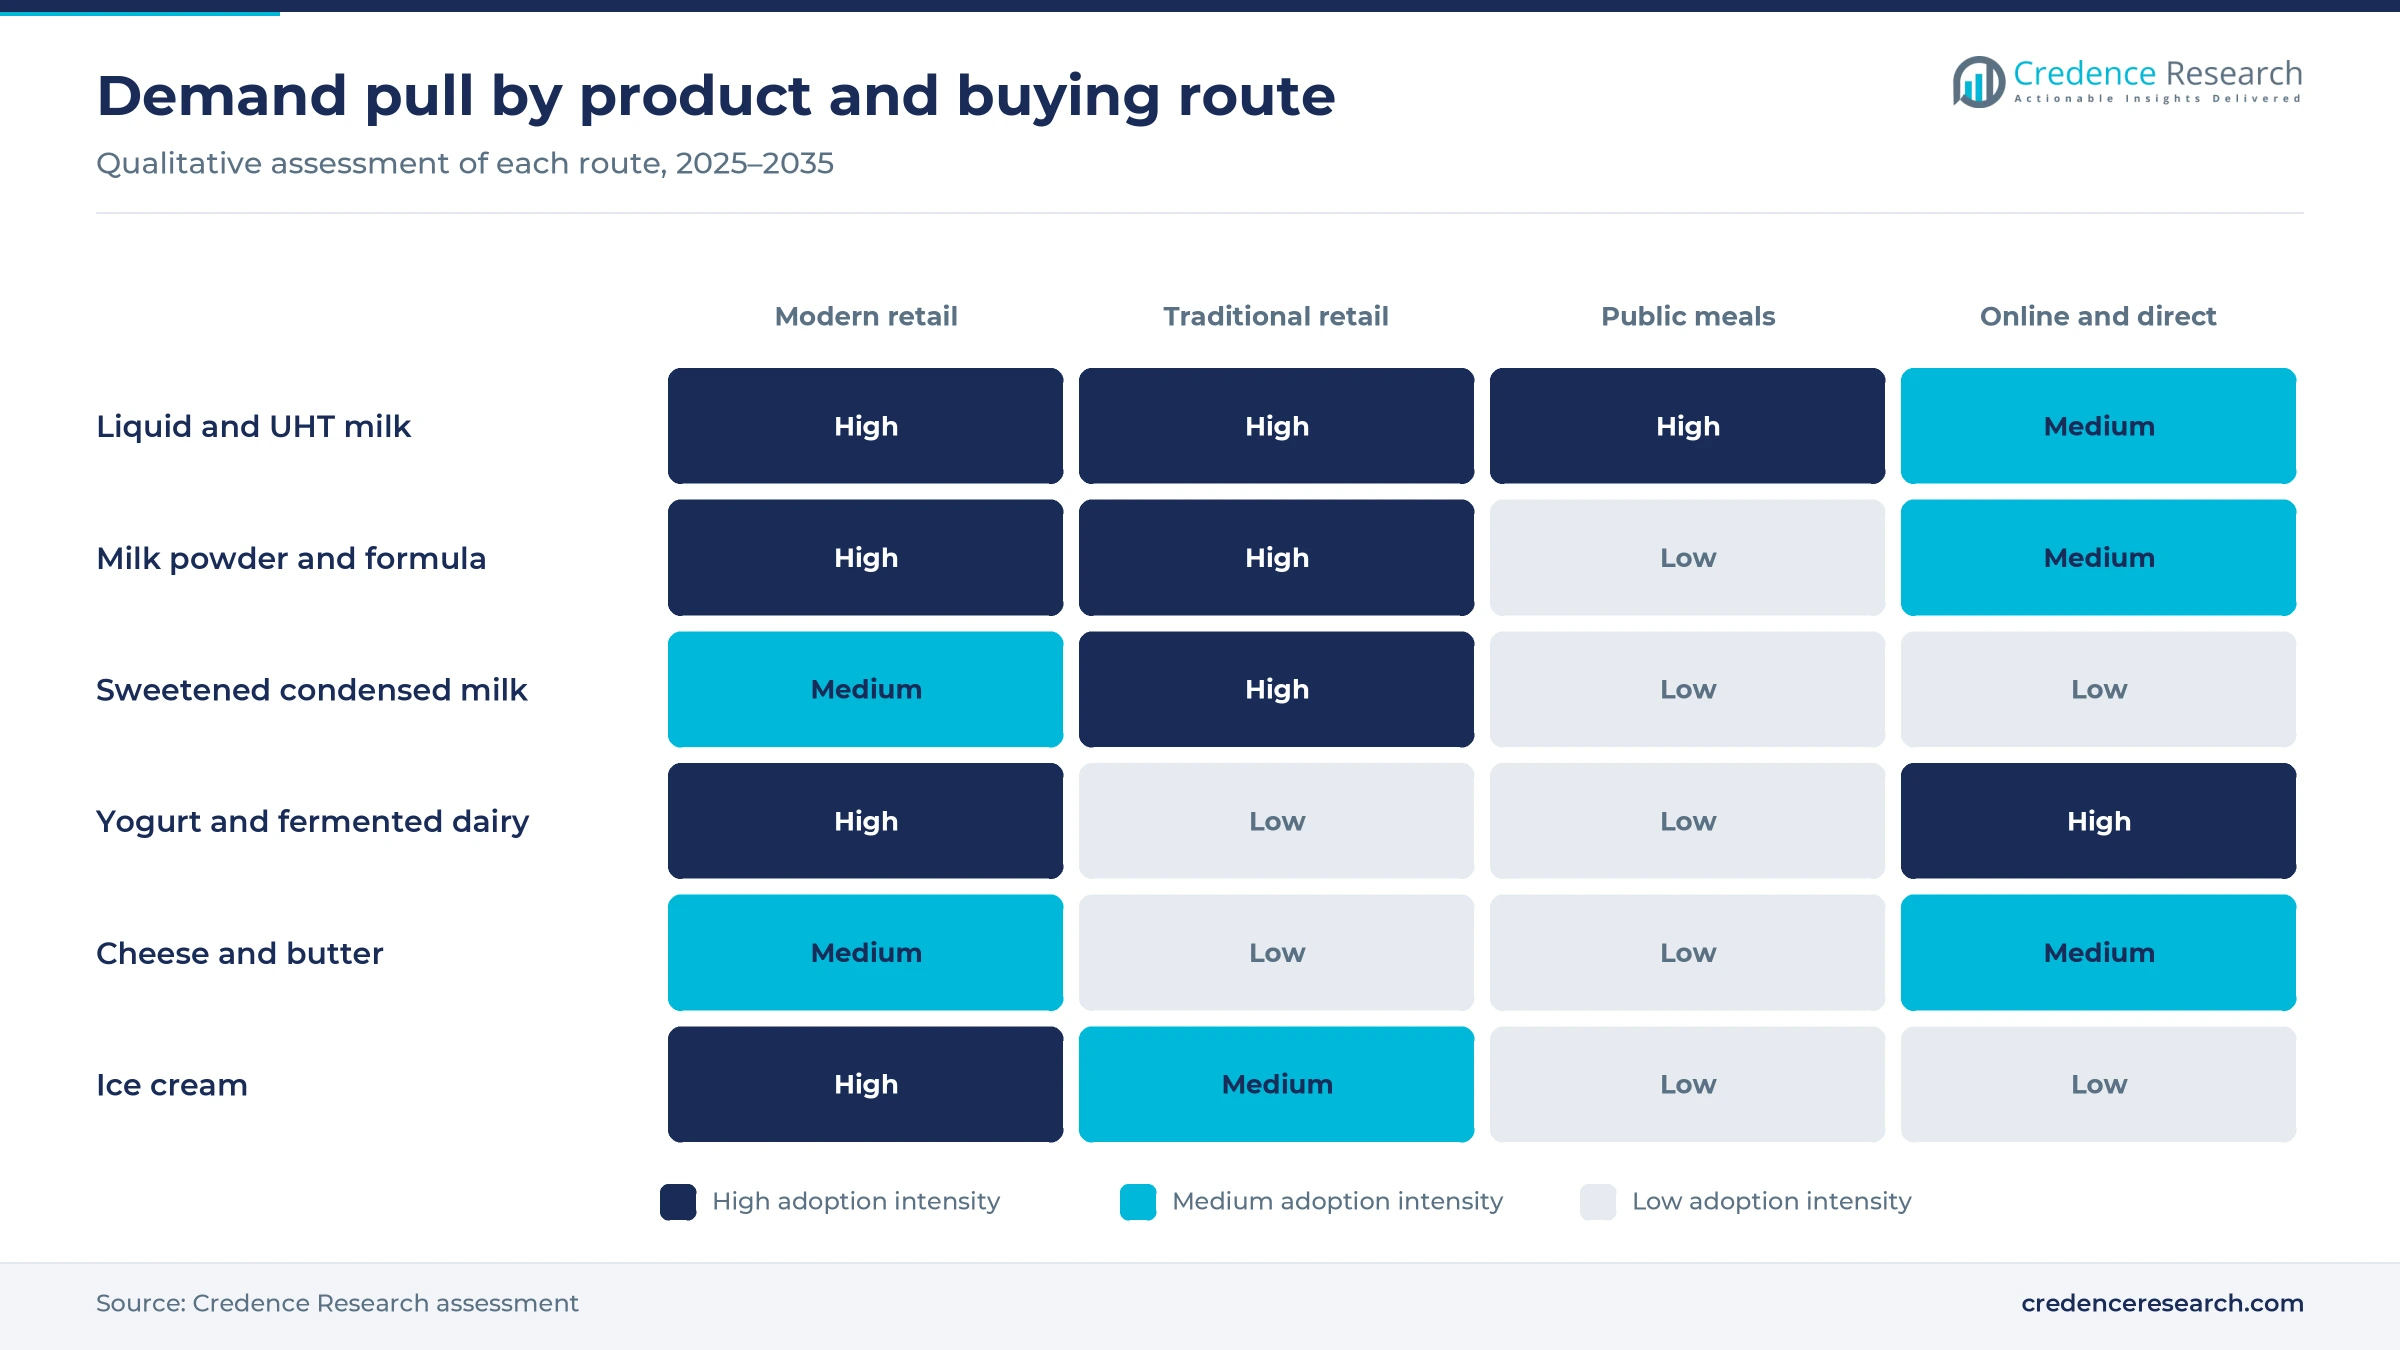
Chain minimarkets are widening the reach of branded dairy because they place the same branded range in neighborhoods that once relied on small shops alone. Databoks reported that Indomaret added 485 stores and Alfamart added 322 stores in the first half of 2026, taking the chains to more than 45,000 outlets between them. Hasanuddin Yasni, chairman of the Indonesian Cold Chain Association, projected that refrigerated transport would grow about 14% and cold storage about 8% in 2025, according to Supply Chain Indonesia. This refrigerated capacity matters for yogurt, cheese and fresh milk, which cannot move through ambient warehouses. In turn, Modern Retail held 46.0% of 2025 value, and chilled lines follow that network wherever power and storage allow.
Premiumization and product innovation
Better-off urban shoppers are paying more for fresher and more functional dairy, and producers are building dedicated routes to reach them. Cimory places yogurt, fresh and UHT milk in a premium dairy line and supplies more than 120,000 general trade outlets, while its agents deliver weekly to more than 500,000 households, according to the Rhino Insight investor newsletter in October 2024. The company also formed a West Java subsidiary, PT Artha Rasa Cimory, in January 2026 as part of its expansion plans, according to Fortune IDN. Sarihusada now sells an SGM Eksplor formula for children who cannot tolerate cow's milk, Fortune IDN reported in August 2026. These moves help Premium grow fastest at 8.31% a year, although mass packs keep the larger share of spending.
Low per capita intake and new processing plants
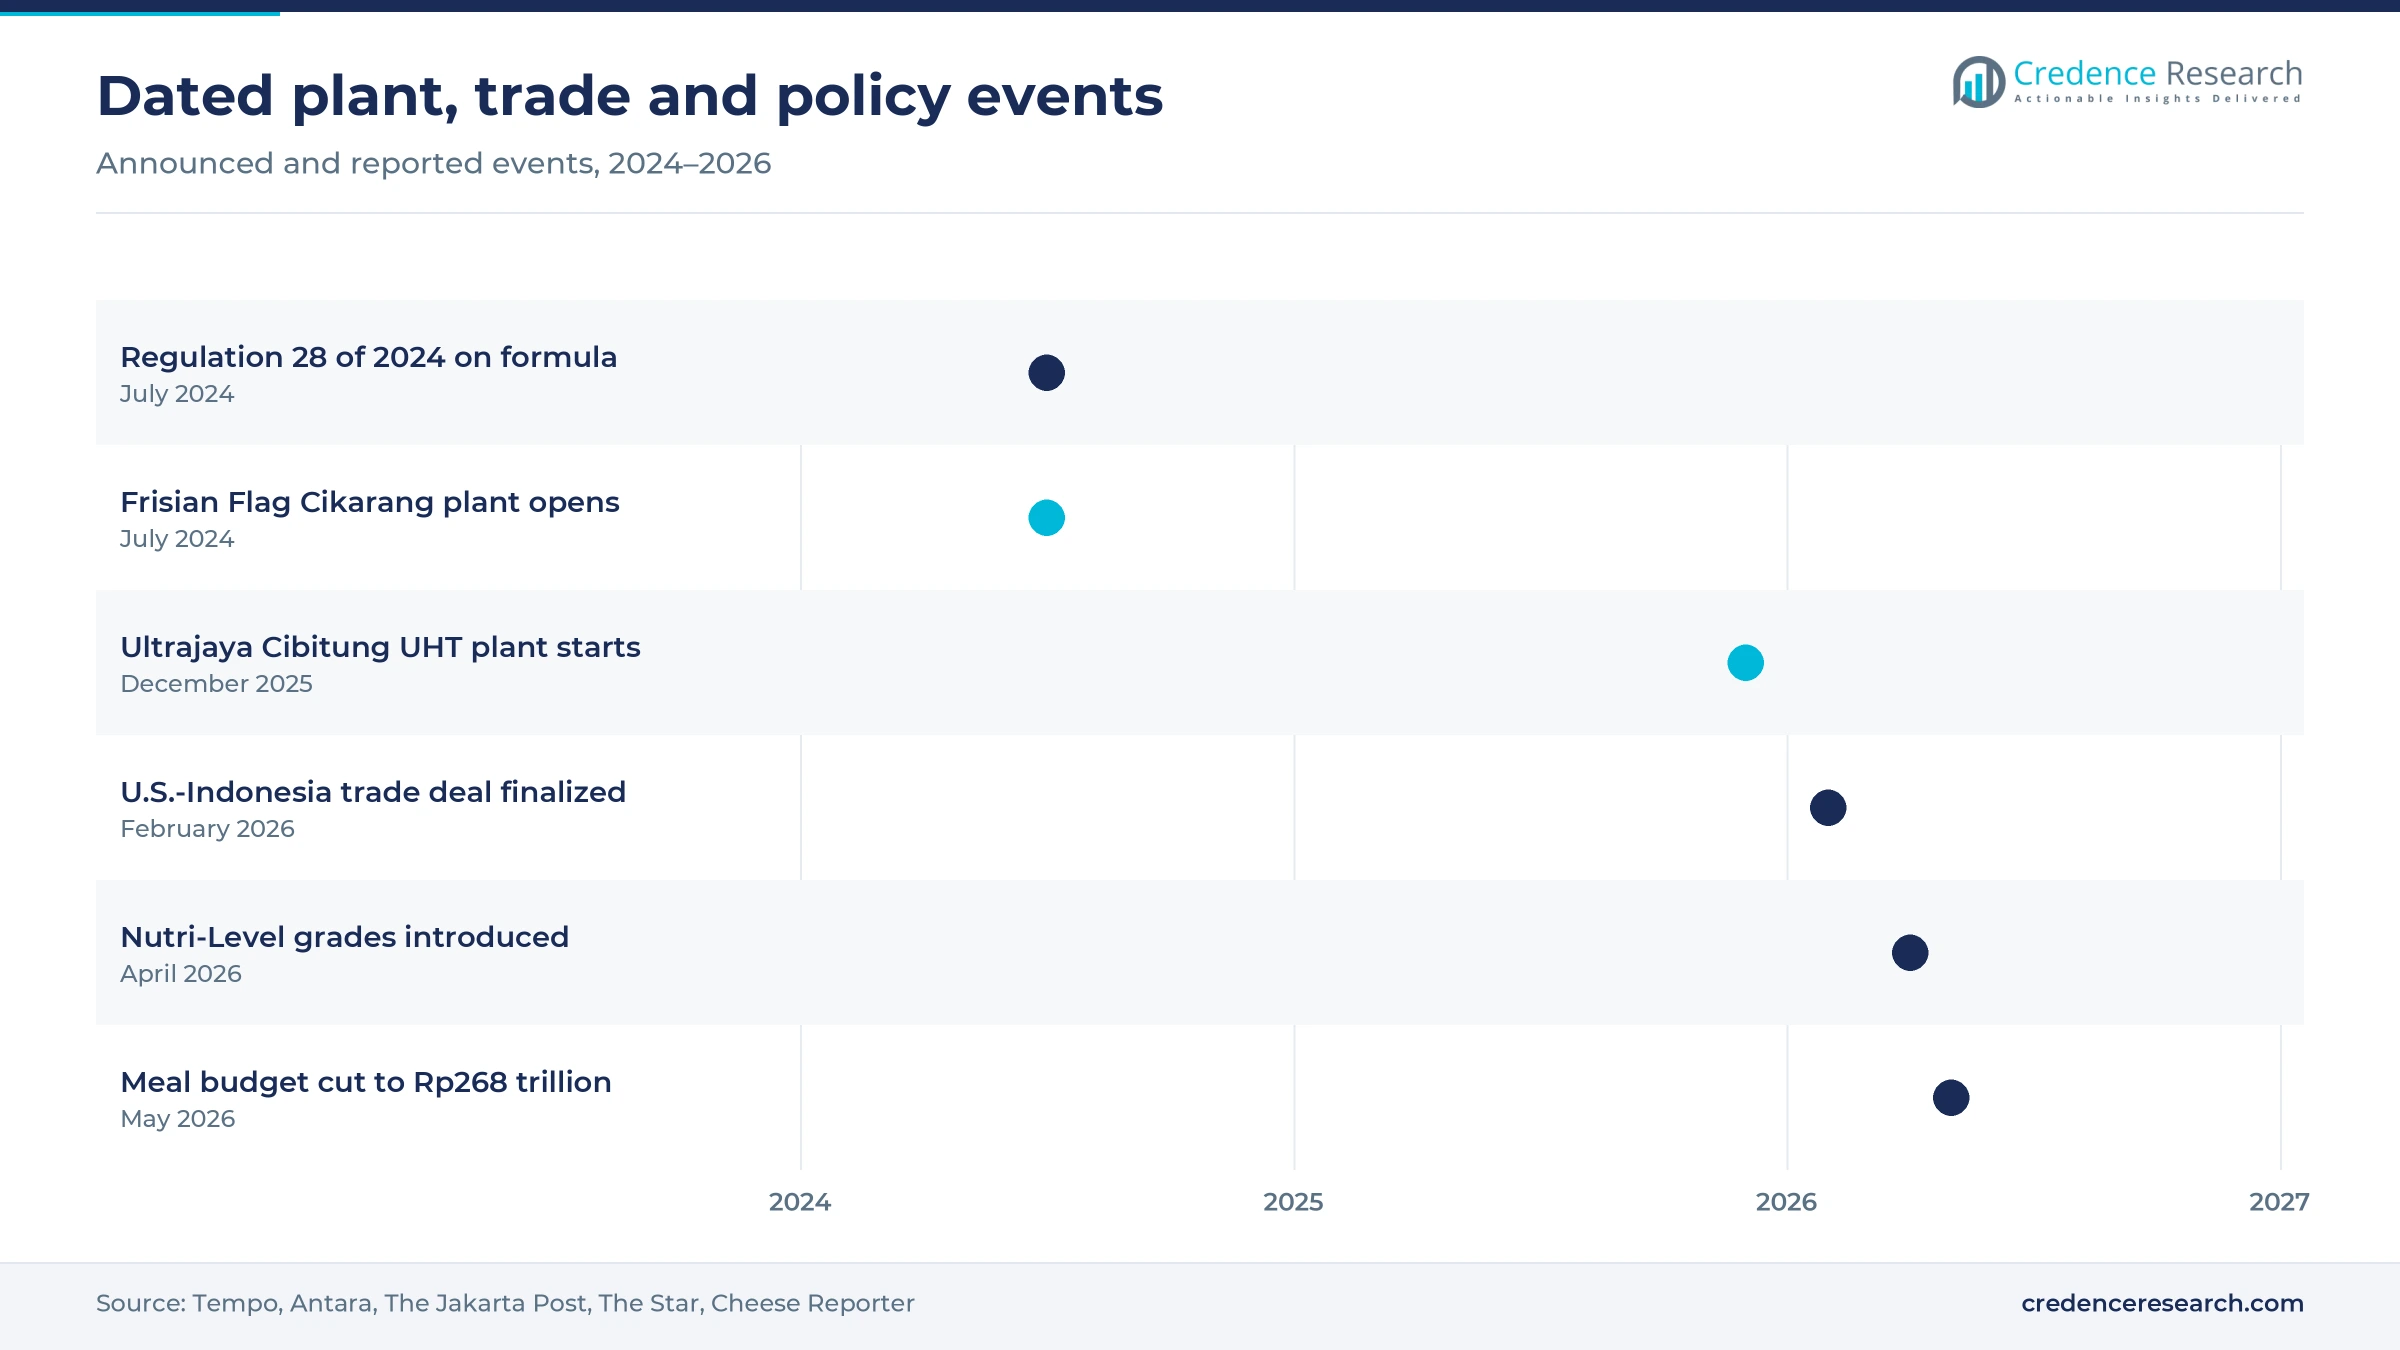
Indonesia still drinks far less milk than its neighbors, which leaves room for volume growth as incomes and nutrition policy move together. Deputy Industry Minister Faisol Riza put consumption at 16.1 liters per person a year in December 2024, against 20.1 liters in Vietnam and 50.9 liters in Malaysia. Processors are investing ahead of that gap, and Tempo reported in July 2024 that Frisian Flag opened a Rp3.8 trillion plant in Cikarang able to make 700 million kilograms of dairy products a year. Public health targets add policy support for demand, since Fortune IDN cited national stunting prevalence of 19.8% in 2024 against a 14.2% goal by 2029. Consequently, fortified milk fits closely with the stunting goal that officials have set.
Small packs and one-hour delivery reshape dairy buying
School-size UHT packs rise as public buying scales
Filling lines are shifting toward very small packs because meal kitchens need single portions that survive without refrigeration. The Industry Ministry said on June 2, 2026 that the program needs 4.8 billion packs of 115 ml and 125 ml this year, while national capacity in those sizes stands at 2.39 billion packs, or 49.7% of the requirement. The Jakarta Post reported that Ultrajaya began running a Rp1.14 trillion Bekasi facility on Dec. 8, 2025, for 125 ml and 200 ml packs. Meanwhile, Deputy Head Nanik Deyang of the National Nutrition Agency said in September 2025 that packaged milk was allowed only temporarily, as most kitchens lack access to dairy farms. Demand for aseptic milk cartons is therefore rising with this shift.
One-hour delivery emerges as a route for chilled dairy
Fast delivery is emerging as a practical route for chilled dairy because stores already hold the stock near the buyer. Nikkei Asia reported through KrASIA in April 2026 that about 3,500 Alfamart outlets serve as hubs promising delivery within an hour of an Alfagift order. The chain also ran 50 dark stores in 2025 and aims to double that number, and its app had 25 million members in February 2026. Dark stores can hold more premium items than a typical shop can stock. Specialist retail is moving the same way, as Fortune IDN reported that the Raja Susu nutrition network has more than 174 branches working with Sarihusada. Together, these routes support e-commerce and direct delivery, which still expand from a smaller base than store sales.
Opportunity for cooperatives in packaged milk processing
Cooperatives have a clear opening in processing because the state now pays part of the cost of closing the capacity gap. Antara reported in June 2026 that nine cooperatives and 96 milk collection centers have joined the program, and that an app is being developed so they can report supply in real time. The ministry also offers investment reimbursements of up to 35% for products meeting domestic content rules and up to 25% for other locally made products. Director Merrijantij Punguan Pintaria said more capacity is needed beyond the three company expansions already made. For this reason, a cooperative that adds a compact UHT line can sell to nearby kitchens at lower freight cost, keeping more of the margin within farming regions.
Opportunity in herd upgrades and modern farm supply
Local milk is the scarcest input, which creates an opening for investors in cattle, feed and farm equipment. USDA's GAIN reporting, published by The Dairy Site in December 2023, showed modern farms holding at least 25 liters per cow a day, compared with 9 to 10 liters at cooperative farms. KB Valbury reported in July 2025 that Japfa and Greenfields placed more than 1,000 pregnant cows with 120 smallholders in East Java, supporting a national herd target of 998,565 by 2029. Ultrajaya also plans to add 4,000 cows to the roughly 7,000 on its two farms, Antara reported in January 2026. Suppliers of milking equipment, cooling tanks and veterinary services can therefore sell into a yield gap that public policy now aims to close.
Raw milk gaps and new rules test dairy suppliers
Heavy reliance on imported milk solids
Import dependence leaves processors exposed to world prices and currency moves. Deputy Coordinating Minister Hanif Faisol Nurofiq said in June 2026 that about 80% of milk needs are imported, with production near 1 million metric tons against demand near 4 million metric tons, Bernama reported. Skim milk powder import values swung from $860 million in 2022 to $567 million in 2024, according to USDA data cited by Databoks. As a result, small brands face unstable input costs, and the swing explains why ministers want more local milk.
Disease losses in smallholder herds
Foot-and-mouth disease exposed how fragile smallholder supply remains, since outbreaks that began in April 2022 cut national output by about 48% from earlier levels, according to USDA GAIN reporting published by The Dairy Site. The outbreak killed 11,581 cows belonging to cooperative association members, and many survivors were culled. This matters because about 99% of dairy cattle are on Java, which concentrates the risk in one island. Farmers therefore need vaccination, insurance and quarantine support before imported heifers can rebuild output.
Budget and safety pressure on the meal program
Public demand is large but not guaranteed, because Antara reported in May 2026 that the 2026 meal budget was cut by Rp67 trillion to Rp268 trillion. The Health Ministry had also recorded more than 37,600 linked food poisoning cases by mid-May, according to The Star. Ultrajaya told investors on Dec. 19, 2025, that it did not expect a material near-term boost from the program. Consequently, processors that build for school volumes carry utilization risk and should keep retail outlets for the same lines.
Tighter rules on formula and sweetened drinks
Regulation is narrowing how sweetened and infant products can be sold. Government Regulation 28 of 2024, issued July 26, 2024, banned formula advertising and promotion through influencers and health workers, according to the law firm AHP. The Indonesian Pediatric Society objected in May 2026 to formula in public meals, The Star reported. The food and drug agency launched A to D Nutri-Level grades for beverages in April 2026, with a one to two year grace period. Makers of sweet milk drinks may need to reformulate if grades reach them.
Java anchors dairy demand as outer islands gain share
| Region | Value, 2025 (USD billion) | Share, 2025 | CAGR, 2026–2035 |
|---|---|---|---|
| Java | 2.98 | 62.0% | 6.64% |
| Sumatra | 0.91 | 19.0% | 7.24% |
| Kalimantan | 0.34 | 7.0% | 7.44% |
| Sulawesi | 0.34 | 7.0% | 7.84% |
| Eastern Indonesia | 0.24 | 5.0% | 7.64% |
Java holds the plants, herds and largest shopper base
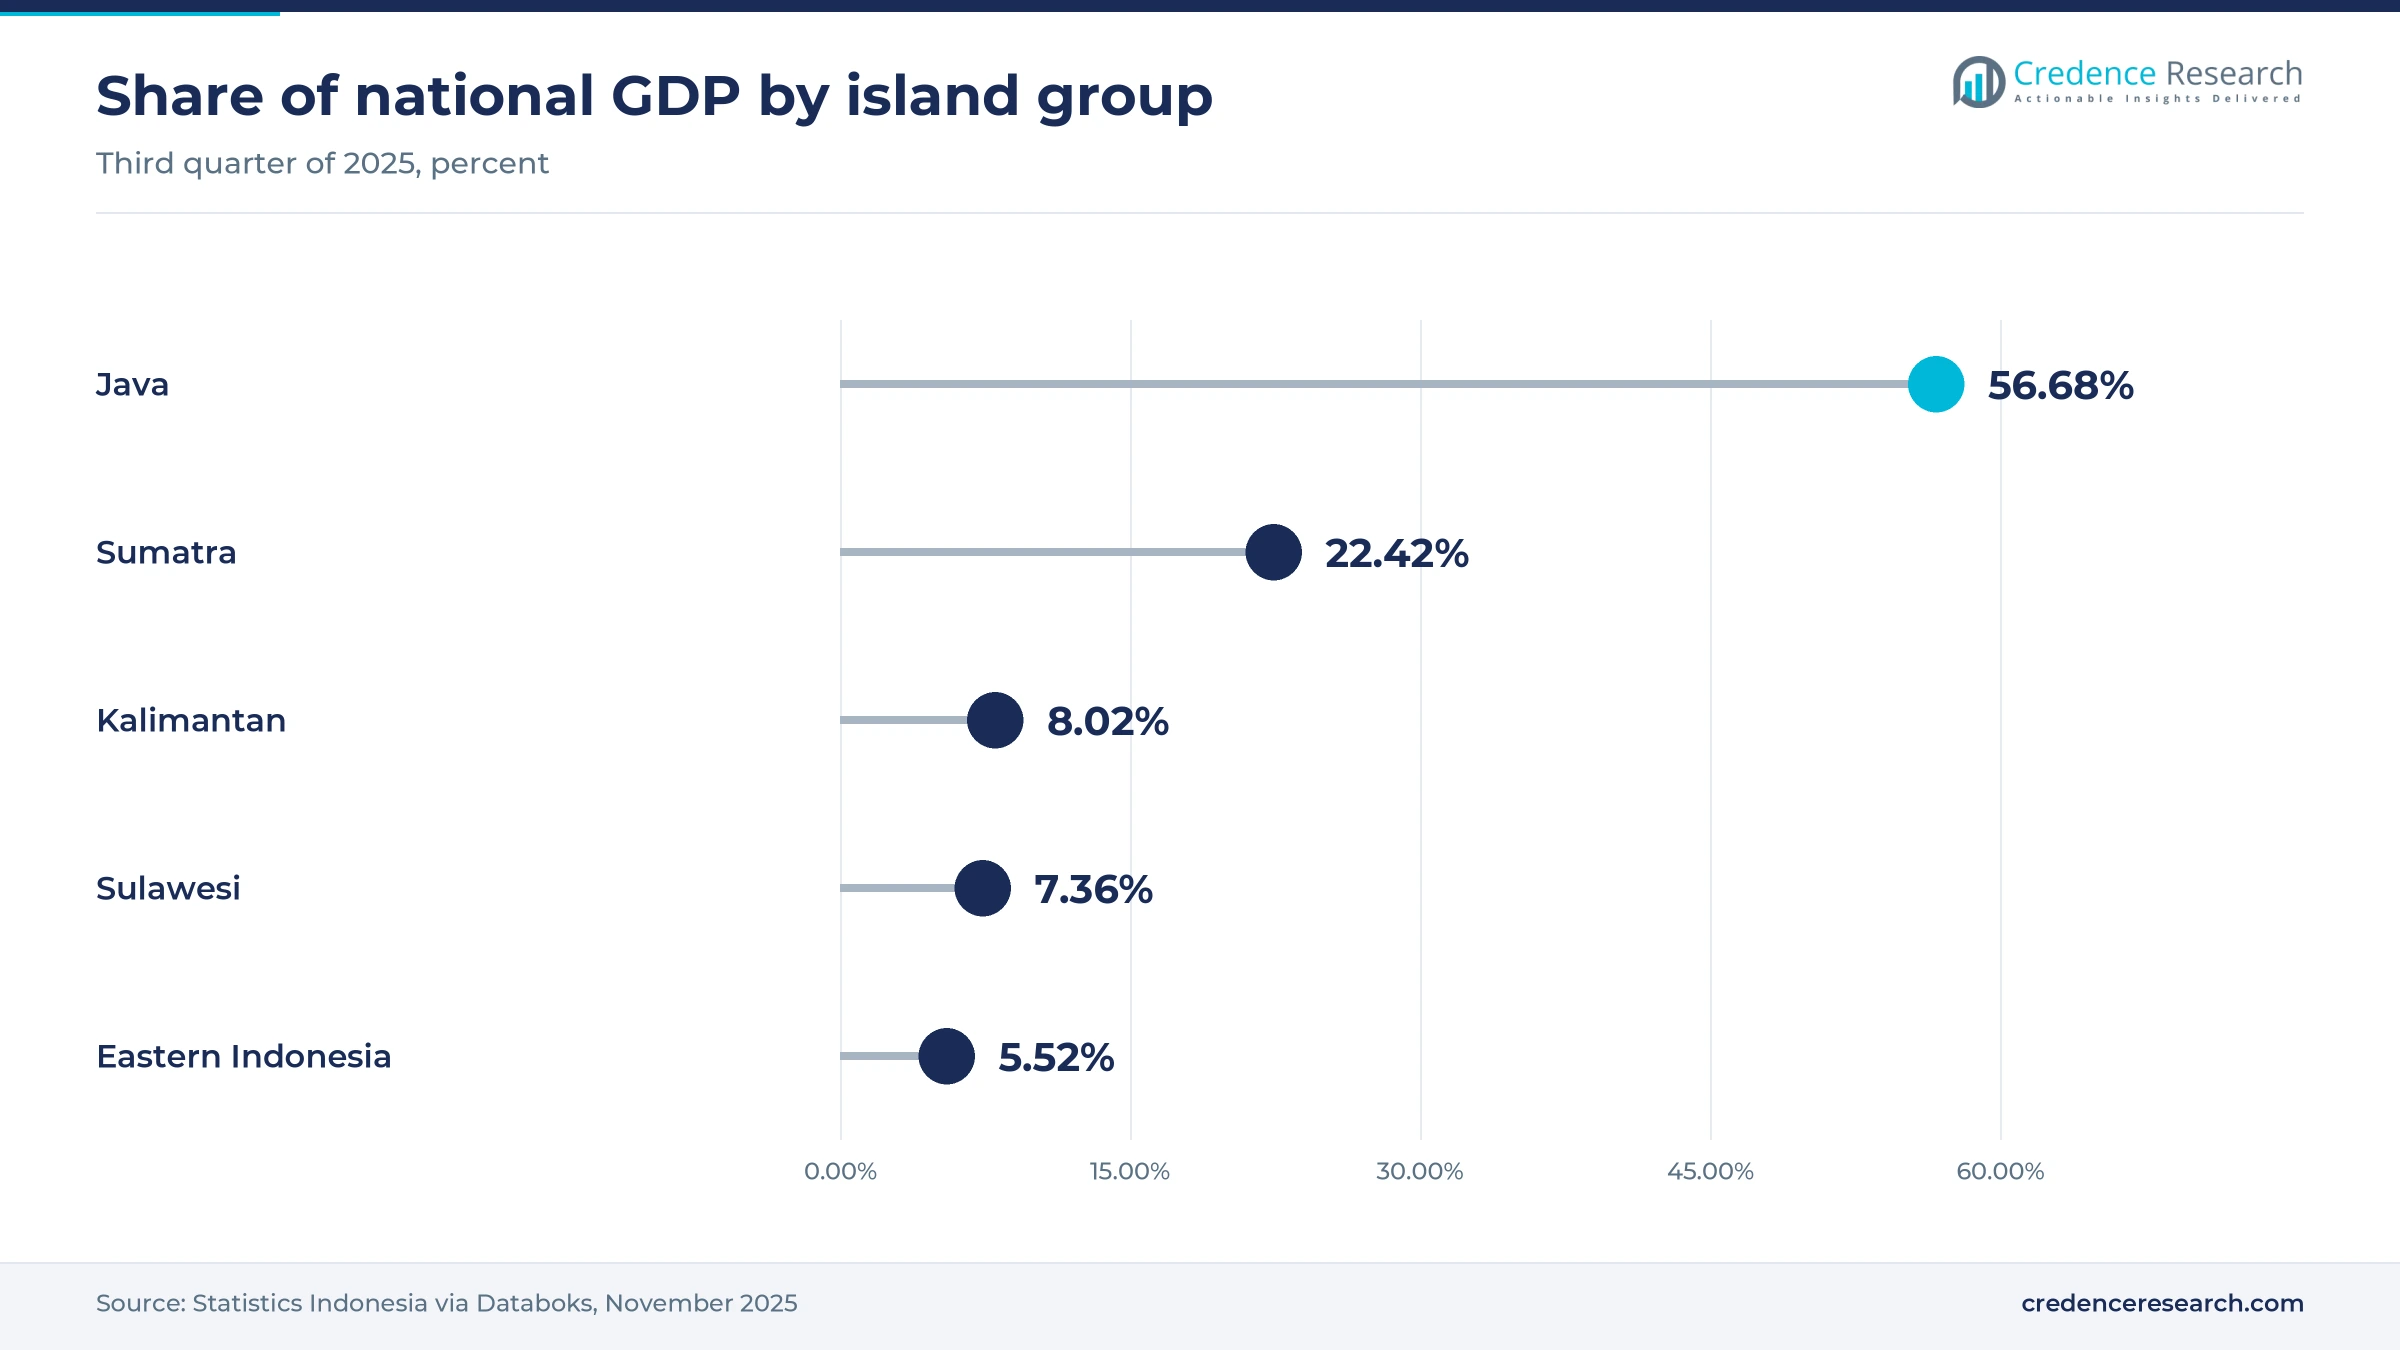
Java held 62.0% of 2025 value and grows at 6.64% a year, and it generated 56.68% of national GDP in the third quarter of 2025, according to Statistics Indonesia via Databoks. Statistics Indonesia data show East Java produced 456,340 tons of fresh milk in 2023, West Java 268,460 tons and Central Java 89,540 tons. Large plants in Cikarang, Cibitung and Pasuruan also serve its dense urban shoppers, which keeps freight costs low and product ranges wide across the island.
Sumatra is the largest market outside Java
Sumatra held 19.0% of 2025 value and grows at 7.24% a year, supported by the second-largest share of national GDP in the third quarter of 2025, according to Statistics Indonesia. North Sumatra produced 9,230 tons of fresh milk in 2023, according to Statistics Indonesia, the largest output outside Java, and Ultrajaya runs one of its two dairy farms there. Consequently, shoppers across the island rely mainly on UHT and powder shipped from Java, and minimarket chains carry much of that branded range.
Kalimantan buys shipped milk as energy limits cold storage
Kalimantan held 7.0% of 2025 value and grows at 7.44% a year, helped by an economy that ranks third among the island groups in national GDP, according to Statistics Indonesia. South Kalimantan produced only 105 tons of fresh milk in 2023, so nearly all supply arrives from other islands. The U.S. International Trade Administration said in June 2024 that areas outside Java, Bali and Sumatra face energy availability challenges for cold storage, which keeps chilled dairy thin and favors shelf-stable formats here.
Sulawesi grows fastest on manufacturing-led income gains
Sulawesi held 7.0% of 2025 value and grows at 7.84% a year, the fastest rate of any zone, because its economy expanded 5.84% in the third quarter of 2025, above the 5.04% national pace reported by Statistics Indonesia. The agency linked that growth to manufacturing, which brings steady wage income to towns that previously bought little packaged dairy. South Sulawesi produced 1,960 tons of fresh milk in 2023, so local output serves only a small niche, while shipped UHT supplies most buyers.
Eastern Indonesia relies on long supply routes
Eastern Indonesia, which covers Bali, Nusa Tenggara, Maluku and Papua, held 5.0% of 2025 value and grows at 7.64% a year. These islands generated 5.52% of national GDP in the third quarter of 2025, and Maluku and Papua grew just 2.68% in that period. Eighteen provinces reported no fresh milk output in 2023, according to Statistics Indonesia, which leaves many of these markets dependent on shipped products. Bali is better served, since the Rhino Insight newsletter described Cimory as mainly active in Java, Bali and other densely populated areas.
Plants, trade terms and rules moved fast in 2024–2026
| Development | Status and market relevance |
|---|---|
| In July 2024, Frisian Flag Indonesia opened a Rp3.8 trillion plant on a 25.4-hectare site in Cikarang, as reported by Tempo. | Operating, with room to reach 1 billion kilograms a year |
| In December 2025, Ultrajaya began operating a three-line UHT factory in the MM2100 estate at Cibitung for meal program packs. | Operating, with more lines scheduled from March 2026 |
| In February 2026, the United States and Indonesia finalized a trade deal under which dairy groups said Indonesia will remove tariffs on U.S. dairy. | Finalized, and U.S. exports were $221.6 million in 2025 |
| In April 2026, the food and drug agency introduced Nutri-Level A to D grades, starting with beverages. | Grace period of one to two years, more categories to follow |
| In May 2026, the National Nutrition Agency added milk products, including follow-on and growth formula, to the meal program. | Contested by pediatric and public health groups |
Aseptic lines and supply tracking set dairy capacity
- Aseptic UHT filling lets processors sell milk in 125 ml and 200 ml packs without refrigeration, which suits school kitchens and long island routes.
- Powder blending and packing turns imported solids into consumer packs, as at the Cikarang site that packs Anlene, Anmum and Anchor Boneeto.
- Chilled production and delivery protects yogurt and fresh milk, which need refrigerated storage from plant to shelf, and the U.S. International Trade Administration said cold storage growth has been led by greater Jakarta.
- Milk supply tracking apps give the Industry Ministry real-time cooperative data on milk collection, and the system is still under development according to Antara.
Need a Custom Version of This Report?
Tailor the scope, geography, or segments to your exact requirements.
- Custom geography or segment scope
- Direct access to our analyst team
Dairy brands compete on plants, herds and shelf reach
Competition rests on three assets, namely processing capacity, access to raw milk and shelf reach across the islands. Frisian Flag and Ultrajaya have made the largest recent plant moves in Bekasi regency, and both can shift volume between retail and public supply. Indolakto processes milk and yogurt at Pasuruan and other plants, and Nestlé runs its Kejayan unit in the same regency. Cimory and Greenfields compete through fresher, higher-priced products and Greenfields also secures milk through a partnership program with more than 2,000 farmers. Sarihusada and Fonterra concentrate on powdered and life-stage nutrition, where Regulation 28 of 2024 limits direct promotion. Campina focuses on modern trade and lower-priced ice cream, while Diamond Food sells cheese, cream, ice cream, milk and yogurt. As a result, new entrants struggle to match the distribution networks of these established groups.
Companies profiled and their roles in this market
| Company | Type | Role in the market |
|---|---|---|
| PT Frisian Flag Indonesia | Processor | Fluid and condensed milk from a Rp3.8 trillion Cikarang plant opened in 2024 |
| PT Ultrajaya Milk Industry & Trading Company Tbk | Processor and farm operator | UHT milk, a Cibitung meal program plant and about 7,000 cows on two farms |
| PT Indolakto | Processor | Milk and yogurt from Pasuruan and other plants |
| PT Nestlé Indonesia | Processor | Runs the Kejayan unit in Pasuruan, East Java, visited by the deputy industry minister in 2024 |
| PT Sarihusada Generasi Mahardhika | Specialized nutrition producer | SGM formula, factories in Yogyakarta and Prambanan, two-year anemia MoU with the nutrition agency |
| PT Cisarua Mountain Dairy Tbk | Premium dairy producer | Yogurt, fresh and UHT milk, with Miss Cimory direct delivery mainly on Java |
| PT Greenfields Indonesia | Farm and fresh milk producer | Partner program with more than 2,000 farmers and cow distribution with Japfa in East Java |
| PT Fonterra Brands Indonesia | Importer and packer | Cikarang packing of Anlene, Anmum and Anchor Boneeto; Fonterra said it finalized the sale of its consumer business outside Greater China to Lactalis in the first quarter of 2026 |
| PT Campina Ice Cream Industry Tbk | Ice cream producer | More than 52 years in ice cream, with a focus on modern trade and lower-priced lines |
| PT Diamond Food Indonesia Tbk | Food and dairy producer | Cheese, cream, ice cream, milk and Biokul yogurt brands |
Processing capacity decides who gains from public milk
Credence Research's view is that the next five years will reward processors that can fill small packs and still sell through shops if public orders slow. The capacity shortfall is real, yet the 2026 budget cut shows that school volumes can move with fiscal choices. Companies should therefore treat the meal program as a valuable second channel rather than as the only reason to build. The stronger long-term position belongs to groups that also secure local milk, since imports will remain exposed to currency and world price swings.
How Credence Research built these dairy estimates
The report uses 2025 as the base year and 2026 to 2035 as the forecast period. Market values come from the Credence Research model, and regional, segment and price-tier splits are Credence Research estimates informed by island GDP, plant and herd locations and company activity. Sources are government statements, Statistics Indonesia data, USDA reporting, company disclosures and named news publishers opened during preparation. No interviews or surveys were conducted for this edition, so shares should be read as modeled estimates.
Local milk supply decides the pace of dairy growth to 2035
The market is projected to reach USD 9.43 billion by 2035, a 6.95% CAGR over 2026–2035, with Java still the largest zone and Sulawesi the fastest. Growth in dairy products should stay steady because public nutrition, minimarket reach and low per capita intake all point the same way. However, the pace depends on whether herd programs narrow the raw milk gap and whether meal budgets hold after the 2026 cut. Processors that add small-pack capacity, chilled reach and local milk contracts should gain share, while purely import-based brands remain more exposed to price swings.
Frequently Asked Questions
How big is the Indonesia dairy products market?
Which product type leads Indonesian dairy sales?
Which product type grows fastest?
Which region leads the market?
Which region grows fastest?
How does the Free Nutritious Meals program affect demand?
Why does Indonesia import so much milk?
Who are the main companies in the market?
Table of Content
Chapter 1 Market Segmentation
- 1.1 Segmentation Framework
- 1.1.1 Product and Service Classification
- 1.1.2 Application and End-Use Classification
- 1.1.3 Technology and Solution Classification
- 1.1.4 Customer and Distribution Channel Classification
- 1.1.5 Geographic Segmentation
- 1.1.6 Market Segment Definitions and Boundaries
- 1.2 By Product Type
- 1.2.1 Liquid and UHT Milk
- 1.2.2 Milk Powder and Formula
- 1.2.3 Sweetened Condensed Milk
- 1.2.4 Yogurt and Fermented Dairy
- 1.2.5 Cheese and Butter
- 1.2.6 Ice Cream
- 1.3 By Price Tier
- 1.3.1 Mass
- 1.3.2 Mid-Range
- 1.3.3 Premium
Chapter 2 Introduction
- 2.1 Report Objectives and Scope
- 2.2 Product Definition and Industry Terminology
- 2.3 Market Inclusions and Exclusions
- 2.4 Research Process
- 2.4.1 Primary Research and Expert Interviews
- 2.4.2 Secondary Research and Source Review
- 2.4.3 Top-Down and Bottom-Up Estimation
- 2.4.4 Data Triangulation and Verification
- 2.5 Market Size Measurement Basis
- 2.5.1 2025: USD 4.80 billion → 2035: USD 9.43 billion
- 2.6 Historical and Forecast Reference Periods
- 2.6.1 Historical Period: 2018-2025
- 2.6.2 Base Year: 2025
- 2.6.3 Forecast Period: 2025-2035
- 2.7 Research Assumptions and Limitations
Chapter 3 Executive Summary
- 3.1 Market Snapshot and Key Findings
- 3.2 Base-Year Market Size, 2025
- 3.3 Forecast Market Size, 2035
- 3.4 Revenue and Volume Growth Outlook
- 3.5 Key Demand and Supply Indicators
- 3.6 Leading Market Segments
- 3.7 Fastest-Growing Market Opportunities
- 3.8 Regional Performance Highlights
- 3.9 Technology and Industry Transformation
- 3.10 Competitive Landscape Summary
- 3.11 Analyst View and Strategic Implications
Chapter 4 Indonesia Dairy Products Market Trends and Developments
- 4.1 Historical Industry Development, 2018-2025
- 4.2 Recent Market Trends and Developments
- 4.3 Demand and Customer Behavior Trends
- 4.4 Technology and Product Innovation
- 4.5 Artificial Intelligence, Automation and Digitalization
- 4.6 Local Manufacturing and Supply Chain Realignment
- 4.7 Industry Partnerships, Mergers and Acquisitions
- 4.8 Sustainability and Circular Economy Developments
- 4.9 Government and Private Sector Investment Trends
- 4.10 Emerging Business Models and Commercialization
- 4.11 Industry Developments and Announcements
Chapter 5 Indonesia Dairy Products Market Production, Supply and Demand Analysis
- 5.1 Demand Trend and Consumption Analysis, 2018-2025
- 5.2 Demand Forecast, 2025-2035
- 5.3 Production and Output Trend, 2018-2025
- 5.4 Production and Output Forecast, 2025-2035
- 5.5 Installed Capacity and Capacity Utilization
- 5.6 Company-Wise Production Plants and Statistics
- 5.6.1 Installed Production Capacity
- 5.6.2 Actual Production
- 5.6.3 Planned Capacity and Expansion Targets
- 5.7 Supply Chain Structure and Procurement Trends
- 5.8 Supply-Demand Gap and Bottlenecks
- 5.9 Import Dependence and Sourcing Structure
- 5.10 Contract Manufacturing and Outsourcing
- 5.11 Regional Supply and Demand Concentration
Chapter 6 Indonesia Dairy Products Market Pricing Analysis
- 6.1 Pricing Structure and Measurement
- 6.2 Historical Pricing Trends, 2018-2025
- 6.3 Pricing Outlook, 2025-2035
- 6.4 Average Selling Price and Unit Economics
- 6.5 Pricing by Product and Market Segment
- 6.6 Geographic Pricing Differences
- 6.7 Key Input, Energy, Labor and Logistics Costs
- 6.8 Contract Pricing and Purchasing Models
- 6.9 Pricing Sensitivity and Competitive Positioning
- 6.10 Price, Margin and Profitability Implications
Chapter 7 Indonesia Dairy Products Market Dynamics
- 7.1 Market Growth Drivers
- 7.1.1 Demand-Side Drivers
- 7.1.2 Technology and Innovation Drivers
- 7.1.3 Infrastructure and Investment Drivers
- 7.1.4 Regulatory and Policy Drivers
- 7.2 Market Restraints
- 7.2.1 Cost and Affordability Constraints
- 7.2.2 Technology and Adoption Barriers
- 7.2.3 Supply Chain and Operational Constraints
- 7.3 Market Challenges
- 7.3.1 Competitive Pressure and Margin Erosion
- 7.3.2 Skills, Infrastructure and Implementation Gaps
- 7.4 Emerging Market Opportunities
- 7.5 Market Dynamics Impact and Time-Horizon Assessment
Chapter 8 Indonesia Dairy Products Value Chain Analysis
- 8.1 Industry Value Chain Overview
- 8.2 Upstream Suppliers and Critical Inputs
- 8.3 Technology and Component Providers
- 8.4 Manufacturing or Service Delivery
- 8.5 Distribution, Channel Partners and Integrators
- 8.6 Downstream Applications and End Users
- 8.7 Value Addition and Profit Pools
- 8.8 Vertical Integration and Outsourcing
- 8.9 Supplier Concentration and Risk
- 8.10 Supply Chain Localization and Resilience
Chapter 9 Indonesia Dairy Products Market Regulations and Policies
- 9.1 Relevant Laws, Standards and Compliance Frameworks
- 9.2 Product, Service, Safety and Quality Requirements
- 9.3 Government Policies, Incentives and Subsidies
- 9.4 Imports, Exports and Trade Barriers
- 9.5 Public Procurement and Local Content Requirements
- 9.6 Environmental and Sustainability Compliance
- 9.7 Upcoming Policy Changes and Market Implications
Chapter 10 Indonesia Dairy Products Market Hotspots and Opportunities
- 10.1 Market Opportunity Mapping and Growth Hotspots
- 10.2 High-Growth Applications and Customer Groups
- 10.3 Underserved Markets and White-Space Opportunities
- 10.4 Emerging Technology and Product Opportunities
- 10.5 New Capacity and Investment Hotspots
- 10.6 Market Entry and Expansion Opportunities
- 10.7 Distribution and Partnership Opportunities
- 10.8 Near-Term and Long-Term Commercial Potential
- 10.9 Opportunity Attractiveness and Execution Risks
Chapter 11 Indonesia Dairy Products Market Outlook, 2025-2035
- 11.1 Market Size and Analysis
- 11.1.1 Revenue (Market Measurement: 2025: USD 4.80 billion → 2035: USD 9.43 billion)
- 11.1.2 Market Volume and Quantity Sold
- 11.1.3 Historical Market Size, 2018-2025
- 11.1.4 Base-Year Market Size, 2025
- 11.2 Market Forecast, 2025-2035
- 11.2.1 Revenue Forecast to 2035
- 11.2.2 Volume Forecast to 2035
- 11.2.3 CAGR and Year-on-Year Growth
- 11.2.4 Incremental Revenue Opportunity
- 11.3 Forecast Assumptions and Scenario Analysis
- 11.3.1 Base-Case Forecast
- 11.3.2 Optimistic and Conservative Scenarios
- 11.3.3 Technology, Pricing and Policy Sensitivities
- 11.4 Market Attractiveness and Growth Outlook
Chapter 12 Indonesia Dairy Products Market Segmentation and Outlook
- 12.1 Segmentation Summary and Market Shares, 2025
- 12.2 Largest and Fastest-Growing Segments
- 12.3 By Product Type - Market Size and Forecast, 2025-2035
- 12.3.1 Segment Definition and Scope
- 12.3.2 Historical Market Size, 2018-2025
- 12.3.3 Revenue Forecast, 2025-2035
- 12.3.4 Volume Forecast, 2025-2035
- 12.3.5 Base-Year Market Share, 2025
- 12.3.6 Segment CAGR and Growth Drivers
- 12.3.7 Subsegment Market Size and Forecast
- 12.3.7.1 Liquid and UHT Milk
- 12.3.7.2 Milk Powder and Formula
- 12.3.7.3 Sweetened Condensed Milk
- 12.3.7.4 Yogurt and Fermented Dairy
- 12.3.7.5 Cheese and Butter
- 12.3.7.6 Ice Cream
- 12.3.8 Subsegment Pricing and Adoption Trends
- 12.3.9 Leading Suppliers and Competition
- 12.3.10 Regional Demand and Opportunities
- 12.4 By Price Tier - Market Size and Forecast, 2025-2035
- 12.4.1 Segment Definition and Scope
- 12.4.2 Historical Market Size, 2018-2025
- 12.4.3 Revenue Forecast, 2025-2035
- 12.4.4 Volume Forecast, 2025-2035
- 12.4.5 Base-Year Market Share, 2025
- 12.4.6 Segment CAGR and Growth Drivers
- 12.4.7 Subsegment Market Size and Forecast
- 12.4.7.1 Mass
- 12.4.7.2 Mid-Range
- 12.4.7.3 Premium
- 12.4.8 Subsegment Pricing and Adoption Trends
- 12.4.9 Leading Suppliers and Competition
- 12.4.10 Regional Demand and Opportunities
- 12.5 Segment Growth Comparison
- 12.6 Segment Attractiveness and Priority Matrix
Chapter 13 Indonesia Dairy Products Geographic Market Outlook, 2025-2035
- 13.1 Domestic Market Distribution and Demand Clusters
- 13.2 State- or Province-Wise Market Size and Forecast, 2025-2035
- 13.3 City and Metropolitan Market Outlook
- 13.4 Industrial, Manufacturing and Commercial Clusters
- 13.5 Geographic Concentration of Key End Users
- 13.6 Local Pricing and Purchasing Differences
- 13.7 Domestic Production Facilities and Capacity Map
- 13.8 Local Infrastructure and Project Pipeline
- 13.9 State-Level Policy and Incentive Differences
- 13.10 Subnational Investment Hotspots and Opportunities
- 13.11 Distribution and Logistics Networks
- 13.12 Domestic Competitive Footprint
Chapter 14 Indonesia Dairy Products Technology, Innovation and Sustainability Outlook
- 14.1 Technology Landscape and Maturity
- 14.2 Product, Process and Service Innovation
- 14.3 AI, Automation and Digital Tools in the Industry
- 14.4 Technology Adoption and Performance Benchmarking
- 14.5 Innovation Pipeline and R&D Investment
- 14.6 Patent and Intellectual Property Trends
- 14.7 Energy Efficiency and Resource Management
- 14.8 Sustainability, Recycling and Circularity
- 14.9 Technology Roadmap, 2025-2035
- 14.10 Risks of Obsolescence and Technology Substitution
Chapter 15 Indonesia Dairy Products Market Key Strategic Imperatives
- 15.1 Growth and Market Entry Priorities
- 15.2 High-Return Products and Segments
- 15.3 Pricing, Profitability and Cost Optimization
- 15.4 Technology Investment and Product Differentiation
- 15.5 Supply Chain Localization and Resilience
- 15.6 Distribution and Customer Acquisition
- 15.7 Partnership, Acquisition and Capacity Strategy
- 15.8 Regional Expansion Priorities
- 15.9 Short-, Medium- and Long-Term Actions
Chapter 16 Competition Outlook
- 16.1 Industry Competition Characteristics
- 16.2 Market Structure and Concentration
- 16.3 Market Share and Competitive Positioning, 2025
- 16.4 Company-Wise Revenue and Product Benchmarking
- 16.5 Production and Service Capacity Benchmarking
- 16.6 Technology, Pricing and Differentiation
- 16.7 Regional Footprint and Distribution Strength
- 16.8 Mergers, Acquisitions and Strategic Alliances
- 16.9 New Entrants and Competitive Threats
- 16.10 Porter's Five Forces and Industry Attractiveness
- 16.11 Competitive Outlook, 2025-2035
Chapter 17 Company Profiles
- 17.1 Company Coverage and Selection Criteria
- 17.2 PT Frisian Flag Indonesia
- 17.2.1 Business Description
- 17.2.2 Company Ownership and Geographic Presence
- 17.2.3 Product and Service Portfolio
- 17.2.4 Manufacturing and Operating Footprint
- 17.2.5 Production Capacity and Expansion Plans
- 17.2.6 Financial Performance and Investment
- 17.2.7 Market Share and Competitive Position
- 17.2.8 Technology and Innovation Capabilities
- 17.2.9 Strategic Alliances or Partnerships
- 17.2.10 Recent Developments
- 17.2.11 Growth Strategy and Outlook
- 17.3 PT Ultrajaya Milk Industry & Trading Company Tbk
- 17.4 PT Indolakto
- 17.5 PT Nestlé Indonesia
- 17.6 PT Sarihusada Generasi Mahardhika
- 17.7 PT Cisarua Mountain Dairy Tbk
- 17.8 PT Greenfields Indonesia
- 17.9 PT Fonterra Brands Indonesia
- 17.10 PT Campina Ice Cream Industry Tbk
- 17.11 PT Diamond Food Indonesia Tbk
- 17.12 Other Relevant Market Participants
Note: Every listed company is profiled on the structure shown under the first company. The company list is preliminary and may change based on research findings, market developments, data availability and client requirements.
Chapter 18 Disclaimer
- 18.1 Research and Forecast Disclaimer
- 18.2 Data Source and Estimation Limitations
Note: The depth of individual sections depends on data availability for this market. Volume, capacity, trade and other unit-based metrics are included where applicable.

