
Household blocks anchor value as premium ranges widen
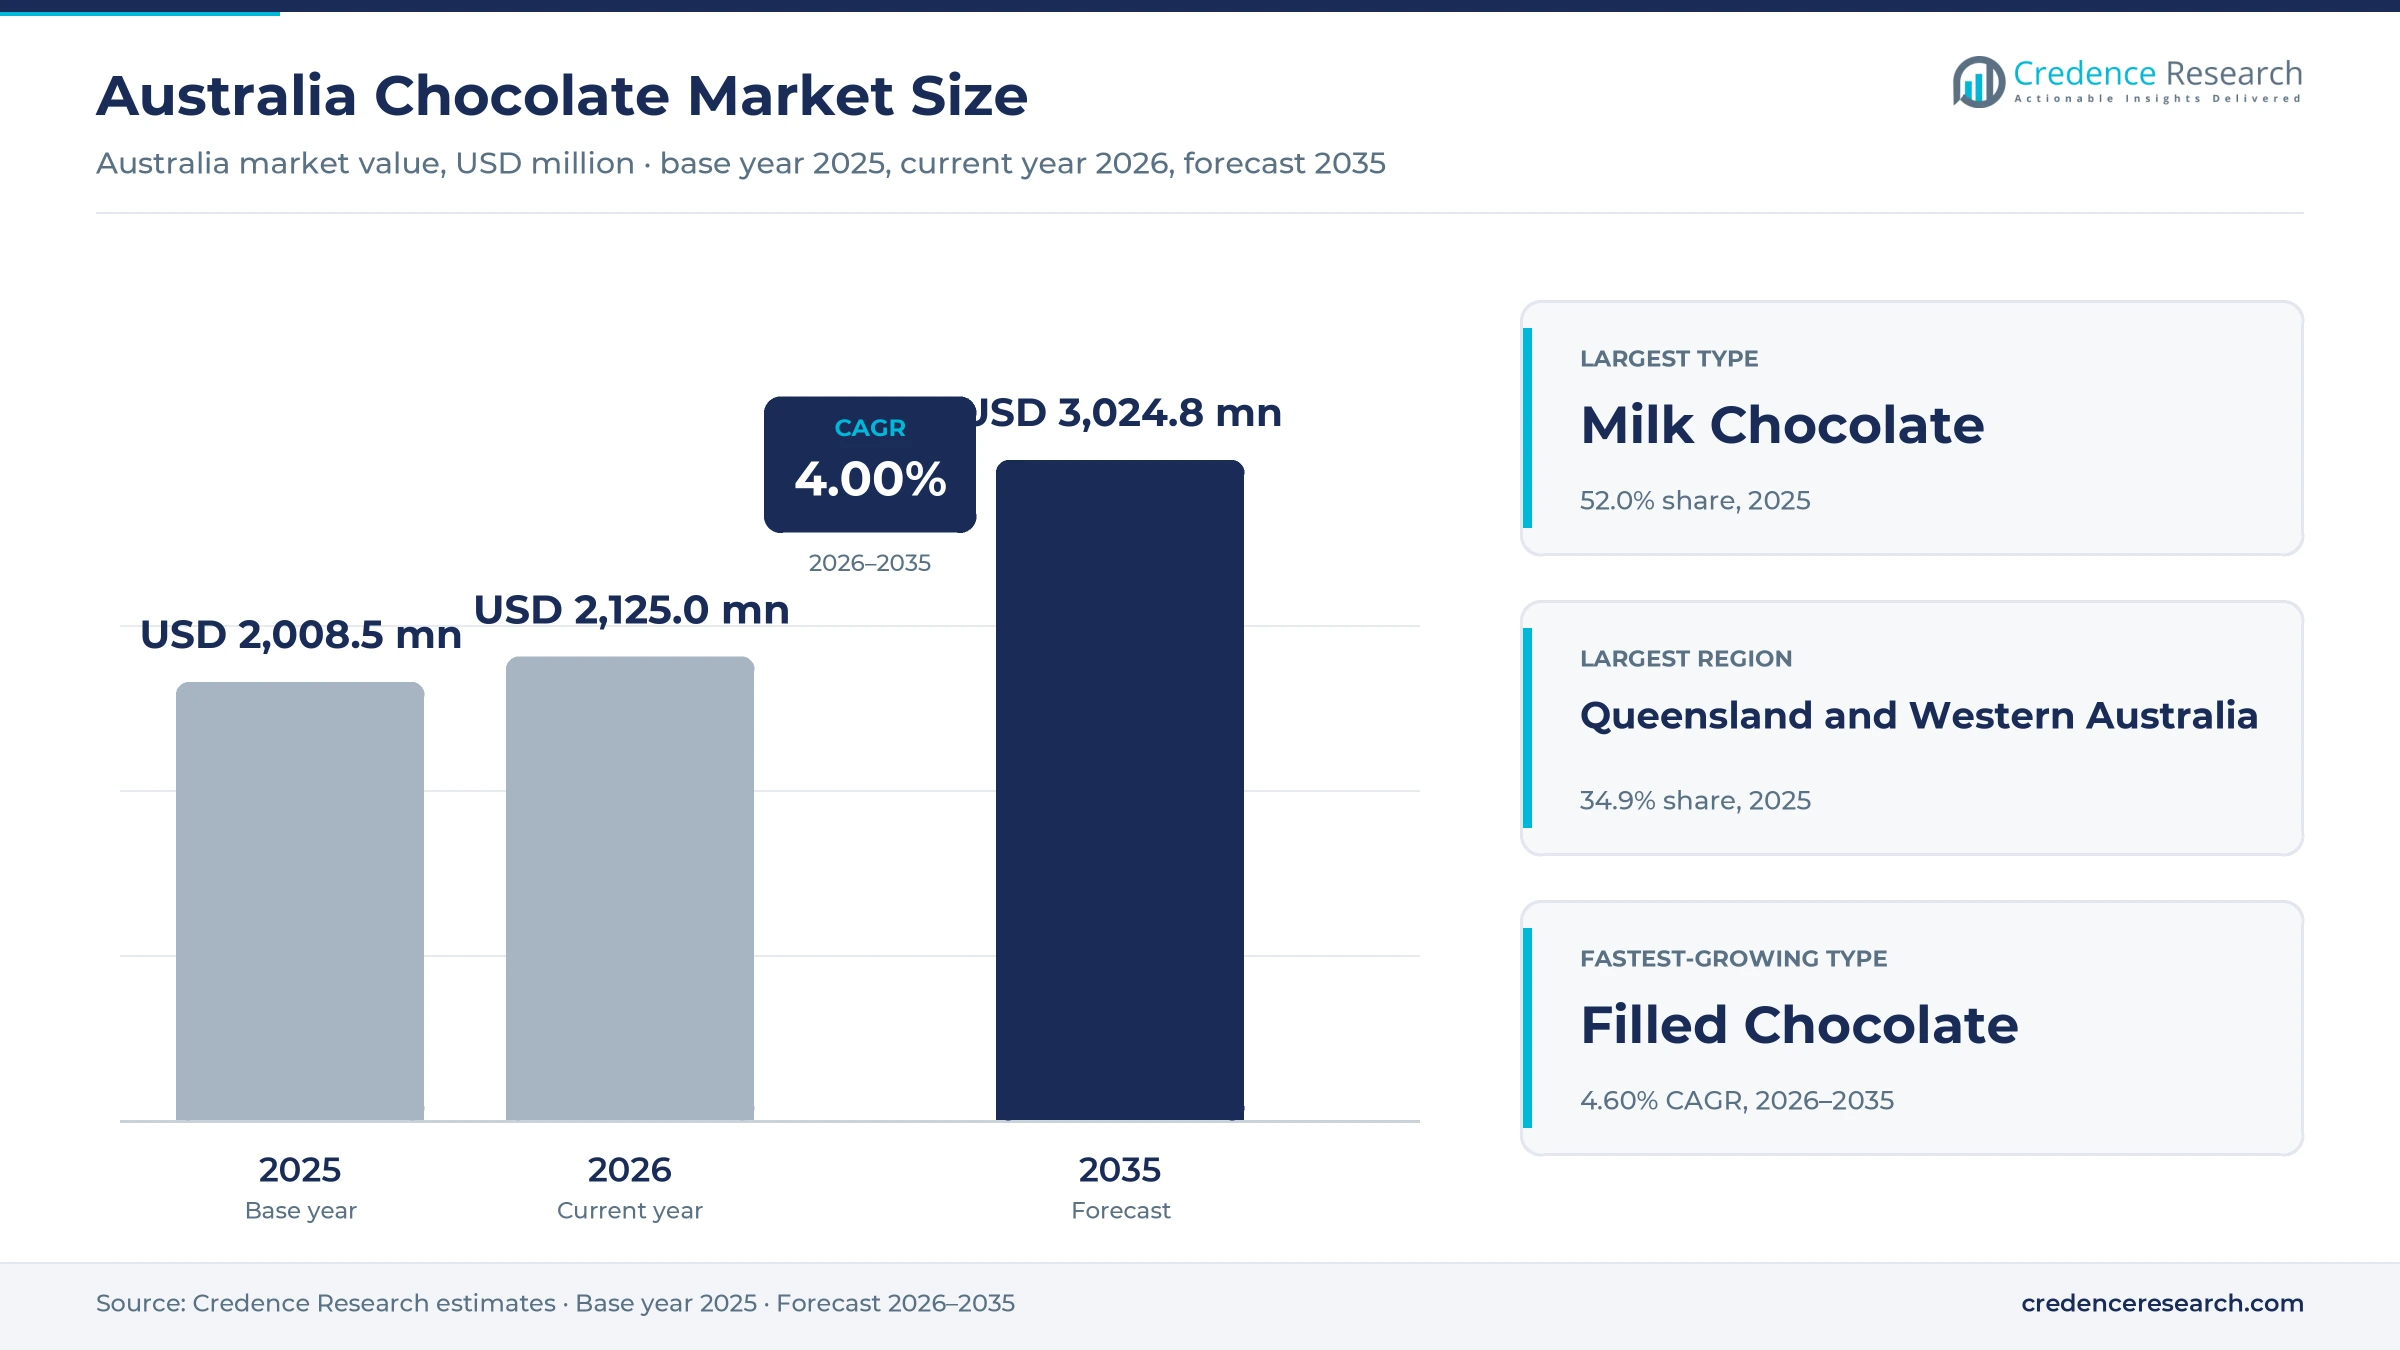
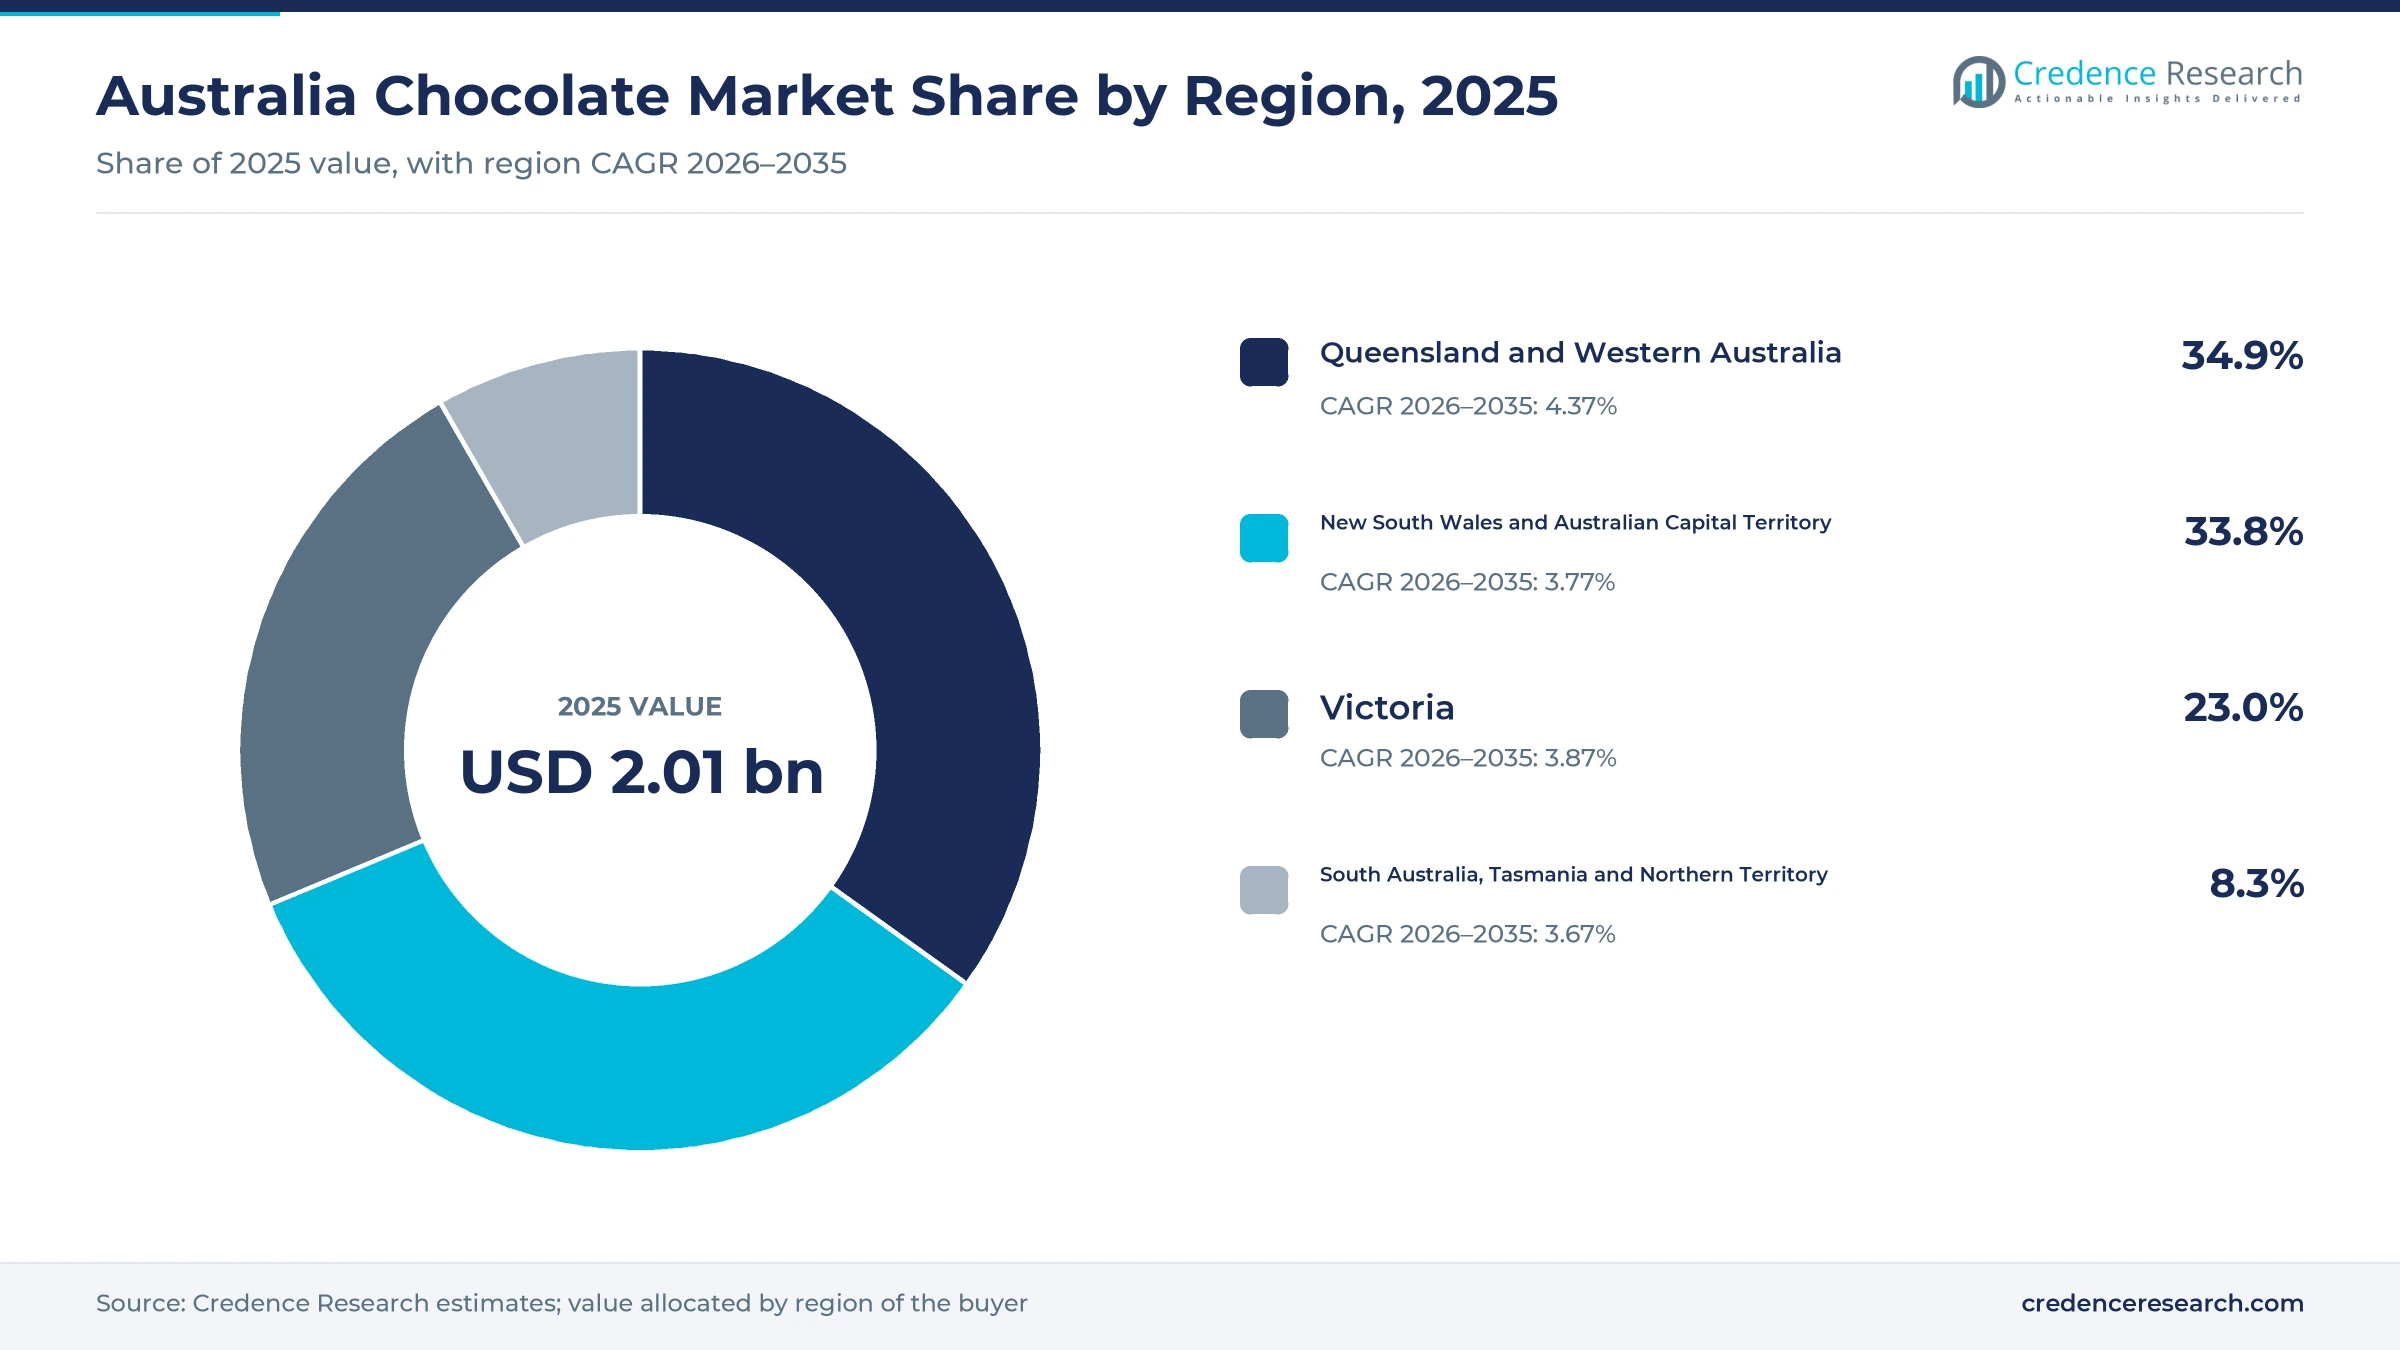
The Australia chocolate market was valued at USD 2.01 billion in 2025 and is projected to increase from USD 2.13 billion in 2026 to USD 3.02 billion by 2035, registering a CAGR of 4.00% during 2026–2035. Demand rests on routine household blocks, seasonal peaks at Easter and Christmas, and a growing premium tier supplied by local plants in Victoria, Tasmania, New South Wales and South Australia. Queensland and Western Australia held the largest regional share, 34.9% in 2025, and Queensland and Western Australia is also the fastest-growing zone at 4.37% a year, helped by population growth in the west. Pack sizes have been cut since 2025 as higher cocoa costs reached shelves, and those costs have since eased. Value growth therefore depends more on product mix and gifting than on grams eaten per person, as Haigh's Chocolates and other premium makers add capacity and stores.
What does the Australian chocolate market include and how do shoppers buy?
The estimate counts retail and direct sales of milk, dark, white and filled chocolate to households, visiting consumers and organizations in Australia. Shoppers mostly buy molded blocks and bars in supermarkets, while convenience stores serve impulse purchases and specialty stores sell boxed and artisan ranges for gifts. Online orders come through grocery apps and through the direct stores of chocolate makers.
Cocoa powder, cocoa butter sold as an ingredient, chocolate spreads and baked goods fall outside the estimate, as do exports from Australian plants. The value chain runs from imported cocoa and Tasmanian milk through plants and temperature-controlled warehouses to retail shelves.
Australia Chocolate Market Insights
- The market grows from USD 2.01 billion in 2025 to USD 3.02 billion by 2035 at a 4.00% CAGR, with price and product mix adding more than volume per person.
- Queensland and Western Australia held 34.9% of 2025 value, ahead of New South Wales and the Australian Capital Territory at 33.8%.
- Milk Chocolate held 52.0% of 2025 value, while Filled Chocolate is the fastest-growing type at 4.60% a year through 2035.
- Haigh's Chocolates opened an A$120 million South Australian plant in September 2025, which allows output to grow from 1,100 to 2,000 metric tons a year.
- Whittaker's took a limited-edition Banana Caramel block into Woolworths stores in May 2026, which widened the premium choice on mainstream Australian supermarket shelves.
Milk blocks and supermarkets still set the sales base
Why do milk blocks lead while filled ranges grow fastest?
Based on product type, the market is categorized into milk chocolate, dark chocolate, white chocolate and filled chocolate. In the Australia chocolate market, Milk Chocolate led with a 52.0% share of 2025 value. This lead rests on household blocks in weekly baskets, with the Truganina hub of Mondelez International in Melbourne handling up to four million Cadbury blocks a week, The Indian Sun reported in July 2025. Filled Chocolate grows fastest at 4.60% a year as makers add texture and fillings, shown by the five-flavor Cadbury &MORE range, made at Claremont in Tasmania and on shelves from April 15, 2026, according to the trade publication B&T.
How do everyday and artisan price tiers differ?
Based on price tier, the market is categorized into everyday, mainstream premium and luxury artisan chocolate. In the Australia chocolate market, Everyday led with a 58.0% share of 2025 value. Budget-conscious shoppers still dominate volume, and Mondelez International added 100-gram blocks to protect shelf prices during the cocoa surge, The Indian Sun reported in July 2025. Luxury Artisan grows fastest at 5.06% a year as specialist capacity expands. Koko Black planned seven to 10 new stores in fiscal 2026 after buying Chocolatier Australia in April 2025, according to Baking Business, and Haigh's new plant allows output to grow from 1,100 to 2,000 metric tons a year, according to Food Processing.
Which purchase occasions carry the most chocolate value?
Based on purchase occasion, the market is categorized into routine consumption, seasonal celebrations, personal gifting and business gifting. In the Australia chocolate market, Routine Consumption led with a 49.0% share of 2025 value. This lead reflects steady intake across the year, at 16.4 grams per person a day in 2024-25, according to the Australian Bureau of Statistics. Seasonal peaks stay large, with Easter food and chocolate spending forecast at A$2.2 billion in 2025, the Australian Retailers Association said. Personal Gifting grows fastest at 4.80% a year as gift budgets rise, with the average Christmas 2025 shopper forecast by the association to spend A$757 on gifts, up 7.1%.
Why do supermarkets remain ahead of online channels?
Based on distribution channel, the market is categorized into supermarkets, convenience stores, specialty stores and e-commerce. In the Australia chocolate market, Supermarkets led with a 63.0% share of 2025 value. National range decisions reach most shoppers, as when Whittaker's placed a limited-edition Banana Caramel block in Woolworths stores in May 2026, Inside FMCG reported. Pana Organic also sells through Coles and Woolworths, SmartCompany reported in April 2024. E-Commerce grows fastest at 5.76% a year as digital baskets expand, with Coles online sales up 27.9% and Woolworths Group online penetration at 16.2% in the first quarter of fiscal 2026, the retailers reported.
| Segment Group | Leading Sub-segment | Share, 2025 | Fastest-growing Sub-segment | CAGR, 2026–2035 |
|---|---|---|---|---|
| By Product Type | Milk Chocolate | 52.0% | Filled Chocolate | 4.60% |
| By Price Tier | Everyday | 58.0% | Luxury Artisan | 5.06% |
| By Purchase Occasion | Routine Consumption | 49.0% | Personal Gifting | 4.80% |
| By Distribution Channel | Supermarkets | 63.0% | E-Commerce | 5.76% |
Request a Free Sample
Fill in your details and we'll send you a free sample report.
- Sample data tables & charts
- Research methodology
Habit, plant investment and gifting support value growth
Established consumption and accessible pack architecture
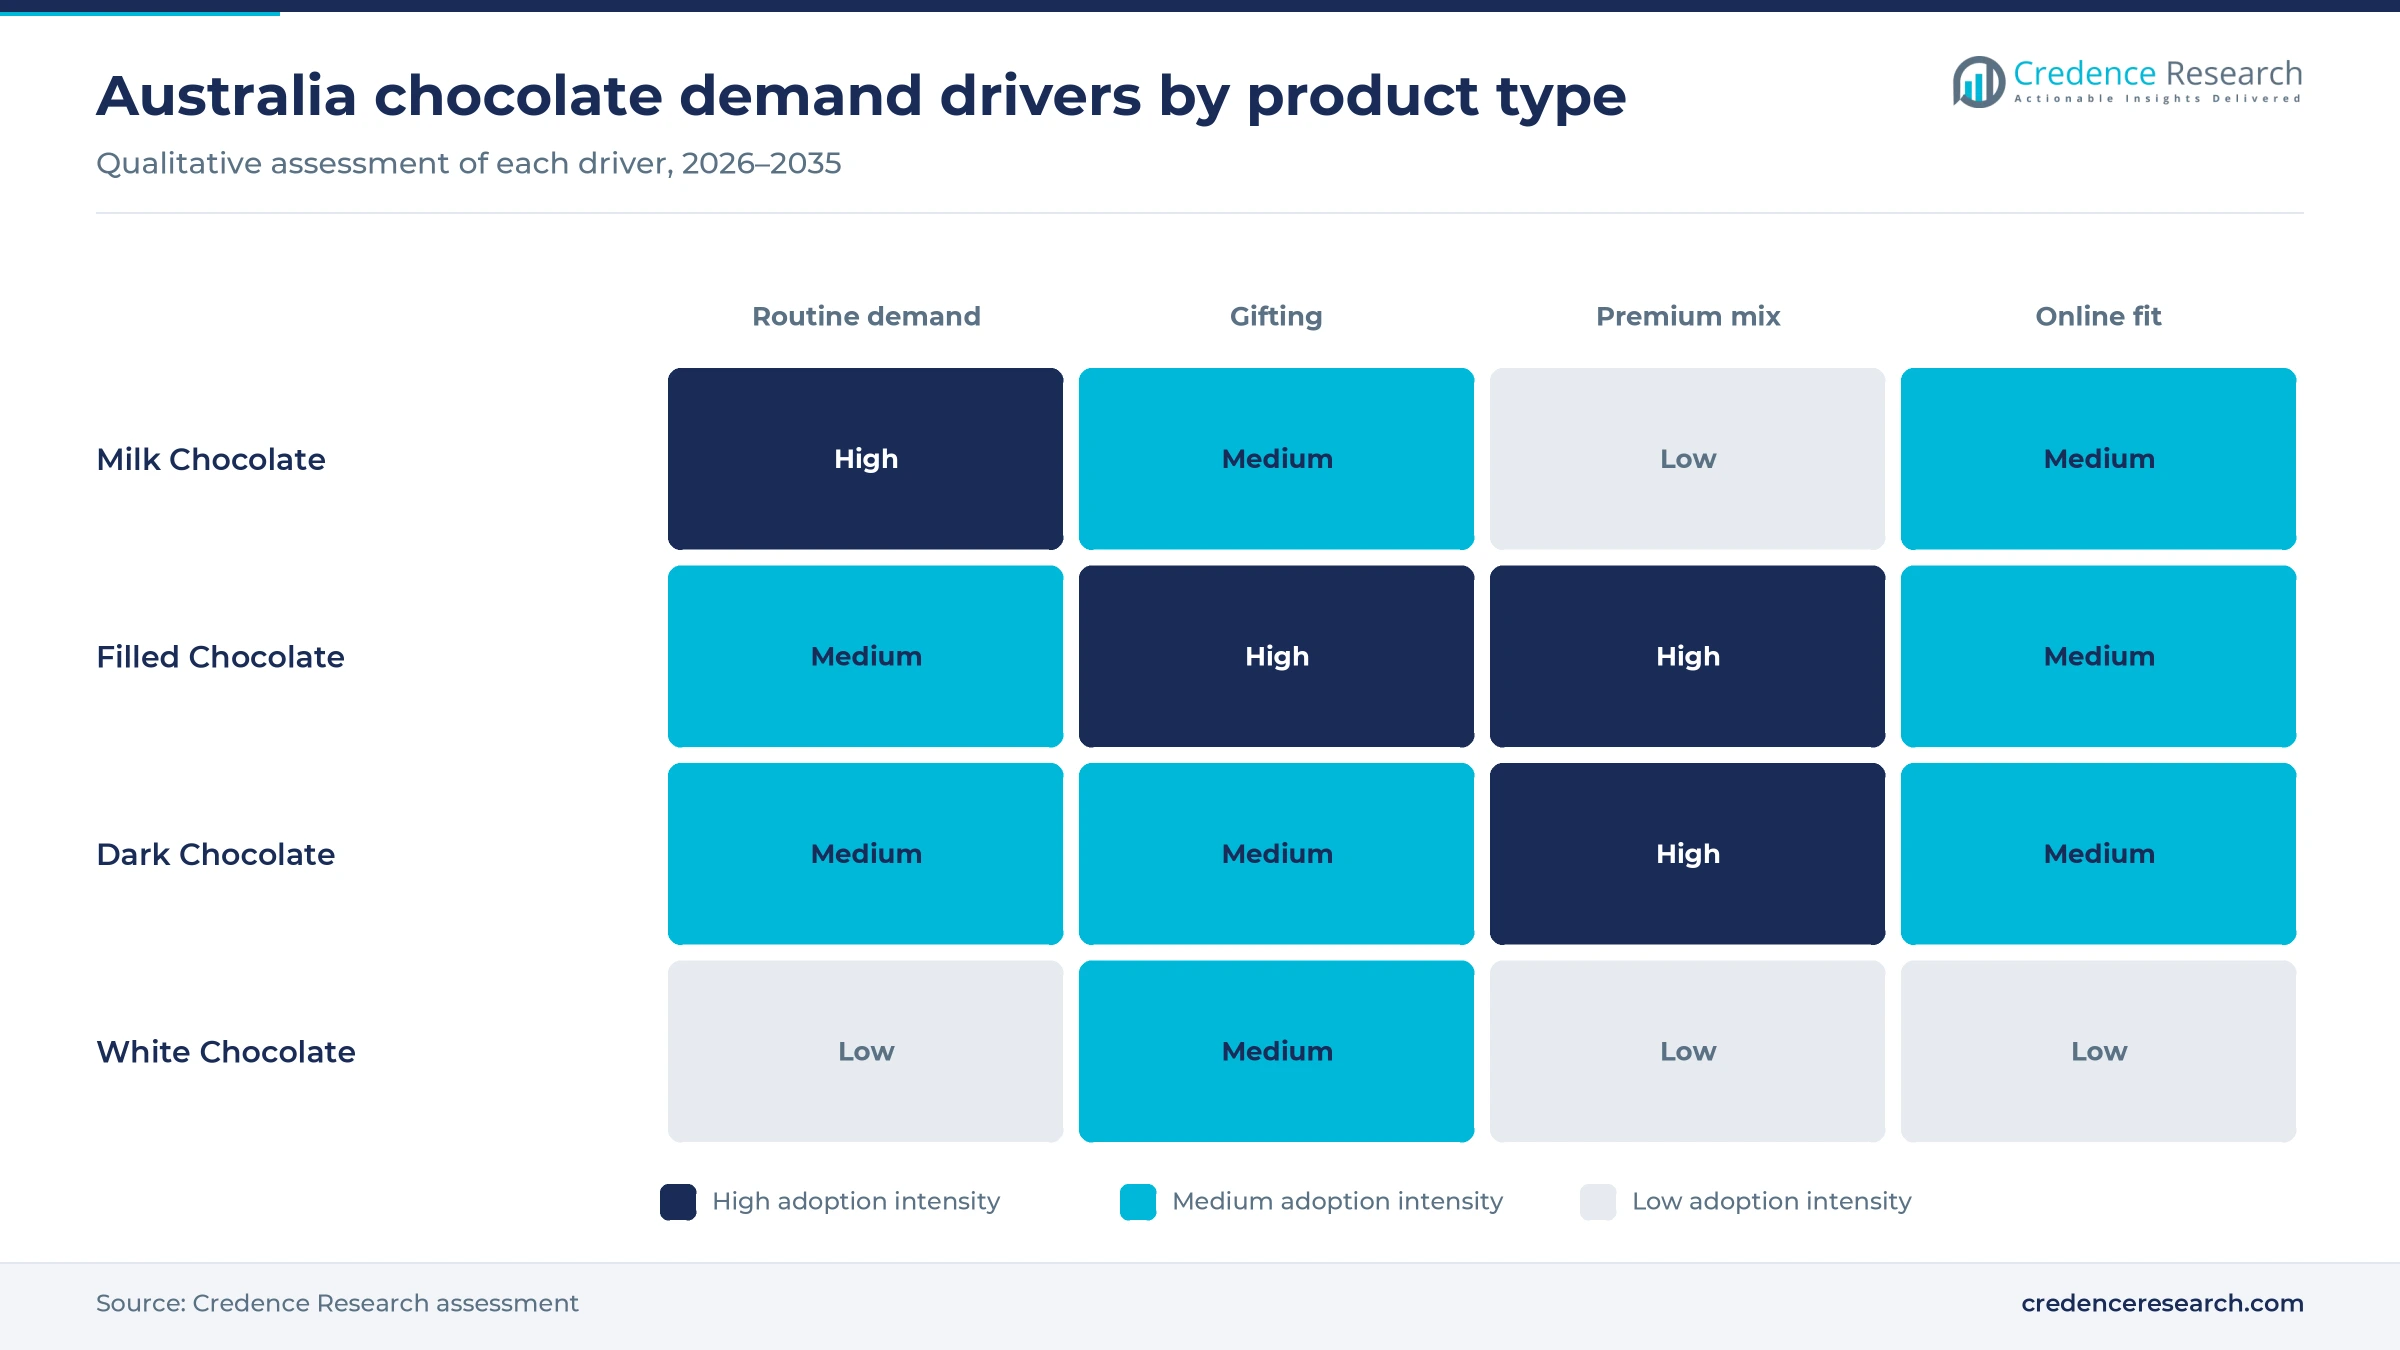
Established eating habits give chocolate a broad, repeat base across Australian households, and accessible pack sizes keep it within weekly budgets. The Australian Bureau of Statistics put apparent intake at 16.4 grams per person a day in 2024-25, which is still 4.5% above the 2018-19 level despite a 1.8% annual decline. Mondelez International answered rising cocoa prices and cautious shoppers by adding 100-gram blocks, The Indian Sun reported in July 2025. Its Truganina hub now handles more than 450 million products a year, a measure of how large routine supply has become. As a result, Everyday ranges retained the largest tier position in 2025, and block formats remain the entry point for most buyers.
Premium production and fulfillment investment
Premium makers are adding capacity and online fulfillment, which lets them sell more high-value chocolate without relying on a few city stores. Haigh's Chocolates opened an A$120 million plant at Salisbury South in September 2025, with room to grow output from 1,100 to 2,000 metric tons a year. Darrell Lea reopened its Ingleburn factory in November 2023 after an expansion costing A$45 million that can pack up to 42,000 gift boxes a day, Baking Business reported. Koko Black bought Chocolatier Australia and its Heidelberg West site in April 2025, adding a 4,000-square-meter climate-controlled warehouse. These commitments support Luxury Artisan, which grows at 5.06% a year, because scarce specialist capacity had limited that tier.
Seasonal gifting and digital reordering
Gifting peaks lift the average value of a chocolate purchase, and digital baskets make reordering easier between those peaks. The Australian Retailers Association forecast A$12 billion of Christmas gift spending in December 2025, with shoppers averaging A$757 each. For Easter 2025, it forecast A$2.2 billion on food and chocolate across 15.2 million buyers, an average of A$145 a person. Online habits are also deepening, because Woolworths Group reported 15.9% e-commerce growth for fiscal 2026, Inside Retail said in August 2026. Those orders increasingly move through grocery delivery networks, which suit repeat block purchases. E-Commerce therefore grows at 5.76% a year from a small base.
Population growth and visitor spending widen the buyer base
A larger resident population and a recovering visitor flow add buyers even while grams per person soften. The Australian Bureau of Statistics counted 27.8 million residents at Dec. 31, 2025, up 412,500 or 1.5% over the year, led by Western Australia at 2.2%. Tourism Research Australia recorded 8.4 million international trips in the year to June 2026, up 9%, with A$40.5 billion spent inside the country. Central stores such as the Koko Black shop in the Queen Victoria Building in Sydney give those visitors a local gift option. Western Australia posted the fastest resident gain, which supports Queensland and Western Australia as the largest regional zone.
Smaller packs and filled ranges reshape the shelf
Shift to smaller packs reshapes how value is measured
Pack downsizing has become the main way makers pass on cocoa costs, so value now grows faster than grams sold. CHOICE found in April 2025 that a Cadbury hollow egg pack fell from 24 to 22 eggs while its price rose from A$12.50 to A$15, or 31% per 100 grams. The consumer group also recorded an Aldi mini egg bag falling from 400 to 300 grams at the same A$5.99 price. Beyond Easter, Food Processing reported in January 2025 that the KitKat 4 Finger bar would fall from 45 to 42 grams after a factory upgrade. As a result, buyers increasingly compare unit prices, which favors brands that can justify a higher price per gram.
Rise of filled and flavor-led launches on mainstream shelves
Flavor and filling launches are becoming the main route to higher prices in supermarkets, because they give shoppers a reason to accept a smaller or dearer block. Cadbury called its five-flavor &MORE range its most significant brand debut in more than a decade when it reached stores on April 15, 2026, B&T reported. Whittaker's followed in May with a limited-edition Banana Caramel block in Woolworths stores. Nestlé designed its A$30 million Campbellfield upgrade of January 2025 to support new flavors and fillings as well. This activity explains why Filled Chocolate grows at 4.60% a year through 2035.
Opportunity in cocoa price relief to rebuild volumes
Lower cocoa costs give makers an opening to restore pack sizes or fund promotions that recover lost grams. The World Bank said cocoa averaged US$4.35 a kilogram in June 2026, more than 50% below a year earlier, as output rose by more than one-third. Falling cocoa bean costs have not yet reached Easter shelves, however, because the Australian Associated Press reported in March 2026 that a Cadbury egg box had reached A$18. Brands that move first can therefore win back shoppers who traded down. The opening is largest in Everyday ranges, where price per gram matters most to household buyers.
Opportunity as artisan stores enter new states
Specialist chocolate chains are only now reaching Queensland, which leaves room for further stores. Haigh's Chocolates opened its first Brisbane store at Westfield Mt Gravatt in 2026, with Chermside and Carindale due in November, Inside Retail reported in September 2026. Koko Black set a Queen Street Mall store, its 22nd, for December 2025, according to Baking Business. Perth was not among the cities Food Processing listed for the 22 Haigh's stores in September 2025. Queensland and Western Australia together counted about 8.79 million residents at the end of 2025, according to the Australian Bureau of Statistics, and that zone is the fastest growing in this report. Further store openings paired with online delivery could therefore build Luxury Artisan sales in both states.
Cocoa pass-through and softer intake limit volume
Cocoa pass-through keeps shelf prices high
Shelf prices remain elevated even as cocoa falls, which strains household budgets. The Australian Bureau of Statistics reported a 5.6% rise in snack and confectionery prices in the 12 months to January 2026, the Australian Associated Press said in March 2026. CHOICE reported in March 2026, citing price tool Zyft, that Cadbury and Lindt Easter bunnies and eggs rose by as much as a third in 12 months. Everyday buyers feel this most and may buy fewer blocks. Makers can respond by passing on lower cocoa costs sooner and restoring core pack sizes.
Softer intake per person limits volume growth
Chocolate intake per person has slipped from its recent high, so makers cannot rely on volume alone. The Australian Bureau of Statistics reported 16.4 grams a day in 2024-25, which is 6.3% below the 17.5 grams recorded in 2022-23, and said the fall in confectionery was entirely due to chocolate. Mass brands with large plants face the sharpest effect because they need steady throughput. As a result, value growth leans on premium mix, gifting and a larger population rather than on heavier consumption.
Shrinkflation rules raise the risk of pack changes
Federal scrutiny of pack sizes could make further downsizing more visible and more costly. Andrew Leigh, the assistant minister for competition, announced a Unit Pricing Code consultation in August 2025, SmartCompany reported, after the Australian Competition and Consumer Commission recommended that large grocers publish notices when packs shrink. The code already binds supermarkets with at least 1,000 square meters of floorspace. Chocolate brands that rely on seasonal pack changes face relabeling costs and shopper backlash, so clearer price and size labeling would become a practical priority.
Healthier checkouts reduce impulse visibility
Supermarket health policies are removing some of the best impulse space for small chocolate formats. Woolworths announced in June 2023 that it would clear children's confectionery from checkouts nationally and that at least 80% of checkout snacks would carry a Health Star Rating of 3.5 or more, Food & Drink Business reported. Single bars and small treat packs lose visibility as a result, which hurts brands dependent on unplanned purchases. Makers can respond through aisle displays, convenience stores and portioned multipacks that fit planned shopping trips.
Queensland and Western Australia lead the state split
| Region | Value, 2025 (USD billion) | Share, 2025 | CAGR, 2026–2035 |
|---|---|---|---|
| Queensland and Western Australia | 0.70 | 34.9% | 4.37% |
| New South Wales and Australian Capital Territory | 0.68 | 33.8% | 3.77% |
| Victoria | 0.46 | 23.0% | 3.87% |
| South Australia, Tasmania and Northern Territory | 0.17 | 8.3% | 3.67% |
Queensland and Western Australia lead on population growth
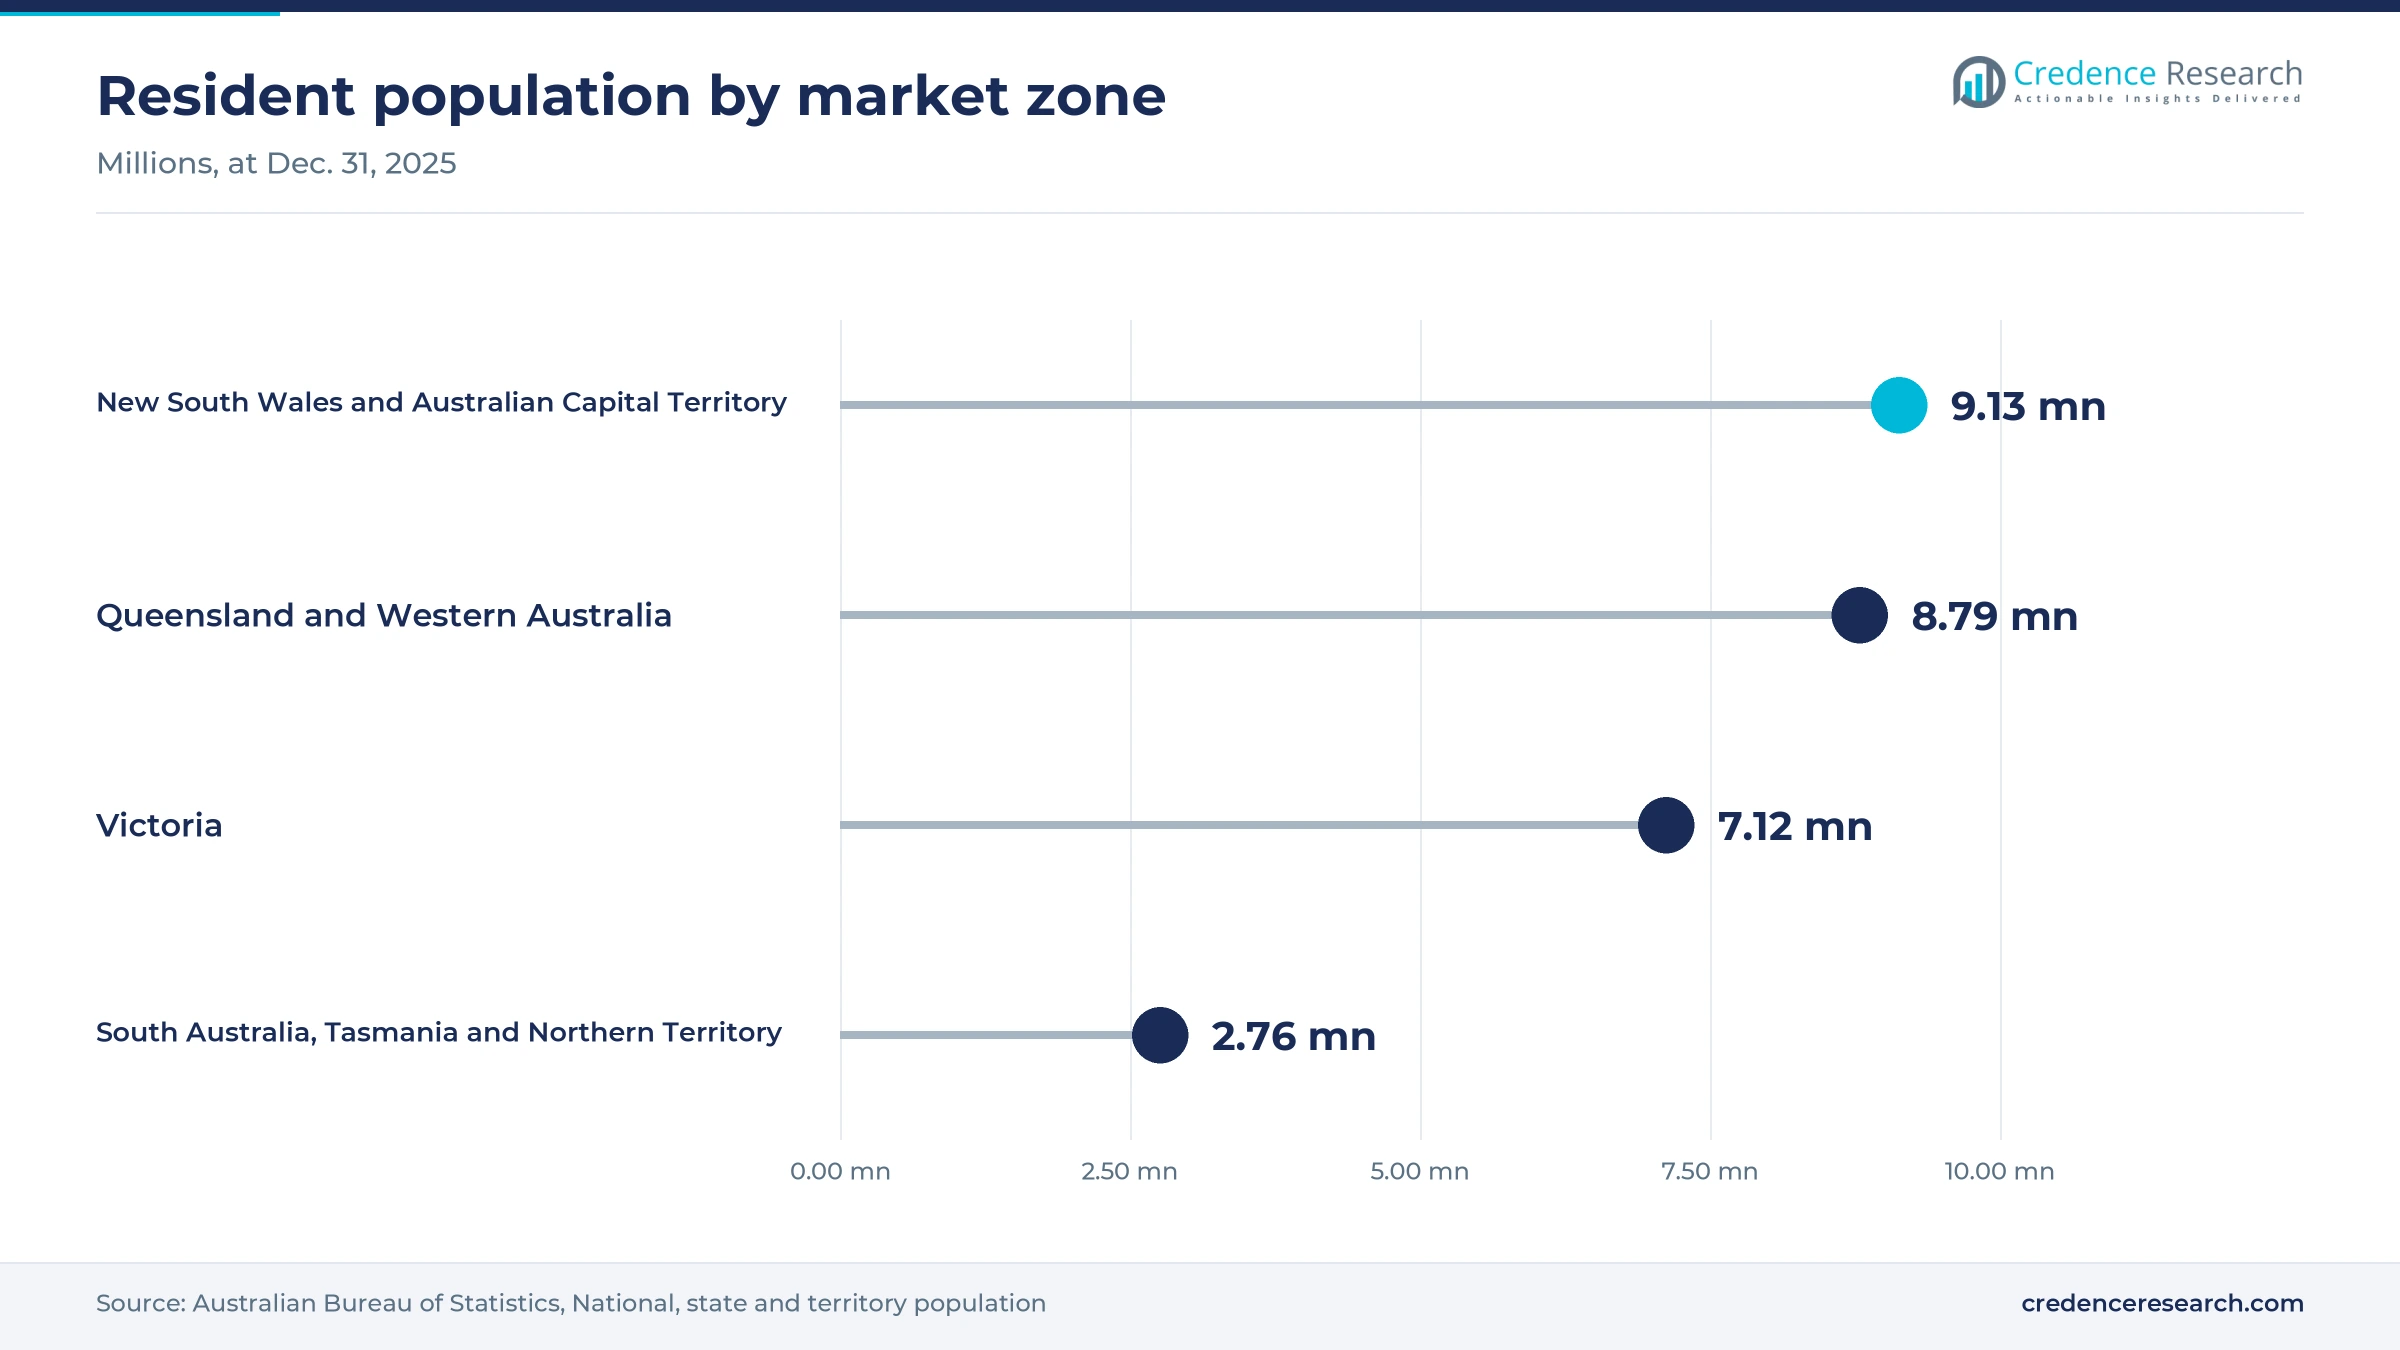
Queensland and Western Australia held a 34.9% regional share of 2025 value and grow at 4.37% a year, the fastest rate of the four zones. The Australian Bureau of Statistics counted 5.71 million Queensland residents and 3.08 million in Western Australia at the end of 2025, with annual growth of 1.6% and 2.2%. Retailers forecast Easter 2025 food and chocolate spending of A$320 million and A$270 million in the two states.
New South Wales and the ACT combine plants and premium retail
New South Wales and the Australian Capital Territory held a 33.8% regional share of 2025 value and grow at 3.77% a year. Together, they counted about 9.13 million residents at the end of 2025, and retailers forecast A$710 million of New South Wales Easter food and chocolate spending in 2025. Supply is also local, because Darrell Lea packs gift boxes at Ingleburn while Ferrero has invested A$30 million at Lithgow over three years. Haigh's opened its seventh Sydney store on Broadway by September 2025.
Victoria hosts the largest cluster of chocolate plants
Victoria held a 23.0% regional share of 2025 value and grows at 3.87% a year, with spending per head above the national average. Retailers forecast A$173 a person on Easter food and chocolate in 2025, against A$145 nationally. Nestlé makes KitKat at Campbellfield, Mars Wrigley makes M&M's and Maltesers at Ballarat, and Mondelez International runs Ringwood and the Truganina hub. Pana Organic and Koko Black are also based in Melbourne. This local cluster keeps freight costs low, although mature retail coverage limits new store gains compared with faster-growing zones.
South Australia, Tasmania and the Northern Territory punch above consumption
South Australia, Tasmania and the Northern Territory held an 8.3% regional share of 2025 value and grow at 3.67% a year. These areas counted about 2.76 million residents at the end of 2025, and retailers forecast A$120 million of South Australian and A$50 million of Tasmanian Easter food and chocolate spending in 2025. Their weight in production is far larger than their share of sales, because Haigh's Chocolates produces at Salisbury South and Cadbury makes its &MORE range at Claremont near Hobart.
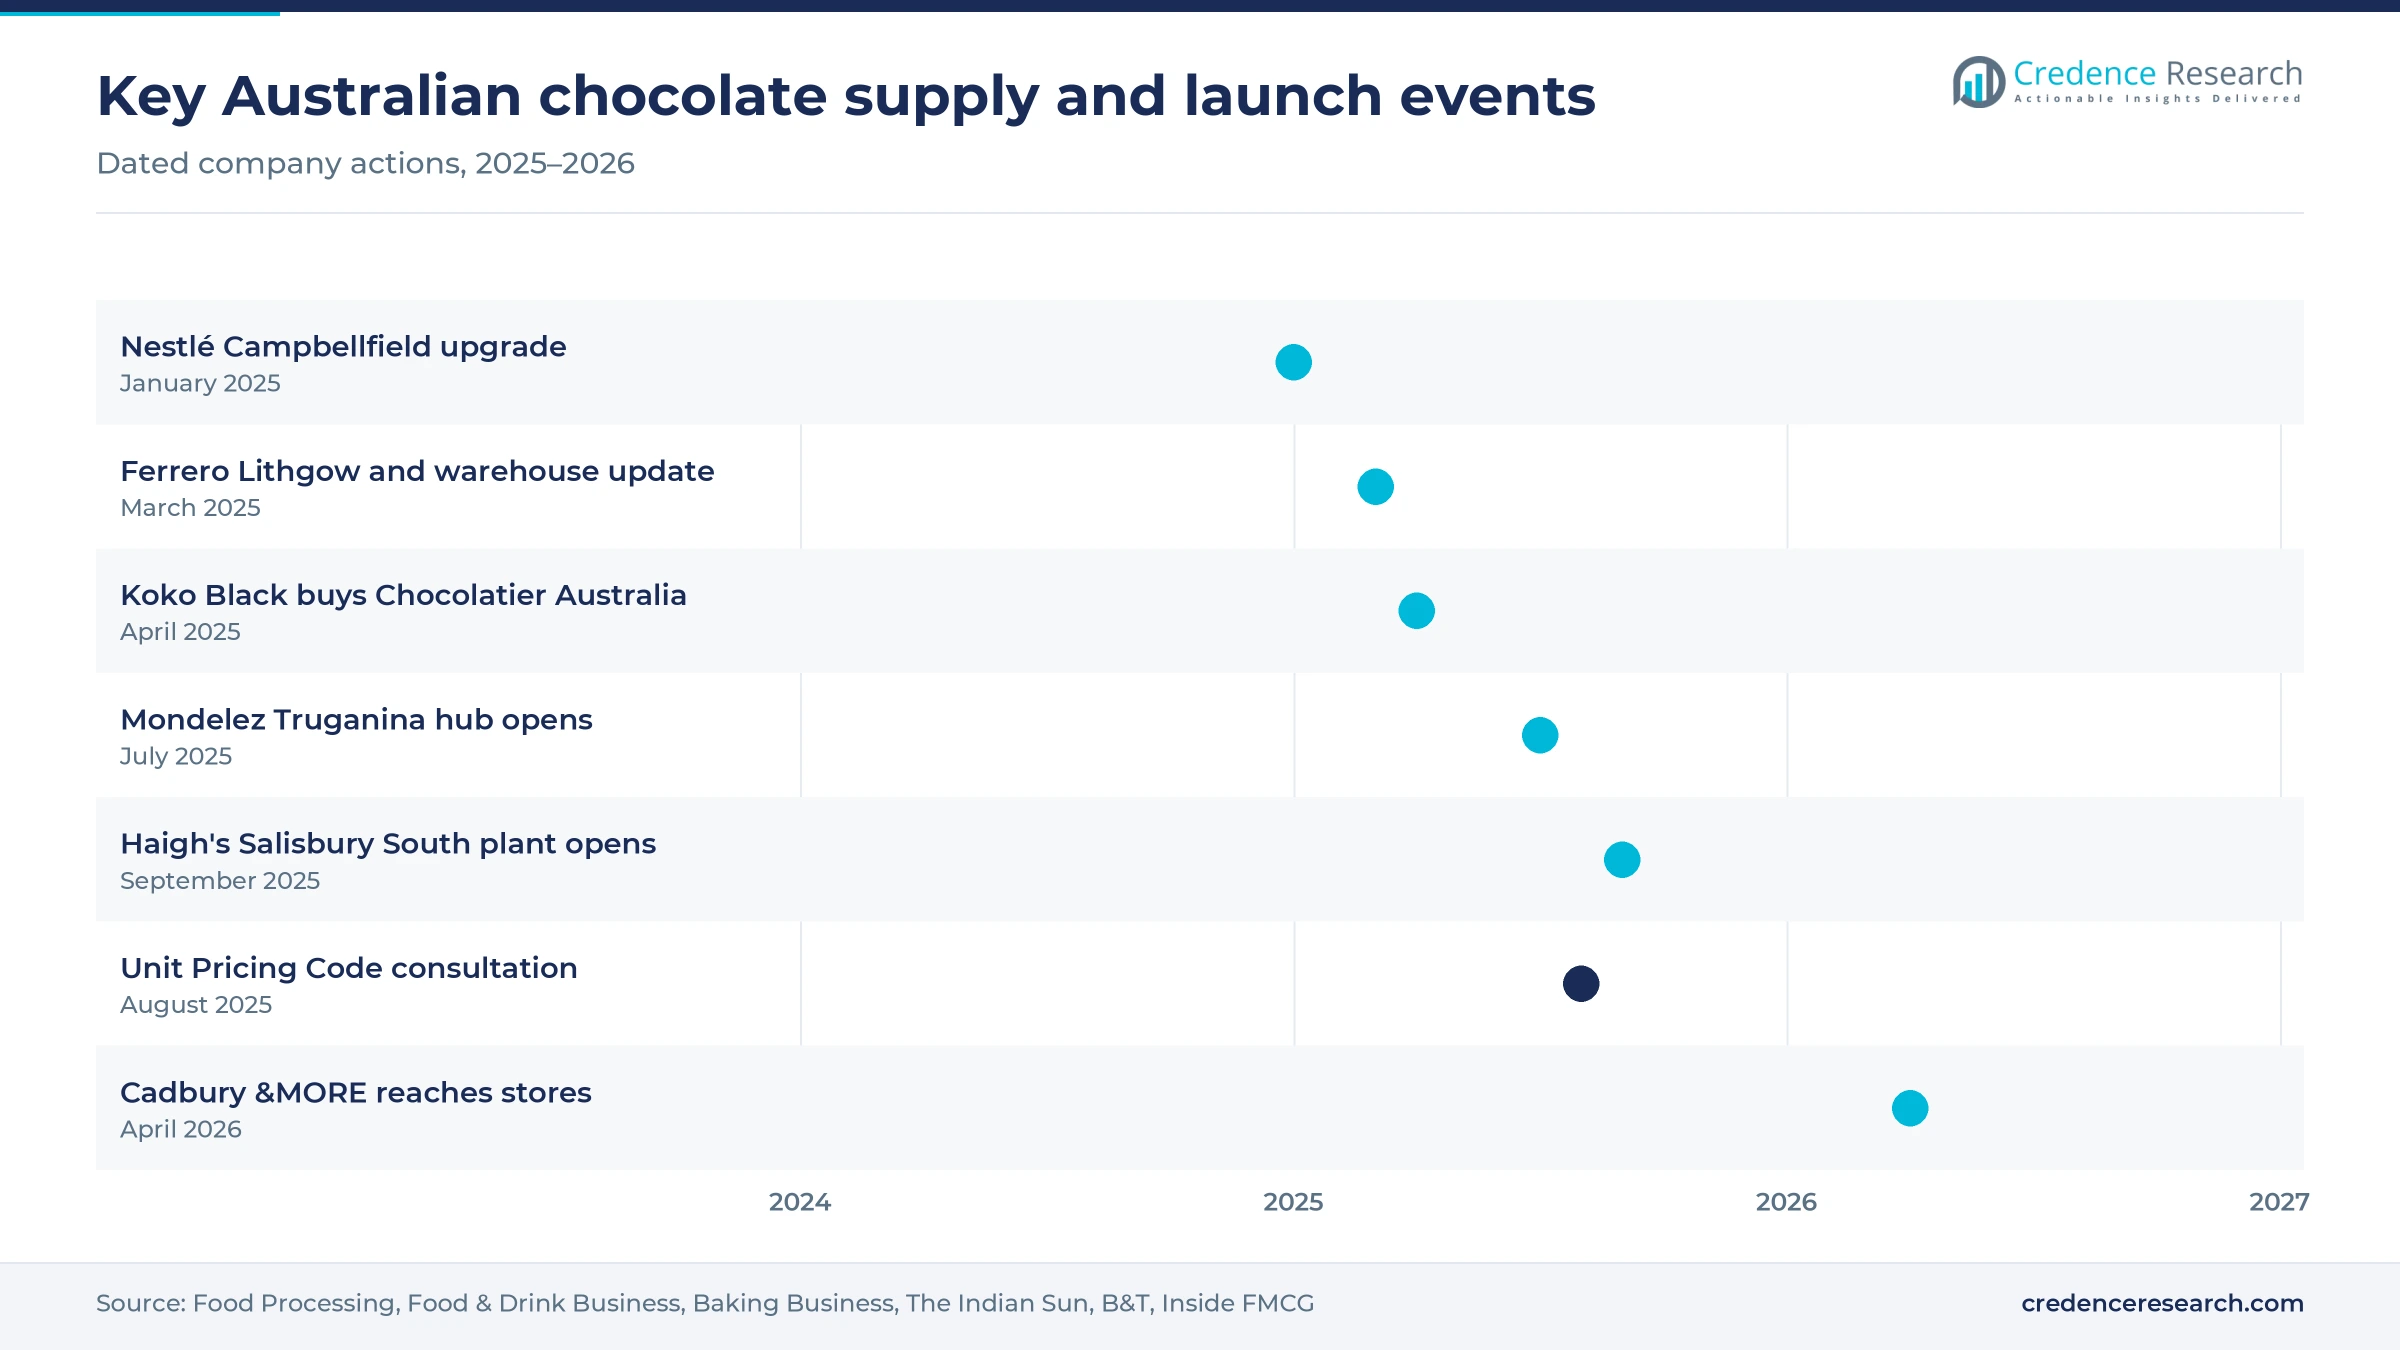
New hubs and premium launches marked 2025 and 2026
| Development | Status and market relevance |
|---|---|
| In January 2025, Nestlé announced an upgrade of its Campbellfield KitKat factory, worth A$30 million, with digital and AI capabilities. | Announced; adds capacity for new flavors and fillings |
| In March 2025, Ferrero detailed a further A$8 million for Lithgow and a 13,800-square-meter temperature-controlled warehouse at Kemps Creek, operated by Ceva Logistics. | Operating; first such site for Ferrero in the Pacific region |
| In April 2025, Koko Black acquired Melbourne-based Chocolatier Australia, including its Heidelberg West production facility. | Completed; supports a plan for seven to 10 stores in fiscal 2026 |
| In July 2025, Mondelez International opened its Truganina distribution hub in Melbourne, handling up to four million Cadbury blocks each week. | Operating; raises storage capacity by nearly 60% |
| In September 2025, Haigh's Chocolates opened its Salisbury South production, warehouse and online fulfillment plant in South Australia. | Operating; allows output of 2,000 metric tons a year |
Automation moves from warehouses into baking lines
- Automated warehousing at the Truganina hub uses robotic cranes and more than 500 meters of conveyors, which helps Mondelez International ship temperature-sensitive stock at volume.
- AI-assisted wafer baking at Campbellfield aims to give KitKat a more consistent snap, while greater automation at the plant reduces manual handling and waste.
- Panning, enrobing and molding lines account for A$30 million of the Haigh's Chocolates plant investment, which lets a premium maker scale without giving up complex shapes.
- Portion-pack equipment and modern wrapping machines matter as packs shrink, and an A$8 million packaging upgrade at Scoresby in June 2026 shows Mondelez International applying this across confectionery.
- Cocoa processing upgrades at Ballarat targeted raw cocoa, the stage that yields cocoa liquor, and Mars Wrigley committed A$25.5 million to that work and bite-size capacity in September 2022.
Need a Custom Version of This Report?
Tailor the scope, geography, or segments to your exact requirements.
- Custom geography or segment scope
- Direct access to our analyst team
Local plants and retail reach separate the main rivals
Competition divides into multinational brands with Australian plants, premium specialists with their own stores, and importers building supermarket reach. Mondelez International holds the strongest position, because Cadbury remains the leading local brand and its Australian sites make over 90% of the products Cadbury sells there, according to Food Processing in March 2021. Mars Wrigley and Nestlé defend bite-size and wafer formats from Ballarat and Campbellfield, while Ferrero pairs its Lithgow plant with Rocher and Kinder ranges. Lindt & Sprüngli combines premium ranges with branded shops and cafes, and Whittaker's is widening Australian distribution from New Zealand. Haigh's Chocolates and Koko Black compete through stores, gifting and online sales, whereas Darrell Lea leans on gift boxes and Pana Organic on organic, vegan and gluten-free positioning. Rivalry now centers on pack price, flavor launches and control of cold logistics.
Companies profiled and their roles in this market
| Company | Type | Role in the market |
|---|---|---|
| Mondelez International | Multinational manufacturer | Cadbury blocks made in Tasmania and Victoria; Truganina hub opened July 2025 |
| Mars | Multinational manufacturer | Mars Wrigley makes M&M's and Maltesers at Ballarat, Victoria |
| Nestlé | Multinational manufacturer | KitKat made at Campbellfield after an A$30 million upgrade announced January 2025 |
| Ferrero | Multinational manufacturer | Lithgow plant, Kemps Creek cold warehouse, Rocher and Kinder ranges |
| Lindt & Sprüngli | Premium brand and retailer | Branded shops and cafes; Easter prices rose by as much as a third in 2026 |
| Haigh's Chocolates | Premium specialist | Salisbury South plant opened September 2025; 22 stores in September 2025, first Brisbane store in 2026 |
| Whittaker's | Premium brand | New Zealand brand with a limited-edition block in Woolworths stores, May 2026 |
| Darrell Lea | Local manufacturer | Ingleburn factory can pack up to 42,000 gift boxes a day |
| Koko Black | Artisan retailer | Acquired Chocolatier Australia in April 2025; store rollout planned for fiscal 2026 |
| Pana Organic | Organic specialist | Melbourne-made bars stocked in Coles and Woolworths |
Mix and gifting, not volume, will carry value growth
Credence Research's view is that value growth to 2035 will come from mix, gifting and population rather than from heavier eating. Official intake figures have fallen from their 2022-23 peak, yet the 2025 plant and warehouse openings show that makers expect buyers to pay more for better products. The main test is whether cocoa relief reaches shelves in the coming seasons. If large brands keep the margin instead of restoring packs, shoppers will keep comparing unit prices, and federal pack-size rules could harden. The brands best placed are those with local plants, a credible filled range and direct digital access to gift buyers.
How the Australian estimates were built
The report uses 2025 as the base year, 2026 as the first forecast year and 2035 as the final year. Market values come from the Credence Research model, and segment and regional splits are Credence Research estimates. Sources are official statistics from the Australian Bureau of Statistics and Tourism Research Australia, World Bank commodity notes, company and trade-press announcements, retail association forecasts and consumer-group price checks, all opened during this update. Segment shares are analytical judgments based on these inputs and were not obtained from interviews or surveys.
Filled ranges and online orders gain share to 2035
Through 2035, the market should add value steadily as population growth, gift spending and premium mix offset soft intake per person. E-Commerce and Filled Chocolate gain the most share, helped by delivery networks and flavor-led launches. The World Bank expected cocoa prices to stabilize in 2027 after falling more than 50% in 2026, which gives makers room to restore packs and fund promotions on core blocks. The Australia chocolate market reaches USD 3.02 billion by 2035, with Queensland and Western Australia extending its lead if store networks follow population growth into Brisbane and Perth.
Frequently Asked Questions
How big is the Australia chocolate market?
Which product type leads the market?
Which product type grows fastest?
Which region holds the largest share?
How have cocoa costs affected Australian chocolate prices?
Which channel sells the most chocolate?
Who are the main companies in the market?
What is the biggest challenge for the market?
Table of Content
Chapter 1 Market Segmentation
- 1.1 Segmentation Framework
- 1.1.1 Product and Service Classification
- 1.1.2 Application and End-Use Classification
- 1.1.3 Technology and Solution Classification
- 1.1.4 Customer and Distribution Channel Classification
- 1.1.5 Geographic Segmentation
- 1.1.6 Market Segment Definitions and Boundaries
- 1.2 By Product Type
- 1.2.1 Milk Chocolate
- 1.2.2 Filled Chocolate
- 1.2.3 Dark Chocolate
- 1.2.4 White Chocolate
- 1.3 By Price Tier
- 1.3.1 Everyday
- 1.3.2 Mainstream Premium
- 1.3.3 Luxury Artisan
- 1.4 By Purchase Occasion
- 1.4.1 Routine Consumption
- 1.4.2 Seasonal Celebrations
- 1.4.3 Personal Gifting
- 1.4.4 Business Gifting
Chapter 2 Introduction
- 2.1 Report Objectives and Scope
- 2.2 Product Definition and Industry Terminology
- 2.3 Market Inclusions and Exclusions
- 2.4 Research Process
- 2.4.1 Primary Research and Expert Interviews
- 2.4.2 Secondary Research and Source Review
- 2.4.3 Top-Down and Bottom-Up Estimation
- 2.4.4 Data Triangulation and Verification
- 2.5 Market Size Measurement Basis
- 2.5.1 2025: USD 2.01 billion → 2035: USD 3.02 billion
- 2.6 Historical and Forecast Reference Periods
- 2.6.1 Historical Period: 2018-2025
- 2.6.2 Base Year: 2025
- 2.6.3 Forecast Period: 2025-2035
- 2.7 Research Assumptions and Limitations
Chapter 3 Executive Summary
- 3.1 Market Snapshot and Key Findings
- 3.2 Base-Year Market Size, 2025
- 3.3 Forecast Market Size, 2035
- 3.4 Revenue and Volume Growth Outlook
- 3.5 Key Demand and Supply Indicators
- 3.6 Leading Market Segments
- 3.7 Fastest-Growing Market Opportunities
- 3.8 Regional Performance Highlights
- 3.9 Technology and Industry Transformation
- 3.10 Competitive Landscape Summary
- 3.11 Analyst View and Strategic Implications
Chapter 4 Australia Chocolate Market Trends and Developments
- 4.1 Historical Industry Development, 2018-2025
- 4.2 Recent Market Trends and Developments
- 4.3 Demand and Customer Behavior Trends
- 4.4 Technology and Product Innovation
- 4.5 Artificial Intelligence, Automation and Digitalization
- 4.6 Local Manufacturing and Supply Chain Realignment
- 4.7 Industry Partnerships, Mergers and Acquisitions
- 4.8 Sustainability and Circular Economy Developments
- 4.9 Government and Private Sector Investment Trends
- 4.10 Emerging Business Models and Commercialization
- 4.11 Industry Developments and Announcements
Chapter 5 Australia Chocolate Market Production, Supply and Demand Analysis
- 5.1 Demand Trend and Consumption Analysis, 2018-2025
- 5.2 Demand Forecast, 2025-2035
- 5.3 Production and Output Trend, 2018-2025
- 5.4 Production and Output Forecast, 2025-2035
- 5.5 Installed Capacity and Capacity Utilization
- 5.6 Company-Wise Production Plants and Statistics
- 5.6.1 Installed Production Capacity
- 5.6.2 Actual Production
- 5.6.3 Planned Capacity and Expansion Targets
- 5.7 Supply Chain Structure and Procurement Trends
- 5.8 Supply-Demand Gap and Bottlenecks
- 5.9 Import Dependence and Sourcing Structure
- 5.10 Contract Manufacturing and Outsourcing
- 5.11 Regional Supply and Demand Concentration
Chapter 6 Australia Chocolate Market Pricing Analysis
- 6.1 Pricing Structure and Measurement
- 6.2 Historical Pricing Trends, 2018-2025
- 6.3 Pricing Outlook, 2025-2035
- 6.4 Average Selling Price and Unit Economics
- 6.5 Pricing by Product and Market Segment
- 6.6 Geographic Pricing Differences
- 6.7 Key Input, Energy, Labor and Logistics Costs
- 6.8 Contract Pricing and Purchasing Models
- 6.9 Pricing Sensitivity and Competitive Positioning
- 6.10 Price, Margin and Profitability Implications
Chapter 7 Australia Chocolate Market Dynamics
- 7.1 Market Growth Drivers
- 7.1.1 Demand-Side Drivers
- 7.1.2 Technology and Innovation Drivers
- 7.1.3 Infrastructure and Investment Drivers
- 7.1.4 Regulatory and Policy Drivers
- 7.2 Market Restraints
- 7.2.1 Cost and Affordability Constraints
- 7.2.2 Technology and Adoption Barriers
- 7.2.3 Supply Chain and Operational Constraints
- 7.3 Market Challenges
- 7.3.1 Competitive Pressure and Margin Erosion
- 7.3.2 Skills, Infrastructure and Implementation Gaps
- 7.4 Emerging Market Opportunities
- 7.5 Market Dynamics Impact and Time-Horizon Assessment
Chapter 8 Australia Chocolate Value Chain Analysis
- 8.1 Industry Value Chain Overview
- 8.2 Upstream Suppliers and Critical Inputs
- 8.3 Technology and Component Providers
- 8.4 Manufacturing or Service Delivery
- 8.5 Distribution, Channel Partners and Integrators
- 8.6 Downstream Applications and End Users
- 8.7 Value Addition and Profit Pools
- 8.8 Vertical Integration and Outsourcing
- 8.9 Supplier Concentration and Risk
- 8.10 Supply Chain Localization and Resilience
Chapter 9 Australia Chocolate Market Regulations and Policies
- 9.1 Relevant Laws, Standards and Compliance Frameworks
- 9.2 Product, Service, Safety and Quality Requirements
- 9.3 Government Policies, Incentives and Subsidies
- 9.4 Imports, Exports and Trade Barriers
- 9.5 Public Procurement and Local Content Requirements
- 9.6 Environmental and Sustainability Compliance
- 9.7 Upcoming Policy Changes and Market Implications
Chapter 10 Australia Chocolate Market Hotspots and Opportunities
- 10.1 Market Opportunity Mapping and Growth Hotspots
- 10.2 High-Growth Applications and Customer Groups
- 10.3 Underserved Markets and White-Space Opportunities
- 10.4 Emerging Technology and Product Opportunities
- 10.5 New Capacity and Investment Hotspots
- 10.6 Market Entry and Expansion Opportunities
- 10.7 Distribution and Partnership Opportunities
- 10.8 Near-Term and Long-Term Commercial Potential
- 10.9 Opportunity Attractiveness and Execution Risks
Chapter 11 Australia Chocolate Market Outlook, 2025-2035
- 11.1 Market Size and Analysis
- 11.1.1 Revenue (Market Measurement: 2025: USD 2.01 billion → 2035: USD 3.02 billion)
- 11.1.2 Market Volume and Quantity Sold
- 11.1.3 Historical Market Size, 2018-2025
- 11.1.4 Base-Year Market Size, 2025
- 11.2 Market Forecast, 2025-2035
- 11.2.1 Revenue Forecast to 2035
- 11.2.2 Volume Forecast to 2035
- 11.2.3 CAGR and Year-on-Year Growth
- 11.2.4 Incremental Revenue Opportunity
- 11.3 Forecast Assumptions and Scenario Analysis
- 11.3.1 Base-Case Forecast
- 11.3.2 Optimistic and Conservative Scenarios
- 11.3.3 Technology, Pricing and Policy Sensitivities
- 11.4 Market Attractiveness and Growth Outlook
Chapter 12 Australia Chocolate Market Segmentation and Outlook
- 12.1 Segmentation Summary and Market Shares, 2025
- 12.2 Largest and Fastest-Growing Segments
- 12.3 By Product Type - Market Size and Forecast, 2025-2035
- 12.3.1 Segment Definition and Scope
- 12.3.2 Historical Market Size, 2018-2025
- 12.3.3 Revenue Forecast, 2025-2035
- 12.3.4 Volume Forecast, 2025-2035
- 12.3.5 Base-Year Market Share, 2025
- 12.3.6 Segment CAGR and Growth Drivers
- 12.3.7 Subsegment Market Size and Forecast
- 12.3.7.1 Milk Chocolate
- 12.3.7.2 Filled Chocolate
- 12.3.7.3 Dark Chocolate
- 12.3.7.4 White Chocolate
- 12.3.8 Subsegment Pricing and Adoption Trends
- 12.3.9 Leading Suppliers and Competition
- 12.3.10 Regional Demand and Opportunities
- 12.4 By Price Tier - Market Size and Forecast, 2025-2035
- 12.4.1 Segment Definition and Scope
- 12.4.2 Historical Market Size, 2018-2025
- 12.4.3 Revenue Forecast, 2025-2035
- 12.4.4 Volume Forecast, 2025-2035
- 12.4.5 Base-Year Market Share, 2025
- 12.4.6 Segment CAGR and Growth Drivers
- 12.4.7 Subsegment Market Size and Forecast
- 12.4.7.1 Everyday
- 12.4.7.2 Mainstream Premium
- 12.4.7.3 Luxury Artisan
- 12.4.8 Subsegment Pricing and Adoption Trends
- 12.4.9 Leading Suppliers and Competition
- 12.4.10 Regional Demand and Opportunities
- 12.5 By Purchase Occasion - Market Size and Forecast, 2025-2035
- 12.5.1 Segment Definition and Scope
- 12.5.2 Historical Market Size, 2018-2025
- 12.5.3 Revenue Forecast, 2025-2035
- 12.5.4 Volume Forecast, 2025-2035
- 12.5.5 Base-Year Market Share, 2025
- 12.5.6 Segment CAGR and Growth Drivers
- 12.5.7 Subsegment Market Size and Forecast
- 12.5.7.1 Routine Consumption
- 12.5.7.2 Seasonal Celebrations
- 12.5.7.3 Personal Gifting
- 12.5.7.4 Business Gifting
- 12.5.8 Subsegment Pricing and Adoption Trends
- 12.5.9 Leading Suppliers and Competition
- 12.5.10 Regional Demand and Opportunities
- 12.6 Segment Growth Comparison
- 12.7 Segment Attractiveness and Priority Matrix
Chapter 13 Australia Chocolate Geographic Market Outlook, 2025-2035
- 13.1 Domestic Market Distribution and Demand Clusters
- 13.2 State- or Province-Wise Market Size and Forecast, 2025-2035
- 13.3 City and Metropolitan Market Outlook
- 13.4 Industrial, Manufacturing and Commercial Clusters
- 13.5 Geographic Concentration of Key End Users
- 13.6 Local Pricing and Purchasing Differences
- 13.7 Domestic Production Facilities and Capacity Map
- 13.8 Local Infrastructure and Project Pipeline
- 13.9 State-Level Policy and Incentive Differences
- 13.10 Subnational Investment Hotspots and Opportunities
- 13.11 Distribution and Logistics Networks
- 13.12 Domestic Competitive Footprint
Chapter 14 Australia Chocolate Technology, Innovation and Sustainability Outlook
- 14.1 Technology Landscape and Maturity
- 14.2 Product, Process and Service Innovation
- 14.3 AI, Automation and Digital Tools in the Industry
- 14.4 Technology Adoption and Performance Benchmarking
- 14.5 Innovation Pipeline and R&D Investment
- 14.6 Patent and Intellectual Property Trends
- 14.7 Energy Efficiency and Resource Management
- 14.8 Sustainability, Recycling and Circularity
- 14.9 Technology Roadmap, 2025-2035
- 14.10 Risks of Obsolescence and Technology Substitution
Chapter 15 Australia Chocolate Market Key Strategic Imperatives
- 15.1 Growth and Market Entry Priorities
- 15.2 High-Return Products and Segments
- 15.3 Pricing, Profitability and Cost Optimization
- 15.4 Technology Investment and Product Differentiation
- 15.5 Supply Chain Localization and Resilience
- 15.6 Distribution and Customer Acquisition
- 15.7 Partnership, Acquisition and Capacity Strategy
- 15.8 Regional Expansion Priorities
- 15.9 Short-, Medium- and Long-Term Actions
Chapter 16 Competition Outlook
- 16.1 Industry Competition Characteristics
- 16.2 Market Structure and Concentration
- 16.3 Market Share and Competitive Positioning, 2025
- 16.4 Company-Wise Revenue and Product Benchmarking
- 16.5 Production and Service Capacity Benchmarking
- 16.6 Technology, Pricing and Differentiation
- 16.7 Regional Footprint and Distribution Strength
- 16.8 Mergers, Acquisitions and Strategic Alliances
- 16.9 New Entrants and Competitive Threats
- 16.10 Porter's Five Forces and Industry Attractiveness
- 16.11 Competitive Outlook, 2025-2035
Chapter 17 Company Profiles
- 17.1 Company Coverage and Selection Criteria
- 17.2 Mondelez International
- 17.2.1 Business Description
- 17.2.2 Company Ownership and Geographic Presence
- 17.2.3 Product and Service Portfolio
- 17.2.4 Manufacturing and Operating Footprint
- 17.2.5 Production Capacity and Expansion Plans
- 17.2.6 Financial Performance and Investment
- 17.2.7 Market Share and Competitive Position
- 17.2.8 Technology and Innovation Capabilities
- 17.2.9 Strategic Alliances or Partnerships
- 17.2.10 Recent Developments
- 17.2.11 Growth Strategy and Outlook
- 17.3 Mars
- 17.4 Nestlé
- 17.5 Ferrero
- 17.6 Lindt & Sprüngli
- 17.7 Haigh's Chocolates
- 17.8 Whittaker's
- 17.9 Darrell Lea
- 17.10 Koko Black
- 17.11 Pana Organic
- 17.12 Other Relevant Market Participants
Note: Every listed company is profiled on the structure shown under the first company. The company list is preliminary and may change based on research findings, market developments, data availability and client requirements.
Chapter 18 Disclaimer
- 18.1 Research and Forecast Disclaimer
- 18.2 Data Source and Estimation Limitations
Note: The depth of individual sections depends on data availability for this market. Volume, capacity, trade and other unit-based metrics are included where applicable.

