
Metro top-ups still define Indian e-grocery demand
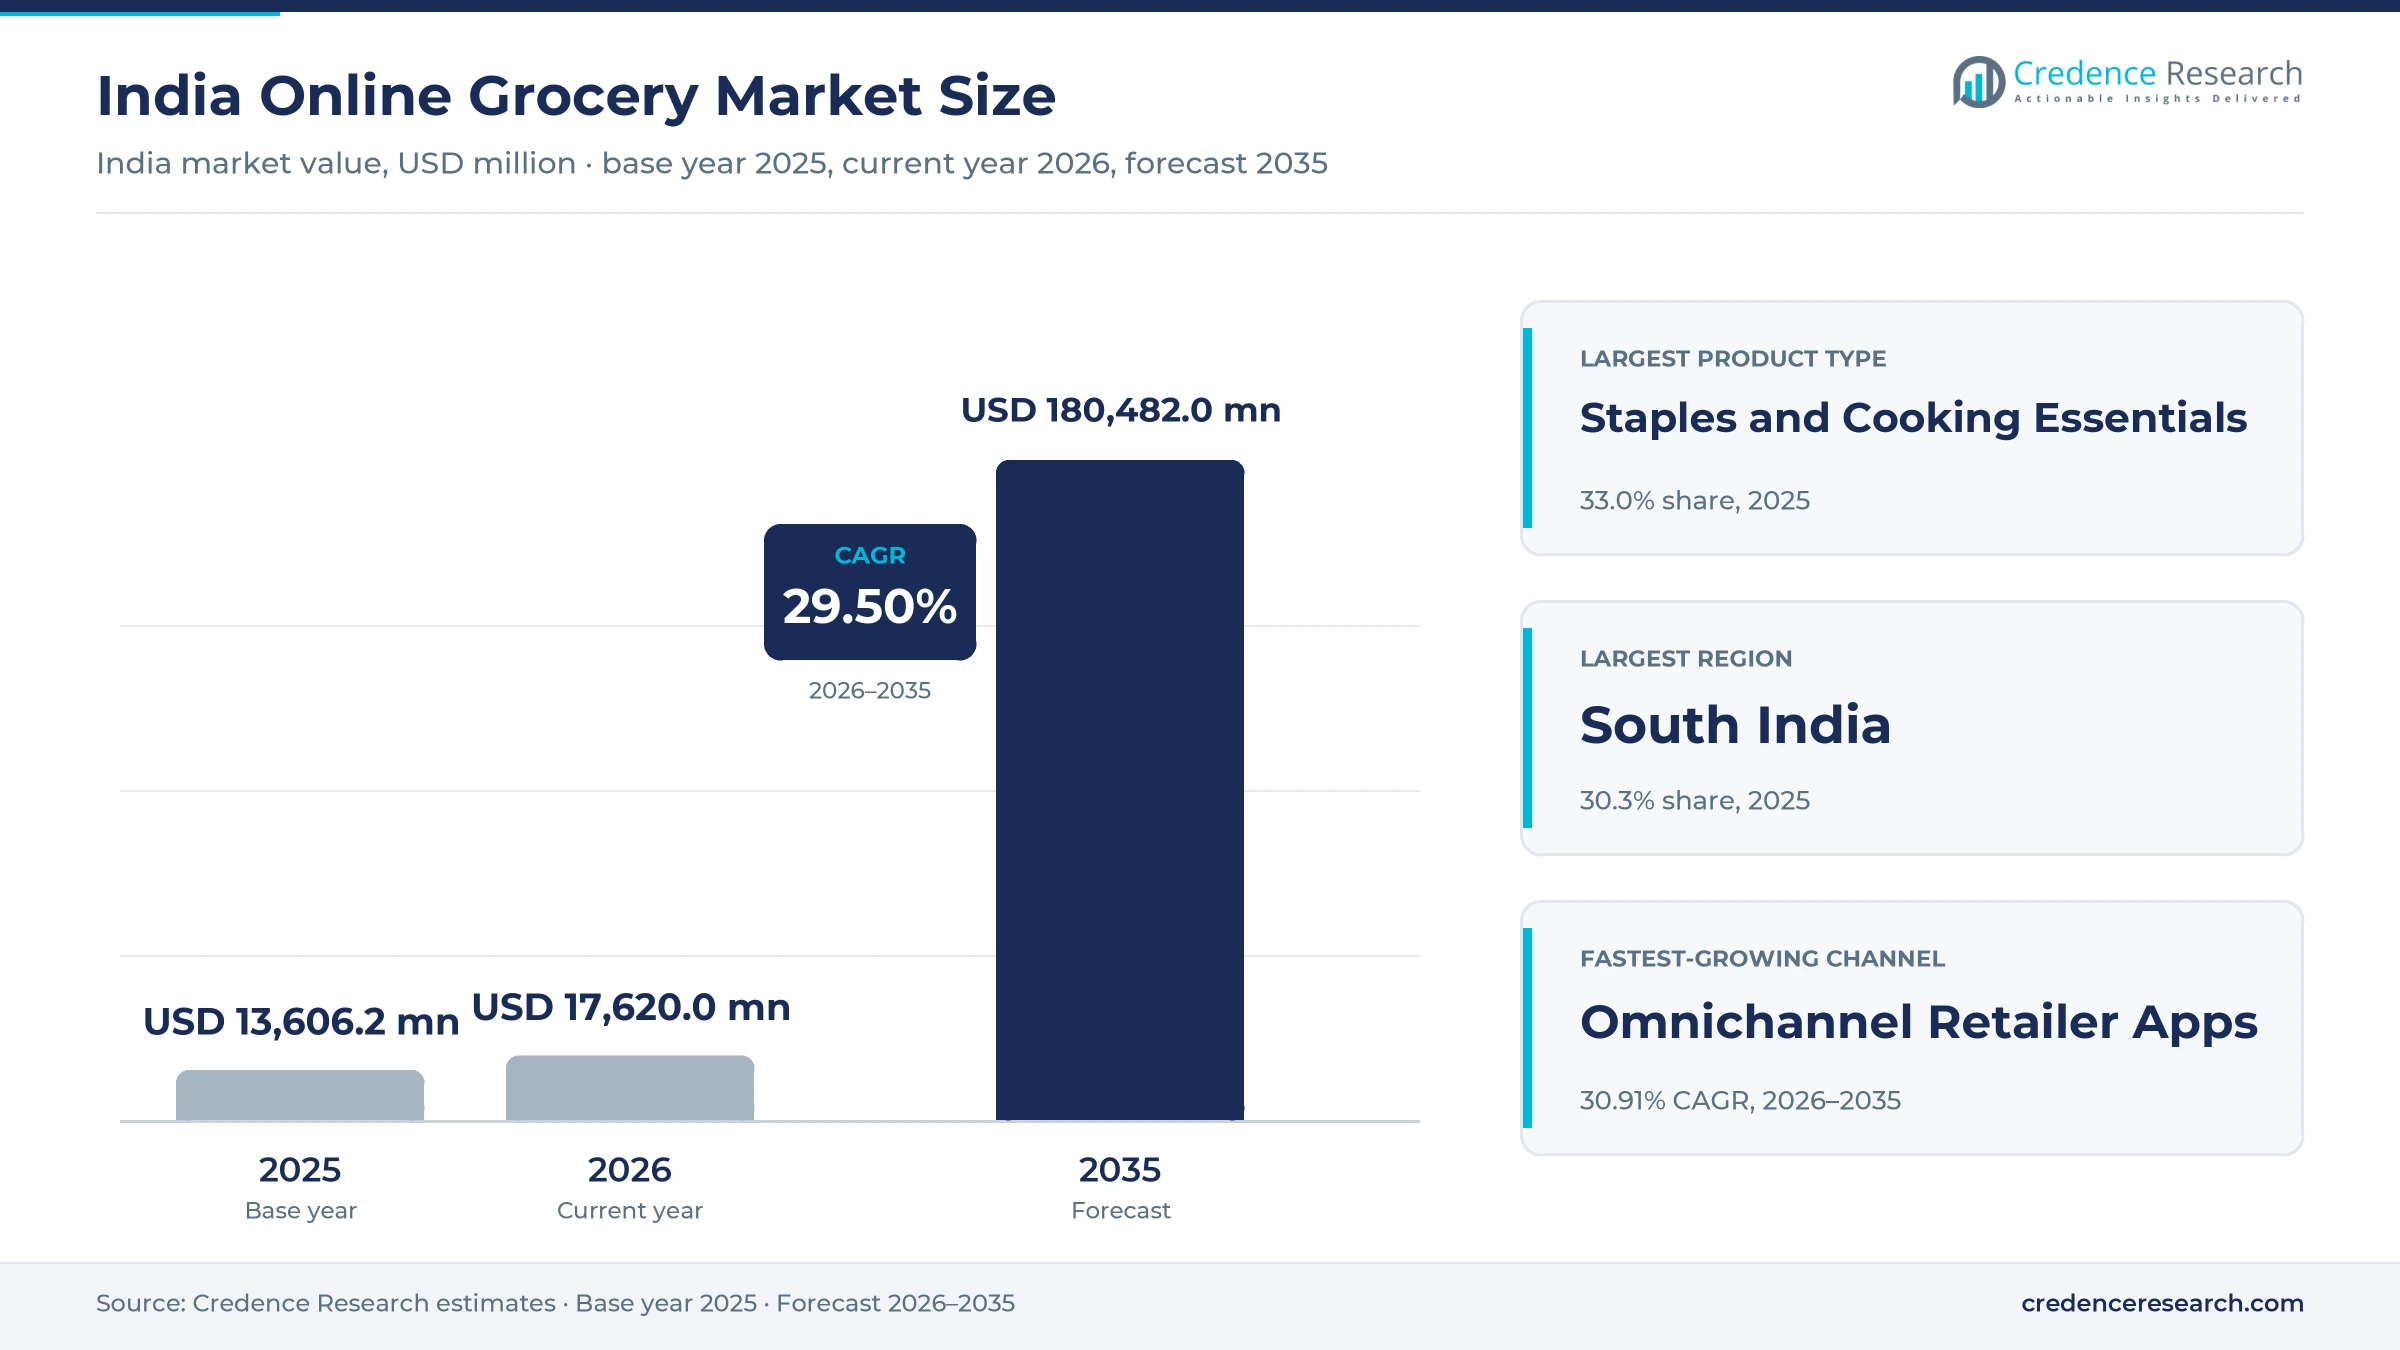
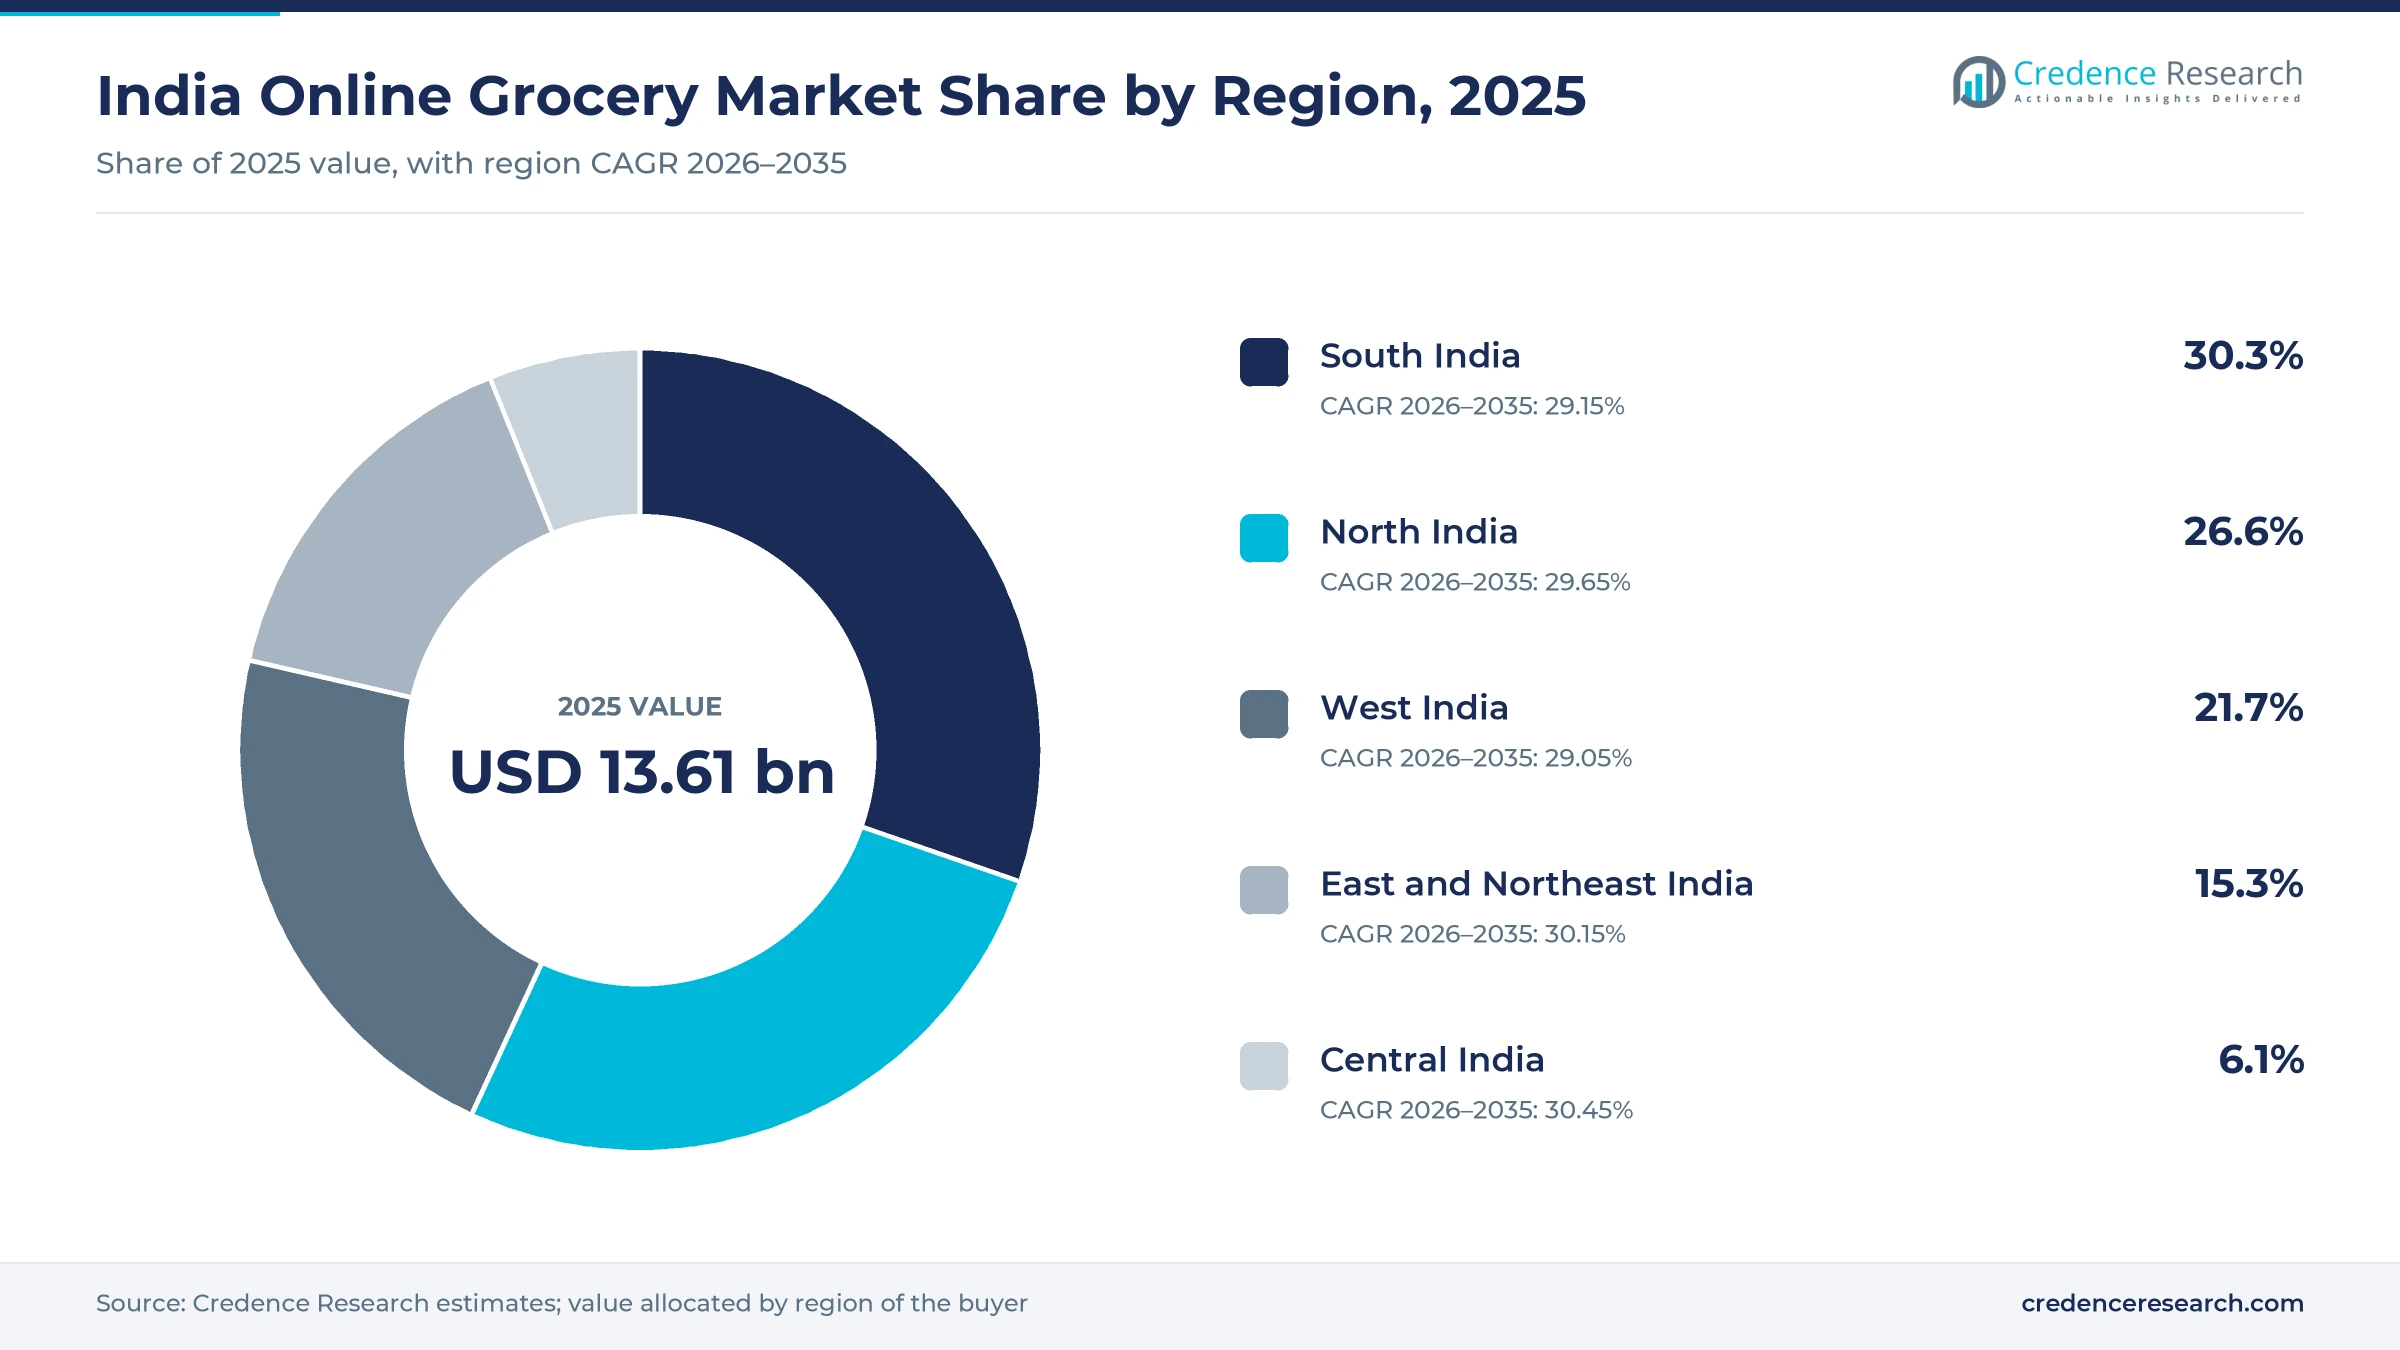
The India online grocery market was valued at USD 13.61 billion in 2025 and is projected to increase from USD 17.62 billion in 2026 to USD 180.48 billion by 2035, registering a CAGR of 29.50% during 2026–2035. Demand comes from households that use apps for frequent small baskets of staples, dairy, snacks and home essentials, with the top eight metros still producing most quick delivery orders. South India held the largest regional share, 30.3% in 2025, helped by high urban household spending in Telangana, Tamil Nadu and Karnataka. Central India is the fastest-growing region at 30.45% a year, although it starts from the smallest base. Dark store networks expanded sharply through 2026, and the labor ministry pressed platforms to drop 10-minute delivery branding in January 2026. Food safety notices and new social security contributions now add cost, which makes store density and order frequency the main competitive measures.
What does the online grocery market in India include?
The market covers food, dairy, staples and household essentials that Indian households order through quick delivery apps, scheduled grocery platforms, marketplace stores, retailer apps and subscription services. Value is measured at the consumer level, and buyers usually pay through UPI, cards or wallets at checkout.
Restaurant meal delivery is excluded, as are the electronics, apparel and general merchandise lines sold on the same quick delivery apps. The value chain runs from farmers, brands and distributors through collection centers and warehouses to dark stores, retail outlets and delivery riders.
India Online Grocery Market Insights
- The market moves from USD 13.61 billion in 2025 to USD 180.48 billion by 2035, a 29.50% CAGR that assumes penetration rises well beyond today's large metro base.
- South India led with 30.3% of 2025 value, supported by high urban household spending in Telangana, Tamil Nadu and Karnataka, according to national survey data.
- Quick Commerce Apps held 66.0% of 2025 value, reflecting the shift of everyday baskets toward dark store networks across major Indian cities.
- In January 2026, Blinkit dropped its 10-minute promise after the labor minister intervened, which moved competition toward assortment and reliability rather than headline delivery times.
- Store networks remain the main investment, with Blinkit at 2,443 locations in June 2026 and Flipkart Minutes near 1,200 centers by September 2026.
Staples and quick apps anchor the largest spending pools
Why staples lead and packaged food grows fastest
Based on product type, the market is categorized into fresh produce, staples and cooking essentials, dairy and bakery, packaged foods and beverages, and household and personal care. Staples and Cooking Essentials led with 33.0% of 2025 value because the U.S. Department of Agriculture reported in July 2025 that 15% to 20% of Indian packaged food and grocery buyers purchased online, well above its range for fresh produce. Packaged Foods and Beverages grow fastest at 30.29% a year as Flipkart Minutes reported in 2026 that gourmet and specialty grocery rose about eightfold on its service.
Quick apps dominate as retailer apps scale fastest
Based on distribution channel, the market is categorized into quick commerce apps, full-basket e-grocery platforms, marketplace grocery stores, omnichannel retailer apps and subscription and D2C platforms. Quick Commerce Apps led with 66.0% of 2025 value because Indian Retailer put quick delivery at about 70% of online grocery GMV in fiscal 2026. Omnichannel Retailer Apps grow fastest at 30.91% a year as Reliance Retail said in April 2026 that its hyperlocal daily orders rose more than fourfold, served through 3,100 stores in 1,200 cities, according to Outlook Business.
Metro professionals lead as younger shoppers join
Based on customer type, the market is categorized into urban professionals, families with children, senior households and students and shared households. Urban Professionals led with 44.0% of 2025 value because the top eight metros produce roughly 70% to 75% of quick delivery GMV, according to Indian Retailer in October 2026. Students and Shared Households grow fastest at 30.55% a year as Flipkart Minutes reported Gen Z customers growing about five times year over year, a pace that exceeds its overall fourfold growth and favors smaller, more frequent baskets.
Daily top-ups lead as festive baskets gain share
Based on purchase occasion, the market is categorized into weekly stock-up, daily top-up, emergency convenience and festival and gifting. Daily Top-up led with 48.0% of 2025 value because Zepto alone averaged 2.33 million orders a day in the March 2026 quarter, according to Outlook Business, while Swiggy Instamart reported a net average order value of Rs 506 in September 2026. Festival and Gifting grows fastest at 30.35% a year as Unicommerce recorded a 120% rise in quick delivery orders during the 25-day Diwali 2025 period.
| Segment Group | Leading Sub-segment | Share, 2025 | Fastest-growing Sub-segment | CAGR, 2026–2035 |
|---|---|---|---|---|
| By Product Type | Staples and Cooking Essentials | 33.0% | Packaged Foods and Beverages | 30.29% |
| By Distribution Channel | Quick Commerce Apps | 66.0% | Omnichannel Retailer Apps | 30.91% |
| By Customer Type | Urban Professionals | 44.0% | Students and Shared Households | 30.55% |
| By Purchase Occasion | Daily Top-up | 48.0% | Festival and Gifting | 30.35% |
Request a Free Sample
Fill in your details and we'll send you a free sample report.
- Sample data tables & charts
- Research methodology
Broadband, dark stores and UPI lift order frequency
Expanding digital shopper and broadband base
A larger connected population gives grocery apps a much wider pool of first-time buyers outside the largest cities. TRAI counted 1,001.50 million broadband subscribers in June 2026 excluding machine connections, and mobile wireless access accounted for 1,021.43 million of the total base including those connections. As a result, grocery ordering no longer depends on fixed lines or desktop shopping habits. Flipkart Minutes reported in September 2026 that its Tier II-plus customers grew about 25 times year over year, according to Indian Retailer. Amazon Now also reached 100 cities by April 2026, as Medianama reported, which gives these new shoppers more than one service to compare. This wider base supports the 30.15% annual growth estimated for East and Northeast India.
Rapid quick-commerce infrastructure expansion
Dark store density determines how many homes can receive a basket within minutes, so network growth directly widens the addressable market. Blinkit reached 2,443 locations after adding 200 net stores in the June 2026 quarter, according to Outlook Business. Swiggy Instamart followed with 1,240 dark stores across 133 cities at the end of September 2026, as Inc42 reported. Inc42 reported in August 2026 that Flipkart Minutes planned 1,500 centers across 180 cities within months. The company reached about 1,200 centers in more than 150 cities in September 2026, which increases supply pressure in the largest metros and raises demand for third-party logistics capacity.
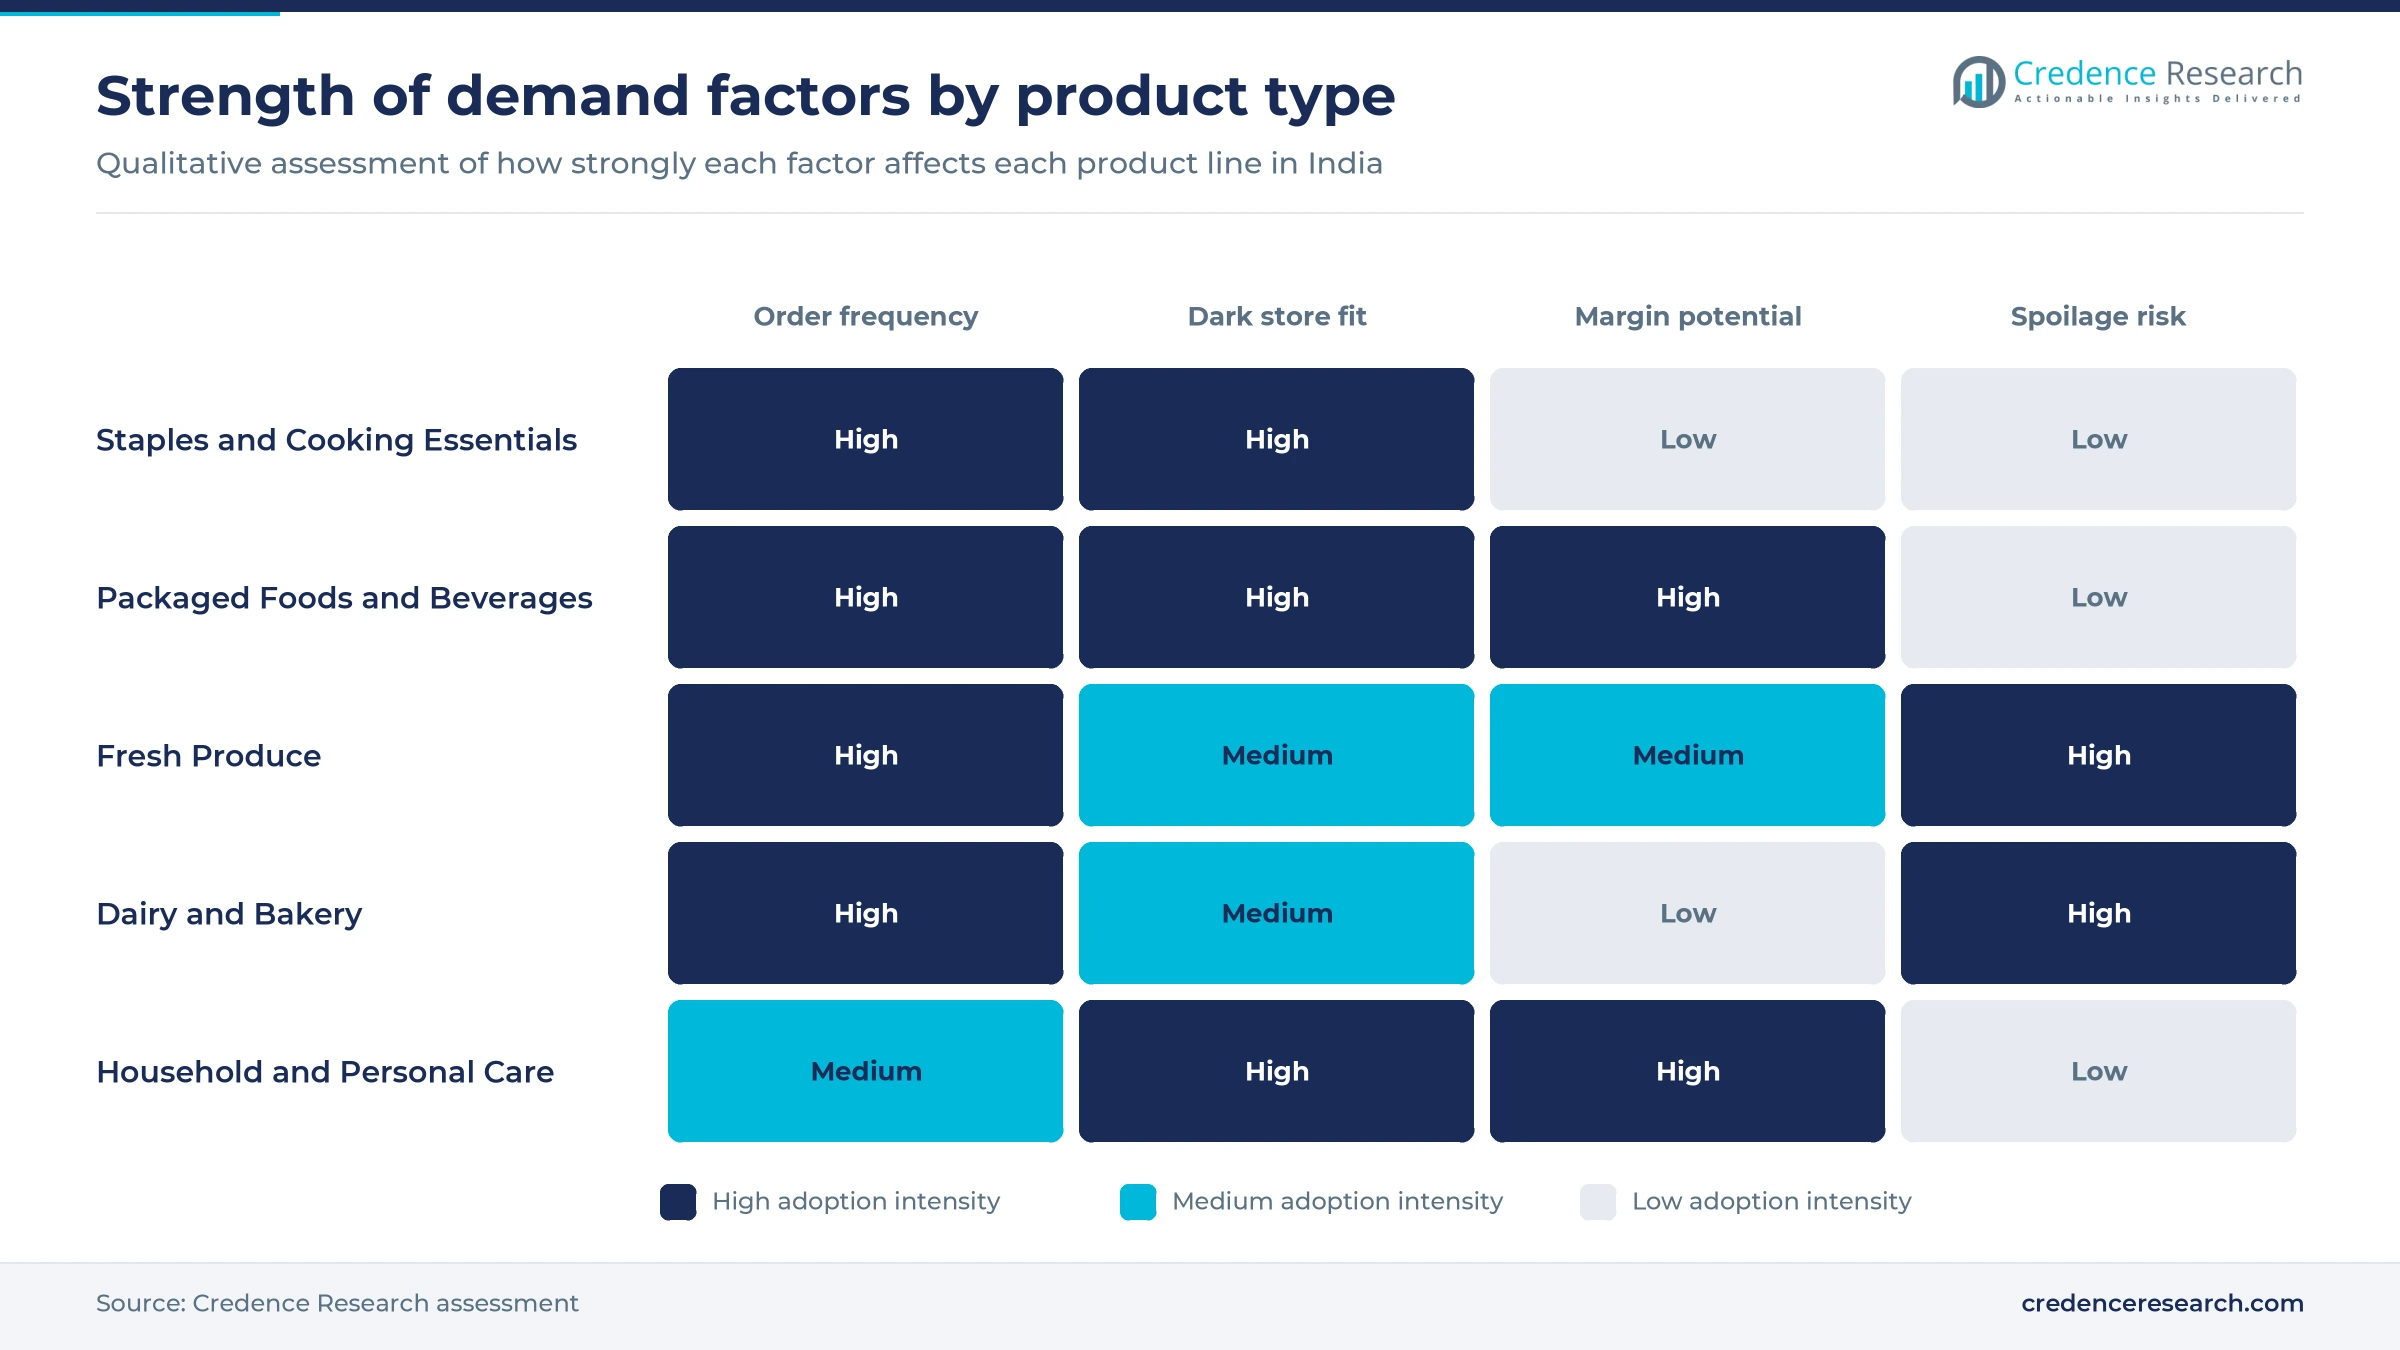
High-frequency essentials and digital payments
Everyday essentials create repeat orders, and instant payment removes much of the friction from buying small baskets several times a week. NPCI data published by PTI in September 2026 showed a record 24.51 billion UPI transactions in August, worth Rs 29.82 lakh crore. This habit of paying through digital payments also reduces the cash handling burden for delivery riders on each small order. Order counts confirm the frequency effect, as Zepto recorded 640 million orders in fiscal 2026 against 332 million a year earlier, according to Outlook Business in June 2026. Daily Top-up therefore holds 48.0% of 2025 value in the Credence Research estimate.
Low penetration leaves wide room in household budgets
Online channels still capture a small part of what Indian households spend on food, which leaves substantial room for growth. The national survey for 2023-24 recorded urban monthly per capita spending of Rs 6,996, with non-food items taking about 60%, which leaves roughly 40% for food. However, the U.S. Department of Agriculture put quick delivery at 5% to 6% of household grocery spending in urban cities in July 2025, which shows how far smaller cities could move if that behavior spreads. Fresh categories have the longest runway ahead, since the same report showed no more than one in 10 fresh produce buyers purchasing online.
Retailer stores and fresh sourcing reshape the supply model
Shift of scheduled grocers toward instant delivery
Scheduled grocery is giving way to instant delivery, even at the platforms that built the earlier model. BigBasket said quick delivery now represents about 85% of its business, up from 30% to 40% before 2025, according to Indian Retailer in October 2026. The company runs about 800 dark stores carrying 20,000 to 25,000 products, which narrows the assortment gap with larger warehouses. Blinkit made the same point in January 2026 when its tagline changed to 30,000-plus products, as PTI reported. Consequently, Quick Commerce Apps hold 66.0% of 2025 value in this report, while full-basket platforms must defend bulk orders and subscription programs. Broader rapid delivery retail models elsewhere face similar assortment decisions.
Rise of store-led hyperlocal delivery by retailers
Large retailers are using existing stores to compete without matching every dedicated dark store site. Reliance Retail reported in April 2026 that JioMart served 1,200 cities through 3,100 stores, according to Outlook Business, which gives it far broader city coverage than most app-only rivals. By contrast, Avenue Supermarts cut DMart Ready from 18 cities to 11 during the June 2026 quarter and described the closed cities as marginal contributors. Its shareholders then approved up to Rs 500 crore for the online unit in August 2026, which shows continued commitment in large metros. Therefore, Omnichannel Retailer Apps grow at 30.91% a year in the Credence Research estimate, though results differ sharply between store-led operators.
Opportunity in chilled, frozen and packaged food lines
Packaged and chilled foods offer brands an opening because quick delivery suits impulse purchases and short shelf life products. The U.S. Department of Agriculture valued online grocery at USD 8.8 billion in 2024 in its July 2025 report, which gives brands a sizable channel for chilled and frozen launches. Flipkart Minutes then moved into premium grocery with its Pykd private label, which Inc42 reported in August 2026 would pilot in Bengaluru with cheese, coffee, kombucha, ramen and ghee. Pet food on Flipkart Minutes also rose about fivefold in 2026, which suggests pet food and premium items can lift basket values. Brands in ready-to-eat meals can therefore use platform data to launch regional flavors faster than general trade allows.
Opportunity in direct sourcing of fresh produce
Fresh produce is the clearest unmet opportunity because shoppers still buy most of it offline. A July 2025 report from the U.S. Department of Agriculture showed fresh produce lagging well behind packaged goods in online purchasing. Zepto announced in June 2025 that daily fresh units rose from 640,000 to 2.21 million in 12 months, supported by more than 70 collection centers and packing within 12 hours of harvest. Amazon also announced in April 2026 that its network expansion should let more than 16,000 farmers sell produce directly, according to Medianama. Platforms that reduce spoilage can therefore win repeat baskets, while Packaged Foods and Beverages remains the fastest product line at 30.29% a year.
Food safety, labor rules and kirana disputes raise costs
Food safety scrutiny reaches dark stores
Dark stores handle perishable goods at speed, and regulators have responded with closer scrutiny. FSSAI met more than 70 e-commerce representatives in July 2025 and required warehouse listings and handler training, according to Medianama. A July 2026 Barristery note reported nine FSSAI notices to Swiggy Instamart dated July 11 over expired or spoiled items. Platforms and food brands therefore carry higher audit, inventory rotation and refund costs, and those with weaker controls risk losing shopper trust.
Kirana disputes and predatory pricing claims
Traditional retailers argue that deep discounts distort local competition, which keeps legal risk on the table for large apps. The All India Consumer Products Distributors Federation claims more than 200,000 kirana stores have closed since 2023, and in March 2025 it sought price floors of 10% for fast-moving goods. The Competition Commission asked for more evidence before opening any formal inquiry. A ruling against platforms could limit discounts, which would shift competition toward assortment, service and store-level cost control.
Labor codes raise the cost of delivery
Rider economics are moving from an informal cost to a regulated one. The labor codes enforced in November 2025 require aggregators to contribute about 1% to 2% of annual turnover to worker welfare, capped at 5% of worker payments, according to Outlook Business. Gig workers also staged a nationwide strike on New Year's Eve 2025, as PTI reported. Consequently, platforms face higher unit costs and tighter delivery promises, and they increasingly respond with denser networks and shorter rider trips.
Metro concentration limits profitable expansion
Growth outside large cities remains commercially unproven, which complicates national expansion plans. Indian Retailer reported in October 2026 that the top eight metros still produce most quick delivery GMV, and Avenue Supermarts left seven smaller DMart Ready cities in the June 2026 quarter. Swiggy Instamart also reported a contribution margin of minus 1% of order value in September 2026, according to Inc42. Smaller cities therefore need larger baskets or lower delivery costs before dedicated stores earn adequate returns.
South India leads while Central India grows from a low base
| Region | Value, 2025 (USD billion) | Share, 2025 | CAGR, 2026–2035 |
|---|---|---|---|
| South India | 4.12 | 30.3% | 29.15% |
| North India | 3.62 | 26.6% | 29.65% |
| West India | 2.95 | 21.7% | 29.05% |
| East and Northeast India | 2.08 | 15.3% | 30.15% |
| Central India | 0.83 | 6.1% | 30.45% |
South India leads on urban household spending
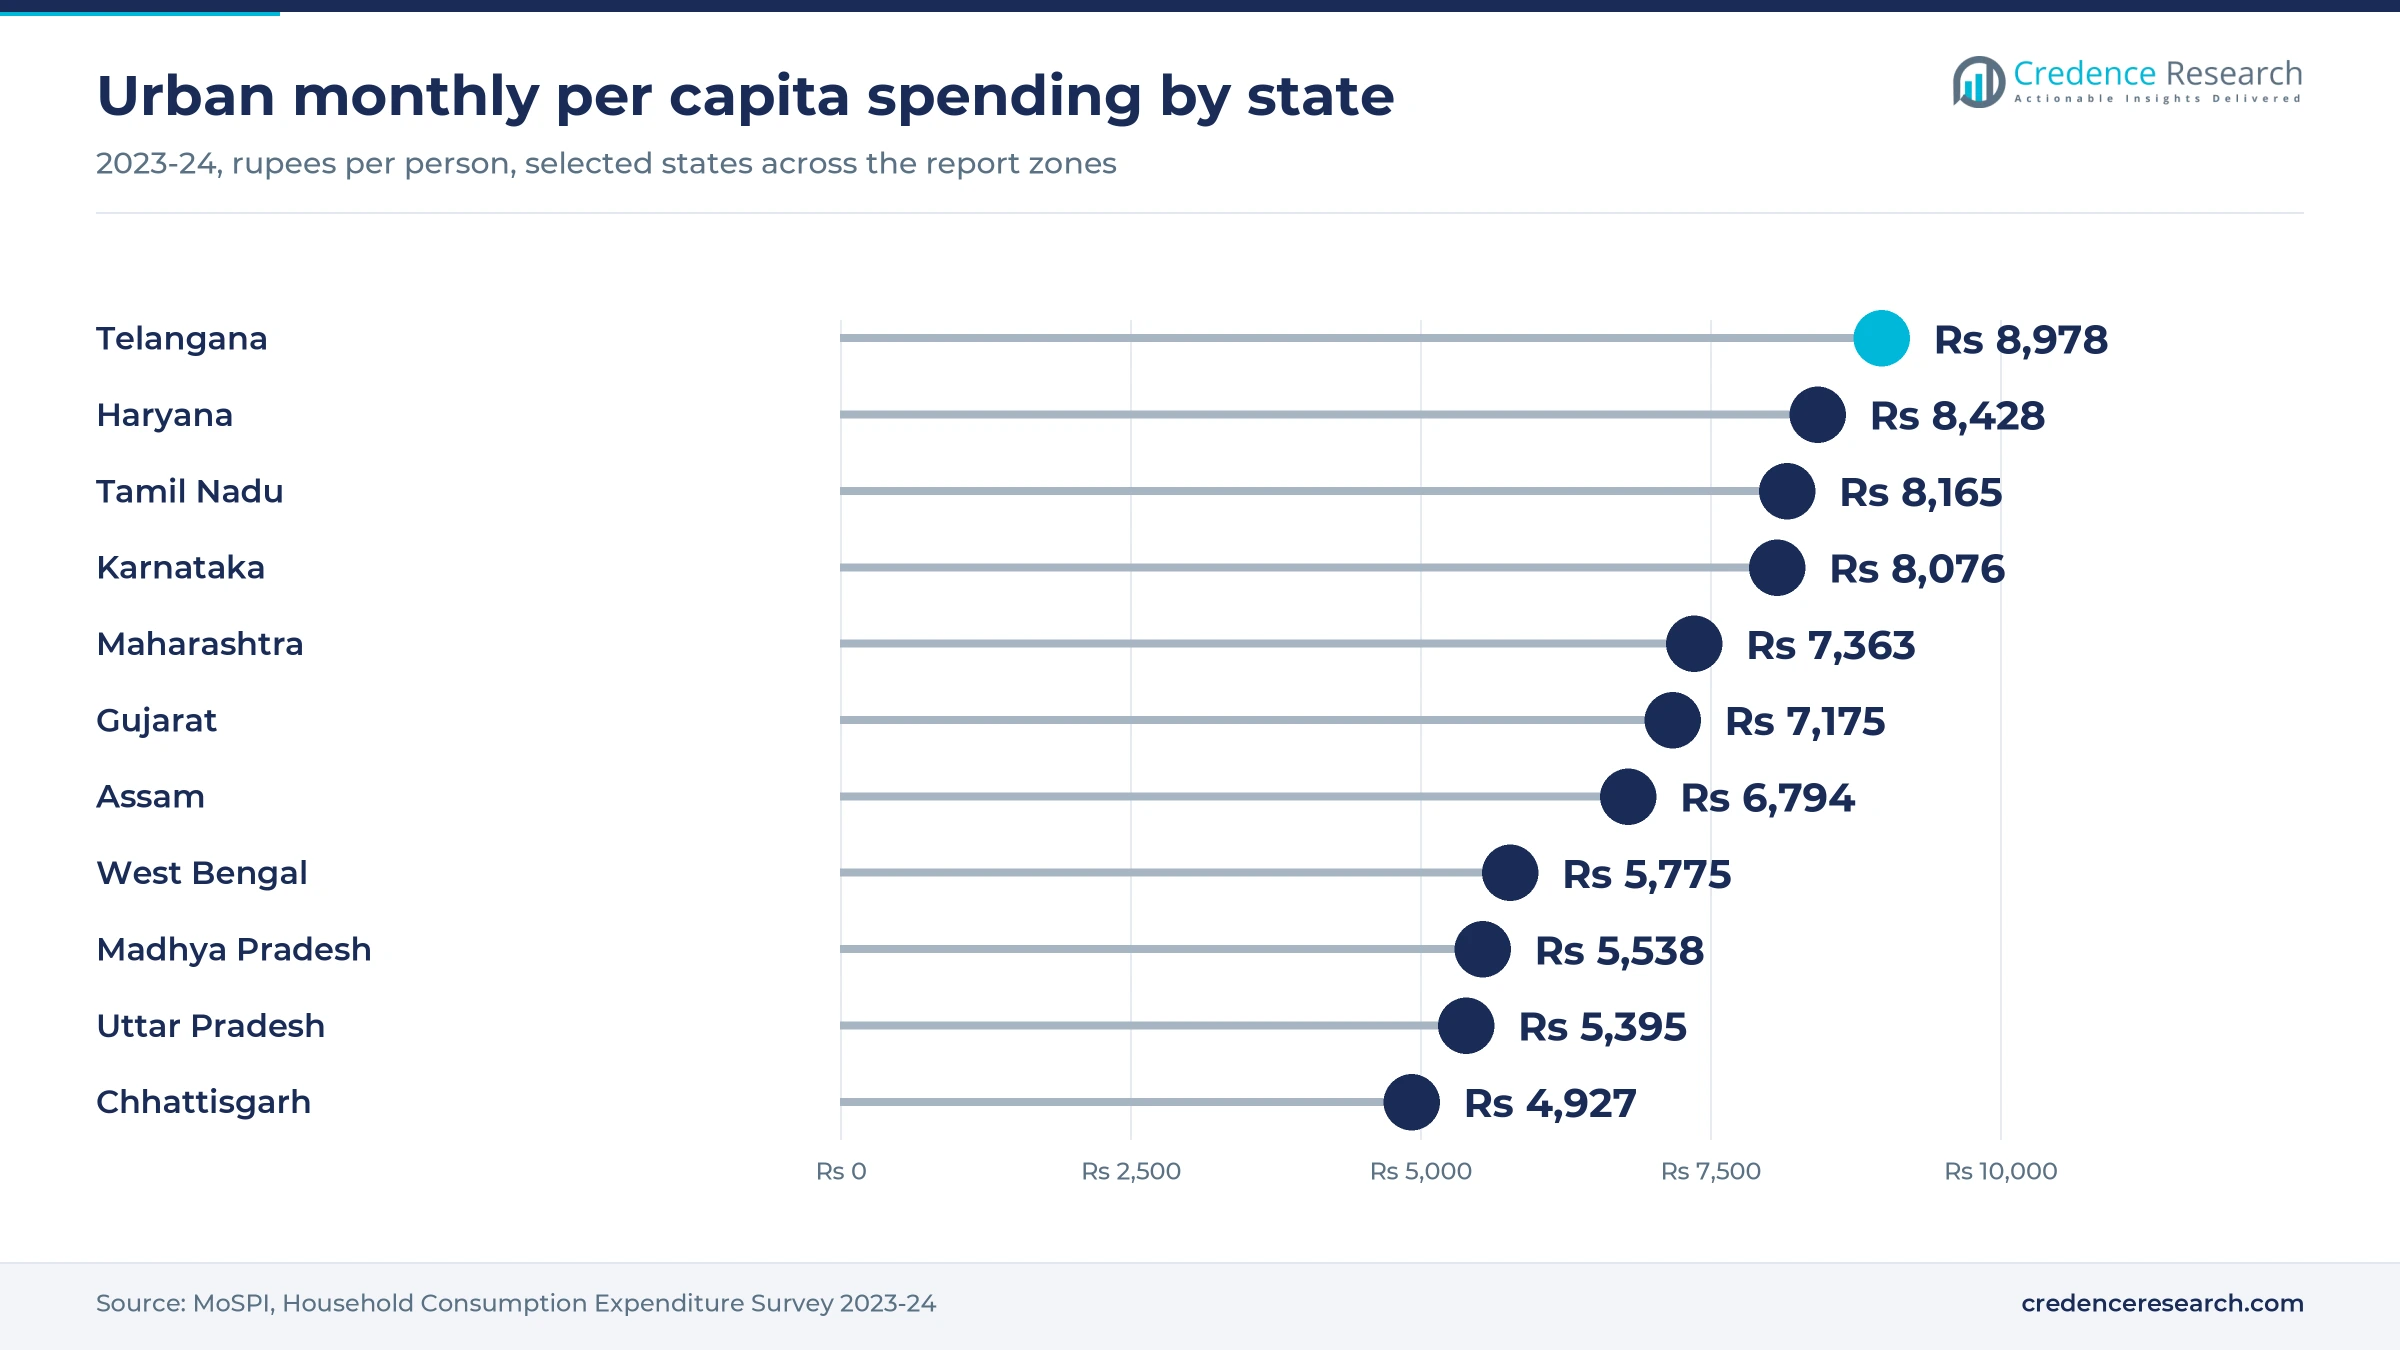
South India held 30.3% of 2025 value and grows at 29.15% a year, the largest regional position in this report. Urban monthly per capita spending reached Rs 8,978 in Telangana, Rs 8,165 in Tamil Nadu and Rs 8,076 in Karnataka in the 2023-24 national survey, all well above the Rs 6,996 national urban average. Flipkart Minutes also named Salem and Tiruppur among its strong smaller-city markets in 2026, which suggests that demand now extends beyond Bengaluru, Hyderabad and Chennai.
North India pairs affluent metros with smaller cities
North India held 26.6% of 2025 value and grows at 29.65% a year, with wide income differences across the zone. Urban monthly per capita spending reached Rs 8,428 in Haryana but only Rs 5,395 in Uttar Pradesh in the 2023-24 survey, which separates the Delhi region from lower-spending markets. Flipkart Minutes still reported strong growth in Ambala, Barabanki, Kanpur and Roorkee in 2026, while Amazon Now named Lucknow, Kanpur, Chandigarh and Meerut among its cities in April 2026.
West India adjusts as its largest metros mature
West India held 21.7% of 2025 value and grows at 29.05% a year, slightly behind the national rate because its largest metros are already well served. Urban monthly per capita spending reached Rs 7,363 in Maharashtra and Rs 7,175 in Gujarat in the 2023-24 survey. The zone also shows how store-led models are adjusting, since Avenue Supermarts narrowed DMart Ready to 11 cities by June 30, 2026, while Amazon Now named Pune, Ahmedabad and Mumbai among its service cities.
East and Northeast India gains from smaller-city reach
East and Northeast India held 15.3% of 2025 value and grows at 30.15% a year as app networks move past Kolkata. Urban monthly per capita spending was Rs 5,775 in West Bengal and Rs 6,794 in Assam in the 2023-24 survey, which points to smaller baskets than in South India. Flipkart Minutes nevertheless named Bhagalpur, Durgapur and Siliguri among its strong growth cities in 2026, and these places are unlikely to support dedicated stores at metro density soon.
Central India grows fastest from the smallest base
Central India held 6.1% of 2025 value and grows at 30.45% a year, the fastest regional rate but on the lowest starting value. Urban monthly per capita spending was Rs 5,538 in Madhya Pradesh and Rs 4,927 in Chhattisgarh in the 2023-24 survey, both below the national urban average. Store-led coverage matters here, since Reliance Retail said JioMart reached 1,200 cities in April 2026. Lower spending means operators need larger baskets before dedicated dark stores can pay back.
Regulators and retailers reset the market since 2025
| Development | Status and market relevance |
|---|---|
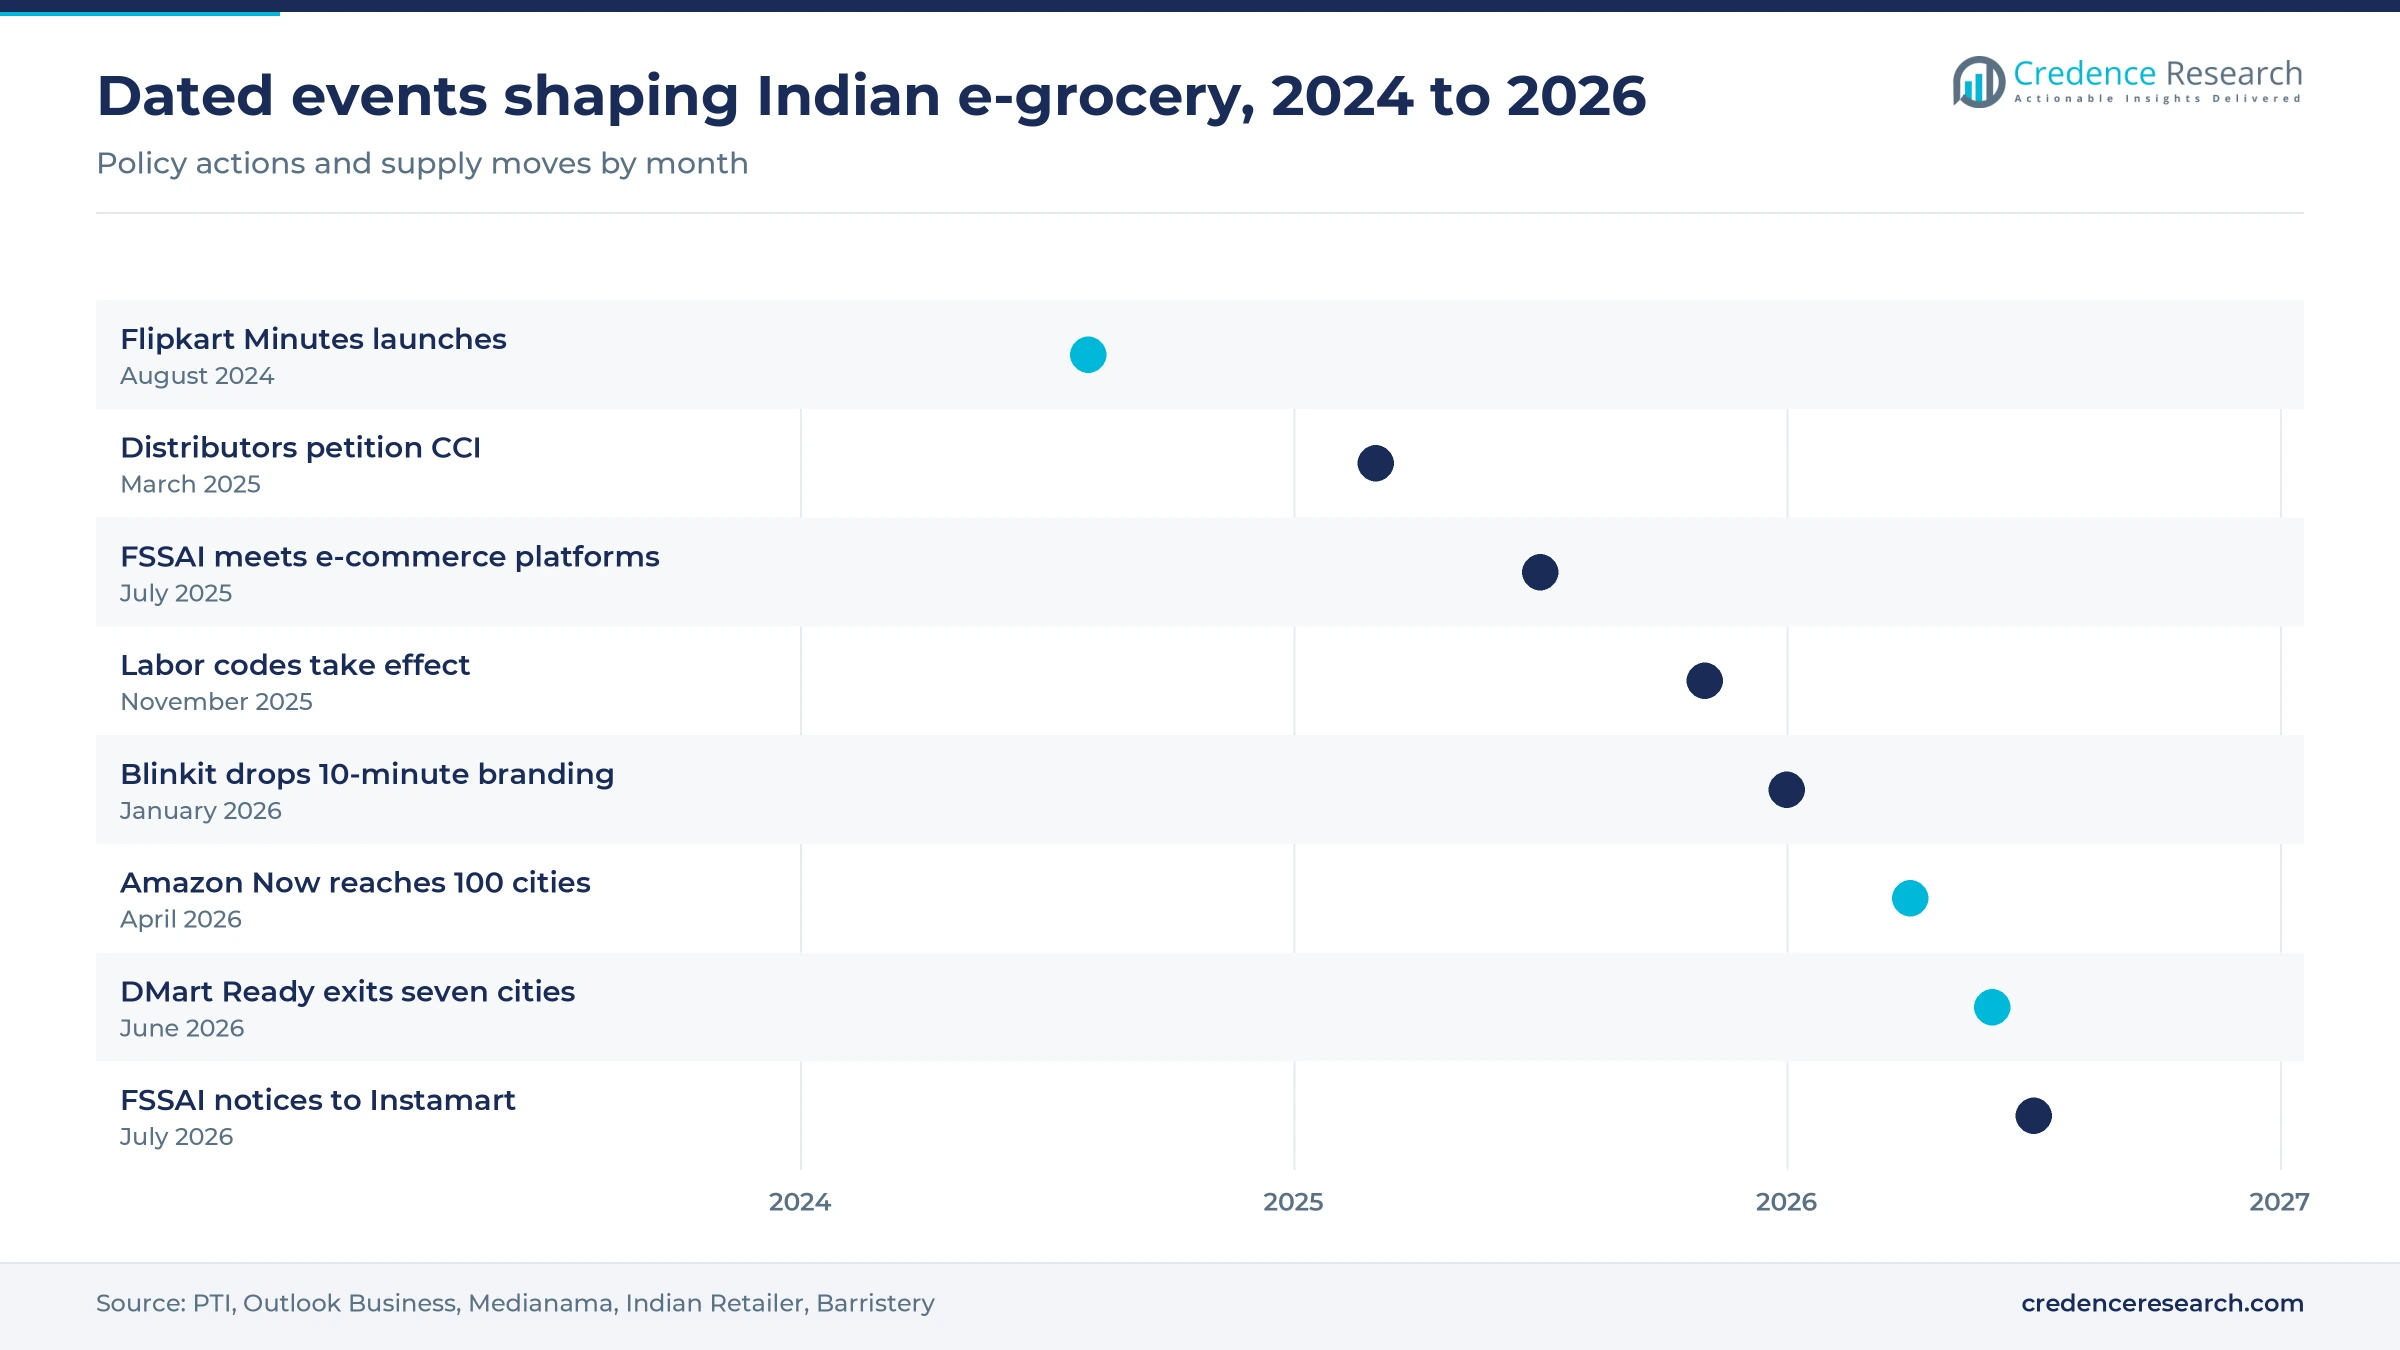
| In November 2025, the four labor codes took effect and required aggregators to fund gig worker social security, according to Outlook Business. | Enforced; raises delivery cost for all app platforms |
| In January 2026, Blinkit removed its 10-minute promise from its branding after a meeting with Labor Minister Mansukh Mandaviya, according to PTI. | Completed; competition shifts toward assortment and reliability |
| In April 2026, Amazon Now reached 100 cities and Amazon set a plan for more than 1,000 micro-fulfillment centers, according to Medianama. | Expansion underway; adds supply in metros and midsize cities |
| In June 2026, Avenue Supermarts exited seven DMart Ready cities and focused on large metros, according to Outlook Business. | Completed; online unit now operates in 11 cities |
| In July 2026, FSSAI issued nine notices to Swiggy Instamart over expired and spoiled products, according to a Barristery legal note. | Compliance response pending; signals closer dark store oversight |
Automation and price tools are changing dark store work
- Automated sorting handles about 2.5 million fast-moving units a day at Zepto and raised outbound labor productivity by more than 45%, according to a December 2025 Indian Retailer report.
- Procurement software such as Zepto's Bloom app tracks mandi prices and scores vendors, which supports faster buying decisions for fresh produce across its collection centers.
- Instant payments through UPI reached a record 24.51 billion monthly transactions in August 2026, which keeps checkout fast for small and repeat baskets.
- Regulatory portals such as FoSCoS require e-commerce food operators to list warehouses and upload facility photos, which turns store hygiene into a documented compliance record.
Need a Custom Version of This Report?
Tailor the scope, geography, or segments to your exact requirements.
- Custom geography or segment scope
- Direct access to our analyst team
Dark store scale separates the leaders from the challengers
Competition centers on store density, assortment and order frequency rather than on price alone. Blinkit has the largest dedicated network, with 2,443 locations in June 2026 and a target of close to 3,000 by March 2027. Zepto and Swiggy Instamart follow with more than 1,100 stores each, while Flipkart Minutes has reached about 1,200 centers and BigBasket runs about 800. Amazon is adding Amazon Now centers quickly, and Reliance Retail uses its store base to give JioMart wider city coverage. DMart Ready has taken the opposite path by concentrating on large metros. Specialists compete differently, since Country Delight built its business on milk subscriptions and Nature's Basket on premium assortments. Because these models carry different cost structures, a price war would affect store-led and app-only operators unevenly, and smaller regional sellers would face the greatest pressure.
Companies profiled and their roles in this market
| Company | Type | Role in the market |
|---|---|---|
| Blinkit | Quick commerce app | 2,443 locations in June 2026, owned by Eternal, with a target near 3,000 by March 2027 |
| Swiggy Instamart | Quick commerce app | 1,240 dark stores across 133 cities at the end of September 2026 |
| Zepto | Quick commerce app | 1,139 dark stores and 640 million orders in fiscal 2026, with direct fresh sourcing |
| BigBasket | Grocery platform | About 800 dark stores, with quick delivery now about 85% of the business |
| Flipkart Minutes | Quick commerce app | About 1,200 centers across more than 150 cities in September 2026 |
| Amazon Fresh India | Marketplace and quick delivery | Amazon Now reached 100 cities in April 2026 |
| JioMart | Omnichannel retailer app | 3,100 stores serving 1,200 cities, as Reliance Retail reported in April 2026 |
| DMart Ready | Omnichannel retailer app | Operated in 11 cities on June 30, 2026, after leaving seven smaller markets |
| Nature's Basket | Premium grocer | Spencer's Retail-owned premium chain with store and delivery service, last verified from a January 2021 store report |
| Country Delight | Subscription and D2C platform | Milk-led subscription brand, about 8 million monthly deliveries in 15 cities as of December 2022 |
Analyst view on durable growth beyond the largest metros
Credence Research's view is that online grocery in India will remain a strong growth market, but the 2035 result depends on adoption outside the largest metros. Store networks have expanded faster than proof of smaller-city returns, and DMart Ready's exit from seven cities shows the risk. Buyers and investors should therefore compare operators on orders per store, fresh waste and compliance records rather than on store counts alone. The strongest position will likely belong to operators that combine metro density with low-cost reach through existing stores.
How the estimates were built
The report uses 2025 as the base year and 2026 to 2035 as the forecast period. Market values come from the Credence Research model, which was cross-checked against consumer spending, reported platform activity and an assessment of online penetration. Segment and regional splits are Credence Research estimates drawn from those same inputs. Sources include TRAI, MoSPI, FSSAI, NPCI data, U.S. Department of Agriculture reporting, company statements and named business press. No interviews or primary surveys were conducted for this particular report.
Penetration outside metros decides the 2035 outcome
The market is expected to reach USD 180.48 billion by 2035, with growth easing as the base expands and metro demand matures. Smaller cities, fresh produce and packaged food lines should add most of the new value, provided that delivery costs fall and baskets grow. Regulation will also shape the path, since food safety enforcement and social security contributions will favor operators with disciplined stores. In turn, consolidation appears likely among weaker dark store networks, while retailers with existing outlets should keep a cost advantage in lower-spending regions through the forecast period.
Frequently Asked Questions
How big is the India online grocery market?
How fast will the market grow through 2035?
Which region leads online grocery spending in India?
Which region is growing the fastest?
Which channel holds the largest share?
Which product category leads online grocery?
Who are the main companies in this market?
What are the main risks for online grocery platforms?
Table of Content
Chapter 1 Market Segmentation
- 1.1 Segmentation Framework
- 1.1.1 Product and Service Classification
- 1.1.2 Application and End-Use Classification
- 1.1.3 Technology and Solution Classification
- 1.1.4 Customer and Distribution Channel Classification
- 1.1.5 Geographic Segmentation
- 1.1.6 Market Segment Definitions and Boundaries
- 1.2 By Product Type
- 1.2.1 Staples and Cooking Essentials
- 1.2.2 Packaged Foods and Beverages
- 1.2.3 Fresh Produce
- 1.2.4 Dairy and Bakery
- 1.2.5 Household and Personal Care
- 1.3 By Customer Type
- 1.3.1 Urban Professionals
- 1.3.2 Families with Children
- 1.3.3 Students and Shared Households
- 1.3.4 Senior Households
- 1.4 By Purchase Occasion
- 1.4.1 Daily Top-up
- 1.4.2 Weekly Stock-up
- 1.4.3 Emergency Convenience
- 1.4.4 Festival and Gifting
Chapter 2 Introduction
- 2.1 Report Objectives and Scope
- 2.2 Product Definition and Industry Terminology
- 2.3 Market Inclusions and Exclusions
- 2.4 Research Process
- 2.4.1 Primary Research and Expert Interviews
- 2.4.2 Secondary Research and Source Review
- 2.4.3 Top-Down and Bottom-Up Estimation
- 2.4.4 Data Triangulation and Verification
- 2.5 Market Size Measurement Basis
- 2.5.1 2025: USD 13.61 billion → 2035: USD 180.48 billion
- 2.6 Historical and Forecast Reference Periods
- 2.6.1 Historical Period: 2018-2025
- 2.6.2 Base Year: 2025
- 2.6.3 Forecast Period: 2025-2035
- 2.7 Research Assumptions and Limitations
Chapter 3 Executive Summary
- 3.1 Market Snapshot and Key Findings
- 3.2 Base-Year Market Size, 2025
- 3.3 Forecast Market Size, 2035
- 3.4 Revenue and Volume Growth Outlook
- 3.5 Key Demand and Supply Indicators
- 3.6 Leading Market Segments
- 3.7 Fastest-Growing Market Opportunities
- 3.8 Regional Performance Highlights
- 3.9 Technology and Industry Transformation
- 3.10 Competitive Landscape Summary
- 3.11 Analyst View and Strategic Implications
Chapter 4 India Online Grocery Market Trends and Developments
- 4.1 Historical Industry Development, 2018-2025
- 4.2 Recent Market Trends and Developments
- 4.3 Demand and Customer Behavior Trends
- 4.4 Technology and Product Innovation
- 4.5 Artificial Intelligence, Automation and Digitalization
- 4.6 Local Manufacturing and Supply Chain Realignment
- 4.7 Industry Partnerships, Mergers and Acquisitions
- 4.8 Sustainability and Circular Economy Developments
- 4.9 Government and Private Sector Investment Trends
- 4.10 Emerging Business Models and Commercialization
- 4.11 Industry Developments and Announcements
Chapter 5 India Online Grocery Market Production, Supply and Demand Analysis
- 5.1 Demand Trend and Consumption Analysis, 2018-2025
- 5.2 Demand Forecast, 2025-2035
- 5.3 Production and Output Trend, 2018-2025
- 5.4 Production and Output Forecast, 2025-2035
- 5.5 Installed Capacity and Capacity Utilization
- 5.6 Company-Wise Production Plants and Statistics
- 5.6.1 Installed Production Capacity
- 5.6.2 Actual Production
- 5.6.3 Planned Capacity and Expansion Targets
- 5.7 Supply Chain Structure and Procurement Trends
- 5.8 Supply-Demand Gap and Bottlenecks
- 5.9 Import Dependence and Sourcing Structure
- 5.10 Contract Manufacturing and Outsourcing
- 5.11 Regional Supply and Demand Concentration
Chapter 6 India Online Grocery Market Pricing Analysis
- 6.1 Pricing Structure and Measurement
- 6.2 Historical Pricing Trends, 2018-2025
- 6.3 Pricing Outlook, 2025-2035
- 6.4 Average Selling Price and Unit Economics
- 6.5 Pricing by Product and Market Segment
- 6.6 Geographic Pricing Differences
- 6.7 Key Input, Energy, Labor and Logistics Costs
- 6.8 Contract Pricing and Purchasing Models
- 6.9 Pricing Sensitivity and Competitive Positioning
- 6.10 Price, Margin and Profitability Implications
Chapter 7 India Online Grocery Market Dynamics
- 7.1 Market Growth Drivers
- 7.1.1 Demand-Side Drivers
- 7.1.2 Technology and Innovation Drivers
- 7.1.3 Infrastructure and Investment Drivers
- 7.1.4 Regulatory and Policy Drivers
- 7.2 Market Restraints
- 7.2.1 Cost and Affordability Constraints
- 7.2.2 Technology and Adoption Barriers
- 7.2.3 Supply Chain and Operational Constraints
- 7.3 Market Challenges
- 7.3.1 Competitive Pressure and Margin Erosion
- 7.3.2 Skills, Infrastructure and Implementation Gaps
- 7.4 Emerging Market Opportunities
- 7.5 Market Dynamics Impact and Time-Horizon Assessment
Chapter 8 India Online Grocery Value Chain Analysis
- 8.1 Industry Value Chain Overview
- 8.2 Upstream Suppliers and Critical Inputs
- 8.3 Technology and Component Providers
- 8.4 Manufacturing or Service Delivery
- 8.5 Distribution, Channel Partners and Integrators
- 8.6 Downstream Applications and End Users
- 8.7 Value Addition and Profit Pools
- 8.8 Vertical Integration and Outsourcing
- 8.9 Supplier Concentration and Risk
- 8.10 Supply Chain Localization and Resilience
Chapter 9 India Online Grocery Market Regulations and Policies
- 9.1 Relevant Laws, Standards and Compliance Frameworks
- 9.2 Product, Service, Safety and Quality Requirements
- 9.3 Government Policies, Incentives and Subsidies
- 9.4 Imports, Exports and Trade Barriers
- 9.5 Public Procurement and Local Content Requirements
- 9.6 Environmental and Sustainability Compliance
- 9.7 Upcoming Policy Changes and Market Implications
Chapter 10 India Online Grocery Market Hotspots and Opportunities
- 10.1 Market Opportunity Mapping and Growth Hotspots
- 10.2 High-Growth Applications and Customer Groups
- 10.3 Underserved Markets and White-Space Opportunities
- 10.4 Emerging Technology and Product Opportunities
- 10.5 New Capacity and Investment Hotspots
- 10.6 Market Entry and Expansion Opportunities
- 10.7 Distribution and Partnership Opportunities
- 10.8 Near-Term and Long-Term Commercial Potential
- 10.9 Opportunity Attractiveness and Execution Risks
Chapter 11 India Online Grocery Market Outlook, 2025-2035
- 11.1 Market Size and Analysis
- 11.1.1 Revenue (Market Measurement: 2025: USD 13.61 billion → 2035: USD 180.48 billion)
- 11.1.2 Market Volume and Quantity Sold
- 11.1.3 Historical Market Size, 2018-2025
- 11.1.4 Base-Year Market Size, 2025
- 11.2 Market Forecast, 2025-2035
- 11.2.1 Revenue Forecast to 2035
- 11.2.2 Volume Forecast to 2035
- 11.2.3 CAGR and Year-on-Year Growth
- 11.2.4 Incremental Revenue Opportunity
- 11.3 Forecast Assumptions and Scenario Analysis
- 11.3.1 Base-Case Forecast
- 11.3.2 Optimistic and Conservative Scenarios
- 11.3.3 Technology, Pricing and Policy Sensitivities
- 11.4 Market Attractiveness and Growth Outlook
Chapter 12 India Online Grocery Market Segmentation and Outlook
- 12.1 Segmentation Summary and Market Shares, 2025
- 12.2 Largest and Fastest-Growing Segments
- 12.3 By Product Type - Market Size and Forecast, 2025-2035
- 12.3.1 Segment Definition and Scope
- 12.3.2 Historical Market Size, 2018-2025
- 12.3.3 Revenue Forecast, 2025-2035
- 12.3.4 Volume Forecast, 2025-2035
- 12.3.5 Base-Year Market Share, 2025
- 12.3.6 Segment CAGR and Growth Drivers
- 12.3.7 Subsegment Market Size and Forecast
- 12.3.7.1 Staples and Cooking Essentials
- 12.3.7.2 Packaged Foods and Beverages
- 12.3.7.3 Fresh Produce
- 12.3.7.4 Dairy and Bakery
- 12.3.7.5 Household and Personal Care
- 12.3.8 Subsegment Pricing and Adoption Trends
- 12.3.9 Leading Suppliers and Competition
- 12.3.10 Regional Demand and Opportunities
- 12.4 By Customer Type - Market Size and Forecast, 2025-2035
- 12.4.1 Segment Definition and Scope
- 12.4.2 Historical Market Size, 2018-2025
- 12.4.3 Revenue Forecast, 2025-2035
- 12.4.4 Volume Forecast, 2025-2035
- 12.4.5 Base-Year Market Share, 2025
- 12.4.6 Segment CAGR and Growth Drivers
- 12.4.7 Subsegment Market Size and Forecast
- 12.4.7.1 Urban Professionals
- 12.4.7.2 Families with Children
- 12.4.7.3 Students and Shared Households
- 12.4.7.4 Senior Households
- 12.4.8 Subsegment Pricing and Adoption Trends
- 12.4.9 Leading Suppliers and Competition
- 12.4.10 Regional Demand and Opportunities
- 12.5 By Purchase Occasion - Market Size and Forecast, 2025-2035
- 12.5.1 Segment Definition and Scope
- 12.5.2 Historical Market Size, 2018-2025
- 12.5.3 Revenue Forecast, 2025-2035
- 12.5.4 Volume Forecast, 2025-2035
- 12.5.5 Base-Year Market Share, 2025
- 12.5.6 Segment CAGR and Growth Drivers
- 12.5.7 Subsegment Market Size and Forecast
- 12.5.7.1 Daily Top-up
- 12.5.7.2 Weekly Stock-up
- 12.5.7.3 Emergency Convenience
- 12.5.7.4 Festival and Gifting
- 12.5.8 Subsegment Pricing and Adoption Trends
- 12.5.9 Leading Suppliers and Competition
- 12.5.10 Regional Demand and Opportunities
- 12.6 Segment Growth Comparison
- 12.7 Segment Attractiveness and Priority Matrix
Chapter 13 India Online Grocery End-Use and Application Market Outlook
- 13.1 End-Use Industry and Customer Demand Structure
- 13.2 Leading Applications and Customer Groups
- 13.3 End-Use Market Size, Share and Forecast
- 13.4 Major End-Use Industry Deep Dives
- 13.4.1 Customer Requirements and Use Cases
- 13.4.2 Demand and Replacement Cycles
- 13.4.3 Technical and Regulatory Considerations
- 13.4.4 Purchasing and Procurement Models
- 13.4.5 Leading Vendors and Distribution Channels
- 13.4.6 Forecast and Commercial Opportunities
- 13.5 Emerging Applications and Cross-Segment Demand
- 13.6 End-Use Industry Investment Priorities
Chapter 14 India Online Grocery Geographic Market Outlook, 2025-2035
- 14.1 Domestic Market Distribution and Demand Clusters
- 14.2 State- or Province-Wise Market Size and Forecast, 2025-2035
- 14.3 City and Metropolitan Market Outlook
- 14.4 Industrial, Manufacturing and Commercial Clusters
- 14.5 Geographic Concentration of Key End Users
- 14.6 Local Pricing and Purchasing Differences
- 14.7 Domestic Production Facilities and Capacity Map
- 14.8 Local Infrastructure and Project Pipeline
- 14.9 State-Level Policy and Incentive Differences
- 14.10 Subnational Investment Hotspots and Opportunities
- 14.11 Distribution and Logistics Networks
- 14.12 Domestic Competitive Footprint
Chapter 15 India Online Grocery Technology, Innovation and Sustainability Outlook
- 15.1 Technology Landscape and Maturity
- 15.2 Product, Process and Service Innovation
- 15.3 AI, Automation and Digital Tools in the Industry
- 15.4 Technology Adoption and Performance Benchmarking
- 15.5 Innovation Pipeline and R&D Investment
- 15.6 Patent and Intellectual Property Trends
- 15.7 Energy Efficiency and Resource Management
- 15.8 Sustainability, Recycling and Circularity
- 15.9 Technology Roadmap, 2025-2035
- 15.10 Risks of Obsolescence and Technology Substitution
Chapter 16 India Online Grocery Market Key Strategic Imperatives
- 16.1 Growth and Market Entry Priorities
- 16.2 High-Return Products and Segments
- 16.3 Pricing, Profitability and Cost Optimization
- 16.4 Technology Investment and Product Differentiation
- 16.5 Supply Chain Localization and Resilience
- 16.6 Distribution and Customer Acquisition
- 16.7 Partnership, Acquisition and Capacity Strategy
- 16.8 Regional Expansion Priorities
- 16.9 Short-, Medium- and Long-Term Actions
Chapter 17 Competition Outlook
- 17.1 Industry Competition Characteristics
- 17.2 Market Structure and Concentration
- 17.3 Market Share and Competitive Positioning, 2025
- 17.4 Company-Wise Revenue and Product Benchmarking
- 17.5 Production and Service Capacity Benchmarking
- 17.6 Technology, Pricing and Differentiation
- 17.7 Regional Footprint and Distribution Strength
- 17.8 Mergers, Acquisitions and Strategic Alliances
- 17.9 New Entrants and Competitive Threats
- 17.10 Porter's Five Forces and Industry Attractiveness
- 17.11 Competitive Outlook, 2025-2035
Chapter 18 Company Profiles
- 18.1 Company Coverage and Selection Criteria
- 18.2 Blinkit
- 18.2.1 Business Description
- 18.2.2 Company Ownership and Geographic Presence
- 18.2.3 Product and Service Portfolio
- 18.2.4 Manufacturing and Operating Footprint
- 18.2.5 Production Capacity and Expansion Plans
- 18.2.6 Financial Performance and Investment
- 18.2.7 Market Share and Competitive Position
- 18.2.8 Technology and Innovation Capabilities
- 18.2.9 Strategic Alliances or Partnerships
- 18.2.10 Recent Developments
- 18.2.11 Growth Strategy and Outlook
- 18.3 Swiggy Instamart
- 18.4 Zepto
- 18.5 BigBasket
- 18.6 Amazon Fresh India
- 18.7 Flipkart Minutes
- 18.8 JioMart
- 18.9 DMart Ready
- 18.10 Nature's Basket
- 18.11 Country Delight
- 18.12 Other Relevant Market Participants
Note: Every listed company is profiled on the structure shown under the first company. The company list is preliminary and may change based on research findings, market developments, data availability and client requirements.
Chapter 19 Disclaimer
- 19.1 Research and Forecast Disclaimer
- 19.2 Data Source and Estimation Limitations
Note: The depth of individual sections depends on data availability for this market. Volume, capacity, trade and other unit-based metrics are included where applicable.

