
Rs 10 packs and new plants reshape a two-brand-owner market
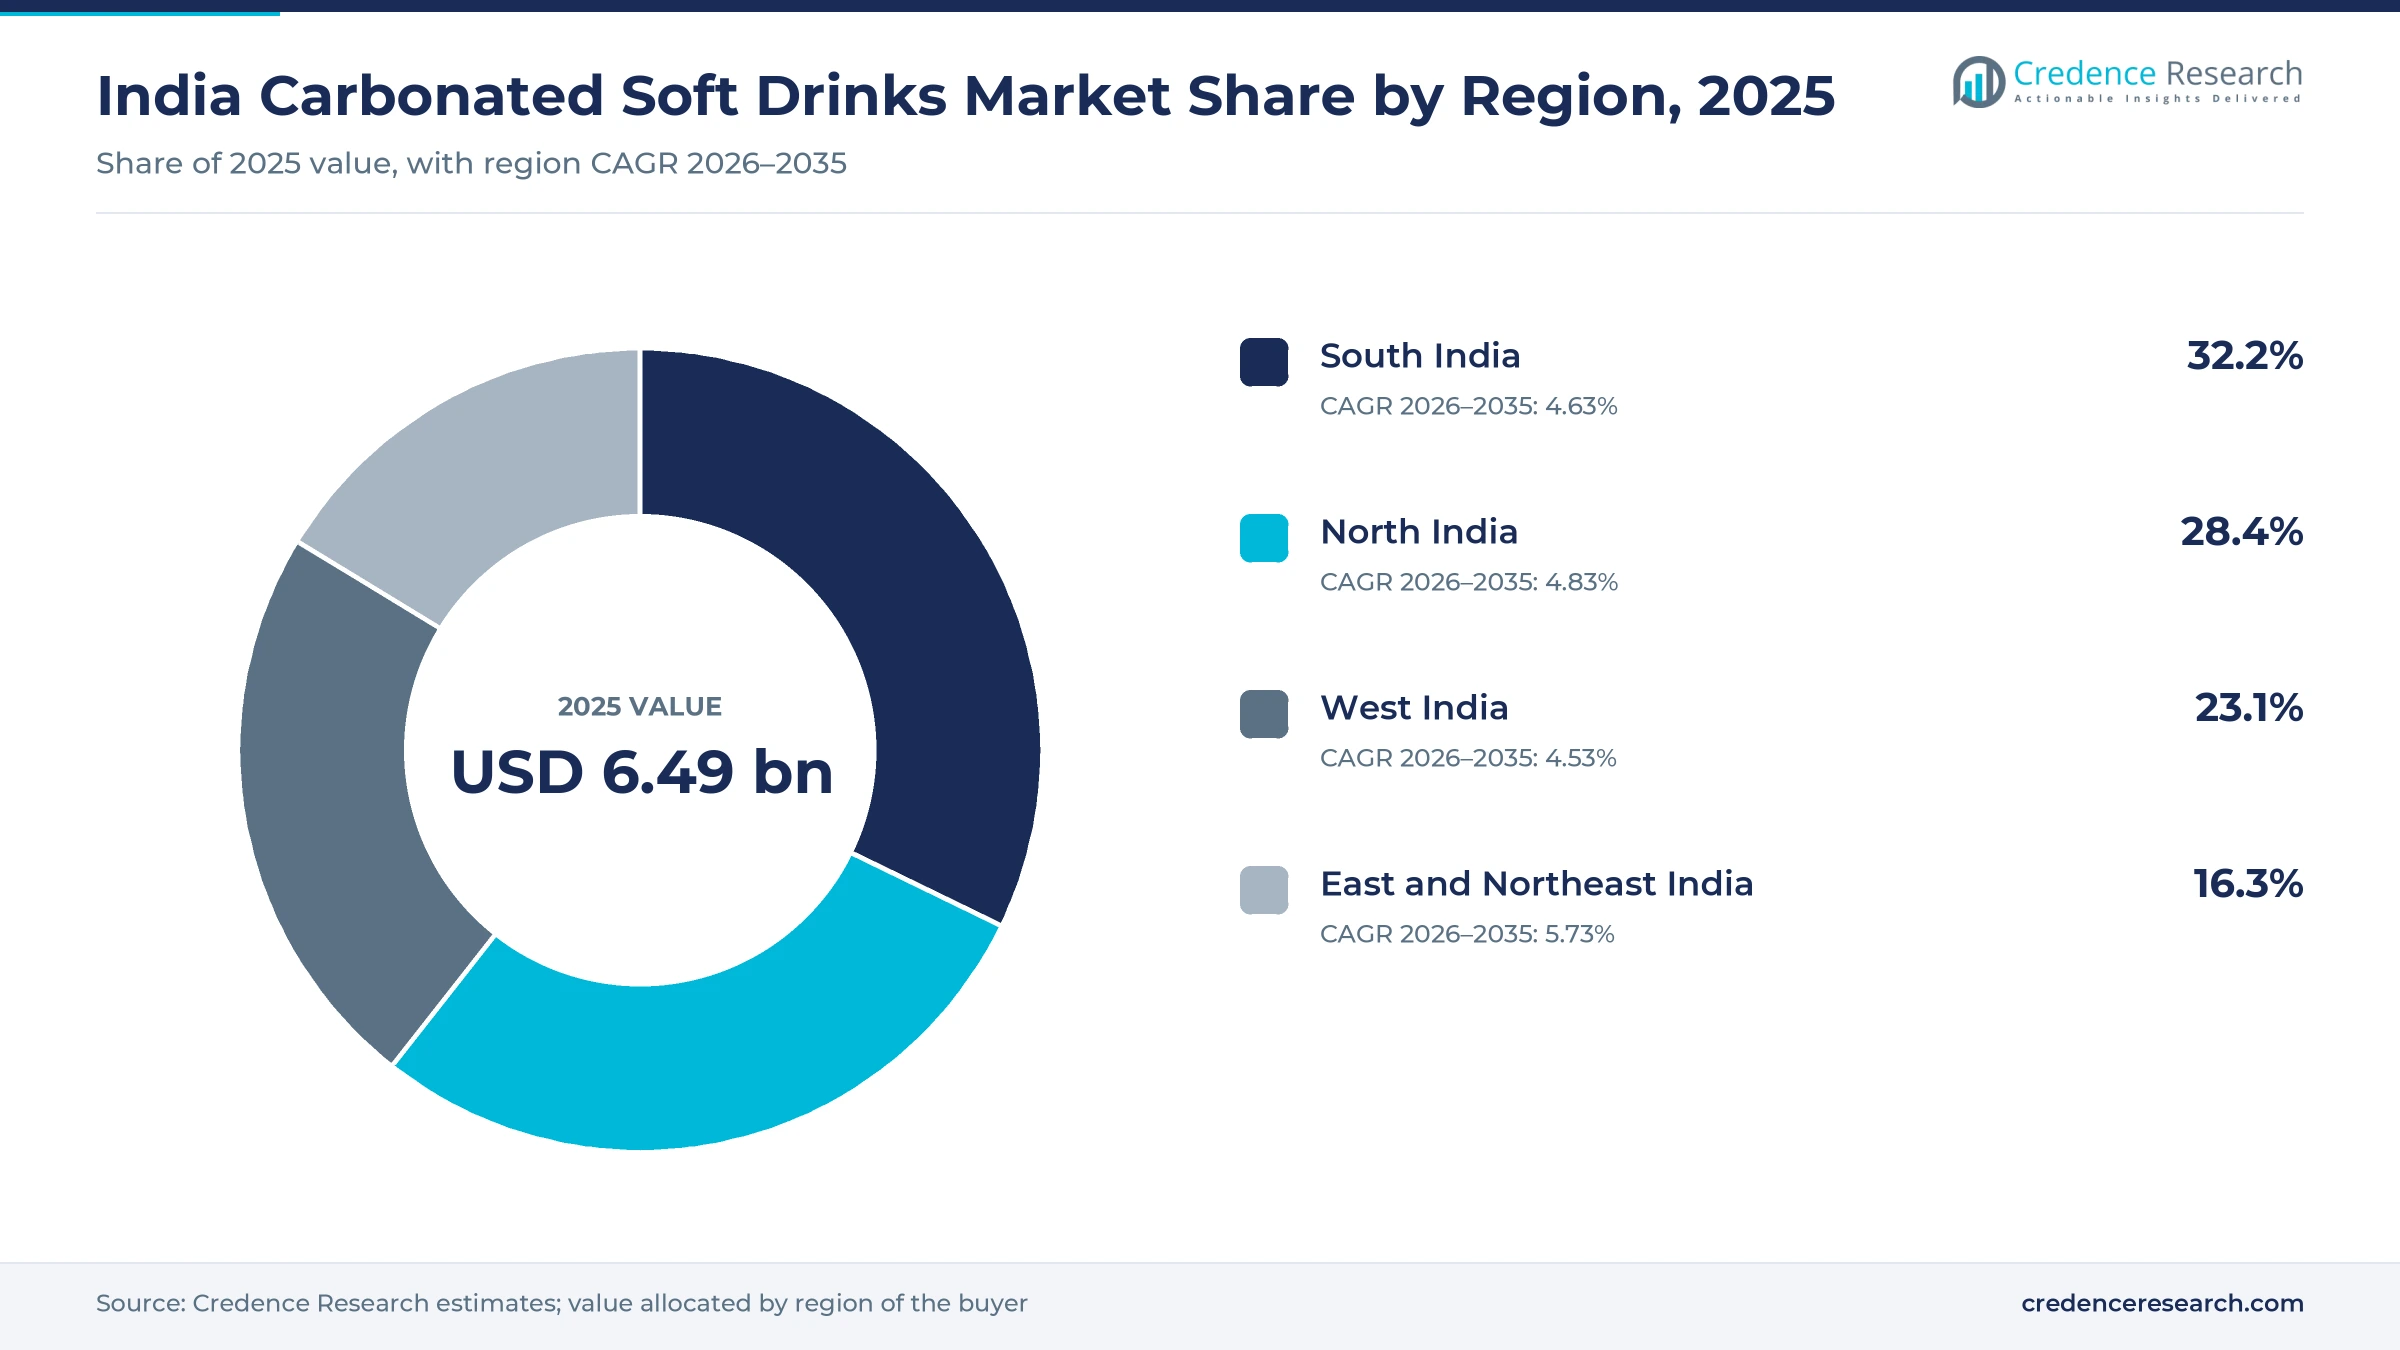
The India carbonated soft drinks market was valued at USD 6.49 billion in 2025 and is projected to increase from USD 6.83 billion in 2026 to USD 10.46 billion by 2035, registering a CAGR of 4.85% during 2026–2035. Demand rests on single-serve purchases at neighborhood stores, summer heat and younger buyers moving from loose refreshments to branded bottles. South India held the largest regional share, 32.2% in 2025, helped by higher household spending in Telangana, Tamil Nadu and Karnataka and by the early rollout of low-priced colas in Andhra Pradesh. East and Northeast India is the fastest-growing region at 5.73% a year, as new bottling plants in Bihar, Assam and Meghalaya shorten supply lines for lower-income markets. The largest commercial change is the return of the Rs 10 bottle, after Reliance relaunched Campa in 2023 and the two established brand owners responded with their own low-priced packs. The tax overhaul of September 2025 left the combined levy on carbonated drinks unchanged while moving fruit juice drinks to a lower slab, which widens the price gap against those beverages.
What does the India carbonated soft drinks market measure?
The market counts retail-level value of sparkling sweetened and sugar-free beverages sold in India, across colas, lemon and lime drinks, orange and fruit-flavored drinks, spiced and regional flavors, and low- and zero-sugar variants. Buyers purchase mostly chilled single-serve bottles from neighborhood stores, while households buy larger PET packs for meals and gatherings, and restaurants and cinemas pour post-mix through fountain equipment.
The scope excludes packaged water, non-carbonated juices and juice drinks, dairy beverages and stand-alone energy and sports products. The value chain runs from concentrate owners such as Coca-Cola and PepsiCo through franchise bottlers and co-packers to distributors and retailers. Pack makers supply PET preforms, glass and cans, while cooler suppliers fund the cold availability that retail sales depend upon.
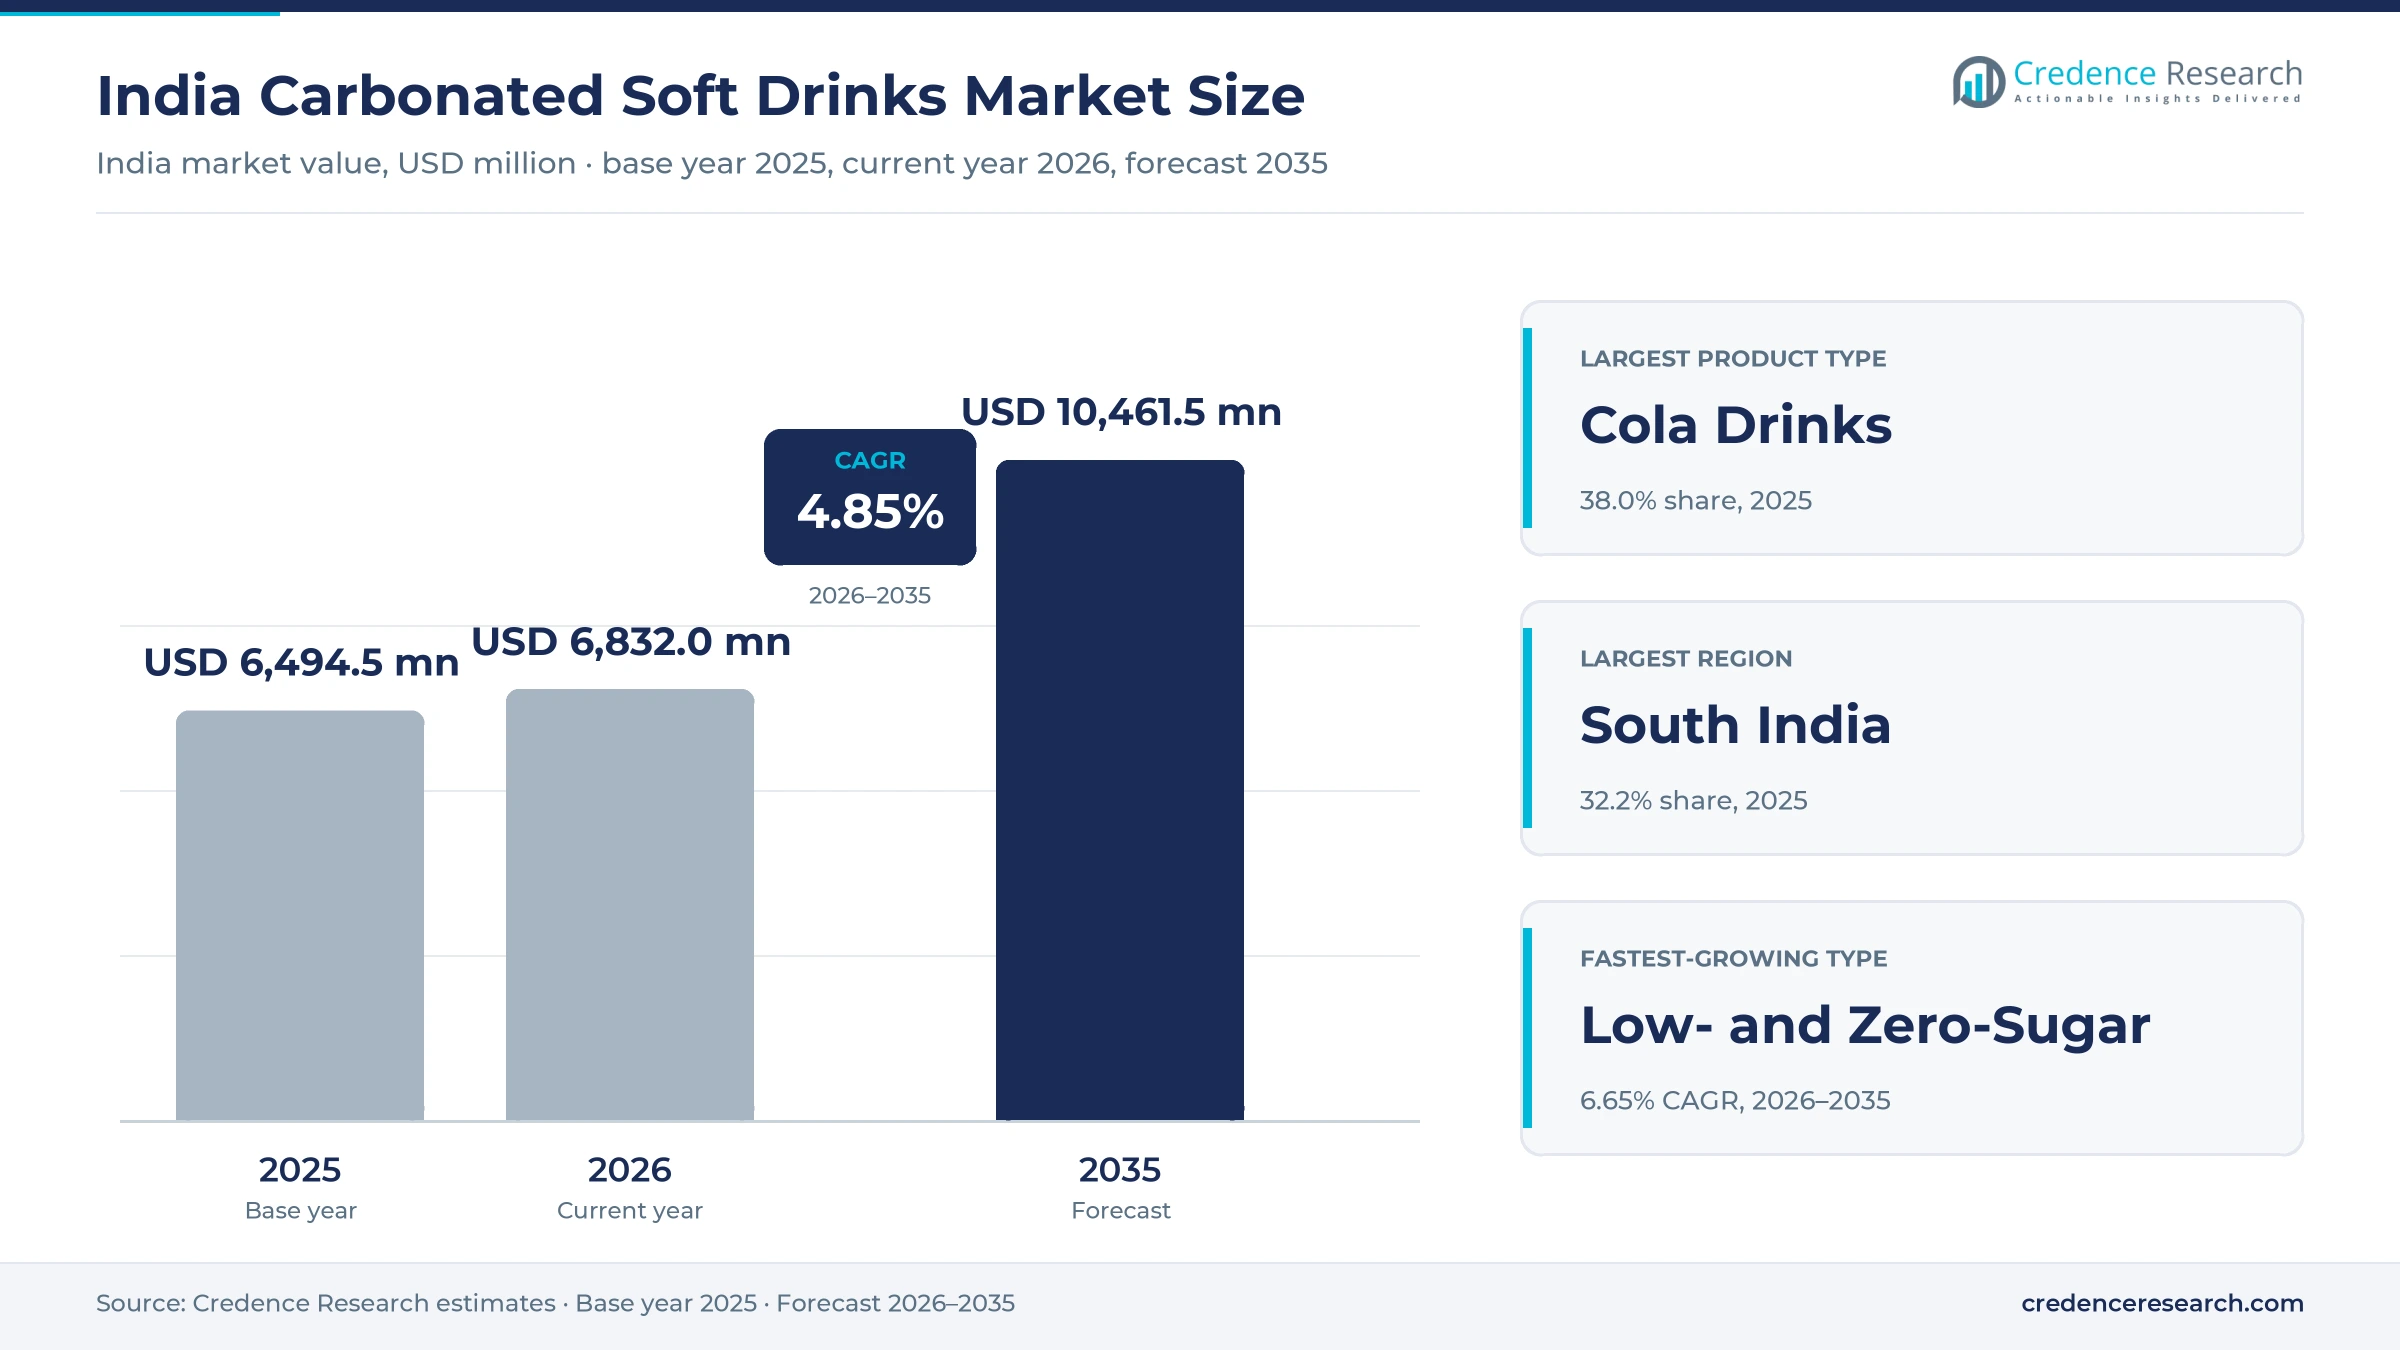
India Carbonated Soft Drinks Market Insights
- The market grows from USD 6.49 billion in 2025 to USD 10.46 billion by 2035, a 4.85% CAGR, as low-priced packs extend reach into smaller towns and rural stores.
- South India held 32.2% of 2025 value, the largest regional share, supported by above-average urban household spending in Telangana, Tamil Nadu and Karnataka.
- Cola Drinks led with 38.0% of 2025 value, while Low- and Zero-Sugar Carbonated Drinks grow the fastest at 6.65% a year through 2035.
- Campa and Lahori Zeera together roughly doubled to nearly 15% share in January to September 2025, cutting the two largest brand owners from 93% to about 85%.
- Coca-Cola bottlers committed Rs 25,760 crore to projects running through 2030, while Varun Beverages added four greenfield Indian plants in 2025, raising capacity well above current use.
Colas lead while zero-sugar formats gain the fastest
Why colas lead while sugar-free variants grow the fastest
Based on product type, the market is categorized into cola drinks, lemon and lime drinks, orange and fruit-flavored drinks, spiced and regional flavors, and low- and zero-sugar carbonated drinks. Cola Drinks led with 38.0% of 2025 value because most low-price competition targets this flavor, as Campa Cola sells at Rs 10, about half the price of rival colas, according to ET BrandEquity in February 2026. Low- and Zero-Sugar Carbonated Drinks grow the fastest at 6.65% a year as zero and low-sugar beverages reached about 30% of Coca-Cola's India volume in 2025, up from about 5% in 2020, according to NewsBytes in February 2026.
Mass-market packs hold value as Rs 10 bottles pull volume
Based on price tier, the market is categorized into economy, mass market, premium and super-premium. Mass Market led with 54.0% of 2025 value because the Rs 20 and Rs 40 packs carry the largest brand owners, and Varun Beverages moved its Rs 20 pack from 250 ml to 400 ml, according to its Feb. 3, 2026 earnings call. Economy grows the fastest at 6.07% a year as Campa and Lahori Zeera took a combined share of nearly 15% in January to September 2025, up from around 7% a year earlier, according to Angel One.
General trade dominates while quick commerce scales from a low base
Based on distribution channel, the market is categorized into general trade, modern retail, food service, e-commerce and quick commerce, and institutional and vending. General Trade led with 66.0% of 2025 value because chilled impulse sales need dense store coverage, and Hindustan Coca-Cola Beverages alone served over 1.7 million customers through more than 2,000 distributors, according to its parent in June 2026. E-Commerce and Quick Commerce grows the fastest at 9.14% a year as most packaged-goods firms reported 70% to 100% quick commerce growth in fiscal 2026, according to Angel One in May 2026.
PET leads on cost while cans gain on zero-sugar demand
Based on packaging format, the market is categorized into PET bottles, returnable glass bottles, aluminum cans and post-mix and fountain. PET Bottles led with 76.0% of 2025 value because large take-home and upsized single-serve packs rely on it, including the PepsiCo Rs 40 bottle raised from 600 ml to 740 ml, according to Business Standard in August 2025. Aluminium Cans grow the fastest at 6.69% a year as beverage can capacity expands, with Ball adding USD 60 million at Sri City and Hindalco adding about 50 kilotons of can sheet, according to AL Circle.
| Segment Group | Leading Sub-segment | Share, 2025 | Fastest-growing Sub-segment | CAGR, 2026–2035 |
|---|---|---|---|---|
| By Product Type | Cola Drinks | 38.0% | Low- and Zero-Sugar Carbonated Drinks | 6.65% |
| By Price Tier | Mass Market | 54.0% | Economy | 6.07% |
| By Distribution Channel | General Trade | 66.0% | E-Commerce and Quick Commerce | 9.14% |
| By Packaging Format | PET Bottles | 76.0% | Aluminium Cans | 6.69% |
Request a Free Sample
Fill in your details and we'll send you a free sample report.
- Sample data tables & charts
- Research methodology
Reach, youth and bottling capacity power volume growth
Low per-capita consumption leaves distribution white space
Low per-capita intake gives bottlers room to grow through reach rather than heavy price increases. The Varun Beverages annual report, as covered by Food and Beverage News in March 2026, cites relatively low per-capita consumption compared with global markets as room for expansion. Coca-Cola said in February 2025 that rural and smaller markets were growing faster than urban ones and that it was investing in cooling infrastructure to serve them. Reliance Consumer Products targeted about 70% availability in key beverage segments by March 2026, with a nationwide footprint planned by March 2027. In turn, East and Northeast India is the fastest-growing zone, and Tradejini reported in November 2025 that the Rs 10 pricing of Campa is concentrated in rural and semi-urban markets.
Young consumers expand branded beverage demand
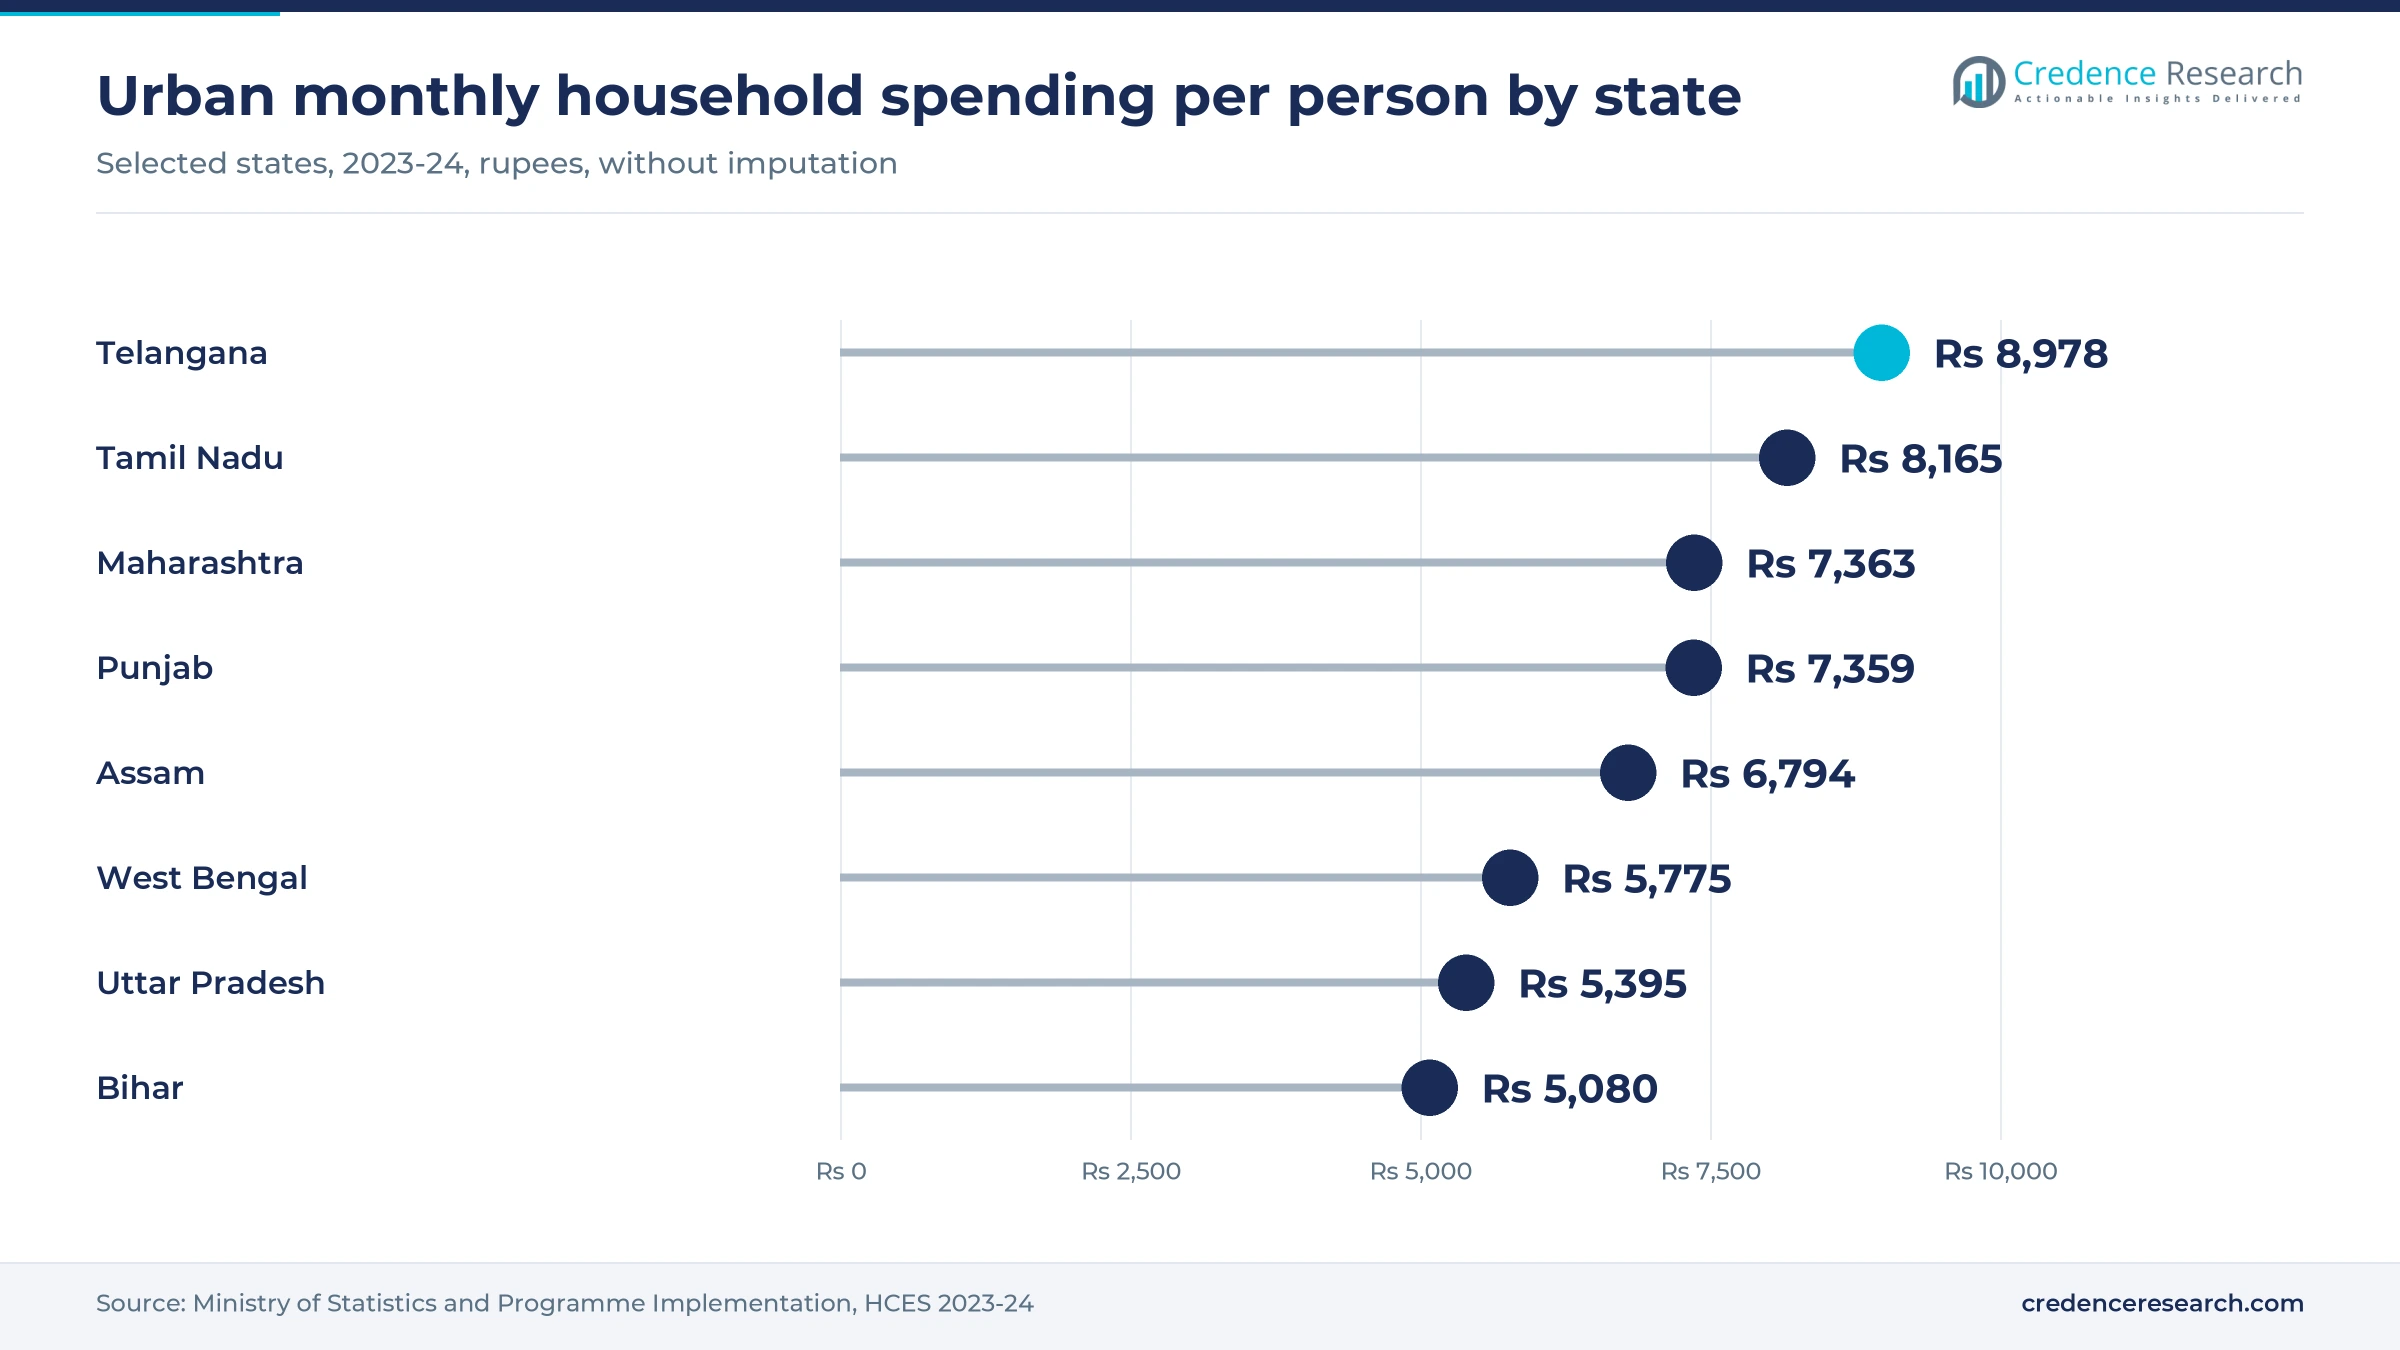
A young population gives brand owners a large base of first-time and frequent buyers of chilled branded drinks. The Ministry of Statistics reported in its Youth in India 2022 profile that people aged 15 to 29 were projected at 27.2% of the population in 2021. Its Household Consumption Expenditure Survey shows urban monthly spending per person at Rs 6,996 in 2023-24, and the survey also shows the share spent on beverages and processed food rising from the previous year. Brand owners are aiming directly at this group, as Coca-Cola linked Thums Up to the T20 Cricket World Cup and took Sprite into rural areas with local-language content in early 2026. Campa has used Indian Premier League sponsorships and an actor partnership with Ram Charan, according to Angel One.
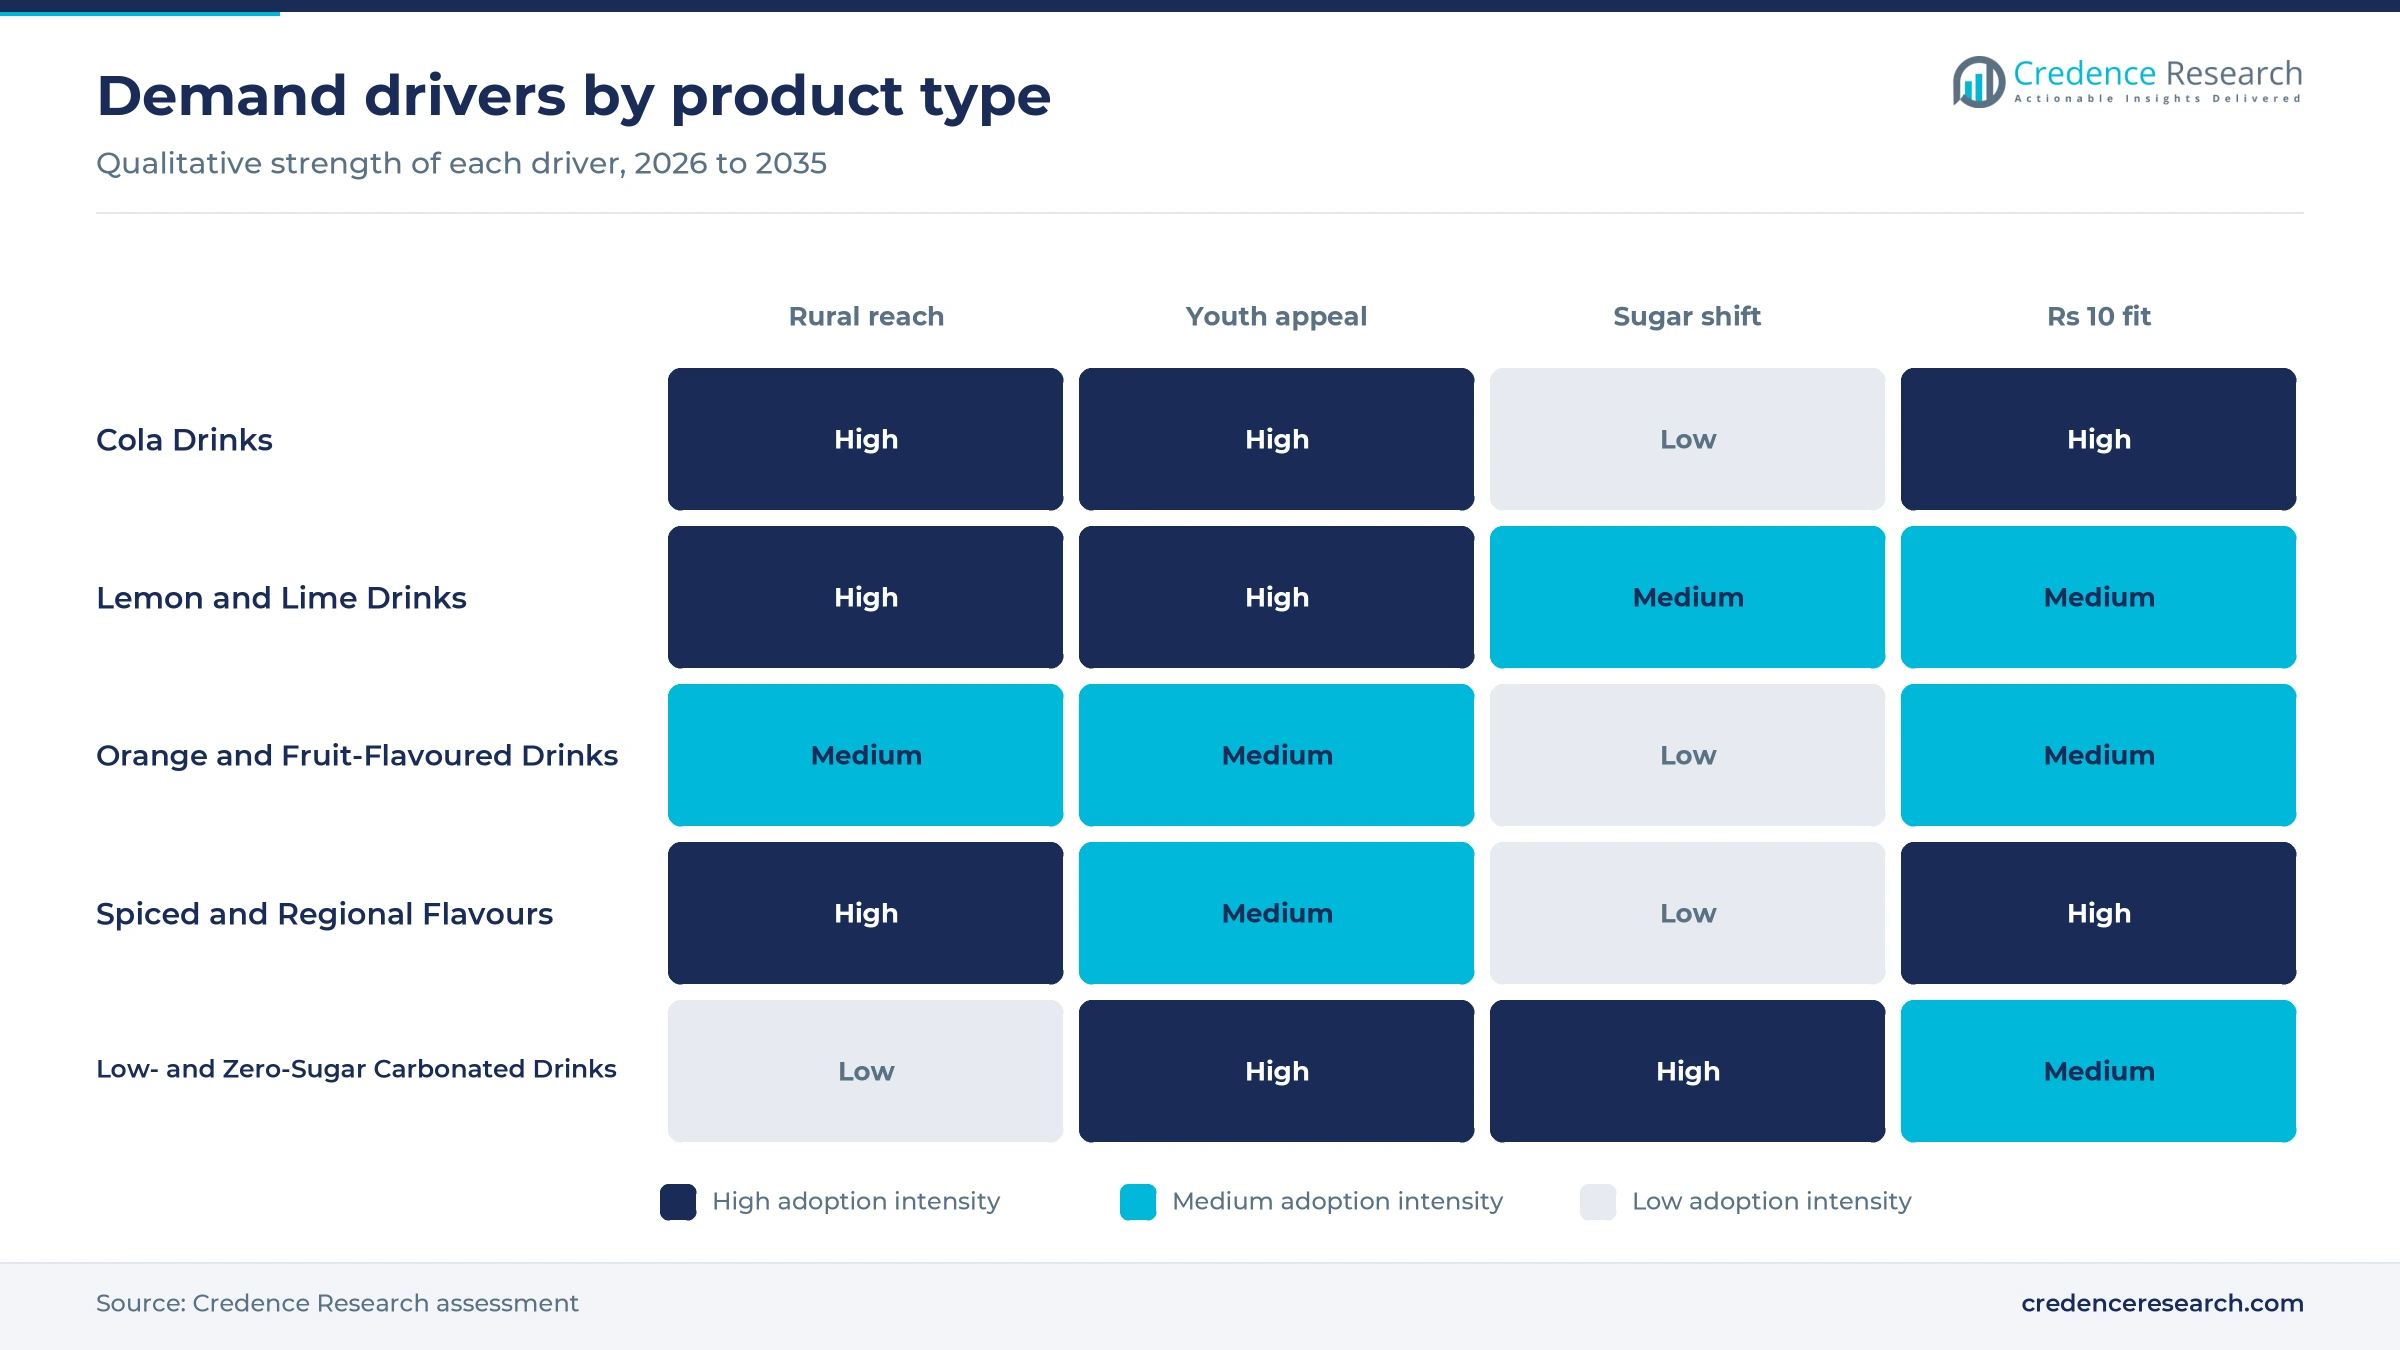
Bottling and cold-availability investment widens supply
Bottling and cooler investment removes the supply limits that once capped summer sales outside large cities. Coca-Cola bottlers SLMG Beverages, Hindustan Coca-Cola Beverages and Kandhari agreed with the Ministry of Food Processing Industries in September 2025 to invest Rs 25,760 crore across nine states and territories by 2030. Varun Beverages opened greenfield plants at Prayagraj, Buxar, Damtal and Mendipathar in 2025, expanding capacity by well over a third in two years, according to its Feb. 3, 2026 call. The same company set up an equal-stake joint venture, White Peak Refrigeration, in September 2025 to manufacture visi-coolers. As a result, chilled availability reaches more of the 66.0% of value that moves through general trade.
Larger packs at held prices raise value per purchase
Pack resizing lets bottlers defend price points that shoppers already know while lifting the liquid sold per purchase. Business Standard reported in August 2025 that PepsiCo raised its Rs 40 PET bottle from 600 ml to 740 ml ahead of the festive season, and that Coca-Cola made similar moves on Coca-Cola, Thums Up and Sprite. Varun Beverages completed its move of the Rs 20 pack from 250 ml to 400 ml by the fourth quarter of 2025. Coca-Cola also credited ultra-lightweight bottles with supporting volume growth in India, according to Outlook Business in April 2026. Because these packs keep familiar prices, they sustain the 54.0% of value held by the mass market tier.
Price resets and sugar reduction redraw the category
Shift back to the Rs 10 bottle resets entry pricing
The most visible shift is the return of a Rs 10 entry price across brands, which has moved share faster than any flavor launch. Coca-Cola and PepsiCo saw their combined share fall from 93% to about 85% in January to September 2025, according to Angel One. ET BrandEquity reported in February 2026 that Campa held about 7% and that Reliance targets 25% by 2028. Coca-Cola and PepsiCo responded with Rs 10 packs, including Pepsi No-Sugar at 200 ml in Andhra Pradesh, according to Agro & Food Processing in March 2025. Varun Beverages opened a Rs 10 price point in West Bengal and the Northeast in January 2026, and management expects it to remain a mid-single-digit part of the portfolio.
Rise of low- and zero-sugar formulas changes the mix
Sugar reduction has moved from a niche urban habit to a mainstream volume source for the largest brands. Zero-sugar products made up a record three-tenths of Coca-Cola volume in India in 2025, and Diet Coke volume doubled, according to NewsBytes in February 2026. Low- and no-sugar products reached about 59% of Varun Beverages consolidated volume in 2025 and about 73% in the first half of 2026, according to company disclosures. Regulation adds pressure, since FSSAI moved in June 2025 to adopt ICMR-NIN norms defining high-sugar foods, according to The Print. These moves place Low- and Zero-Sugar Carbonated Drinks ahead at 6.65% a year, alongside growth in diet beverage formats.
Opportunity in spiced and regional flavors beyond home states
Regional flavors offer an opening that large cola portfolios have not fully closed, especially at Rs 10. Archian Foods began selling cumin-flavored Lahori Zeera in 2017 and now sells Nimboo and Shikanji variants, according to Open magazine in September 2026. Agro & Food Processing reported in April 2026 that more than half of its volume now comes from outside northern India, with five new third-party bottling units planned and a Bengaluru co-packing facility for southern entry. Sosyo Hajoori Beverages, founded in 1923 with a strong Gujarat base and more than 100 flavors, gained a national partner when Reliance Consumer Products agreed to buy 50% in January 2023. Parle Agro claimed over 90% of fruit-plus-fizz through Appy Fizz, according to afaqs in October 2020, showing how far a distinct taste can travel.
Opportunity in local can and recycled PET supply
Packaging localization opens a supply-side opportunity for pack makers and bottlers that secure material early. AL Circle reported in June 2026 that Hindalco expects about 50 kilotons of new can sheet at Sambalpur, and that Ball announced a USD 60 million Sri City expansion in 2025, because imports from the UAE and Saudi Arabia left makers exposed. Recycled content rules for food-grade PET stepped up again on April 1, 2026, creating steady offtake for suppliers of recycled PET bottles. Coca-Cola also credits ultra-lightweight bottles for recent India volume gains. Firms able to supply these inputs reliably can win long contracts as Aluminium Cans grow at 6.69% a year.
Tax, weather and packaging supply squeeze bottlers
An unchanged levy and cheaper juice drinks limit pricing
The goods and services tax on aerated drinks moved to a flat 40% on Sept. 22, 2025, replacing 28% plus a 12% cess, so the combined burden did not change, according to LatestLY. Fruit juice drinks fell from 12% to 5% on the same date, which widened the tax gap. This gap hurts carbonated brands most at fixed price points such as Rs 10 and Rs 20, where retail prices are hard to raise. As a result, bottlers received no tax relief to fund lower prices, and smaller regional brands with thin margins face the sharpest pressure.
Can and packaging shortages disrupted peak supply
Heavy reliance on imported can sheet left beverage makers short during summer 2026, and some firms cut output or moved to PET and glass. AL Circle separately reported in April 2026 that imported cans cost roughly one-quarter or more above usual levels, glass prices rose about 20%, and Diet Coke ran short in Mumbai, Bengaluru and Pune. Whalesbook reported that packaging forms nearly 60% of manufacturing expense at Archian Foods. Mitigation depends on new domestic lines, which may take up to a year.
Unseasonal rain exposes reliance on a short summer
Weather can erase a year of expected growth because sales concentrate in a few hot months. Varun Beverages reported flat Indian volume in the third quarter of 2025 after extended monsoon rains, according to Tradejini in November 2025, and Business Standard reported on Oct. 21, 2025 that Coca-Cola volume in India declined that quarter on poor weather. Bottlers carrying new capacity feel this most, and management at Varun Beverages tied its 2026 growth view to favorable weather.
Recycled-content mandates raise compliance cost
Recycled content targets for food-grade PET moved from 30% for fiscal 2025-26 to 40% from April 1, 2026, and rigid plastic rules reach 60% in 2028-29, according to The Week. Because PET carries most category volume, supply of food-grade recycled resin becomes a direct cost and sourcing issue for bottlers and co-packers. A three-year carry-forward allowance for unmet targets eases the timing, though at least one-third of carried targets must be met each year.
South India leads as eastern states gain new plants
| Region | Value, 2025 (USD billion) | Share, 2025 | CAGR, 2026–2035 |
|---|---|---|---|
| South India | 2.09 | 32.2% | 4.63% |
| North India | 1.84 | 28.4% | 4.83% |
| West India | 1.50 | 23.1% | 4.53% |
| East and Northeast India | 1.06 | 16.3% | 5.73% |
South India leads on spending and early price competition
South India held 32.2% of 2025 value and grows at 4.63% a year. Andhra Pradesh and Telangana together account for nearly 20% of national aerated drink sales, according to Agro & Food Processing in March 2025. MoSPI data put urban monthly spending at Rs 8,978 in Telangana, Rs 8,165 in Tamil Nadu and Rs 8,076 in Karnataka in 2023-24, well above the national Rs 6,996. Hindustan Coca-Cola Beverages opened a seven-line factory at Siddipet with a planned Rs 2,091 crore outlay in December 2024, and Reliance Consumer Products received approval for a Rs 1,622 crore plant at Vijayapura in Karnataka in 2025.
North India anchors demand and new Varun capacity
North India held 28.4% of 2025 value and grows at 4.83% a year. Varun Beverages opened plants at Prayagraj and Damtal in 2025, placing fresh capacity near large Uttar Pradesh and hill-state markets. Archian Foods built its base in Punjab, Haryana, Delhi and Himachal Pradesh and runs its largest plant at Lucknow, below full capacity in April 2026. Kandhari already serves Haryana, Himachal Pradesh and Punjab for Coca-Cola, adding bottler depth across the zone.
West India combines mature cities with regional brands
West India held 23.1% of 2025 value and grows at 4.53% a year, the slowest of the four zones because its urban markets are more mature. MoSPI data put urban monthly spending at Rs 7,363 in Maharashtra and Rs 7,175 in Gujarat in 2023-24. Kandhari Global Beverages sought Competition Commission approval in March 2025 to buy Hindustan Coca-Cola assets in Gujarat and Diu, and Sosyo keeps a strong regional base in Gujarat, as Lahori Zeera bottles at Vapi.
East and Northeast India gain the most new capacity
East and Northeast India held 16.3% of 2025 value and grows the fastest at 5.73% a year. Campa opened a Guwahati plant in February 2025, and a Rs 1,000 crore site at Begusarai in Bihar was reported in April 2025, according to Outlook Business. SLMG Beverages is building a Rs 1,500 crore plant at Buxar, and Varun Beverages added Buxar and Mendipathar units. Urban spending of Rs 5,080 in Bihar makes low-priced packs central here.
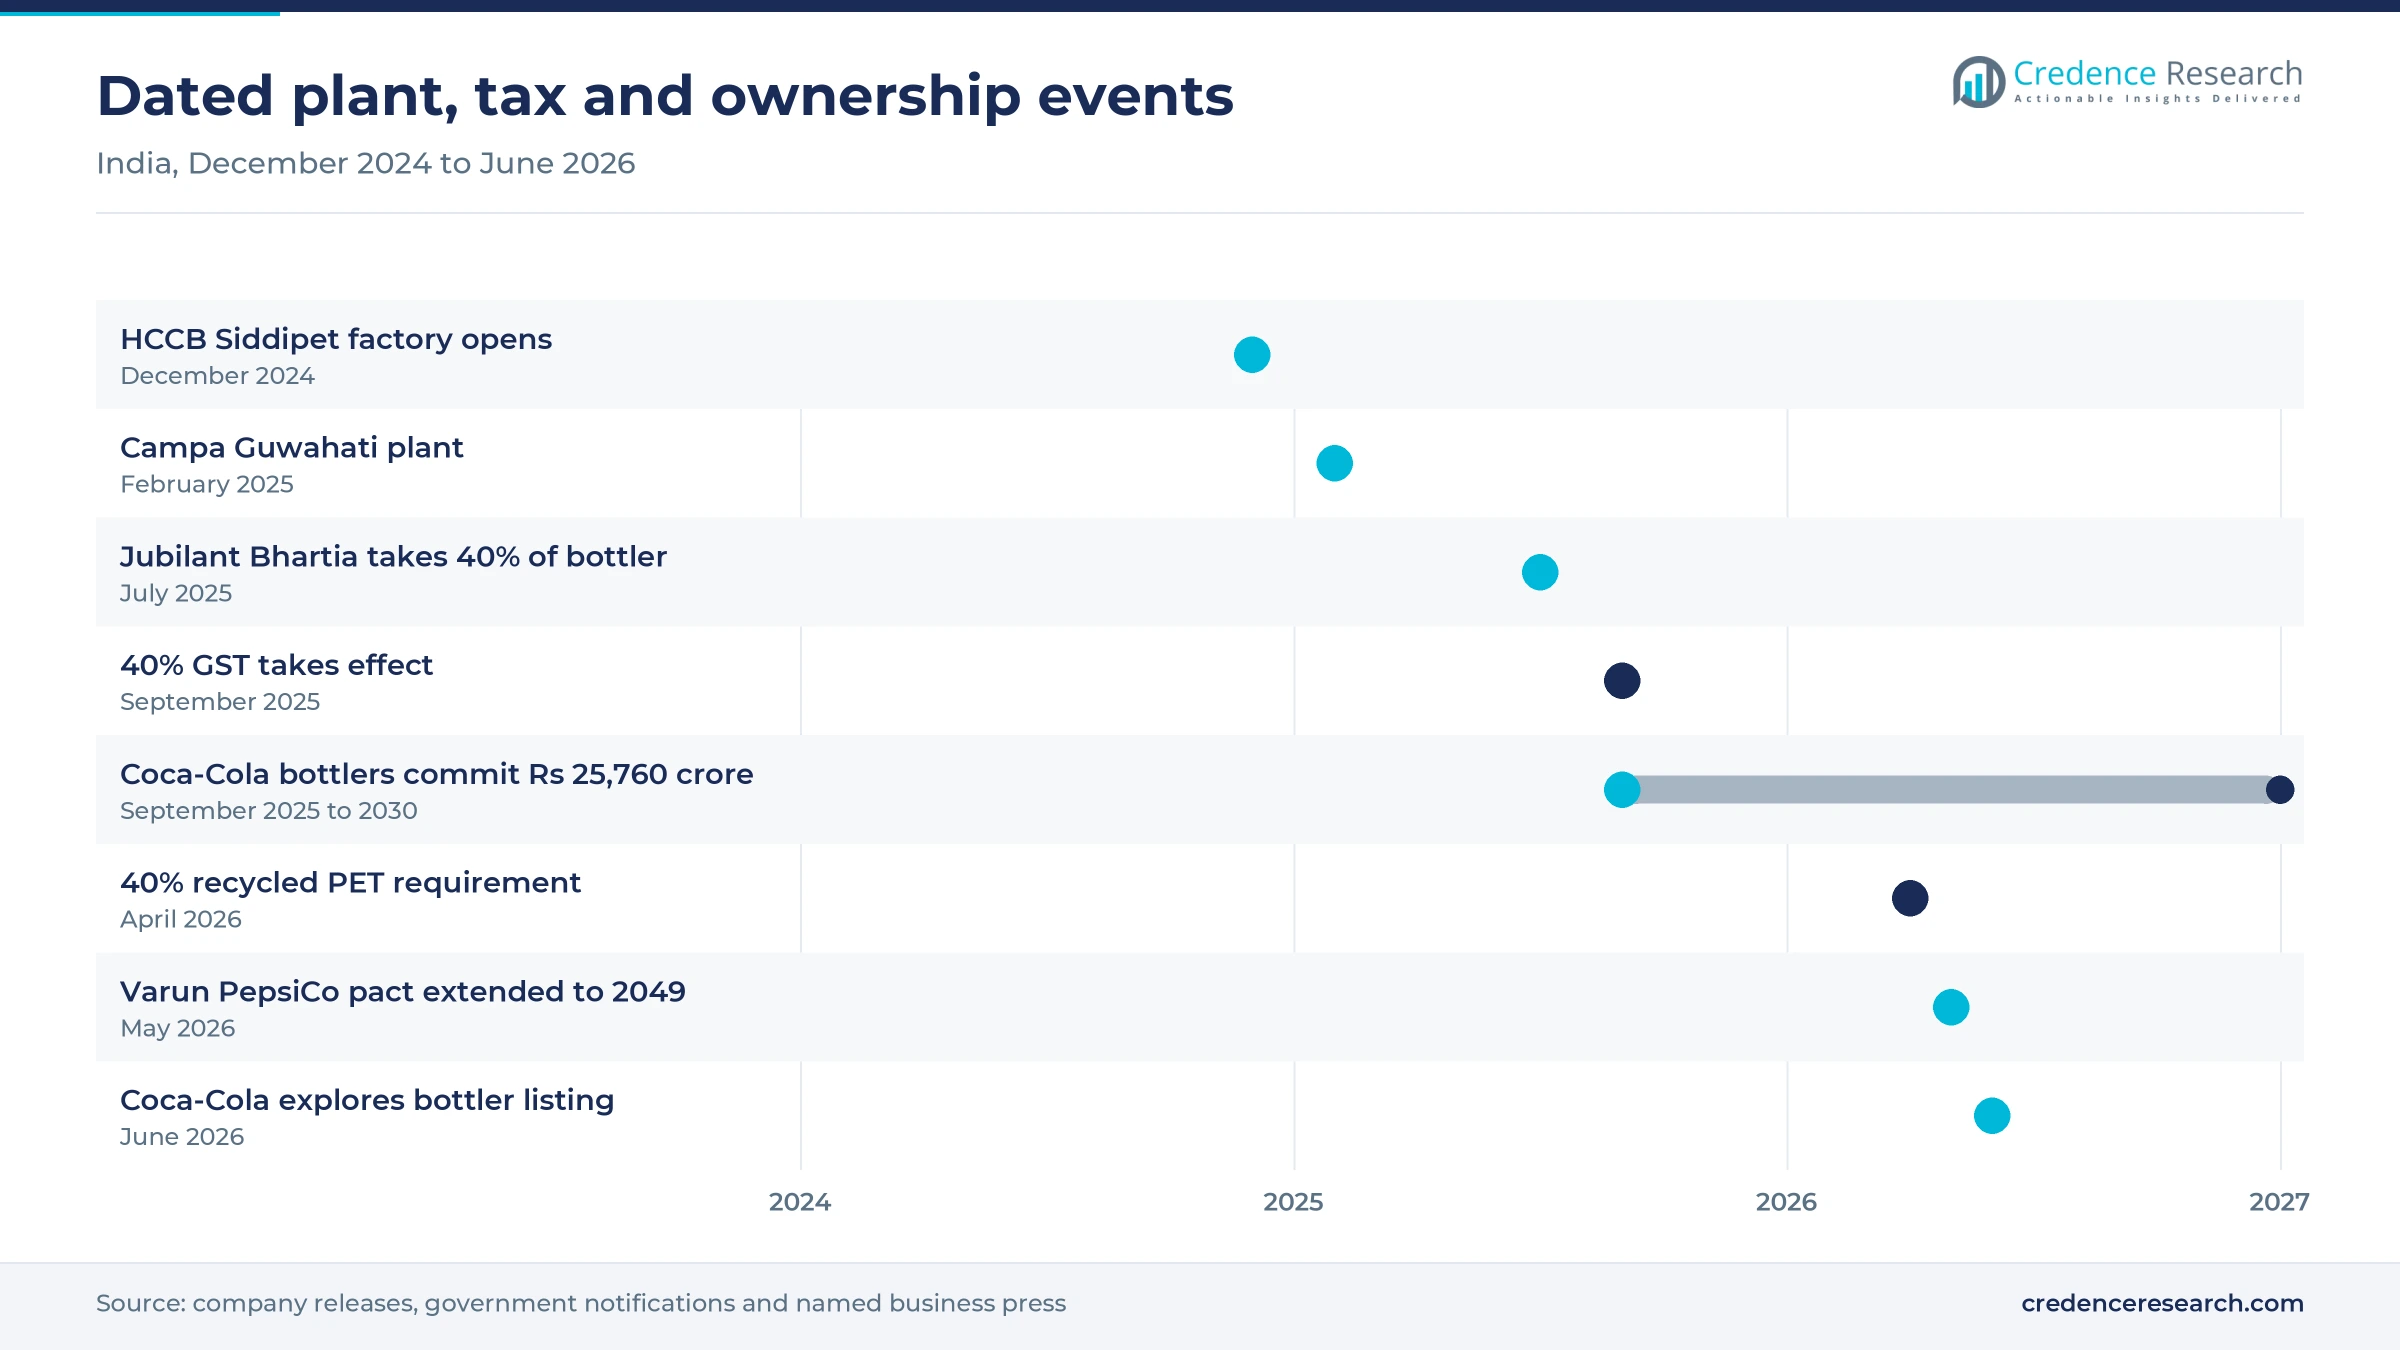
Plants, tax and ownership changes marked 2024 to 2026
| Development | Status and market relevance |
|---|---|
| In December 2024, Hindustan Coca-Cola Beverages inaugurated its Siddipet factory in Telangana with seven lines and a planned Rs 2,091 crore outlay. | Operating; adds southern capacity for sparkling brands |
| In July 2025, Jubilant Bhartia Group acquired a two-fifths stake in Hindustan Coca-Cola Holdings, the parent of the bottler. | Completed; moves bottling ownership toward Indian investors |
| In September 2025, the GST Council moved carbonated beverages to a flat 40% slab in place of 28% plus a 12% cess, effective Sept. 22, 2025. | In force; total tax unchanged, while juice drinks fell to 5% |
| In May 2026, Varun Beverages signed a revised PepsiCo India agreement that extends its franchise term to April 30, 2049. | Signed; secures long-term bottling rights for Pepsi brands |
| In June 2026, The Coca-Cola Company said it is exploring a 2027 public listing of Hindustan Coca-Cola Holdings in India. | Under study; subject to market conditions and regulatory approvals |
Lighter bottles and cooler supply shape plant economics
- Ultra-lightweight PET bottles reduce resin use per pack, and Coca-Cola credited them with supporting India volume in the first quarter of 2026.
- Greenfield high-speed lines lower unit cost, as the seven lines at the Siddipet factory of Hindustan Coca-Cola Beverages show in a single southern site.
- Visi-cooler manufacturing moves in-house for Varun Beverages through its White Peak Refrigeration joint venture with Everest International, announced in September 2025.
- Food-grade recycled PET lines become necessary as recycled content targets step up by 10 percentage points a year through 2028-29.
Need a Custom Version of This Report?
Tailor the scope, geography, or segments to your exact requirements.
- Custom geography or segment scope
- Direct access to our analyst team
Bottlers and low-price challengers contest kirana shelves
Competition in carbonated soft drinks turns on bottling reach, cooler placement and the price of the entry pack. Coca-Cola works through Hindustan Coca-Cola Beverages and franchise bottlers such as SLMG Beverages and Kandhari, while PepsiCo relies on Varun Beverages, whose rights now run to 2049. Hindustan Coca-Cola Beverages runs 14 plants across 10 states with eight co-packers, according to The Coca-Cola Company, which gives it scale that newer entrants must rent or build. Reliance Consumer Products competes on price, with its products priced about one-fifth to two-fifths below rival brands, and on higher retailer margins, using co-investment partners rather than wholly owned plants. Archian Foods takes a different route by leading on a cumin taste and adding contract bottlers near demand centers. Parle Agro holds the fruit-plus-fizz niche through its long-running Appy Fizz brand. In packaging, beverage packaging supply has become a competitive factor since 2026 shortages hit cans first.
Companies profiled and their roles in this market
| Company | Type | Role in the market |
|---|---|---|
| Hindustan Coca-Cola Beverages Pvt. Ltd. | Bottler | 14 plants across 10 states; bottles Coca-Cola, Thums Up, Sprite, Fanta and Limca |
| Coca-Cola India Pvt. Ltd. | Brand owner | Owns Thums Up, Sprite and Coke Zero Sugar; sets pack and price architecture |
| PepsiCo India Holdings Pvt. Ltd. | Brand owner | Owns Pepsi, Mountain Dew and Pepsi No-Sugar, with bottling held by Varun Beverages |
| Varun Beverages Ltd. | Bottler | PepsiCo franchise through 2049; four greenfield Indian plants opened in 2025 |
| Reliance Consumer Products Ltd. | Challenger brand owner | Campa at Rs 10 for 200 ml; plants at Guwahati, Begusarai and Vijayapura |
| Archian Foods Pvt. Ltd. | Regional challenger | Lahori Zeera, Nimboo and Shikanji; plants at Lucknow, Mohali and Vapi |
| Parle Agro Pvt. Ltd. | Fruit-fizz specialist | Appy Fizz and B-Fizz, keeping a Rs 10 pack of 160 ml |
| Sosyo Hajoori Beverages Pvt. Ltd. | Regional producer | Founded in 1923; Gujarat base; 50% partner of Reliance Consumer Products |
Distribution depth will decide who holds the Rs 10 shopper
Credence Research's view is that the next decade favors whoever keeps a Rs 10 pack profitable without weakening the Rs 20 and Rs 40 ladders. Incumbents still control cooler networks and plants, yet their combined share has already slipped by about eight points in one year. Reliance needs national availability to reach its stated 25% goal, which depends on the plants announced for Bihar and Karnataka. Sugar-free formulas are the more durable value story, because they hold pricing better than low-price colas and suit stricter labeling expected from FSSAI. Weather will continue to swing individual years, as the 2025 monsoon showed.
Modeled values checked against public company disclosures
The report uses 2025 as the base year and 2026 to 2035 as the forecast period. Market values for carbonated soft drinks come from the Credence Research model, checked against public volume, pack and price disclosures from listed bottlers. Regional, segment and tier shares and growth rates are Credence Research estimates. Sources include government statistics from the Ministry of Statistics, tax and environment rule coverage, company releases, earnings calls and named business press. No interviews or surveys were conducted for this edition of the report.
Steady value growth with share moving toward new formats
The value of carbonated soft drinks rises from USD 6.83 billion in 2026 to USD 10.46 billion by 2035, a modest pace because low-price packs offset much of the volume gain. New capacity from the 2024 to 2026 plant wave should be absorbed gradually, since Varun Beverages said it had roughly 50% more capacity than current use in early 2026. Recycled content rules, the 2027 listing plan for the Coca-Cola bottler and any change to the current tax rate are the main dated events to watch. North India, at 28.4% of 2025 value, remains the main test of whether new plants lift regional demand.
Frequently Asked Questions
How big is the India carbonated soft drinks market?
Which product type leads the market?
Which product type grows the fastest?
Which region holds the largest share?
Which region grows the fastest?
How did the 2025 tax change affect carbonated drinks?
Who competes with Coca-Cola and PepsiCo in India?
Why are aluminum cans in short supply?
Table of Content
Chapter 1 Market Segmentation
- 1.1 Segmentation Framework
- 1.1.1 Product and Service Classification
- 1.1.2 Application and End-Use Classification
- 1.1.3 Technology and Solution Classification
- 1.1.4 Customer and Distribution Channel Classification
- 1.1.5 Geographic Segmentation
- 1.1.6 Market Segment Definitions and Boundaries
- 1.2 By Product Type
- 1.2.1 Cola Drinks
- 1.2.2 Lemon and Lime Drinks
- 1.2.3 Orange and Fruit-Flavoured Drinks
- 1.2.4 Spiced and Regional Flavours
- 1.2.5 Low- and Zero-Sugar Carbonated Drinks
- 1.3 By Price Tier
- 1.3.1 Economy
- 1.3.2 Mass Market
- 1.3.3 Premium
- 1.3.4 Super-Premium
- 1.4 By Packaging Format
- 1.4.1 PET Bottles
- 1.4.2 Returnable Glass Bottles
- 1.4.3 Aluminium Cans
- 1.4.4 Post-Mix and Fountain
Chapter 2 Introduction
- 2.1 Report Objectives and Scope
- 2.2 Product Definition and Industry Terminology
- 2.3 Market Inclusions and Exclusions
- 2.4 Research Process
- 2.4.1 Primary Research and Expert Interviews
- 2.4.2 Secondary Research and Source Review
- 2.4.3 Top-Down and Bottom-Up Estimation
- 2.4.4 Data Triangulation and Verification
- 2.5 Market Size Measurement Basis
- 2.5.1 2025: USD 6.49 billion → 2035: USD 10.46 billion
- 2.6 Historical and Forecast Reference Periods
- 2.6.1 Historical Period: 2018-2025
- 2.6.2 Base Year: 2025
- 2.6.3 Forecast Period: 2025-2035
- 2.7 Research Assumptions and Limitations
Chapter 3 Executive Summary
- 3.1 Market Snapshot and Key Findings
- 3.2 Base-Year Market Size, 2025
- 3.3 Forecast Market Size, 2035
- 3.4 Revenue and Volume Growth Outlook
- 3.5 Key Demand and Supply Indicators
- 3.6 Leading Market Segments
- 3.7 Fastest-Growing Market Opportunities
- 3.8 Regional Performance Highlights
- 3.9 Technology and Industry Transformation
- 3.10 Competitive Landscape Summary
- 3.11 Analyst View and Strategic Implications
Chapter 4 India Carbonated Soft Drinks Market Trends and Developments
- 4.1 Historical Industry Development, 2018-2025
- 4.2 Recent Market Trends and Developments
- 4.3 Demand and Customer Behavior Trends
- 4.4 Technology and Product Innovation
- 4.5 Artificial Intelligence, Automation and Digitalization
- 4.6 Local Manufacturing and Supply Chain Realignment
- 4.7 Industry Partnerships, Mergers and Acquisitions
- 4.8 Sustainability and Circular Economy Developments
- 4.9 Government and Private Sector Investment Trends
- 4.10 Emerging Business Models and Commercialization
- 4.11 Industry Developments and Announcements
Chapter 5 India Carbonated Soft Drinks Market Production, Supply and Demand Analysis
- 5.1 Demand Trend and Consumption Analysis, 2018-2025
- 5.2 Demand Forecast, 2025-2035
- 5.3 Production and Output Trend, 2018-2025
- 5.4 Production and Output Forecast, 2025-2035
- 5.5 Installed Capacity and Capacity Utilization
- 5.6 Company-Wise Production Plants and Statistics
- 5.6.1 Installed Production Capacity
- 5.6.2 Actual Production
- 5.6.3 Planned Capacity and Expansion Targets
- 5.7 Supply Chain Structure and Procurement Trends
- 5.8 Supply-Demand Gap and Bottlenecks
- 5.9 Import Dependence and Sourcing Structure
- 5.10 Contract Manufacturing and Outsourcing
- 5.11 Regional Supply and Demand Concentration
Chapter 6 India Carbonated Soft Drinks Market Pricing Analysis
- 6.1 Pricing Structure and Measurement
- 6.2 Historical Pricing Trends, 2018-2025
- 6.3 Pricing Outlook, 2025-2035
- 6.4 Average Selling Price and Unit Economics
- 6.5 Pricing by Product and Market Segment
- 6.6 Geographic Pricing Differences
- 6.7 Key Input, Energy, Labor and Logistics Costs
- 6.8 Contract Pricing and Purchasing Models
- 6.9 Pricing Sensitivity and Competitive Positioning
- 6.10 Price, Margin and Profitability Implications
Chapter 7 India Carbonated Soft Drinks Market Dynamics
- 7.1 Market Growth Drivers
- 7.1.1 Demand-Side Drivers
- 7.1.2 Technology and Innovation Drivers
- 7.1.3 Infrastructure and Investment Drivers
- 7.1.4 Regulatory and Policy Drivers
- 7.2 Market Restraints
- 7.2.1 Cost and Affordability Constraints
- 7.2.2 Technology and Adoption Barriers
- 7.2.3 Supply Chain and Operational Constraints
- 7.3 Market Challenges
- 7.3.1 Competitive Pressure and Margin Erosion
- 7.3.2 Skills, Infrastructure and Implementation Gaps
- 7.4 Emerging Market Opportunities
- 7.5 Market Dynamics Impact and Time-Horizon Assessment
Chapter 8 India Carbonated Soft Drinks Value Chain Analysis
- 8.1 Industry Value Chain Overview
- 8.2 Upstream Suppliers and Critical Inputs
- 8.3 Technology and Component Providers
- 8.4 Manufacturing or Service Delivery
- 8.5 Distribution, Channel Partners and Integrators
- 8.6 Downstream Applications and End Users
- 8.7 Value Addition and Profit Pools
- 8.8 Vertical Integration and Outsourcing
- 8.9 Supplier Concentration and Risk
- 8.10 Supply Chain Localization and Resilience
Chapter 9 India Carbonated Soft Drinks Market Regulations and Policies
- 9.1 Relevant Laws, Standards and Compliance Frameworks
- 9.2 Product, Service, Safety and Quality Requirements
- 9.3 Government Policies, Incentives and Subsidies
- 9.4 Imports, Exports and Trade Barriers
- 9.5 Public Procurement and Local Content Requirements
- 9.6 Environmental and Sustainability Compliance
- 9.7 Upcoming Policy Changes and Market Implications
Chapter 10 India Carbonated Soft Drinks Market Hotspots and Opportunities
- 10.1 Market Opportunity Mapping and Growth Hotspots
- 10.2 High-Growth Applications and Customer Groups
- 10.3 Underserved Markets and White-Space Opportunities
- 10.4 Emerging Technology and Product Opportunities
- 10.5 New Capacity and Investment Hotspots
- 10.6 Market Entry and Expansion Opportunities
- 10.7 Distribution and Partnership Opportunities
- 10.8 Near-Term and Long-Term Commercial Potential
- 10.9 Opportunity Attractiveness and Execution Risks
Chapter 11 India Carbonated Soft Drinks Market Outlook, 2025-2035
- 11.1 Market Size and Analysis
- 11.1.1 Revenue (Market Measurement: 2025: USD 6.49 billion → 2035: USD 10.46 billion)
- 11.1.2 Market Volume and Quantity Sold
- 11.1.3 Historical Market Size, 2018-2025
- 11.1.4 Base-Year Market Size, 2025
- 11.2 Market Forecast, 2025-2035
- 11.2.1 Revenue Forecast to 2035
- 11.2.2 Volume Forecast to 2035
- 11.2.3 CAGR and Year-on-Year Growth
- 11.2.4 Incremental Revenue Opportunity
- 11.3 Forecast Assumptions and Scenario Analysis
- 11.3.1 Base-Case Forecast
- 11.3.2 Optimistic and Conservative Scenarios
- 11.3.3 Technology, Pricing and Policy Sensitivities
- 11.4 Market Attractiveness and Growth Outlook
Chapter 12 India Carbonated Soft Drinks Market Segmentation and Outlook
- 12.1 Segmentation Summary and Market Shares, 2025
- 12.2 Largest and Fastest-Growing Segments
- 12.3 By Product Type - Market Size and Forecast, 2025-2035
- 12.3.1 Segment Definition and Scope
- 12.3.2 Historical Market Size, 2018-2025
- 12.3.3 Revenue Forecast, 2025-2035
- 12.3.4 Volume Forecast, 2025-2035
- 12.3.5 Base-Year Market Share, 2025
- 12.3.6 Segment CAGR and Growth Drivers
- 12.3.7 Subsegment Market Size and Forecast
- 12.3.7.1 Cola Drinks
- 12.3.7.2 Lemon and Lime Drinks
- 12.3.7.3 Orange and Fruit-Flavoured Drinks
- 12.3.7.4 Spiced and Regional Flavours
- 12.3.7.5 Low- and Zero-Sugar Carbonated Drinks
- 12.3.8 Subsegment Pricing and Adoption Trends
- 12.3.9 Leading Suppliers and Competition
- 12.3.10 Regional Demand and Opportunities
- 12.4 By Price Tier - Market Size and Forecast, 2025-2035
- 12.4.1 Segment Definition and Scope
- 12.4.2 Historical Market Size, 2018-2025
- 12.4.3 Revenue Forecast, 2025-2035
- 12.4.4 Volume Forecast, 2025-2035
- 12.4.5 Base-Year Market Share, 2025
- 12.4.6 Segment CAGR and Growth Drivers
- 12.4.7 Subsegment Market Size and Forecast
- 12.4.7.1 Economy
- 12.4.7.2 Mass Market
- 12.4.7.3 Premium
- 12.4.7.4 Super-Premium
- 12.4.8 Subsegment Pricing and Adoption Trends
- 12.4.9 Leading Suppliers and Competition
- 12.4.10 Regional Demand and Opportunities
- 12.5 By Packaging Format - Market Size and Forecast, 2025-2035
- 12.5.1 Segment Definition and Scope
- 12.5.2 Historical Market Size, 2018-2025
- 12.5.3 Revenue Forecast, 2025-2035
- 12.5.4 Volume Forecast, 2025-2035
- 12.5.5 Base-Year Market Share, 2025
- 12.5.6 Segment CAGR and Growth Drivers
- 12.5.7 Subsegment Market Size and Forecast
- 12.5.7.1 PET Bottles
- 12.5.7.2 Returnable Glass Bottles
- 12.5.7.3 Aluminium Cans
- 12.5.7.4 Post-Mix and Fountain
- 12.5.8 Subsegment Pricing and Adoption Trends
- 12.5.9 Leading Suppliers and Competition
- 12.5.10 Regional Demand and Opportunities
- 12.6 Segment Growth Comparison
- 12.7 Segment Attractiveness and Priority Matrix
Chapter 13 India Carbonated Soft Drinks Geographic Market Outlook, 2025-2035
- 13.1 Domestic Market Distribution and Demand Clusters
- 13.2 State- or Province-Wise Market Size and Forecast, 2025-2035
- 13.3 City and Metropolitan Market Outlook
- 13.4 Industrial, Manufacturing and Commercial Clusters
- 13.5 Geographic Concentration of Key End Users
- 13.6 Local Pricing and Purchasing Differences
- 13.7 Domestic Production Facilities and Capacity Map
- 13.8 Local Infrastructure and Project Pipeline
- 13.9 State-Level Policy and Incentive Differences
- 13.10 Subnational Investment Hotspots and Opportunities
- 13.11 Distribution and Logistics Networks
- 13.12 Domestic Competitive Footprint
Chapter 14 India Carbonated Soft Drinks Technology, Innovation and Sustainability Outlook
- 14.1 Technology Landscape and Maturity
- 14.2 Product, Process and Service Innovation
- 14.3 AI, Automation and Digital Tools in the Industry
- 14.4 Technology Adoption and Performance Benchmarking
- 14.5 Innovation Pipeline and R&D Investment
- 14.6 Patent and Intellectual Property Trends
- 14.7 Energy Efficiency and Resource Management
- 14.8 Sustainability, Recycling and Circularity
- 14.9 Technology Roadmap, 2025-2035
- 14.10 Risks of Obsolescence and Technology Substitution
Chapter 15 India Carbonated Soft Drinks Market Key Strategic Imperatives
- 15.1 Growth and Market Entry Priorities
- 15.2 High-Return Products and Segments
- 15.3 Pricing, Profitability and Cost Optimization
- 15.4 Technology Investment and Product Differentiation
- 15.5 Supply Chain Localization and Resilience
- 15.6 Distribution and Customer Acquisition
- 15.7 Partnership, Acquisition and Capacity Strategy
- 15.8 Regional Expansion Priorities
- 15.9 Short-, Medium- and Long-Term Actions
Chapter 16 Competition Outlook
- 16.1 Industry Competition Characteristics
- 16.2 Market Structure and Concentration
- 16.3 Market Share and Competitive Positioning, 2025
- 16.4 Company-Wise Revenue and Product Benchmarking
- 16.5 Production and Service Capacity Benchmarking
- 16.6 Technology, Pricing and Differentiation
- 16.7 Regional Footprint and Distribution Strength
- 16.8 Mergers, Acquisitions and Strategic Alliances
- 16.9 New Entrants and Competitive Threats
- 16.10 Porter's Five Forces and Industry Attractiveness
- 16.11 Competitive Outlook, 2025-2035
Chapter 17 Company Profiles
- 17.1 Company Coverage and Selection Criteria
- 17.2 Coca-Cola India Pvt. Ltd.
- 17.2.1 Business Description
- 17.2.2 Company Ownership and Geographic Presence
- 17.2.3 Product and Service Portfolio
- 17.2.4 Manufacturing and Operating Footprint
- 17.2.5 Production Capacity and Expansion Plans
- 17.2.6 Financial Performance and Investment
- 17.2.7 Market Share and Competitive Position
- 17.2.8 Technology and Innovation Capabilities
- 17.2.9 Strategic Alliances or Partnerships
- 17.2.10 Recent Developments
- 17.2.11 Growth Strategy and Outlook
- 17.3 PepsiCo India Holdings Pvt. Ltd.
- 17.4 Varun Beverages Ltd.
- 17.5 Hindustan Coca-Cola Beverages Pvt. Ltd.
- 17.6 Reliance Consumer Products Ltd.
- 17.7 Parle Agro Pvt. Ltd.
- 17.8 Archian Foods Pvt. Ltd.
- 17.9 Kalley Beverages Pvt. Ltd.
- 17.10 Sosyo Hajoori Beverages Pvt. Ltd.
- 17.11 Jayanti Group
- 17.12 Other Relevant Market Participants
Note: Every listed company is profiled on the structure shown under the first company. The company list is preliminary and may change based on research findings, market developments, data availability and client requirements.
Chapter 18 Disclaimer
- 18.1 Research and Forecast Disclaimer
- 18.2 Data Source and Estimation Limitations
Note: The depth of individual sections depends on data availability for this market. Volume, capacity, trade and other unit-based metrics are included where applicable.

