
Single-use supplies anchor hospital infection control
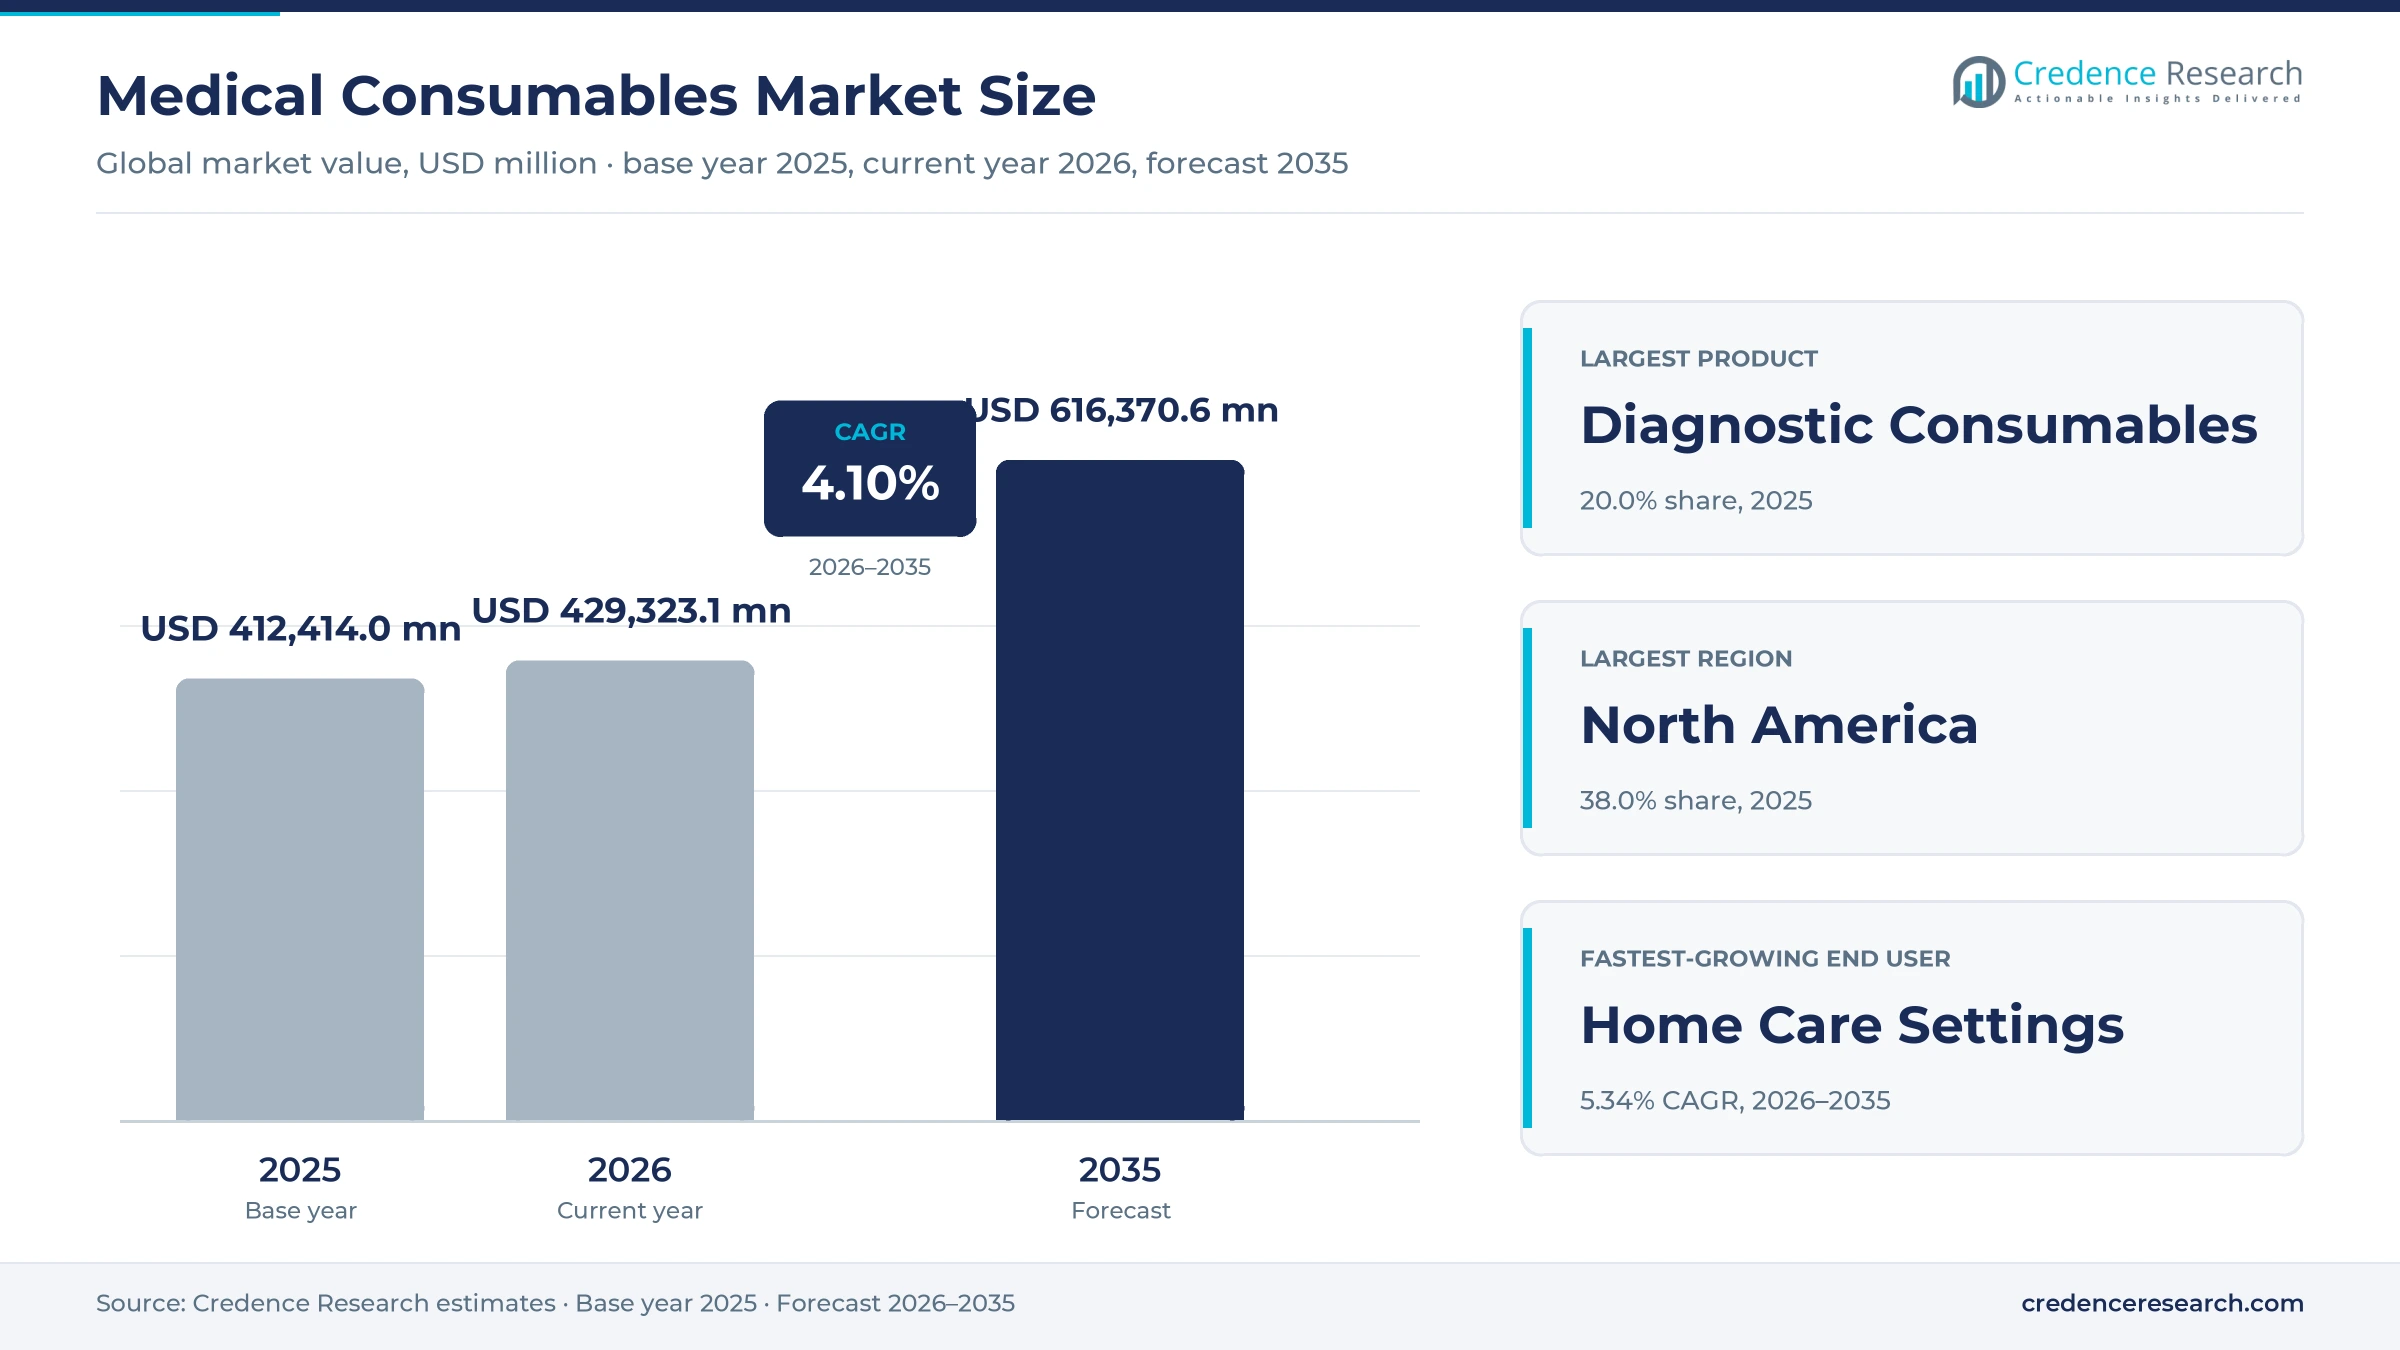
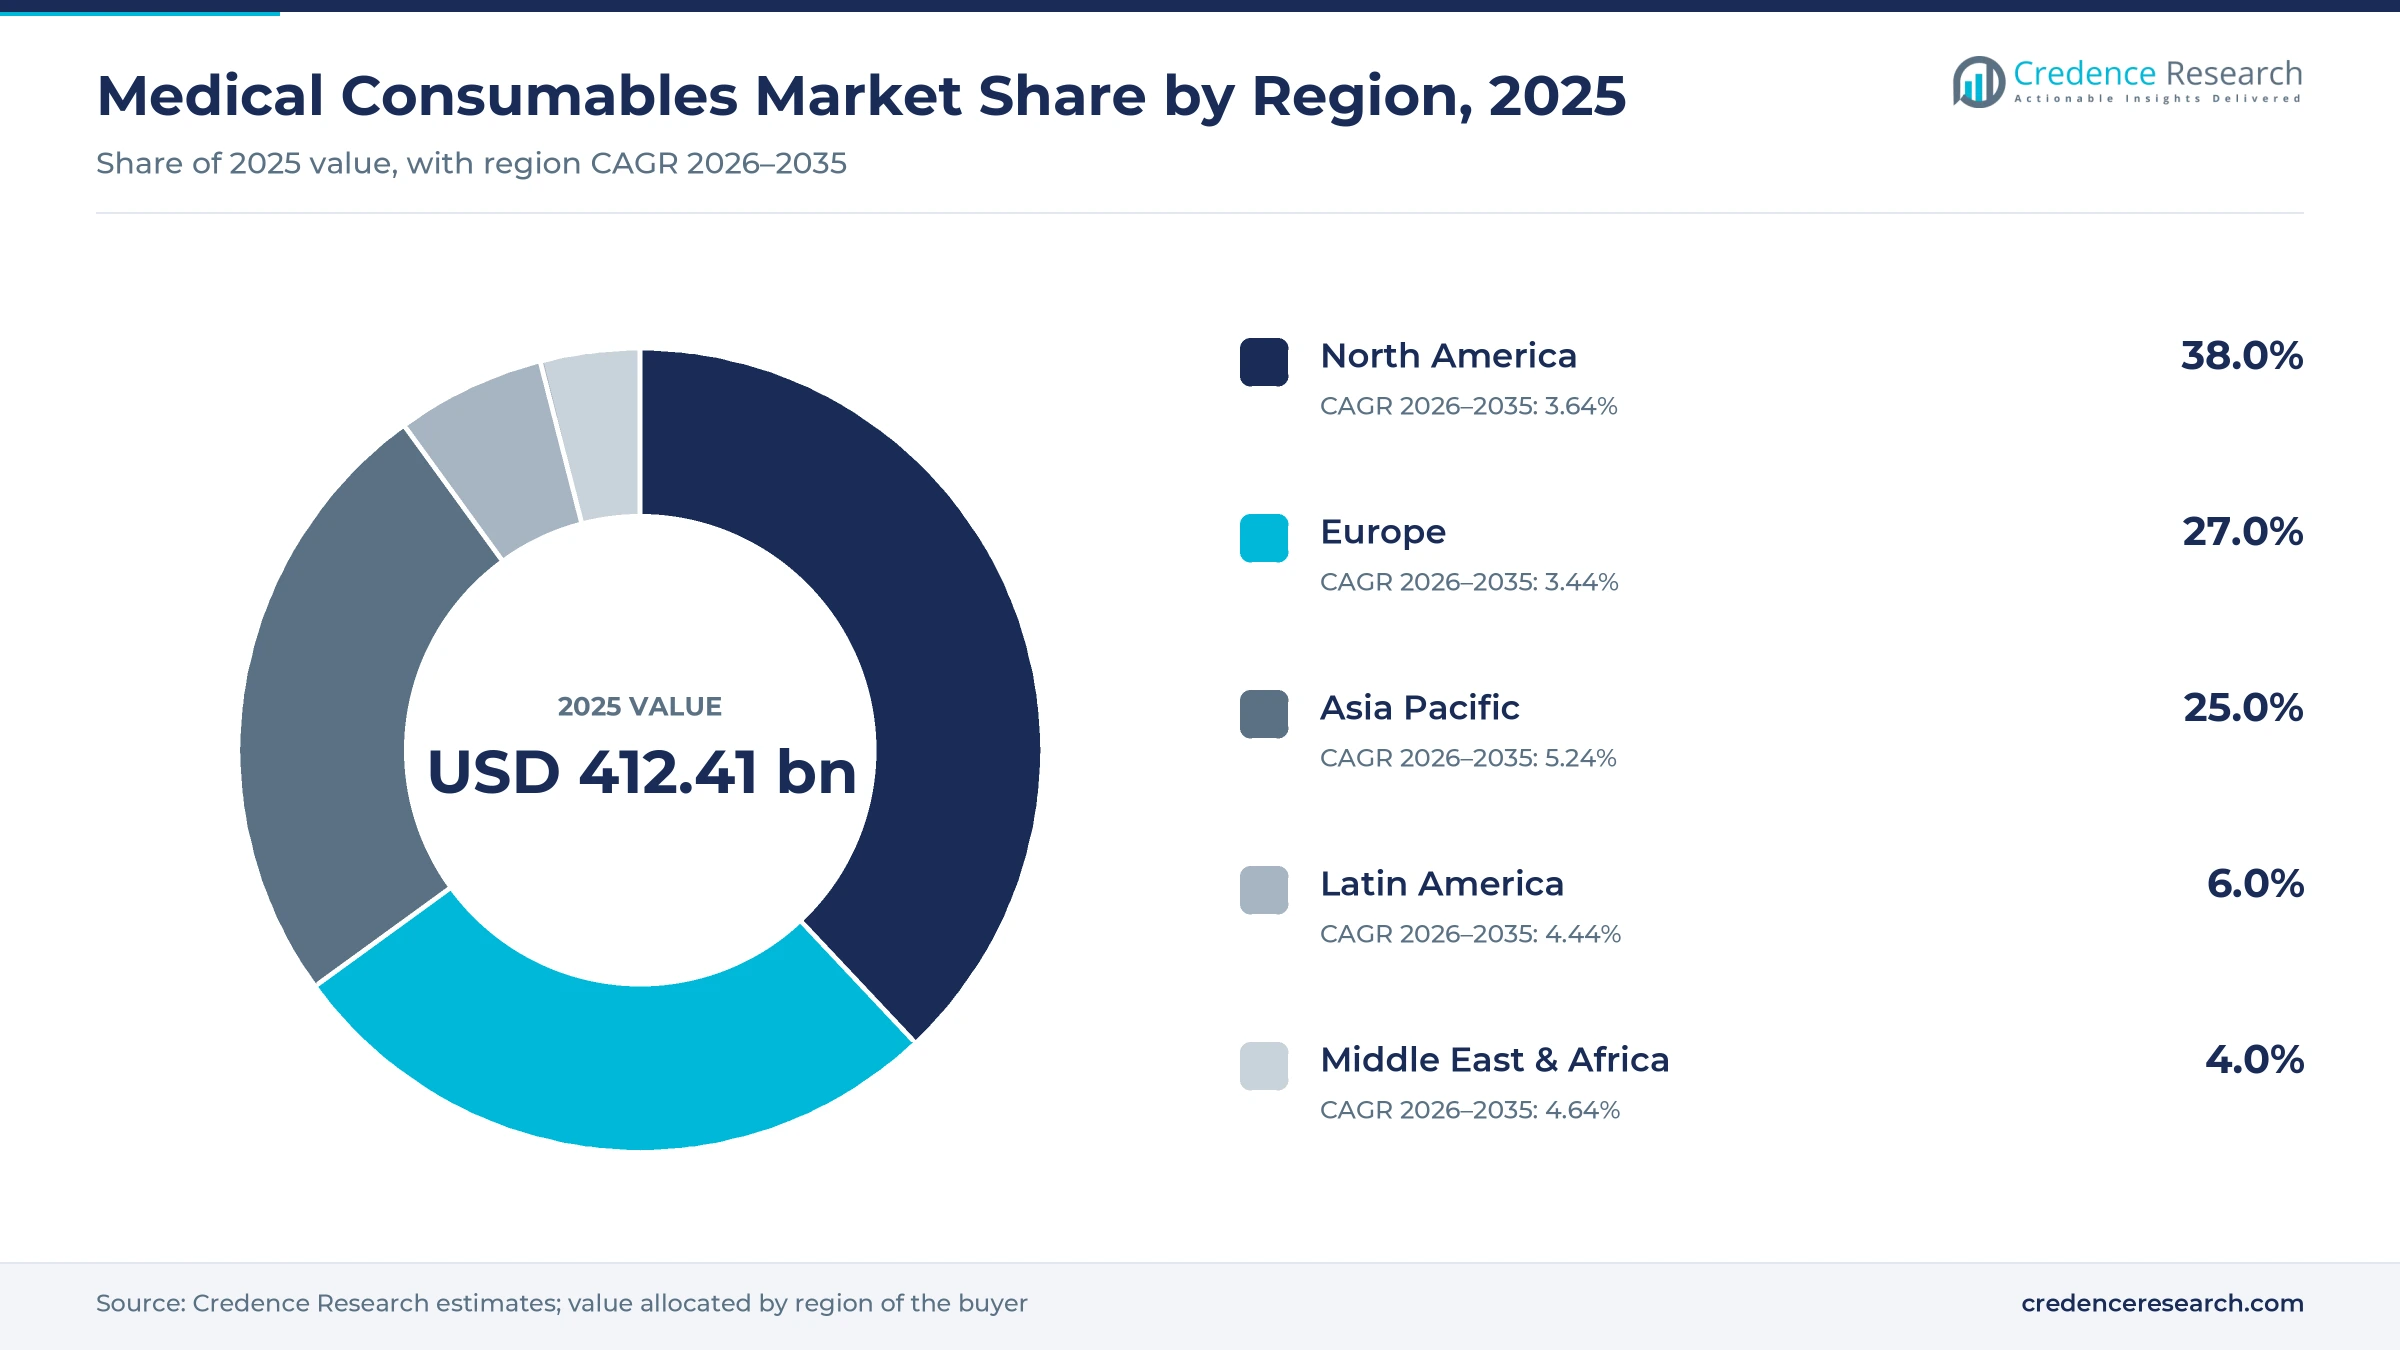
The global medical consumables market was valued at USD 412.41 billion in 2025 and is projected to increase from USD 429.32 billion in 2026 to USD 616.37 billion by 2035, registering a CAGR of 4.10% during 2026–2035. Demand comes from aging populations, more surgical procedures, chronic wounds, kidney failure and incontinence, and from hospital programs that rely on single-use products to prevent infections. North America held the largest regional share, 38.0% in 2025, because U.S. hospitals use large volumes of gloves, dressings, syringes and diagnostic supplies per patient. Asia Pacific is the fastest-growing region at 5.24% a year, as China, India and Southeast Asia add hospital beds and insurance coverage. The commercial picture changed in September 2024, when the United States finalized higher tariffs on syringes, needles and gloves imported from China. As a result, buyers are spreading orders across more supplier countries and paying closer attention to quality documentation.
Which single-use products and care settings does this analysis cover?
The analysis counts single-use and limited-use products consumed during patient care, including sterilization supplies, hand sanitizers, wound dressings, diagnostic supplies, respiratory and dialysis disposables, drug delivery products, incontinence products, gloves and masks. Values reflect manufacturer selling prices, and hospitals buy most of these items through group purchasing contracts and distributor agreements.
Capital equipment such as infusion pumps, dialysis machines and analyzers sits outside this scope, along with reusable surgical instruments. The value chain runs from resin, rubber and nonwoven fabric suppliers through converters and brand owners to distributors, which deliver products to hospitals, surgical centers, clinics and patients treated at home.
Medical Consumables Market Insights
- The medical consumables market grows from USD 412.41 billion in 2025 to USD 616.37 billion by 2035, a 4.10% CAGR as aging patients and infection control needs raise product use per stay.
- North America held 38.0% of global single-use supply value in 2025, supported by high procedure volumes and strict infection control practice in U.S. hospitals.
- Diagnostic consumables led product types with 20.0% of 2025 value, while wound care consumables grow fastest at 4.83% a year through 2035.
- In September 2024, U.S. trade officials finalized tariff increases on Chinese syringes, needles and medical gloves, which pushes buyers toward wider supplier networks.
- In December 2025, Medline began trading on the Nasdaq Global Select Market, which gives the largest U.S. medical-surgical supplier public capital for expansion.
Diagnostic supplies lead as home care gains ground
Why do diagnostic supplies hold the largest product share?
Based on product, the market is categorized into sterilization consumables, hand sanitizers, wound care consumables, diagnostic consumables, respiratory supplies, drug delivery products, dialysis consumables, incontinence products, disposable gloves, disposable masks and others. Diagnostic Consumables led with a 20.0% share of 2025 value, because laboratories and clinics use tubes, swabs, test strips and reagent kits for every patient tested. Wound Care Consumables grow fastest at 4.83% a year, as diabetic ulcers and surgical wounds raise demand for advanced wound care dressings.
Why does plastic resin dominate material use?
Based on material, the market is categorized into plastic resin, non-woven materials, rubber, glass, metals, paper and others. Plastic Resin led with a 46.0% share of 2025 value, because syringes, tubing, catheters, containers and test devices are molded from polymers at low cost. Non-woven Materials grow fastest at 4.51% a year, as gowns, drapes, masks and absorbent products rely on nonwoven fabric. Rubber remains central to examination and surgical gloves used across hospital wards.
Where are single-use supplies consumed most often?
Based on end user, the market is categorized into hospitals, ambulatory surgical centers, specialty clinics, home care settings and others. Hospitals led with a 55.0% share of 2025 value, because inpatient stays and operating rooms consume the widest range of disposables. Home Care Settings grow fastest at 5.32% a year, as dialysis, wound care, ostomy and incontinence patients receive more treatment at home. Surgical centers add steady demand for drapes, gloves and kits.
| Segment Group | Leading Sub-segment | Share, 2025 | Fastest-growing Sub-segment | CAGR, 2026–2035 |
|---|---|---|---|---|
| By Product | Diagnostic Consumables | 20.0% | Wound Care Consumables | 4.83% |
| By Material | Plastic Resin | 46.0% | Non-woven Materials | 4.51% |
| By End User | Hospitals | 55.0% | Home Care Settings | 5.32% |
Request a Free Sample
Fill in your details and we'll send you a free sample report.
- Sample data tables & charts
- Research methodology
Aging, chronic disease and safety rules lift volumes
How does population aging raise single-use product volumes?
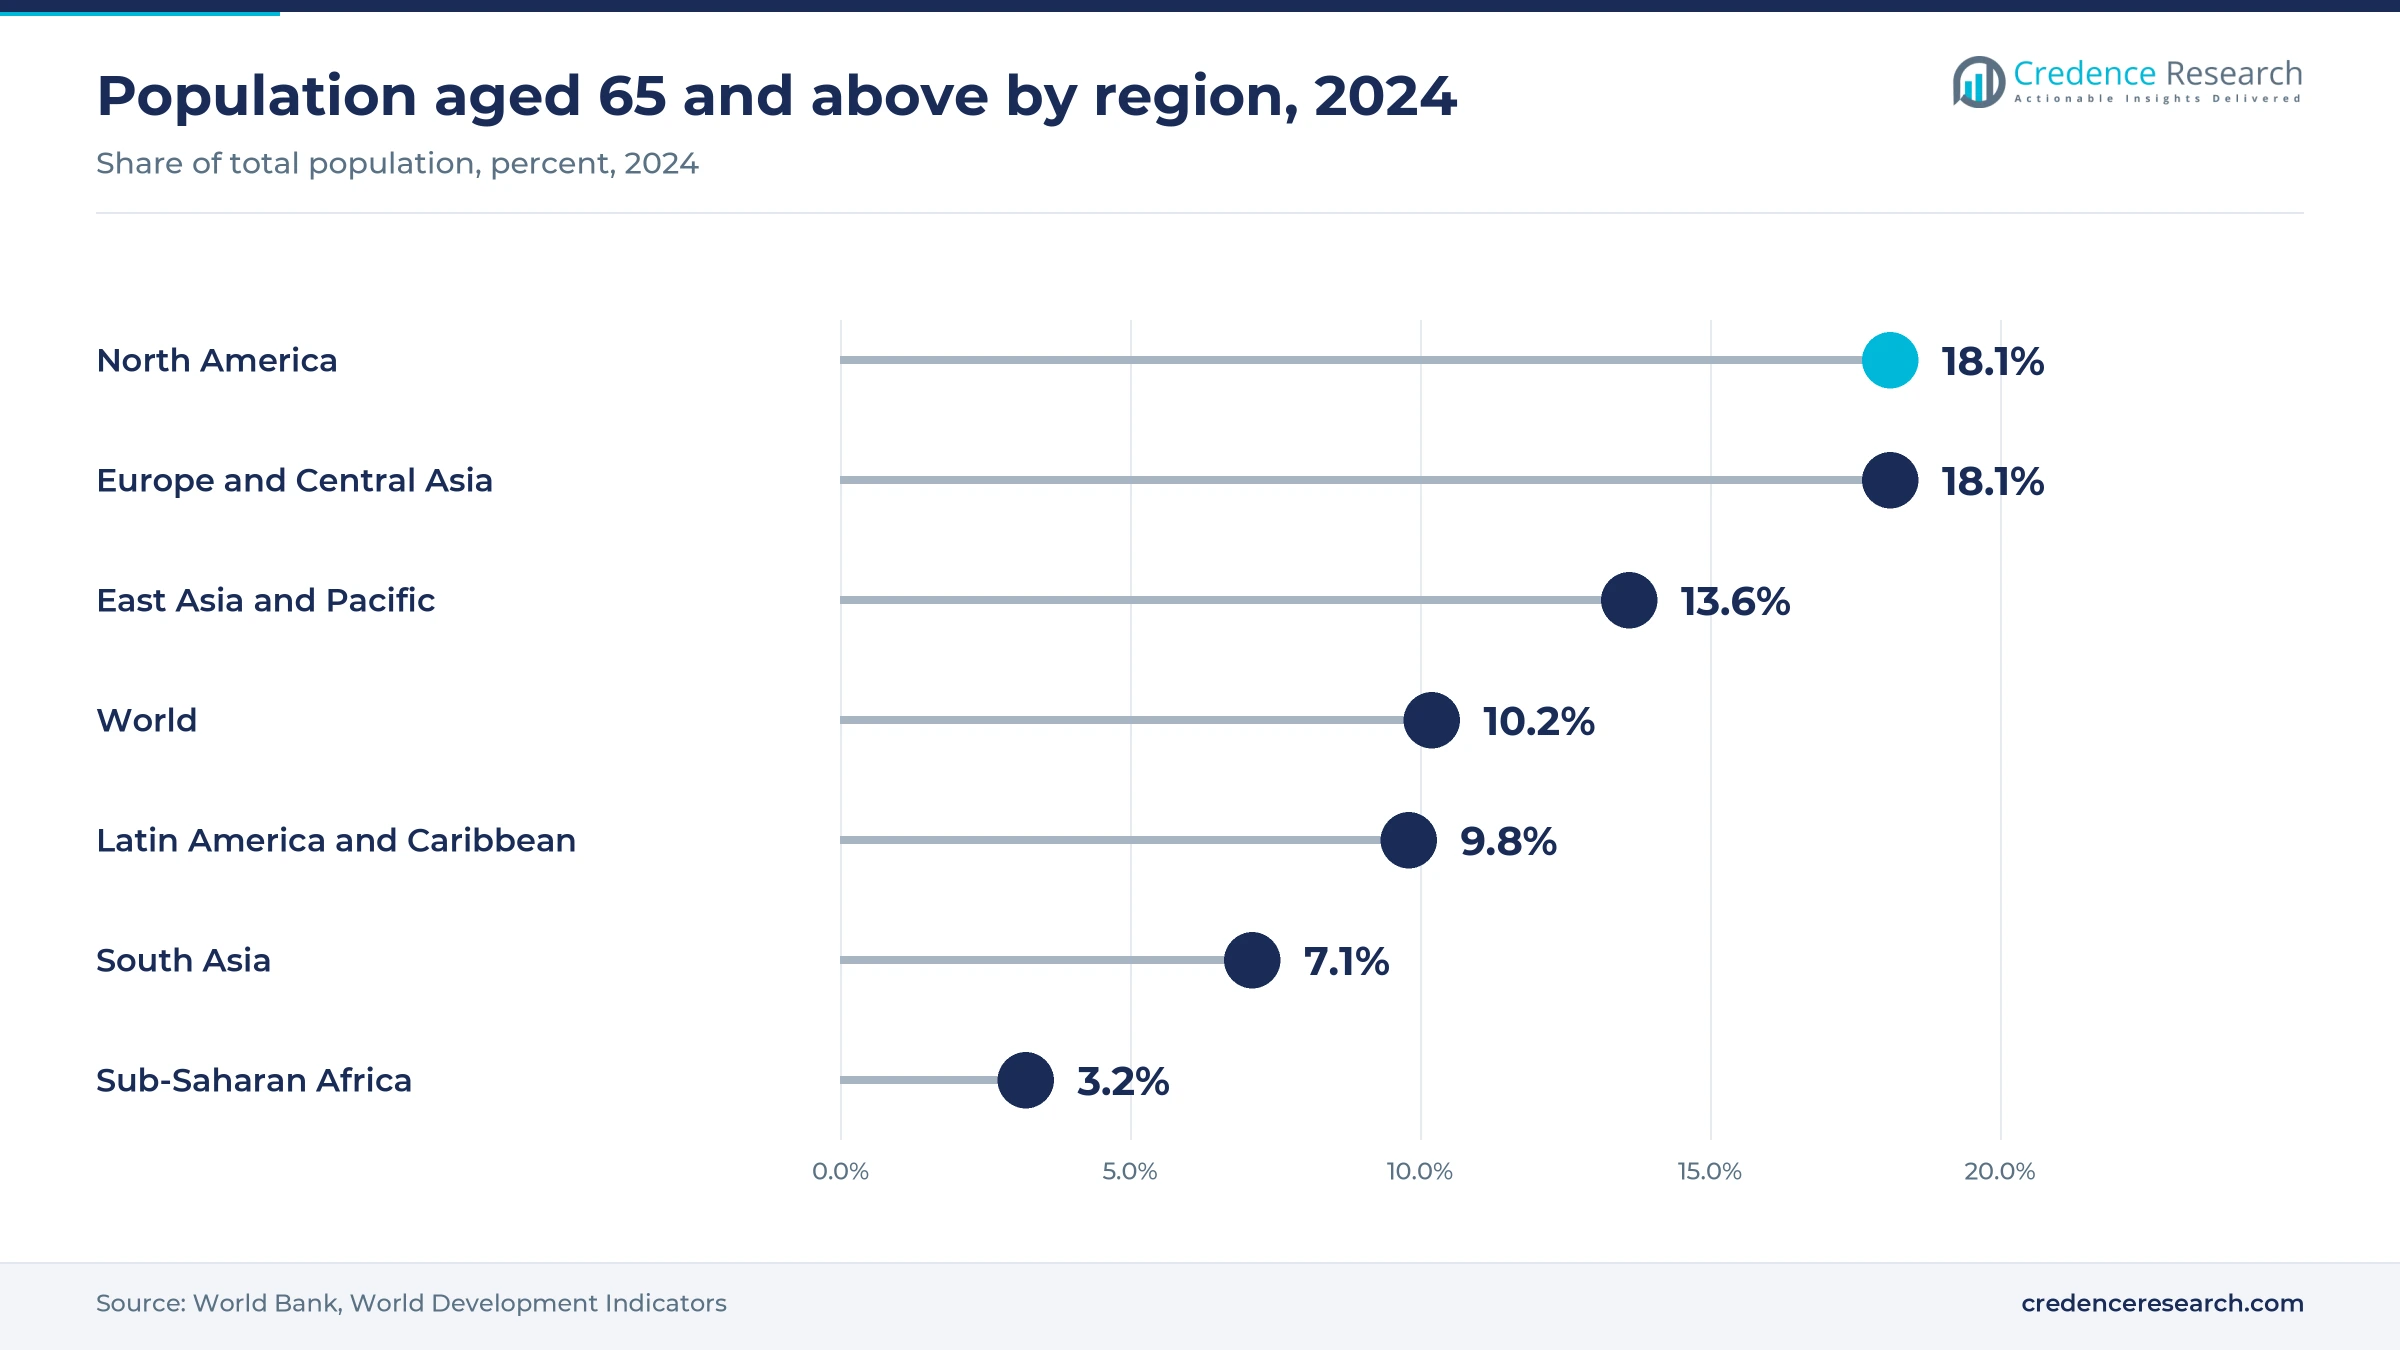
Population aging raises single-use product volumes, because older adults need more surgery, wound care, dialysis and continence support. World Bank data show that people aged 65 and above made up 10.2% of the global population in 2024, and the share reached 18.1% in North America. This demographic shift expands demand for incontinence care products, catheters and pressure ulcer dressings. As a result, aging regions sustain steady volume growth even when hospital budgets stay tight.
Why do infection control programs sustain disposable use?
Infection control programs sustain disposable use, because single-use gloves, masks, drapes and sanitizers reduce transmission between patients and staff. The World Health Organization reported in November 2024 that 71% of countries had an active infection prevention program, yet only 6% met all minimum requirements. The same report noted that nearly a quarter of countries faced protective equipment shortages in 2023. The agency also cited estimates of 136 million antibiotic-resistant health care-associated infections each year. In turn, governments and hospitals keep investing in reliable supplies of protective products.
How do chronic disease and kidney failure add recurring demand?
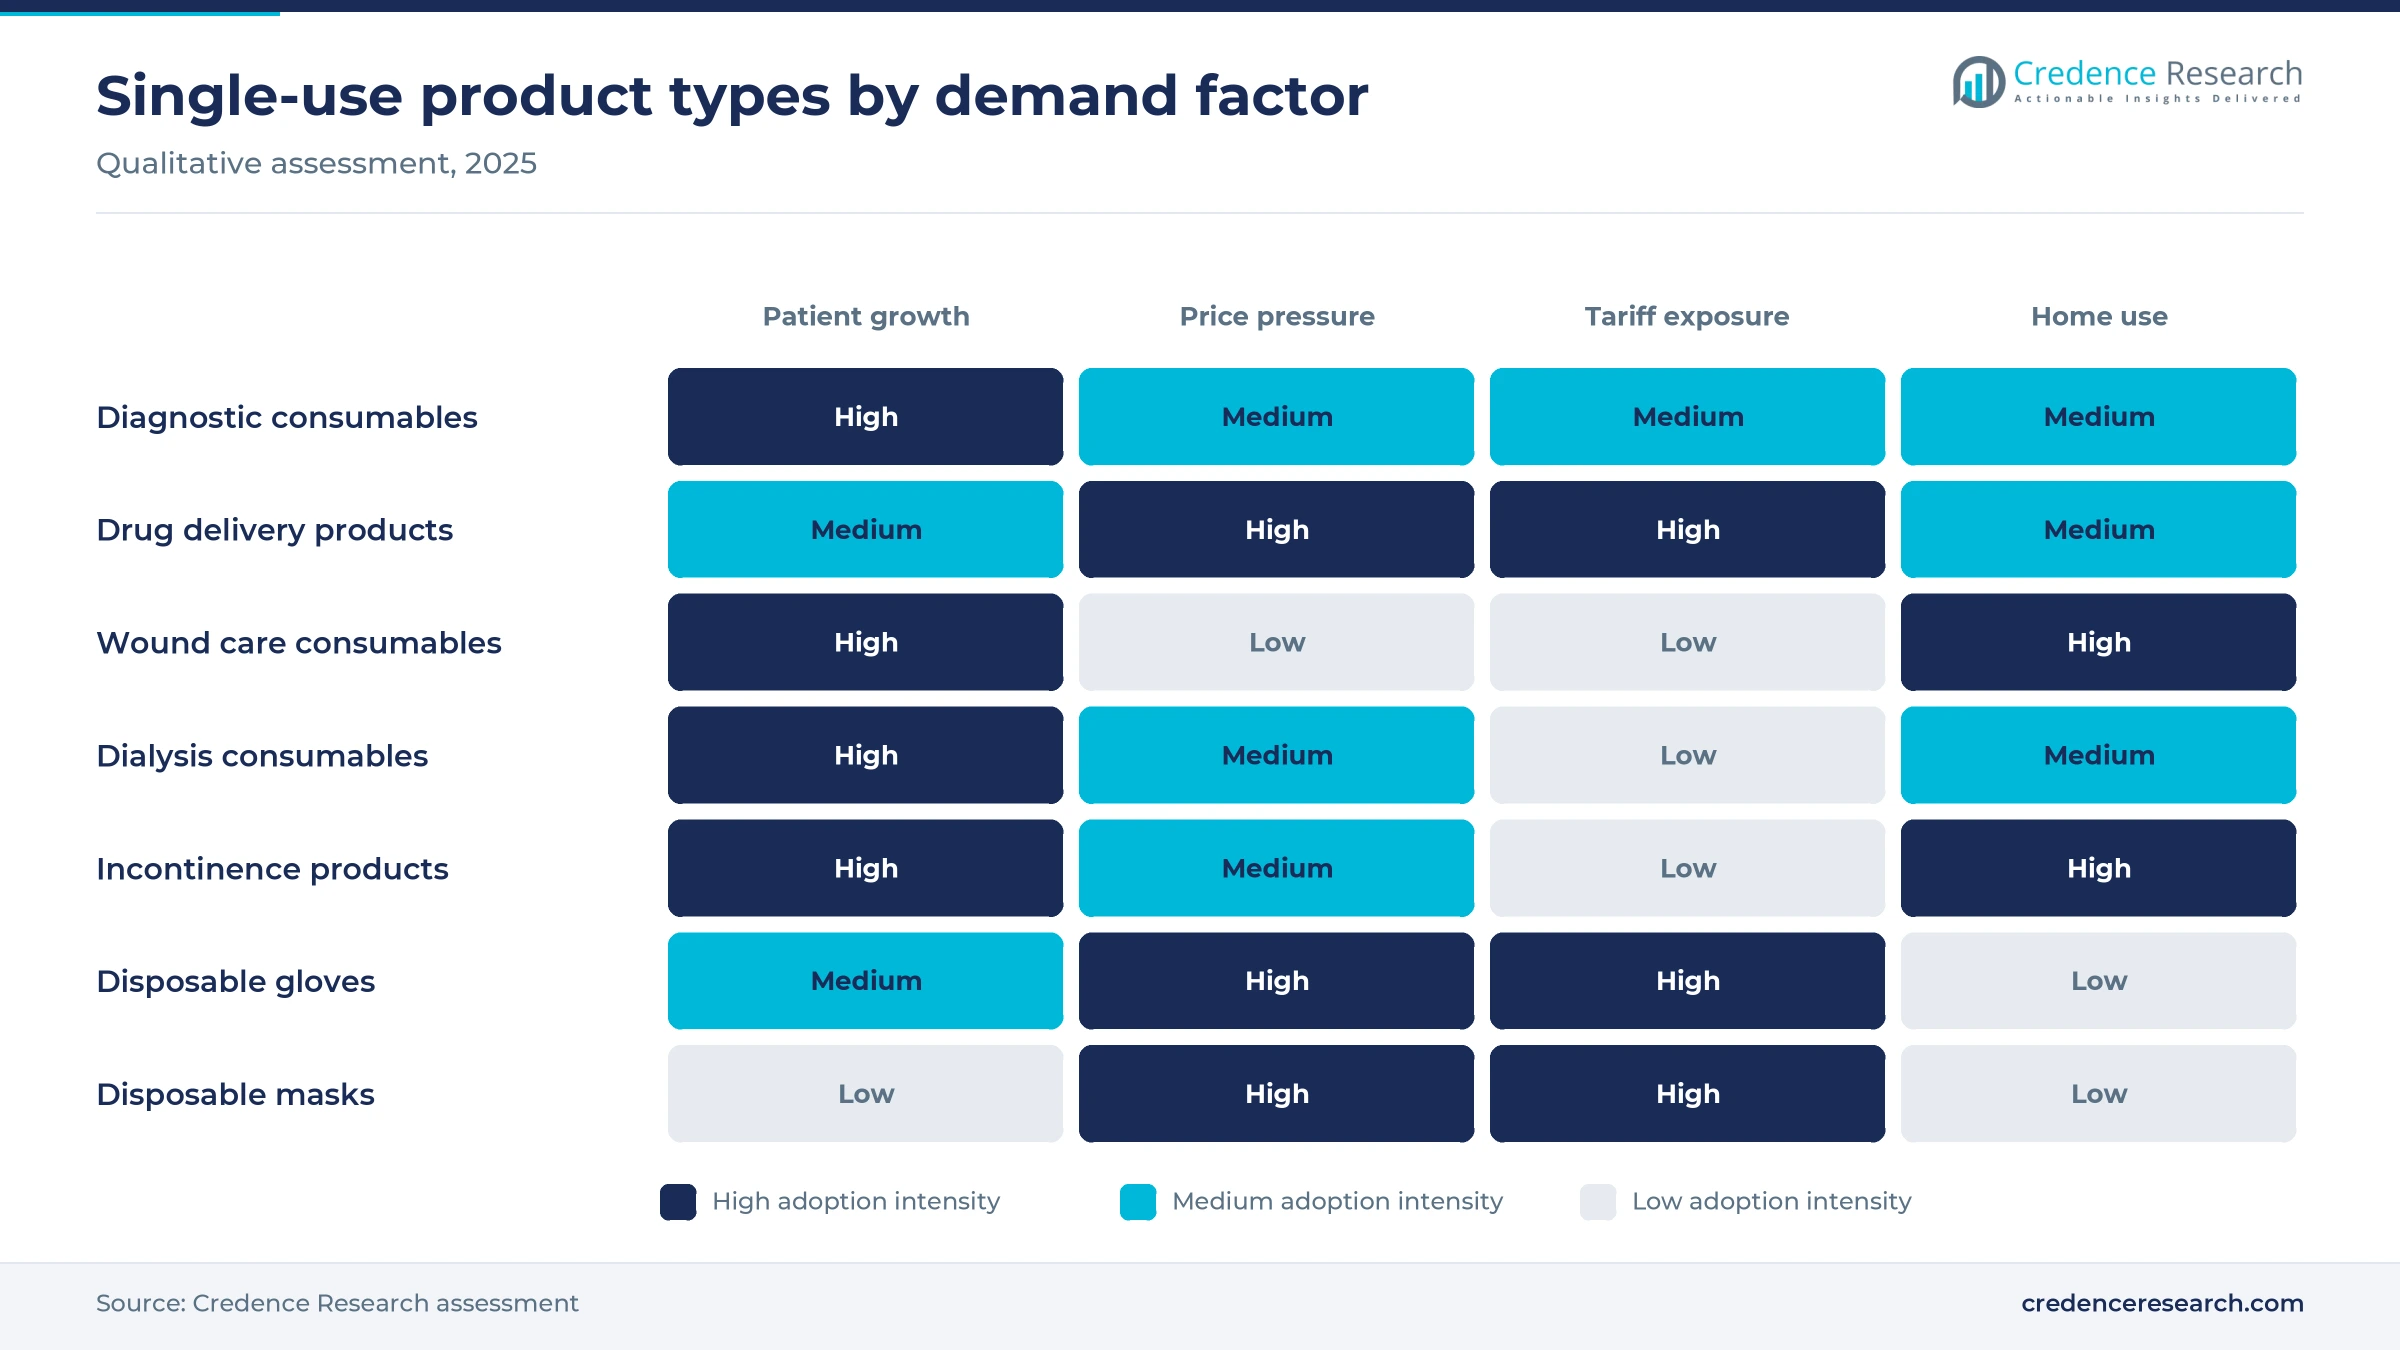
Chronic disease and kidney failure add recurring demand, because diabetes, renal failure and vascular conditions require supplies at every treatment session. Dialysis patients use new bloodlines, filters and needles at every session, and these products cannot be reused. Because most patients attend several sessions each week, each one consumes a large and steady volume of disposables every year. Diabetic patients also need test strips, lancets, pen needles and wound dressings for foot ulcers over many years. As a result, chronic care creates a predictable base of repeat purchases for suppliers.
Why does the growth of surgery lift procedure kit demand?
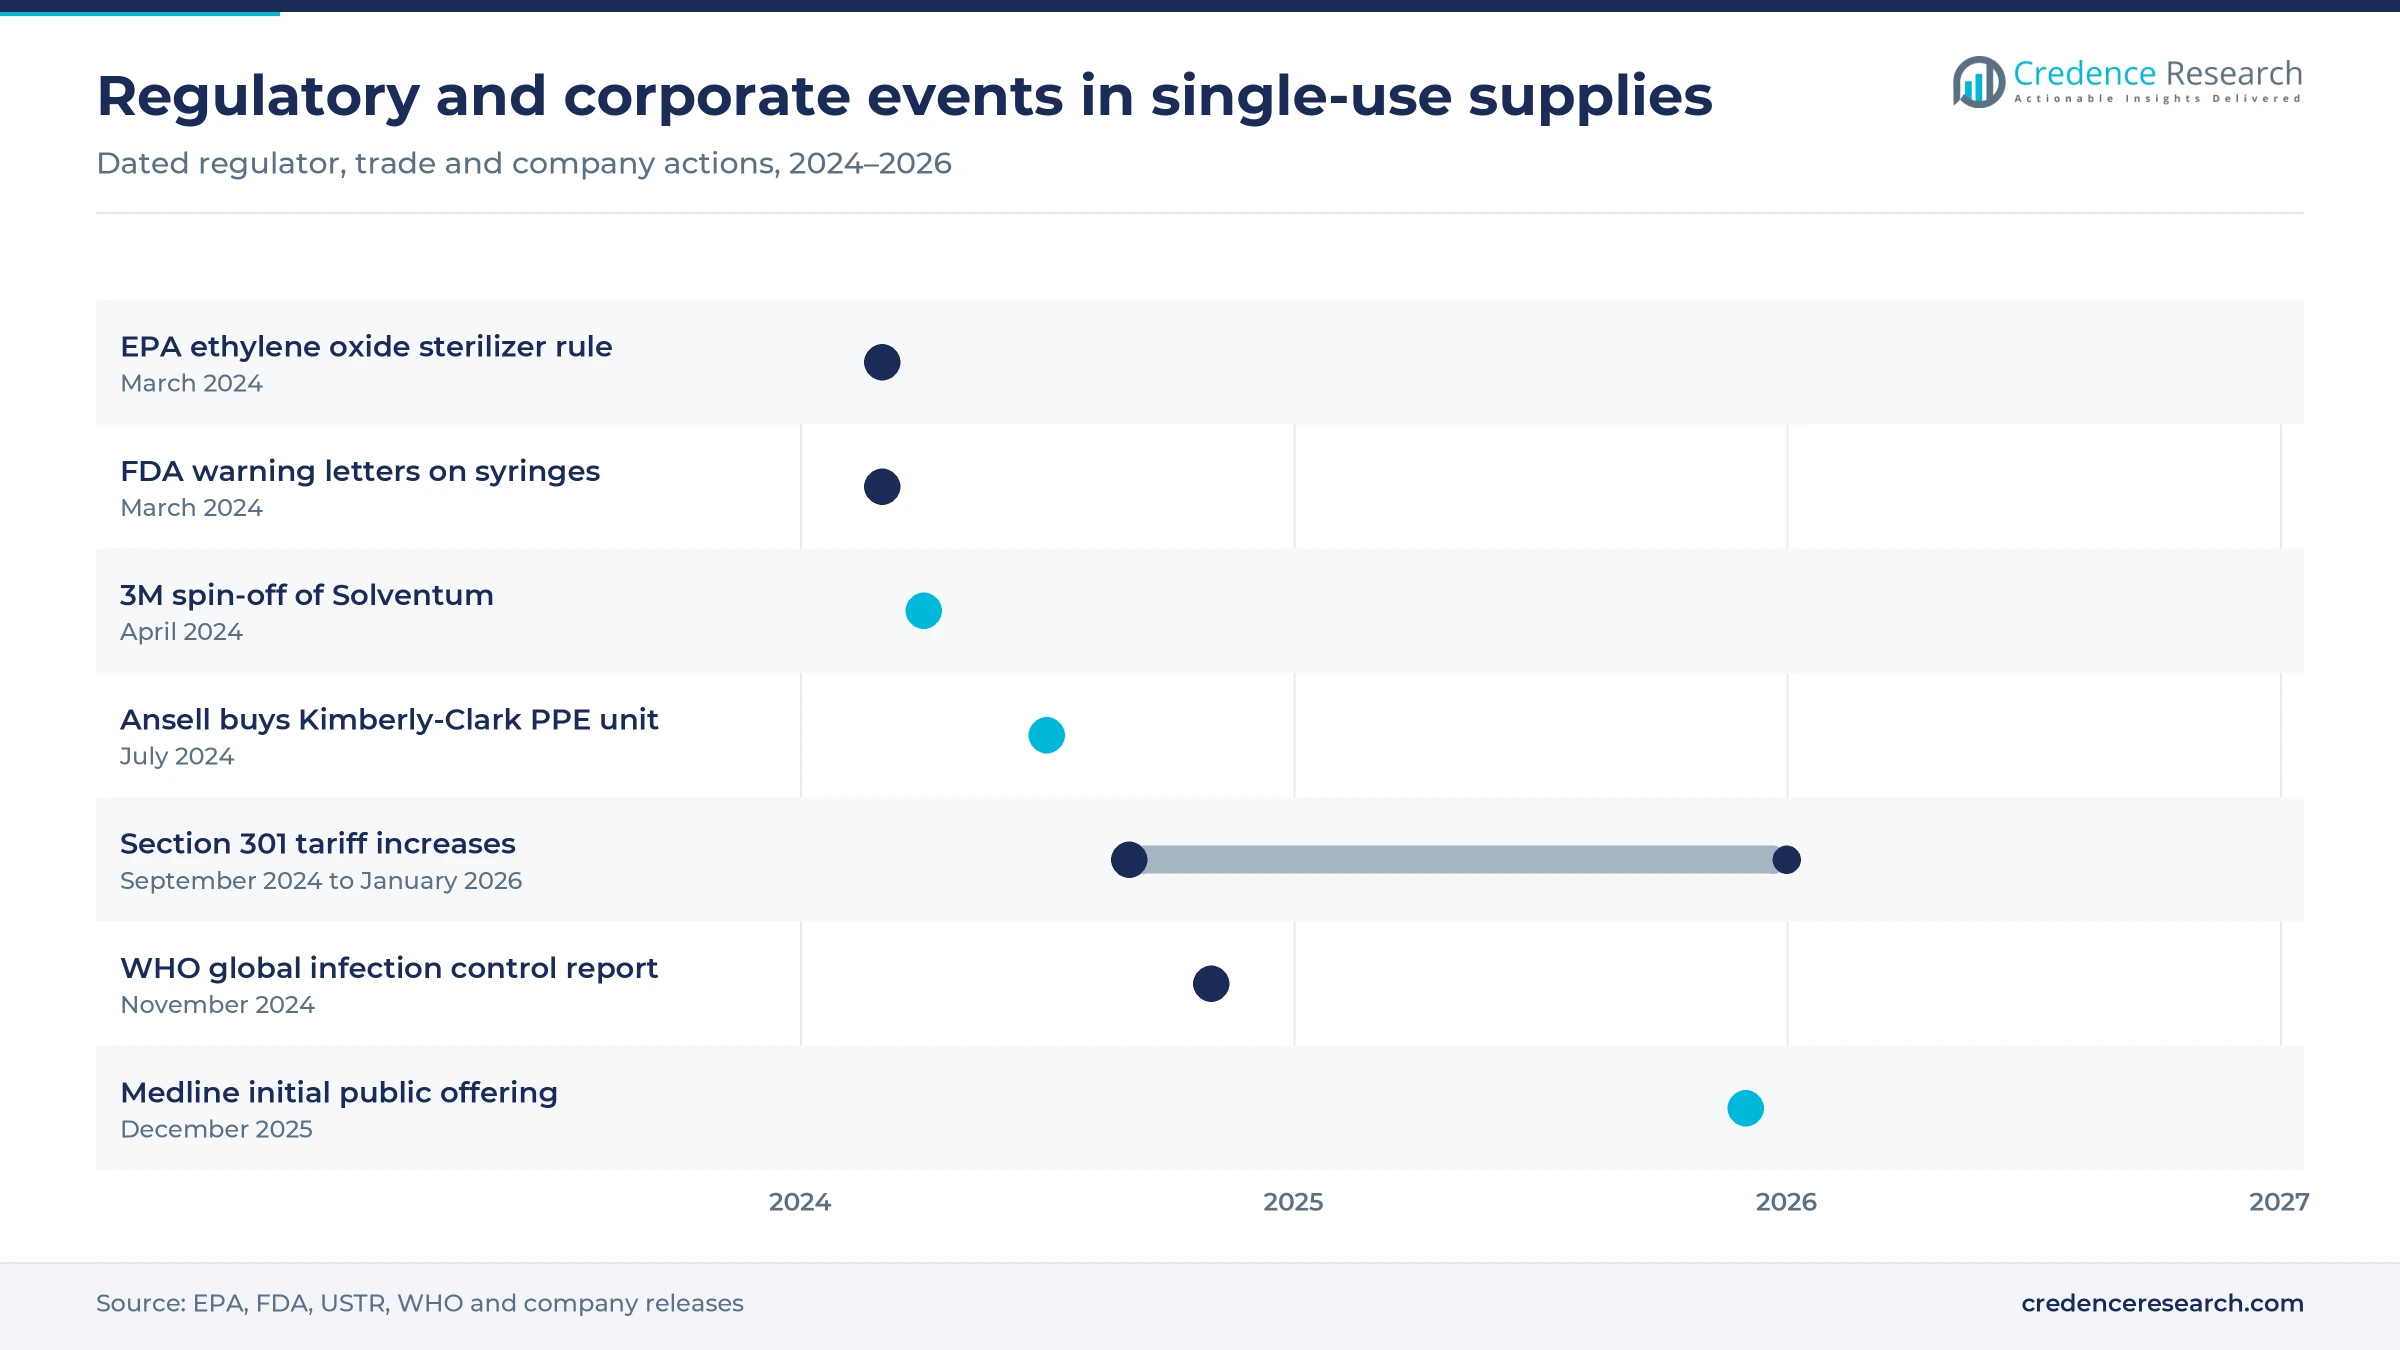
The growth of surgery lifts procedure kit demand, because each operation uses gloves, gowns, drapes, sponges, sutures and sterile packs. Hospitals and surgical centers increasingly buy custom kits that bundle these items for specific procedures. This approach shortens setup time and lowers the risk of missing items in the operating room. In July 2024, Ansell Ltd. announced that it had acquired the Kimberly-Clark personal protective equipment business, adding Kimtech cleanroom and laboratory products to its range. In turn, procedure volumes in orthopedics, cardiology and general surgery translate directly into higher single-use spending.
Supply chain resilience reshapes disposable sourcing
How is supplier diversification shifting procurement?
Supplier diversification is shifting procurement, because buyers learned during recent shortages that single-country sourcing carries high risk. In March 2024, the U.S. Food and Drug Administration issued warning letters to a Chinese syringe maker and two U.S. distributors over unauthorized plastic syringes. The agency asked facilities to move away from syringes made by two named Chinese manufacturers. As a result, hospitals now ask suppliers for country-of-origin and quality data before renewing contracts.
Why are corporate separations rising across health care suppliers?
Corporate separations are rising across health care suppliers, because diversified groups want focused companies with clearer investment priorities. In April 2024, 3M announced that it had completed the spin-off of its health care business as Solventum, which trades on the New York Stock Exchange. In February 2026, Becton, Dickinson and Company announced that it had completed the combination of its biosciences and diagnostic solutions business with Waters Corporation. In turn, the remaining companies concentrate on core medical technology and single-use product lines.
Can home care programs open new demand for consumables suppliers?
Suppliers have a clear opening in home care programs, because payers move dialysis, wound care and ostomy patients out of hospitals. Patients at home need regular deliveries of dressings, catheters, continence products and testing supplies. Companies that offer direct-to-patient shipping, education and reimbursement support can build recurring revenue relationships. As a result, distributors and brand owners are expanding home delivery services in North America and Europe.
Where can lower-carbon materials add value for suppliers?
Lower-carbon materials give suppliers room to add value, because health systems in Europe and North America set emissions targets for purchased goods. Bio-based polymers, recycled packaging and lighter nonwoven fabrics can cut waste without weakening barrier performance. Take-back programs for gloves and packaging also help hospitals report progress against sustainability goals. In turn, suppliers with documented environmental data gain an edge in public and private tenders.
Tariffs, sterilization rules and price caps squeeze margins
How do higher U.S. tariffs raise costs for imported disposables?
Higher U.S. tariffs raise costs for imported disposables, because China supplies large volumes of syringes, needles and gloves. In September 2024, U.S. trade officials finalized Section 301 increases that raised syringe and needle tariffs to 100% in 2024 and set medical glove rates at 50% in 2025 and 100% in 2026. Buyers of disposable gloves therefore face higher landed costs during contract renewals. As a result, suppliers are adding capacity in Southeast Asia, Mexico and the United States.
Why do stricter sterilization emission rules pressure capacity?
Stricter sterilization emission rules pressure capacity, because ethylene oxide remains the main method for heat-sensitive single-use devices. In March 2024, the U.S. Environmental Protection Agency finalized rules for nearly 90 commercial sterilizers that aim to cut emissions by more than 90%. Facilities must add controls and continuous monitoring within two to three years, which raises costs for products such as sterilization pouches and kits. In turn, device makers are qualifying radiation and hydrogen peroxide as alternative sterilization methods.
How does tender pricing limit value growth?
Tender pricing limits value growth, because public hospitals and purchasing groups award contracts largely on unit price. Commodity items such as gloves, gauze, syringes and masks face constant pressure from low-cost producers in Asia. Suppliers often accept multiyear price freezes to keep volume, which compresses margins when resin and freight costs rise. As a result, value grows more slowly than units in many public health systems.
Why does medical waste regulation add cost for hospitals?
Medical waste regulation adds cost for hospitals, because single-use products create large volumes of plastic and infectious waste. Hospitals must segregate, store and treat this waste under national rules, which adds handling and disposal fees. Some health systems now set targets to reduce single-use plastics or switch selected items back to reusable options. In turn, suppliers face growing pressure to document recyclability and reduce packaging weight.
North America leads as Asia Pacific gains pace
| Region | Value, 2025 (USD billion) | Share, 2025 | CAGR, 2026–2035 |
|---|---|---|---|
| North America | 156.72 | 38.0% | 3.64% |
| Europe | 111.35 | 27.0% | 3.44% |
| Asia Pacific | 103.10 | 25.0% | 5.24% |
| Latin America | 24.74 | 6.0% | 4.44% |
| Middle East & Africa | 16.50 | 4.0% | 4.64% |
Why does North America hold the largest regional share?
North America held a 38.0% share of 2025 value and grows at 3.64% a year through 2035. The United States drives this position, because hospitals use more products per admission and follow strict infection prevention standards. Large distributors such as Medline Industries LP and Cardinal Health Inc. manage most hospital supply chains. In December 2025, Medline announced the pricing of its initial public offering at USD 29 per share, with trading on the Nasdaq Global Select Market from Dec. 17. However, tariffs and supplier quality actions since 2024 have raised sourcing costs for imported commodity items.
How fast is Asia Pacific adding demand?
Asia Pacific held a 25.0% share of 2025 value and is the fastest-growing region at 5.24% a year. China, India and Indonesia add hospital beds, surgical capacity and insurance coverage, which all raise single-use product volumes. East Asia and Pacific had 13.6% of its population aged 65 and above in 2024, and Japan has one of the oldest populations, which supports strong demand for continence and wound care products. The region is also the main manufacturing base for gloves, syringes and nonwoven products.
What shapes demand across Europe?
Europe held a 27.0% share of 2025 value and grows at 3.44% a year, the slowest pace of the five regions. Germany, France, the United Kingdom and Italy account for most spending, because national health systems buy through regular tenders. European suppliers such as B.Braun SE, Coloplast A/S and Convatec Group plc hold strong positions in infusion, ostomy and wound care. However, tender pricing keeps value growth below the global average.
Where is Latin America adding demand?
Latin America held a 6.0% share of 2025 value and grows at 4.44% a year through 2035. Brazil and Mexico lead regional spending, because private hospital groups expand surgical and diagnostic capacity. Mexico is also gaining assembly investment as suppliers shift capacity closer to U.S. buyers.
What limits growth in the Middle East and Africa?
The Middle East and Africa held a 4.0% share of 2025 value and grows at 4.64% a year through 2035. Gulf states fund new hospitals with modern supply standards, while much of Africa depends on donor programs and limited budgets. This gap keeps per capita spending low outside major cities and private hospitals.
Spin-offs, listings and trade rules since 2024
| Development | Status and market relevance |
|---|---|
| In March 2024, the U.S. Environmental Protection Agency finalized emission rules for nearly 90 commercial ethylene oxide sterilizers. | Final; facilities have two to three years to comply |
| In September 2024, U.S. trade officials finalized Section 301 increases that lifted Chinese medical glove tariffs to 50% in 2025 and 100% in 2026. | In force; syringe and needle rates rose to 100% in 2024 |
| In July 2024, Ansell Ltd. completed its acquisition of the Kimberly-Clark personal protective equipment business, including Kimtech. | Completed; adds scientific and cleanroom protective products |
| In December 2025, Medline priced its initial public offering, with trading on the Nasdaq Global Select Market from Dec. 17. | Listed; adds public capital for the largest U.S. medical-surgical supplier |
| In February 2026, Becton, Dickinson and Company completed the combination of its biosciences and diagnostic solutions business with Waters Corporation. | Completed; BD now operates as a focused medical technology company |
Safer materials and smart wound dressings lead innovation
- Advanced wound dressings combine foams, silver and moisture control, which shortens healing times for chronic ulcers and surgical wounds.
- Safety-engineered syringes and needles shield sharps after use, which cuts needlestick injuries among nurses and supports occupational safety rules.
- Nitrile and accelerator-free gloves replace natural rubber latex, which lowers allergy risk for staff and patients in hospitals.
- Alternative sterilization methods use radiation, hydrogen peroxide or nitrogen dioxide, which reduces reliance on ethylene oxide at the 88 U.S. commercial sterilizers that the 2024 EPA rule covers, plus 2 under construction.
- Barcode and RFID tracking records each lot from factory to bedside, which speeds recalls and improves inventory control in hospitals.
Need a Custom Version of This Report?
Tailor the scope, geography, or segments to your exact requirements.
- Custom geography or segment scope
- Direct access to our analyst team
Suppliers compete on breadth, quality and logistics
Competition is led by diversified medical technology companies and large distributors with broad catalogs and long hospital contracts. Medline Industries LP, Cardinal Health Inc. and Becton, Dickinson and Company supply wide ranges of gloves, syringes, kits and diagnostic supplies. Johnson & Johnson, Medtronic plc, Baxter International Inc., B.Braun SE and Teleflex Inc. compete in surgical, infusion, dialysis and vascular access products. Coloplast A/S, Convatec Group plc, Hollister Inc. and Smith & Nephew plc focus on ostomy, continence and wound care. Ansell Ltd. and Kimberly-Clark Corp. are known for protective products, while 3M, Avery Dennison Corp. and Avanos Medical Inc. supply tapes, adhesives and specialty disposables. Cook Group Inc., Terumo Corp. and Thermo Fisher Scientific Inc. add interventional and laboratory supplies. As a result, buyers favor suppliers that combine product breadth, consistent quality and reliable logistics.
Companies profiled and their roles in this market
| Company | Type | Role in the market |
|---|---|---|
| Medline Industries LP | Manufacturer and distributor | Gloves, kits, wound care and medical-surgical supplies |
| Cardinal Health Inc. | Manufacturer and distributor | Medical products and hospital supply distribution |
| Becton, Dickinson and Company | Diversified | Syringes, needles, catheters and specimen collection |
| Johnson & Johnson | Diversified | Surgical supplies, sutures and wound closure |
| Medtronic plc | Diversified | Surgical and patient care disposables |
| Baxter International Inc. | Diversified | Infusion and dialysis disposables |
| B.Braun SE | Diversified | Infusion sets, catheters and surgical supplies |
| Teleflex Inc. | Specialist | Vascular access, respiratory and urology disposables |
| Terumo Corp. | Diversified | Syringes, needles and blood management disposables |
| Coloplast A/S | Specialist | Ostomy, continence and wound care products |
| Convatec Group plc | Specialist | Wound, ostomy, continence and infusion products |
| Hollister Inc. | Specialist | Ostomy and continence care products |
| Smith & Nephew plc | Specialist | Advanced wound management products |
| Ansell Ltd. | Specialist | Surgical and examination gloves and protective products |
| Kimberly-Clark Corp. | Diversified | Personal care and hygiene products |
| 3M | Diversified | Tapes, adhesives and industrial safety products |
| Avery Dennison Corp. | Diversified | Medical adhesives and labeling materials |
| Avanos Medical Inc. | Specialist | Digestive health and pain management disposables |
| Cook Group Inc. | Specialist | Interventional and access disposables |
| Thermo Fisher Scientific Inc. | Diversified | Laboratory and diagnostic consumables |
Home care and resilient sourcing set the pace to 2035
Credence Research's view is that home care growth and resilient sourcing will set the pace of growth through 2035, because payers move chronic patients out of hospitals and buyers spread orders across more countries. The overall market grows at 4.10% a year, supported by aging populations, chronic wounds and kidney failure. Wound care, dialysis and continence products grow faster than commodity gloves and masks as demand normalizes after recent shortages. Companies that combine documented quality, regional manufacturing and direct-to-patient delivery will win the most contracts.
How Credence Research sized single-use supply spending
The report uses 2025 as the base year and 2026 to 2035 as the forecast period. Market values come from the Credence Research model, which builds spending by product, material, end user and region. Regional and segment splits are Credence Research estimates informed by World Bank population data, World Health Organization reports, U.S. regulator and trade notices, and company press releases. No primary interviews or surveys were used in preparing this edition of the report.
Single-use supply spending outlook to 2035
By 2035, the medical consumables market is projected to reach USD 616.37 billion, with growth led by diagnostic, wound care, dialysis and drug delivery products. Hospitals will remain the largest buyers, as operating rooms and inpatient wards use the widest range of products. North America keeps the highest spending per patient, while Asia Pacific adds the most new demand. Home care settings will take a larger share of value, because payers favor lower-cost treatment. As a result, advantage will depend on quality, supply security and delivery service.
Frequently Asked Questions
How big is the global medical consumables market?
Which product type leads medical consumables spending?
Which region leads medical consumables demand?
Which material is used most in single-use products?
Why are home care settings gaining share?
How do U.S. tariffs affect imported disposables?
Who are the leading medical consumables companies?
What restrains growth in single-use supplies?
Table of Content
Chapter 1 Market Segmentation
- 1.1 Segmentation Framework
- 1.1.1 Product and Service Classification
- 1.1.2 Application and End-Use Classification
- 1.1.3 Technology and Solution Classification
- 1.1.4 Customer and Distribution Channel Classification
- 1.1.5 Geographic Segmentation
- 1.1.6 Market Segment Definitions and Boundaries
- 1.2 By Product
- 1.2.1 Sterilization Consumables
- 1.2.2 Hand Sanitizers
- 1.2.3 Wound Care Consumables
- 1.2.4 Diagnostic Consumables
- 1.2.5 Respiratory Supplies
- 1.2.6 Drug Delivery Products
- 1.2.7 Dialysis Consumables
- 1.2.8 Incontinence Products
- 1.2.9 Disposable Gloves
- 1.2.10 Disposable Masks
- 1.2.11 Others
- 1.3 By Material
- 1.3.1 Plastic Resin
- 1.3.2 Non-woven Materials
- 1.3.3 Rubber
- 1.3.4 Glass
- 1.3.5 Metals
- 1.3.6 Paper
- 1.3.7 Others
- 1.4 By End User
- 1.4.1 Hospitals
- 1.4.2 Ambulatory Surgical Centers
- 1.4.3 Specialty Clinics
- 1.4.4 Home Care Settings
- 1.4.5 Others
Chapter 2 Introduction
- 2.1 Report Objectives and Scope
- 2.2 Product Definition and Industry Terminology
- 2.3 Market Inclusions and Exclusions
- 2.4 Research Process
- 2.4.1 Primary Research and Expert Interviews
- 2.4.2 Secondary Research and Source Review
- 2.4.3 Top-Down and Bottom-Up Estimation
- 2.4.4 Data Triangulation and Verification
- 2.5 Market Size Measurement Basis
- 2.5.1 2025: USD 412.41 billion → 2035: USD 616.37 billion
- 2.6 Historical and Forecast Reference Periods
- 2.6.1 Historical Period: 2018-2025
- 2.6.2 Base Year: 2025
- 2.6.3 Forecast Period: 2025-2035
- 2.7 Research Assumptions and Limitations
Chapter 3 Executive Summary
- 3.1 Market Snapshot and Key Findings
- 3.2 Base-Year Market Size, 2025
- 3.3 Forecast Market Size, 2035
- 3.4 Revenue and Volume Growth Outlook
- 3.5 Key Demand and Supply Indicators
- 3.6 Leading Market Segments
- 3.7 Fastest-Growing Market Opportunities
- 3.8 Regional Performance Highlights
- 3.9 Technology and Industry Transformation
- 3.10 Competitive Landscape Summary
- 3.11 Analyst View and Strategic Implications
Chapter 4 Global Medical Consumables Market Trends and Developments
- 4.1 Historical Industry Development, 2018-2025
- 4.2 Recent Market Trends and Developments
- 4.3 Demand and Customer Behavior Trends
- 4.4 Technology and Product Innovation
- 4.5 Artificial Intelligence, Automation and Digitalization
- 4.6 Local Manufacturing and Supply Chain Realignment
- 4.7 Industry Partnerships, Mergers and Acquisitions
- 4.8 Sustainability and Circular Economy Developments
- 4.9 Government and Private Sector Investment Trends
- 4.10 Emerging Business Models and Commercialization
- 4.11 Industry Developments and Announcements
Chapter 5 Global Medical Consumables Market Production, Supply and Demand Analysis
- 5.1 Demand Trend and Consumption Analysis, 2018-2025
- 5.2 Demand Forecast, 2025-2035
- 5.3 Production and Output Trend, 2018-2025
- 5.4 Production and Output Forecast, 2025-2035
- 5.5 Installed Capacity and Capacity Utilization
- 5.6 Company-Wise Production Plants and Statistics
- 5.6.1 Installed Production Capacity
- 5.6.2 Actual Production
- 5.6.3 Planned Capacity and Expansion Targets
- 5.7 Supply Chain Structure and Procurement Trends
- 5.8 Supply-Demand Gap and Bottlenecks
- 5.9 Import Dependence and Sourcing Structure
- 5.10 Contract Manufacturing and Outsourcing
- 5.11 Regional Supply and Demand Concentration
Chapter 6 Global Medical Consumables Market Pricing Analysis
- 6.1 Pricing Structure and Measurement
- 6.2 Historical Pricing Trends, 2018-2025
- 6.3 Pricing Outlook, 2025-2035
- 6.4 Average Selling Price and Unit Economics
- 6.5 Pricing by Product and Market Segment
- 6.6 Geographic Pricing Differences
- 6.7 Key Input, Energy, Labor and Logistics Costs
- 6.8 Contract Pricing and Purchasing Models
- 6.9 Pricing Sensitivity and Competitive Positioning
- 6.10 Price, Margin and Profitability Implications
Chapter 7 Global Medical Consumables Market Dynamics
- 7.1 Market Growth Drivers
- 7.1.1 Demand-Side Drivers
- 7.1.2 Technology and Innovation Drivers
- 7.1.3 Infrastructure and Investment Drivers
- 7.1.4 Regulatory and Policy Drivers
- 7.2 Market Restraints
- 7.2.1 Cost and Affordability Constraints
- 7.2.2 Technology and Adoption Barriers
- 7.2.3 Supply Chain and Operational Constraints
- 7.3 Market Challenges
- 7.3.1 Competitive Pressure and Margin Erosion
- 7.3.2 Skills, Infrastructure and Implementation Gaps
- 7.4 Emerging Market Opportunities
- 7.5 Market Dynamics Impact and Time-Horizon Assessment
Chapter 8 Global Medical Consumables Value Chain Analysis
- 8.1 Industry Value Chain Overview
- 8.2 Upstream Suppliers and Critical Inputs
- 8.3 Technology and Component Providers
- 8.4 Manufacturing or Service Delivery
- 8.5 Distribution, Channel Partners and Integrators
- 8.6 Downstream Applications and End Users
- 8.7 Value Addition and Profit Pools
- 8.8 Vertical Integration and Outsourcing
- 8.9 Supplier Concentration and Risk
- 8.10 Supply Chain Localization and Resilience
Chapter 9 Global Medical Consumables Market Regulations and Policies
- 9.1 Relevant Laws, Standards and Compliance Frameworks
- 9.2 Product, Service, Safety and Quality Requirements
- 9.3 Government Policies, Incentives and Subsidies
- 9.4 Imports, Exports and Trade Barriers
- 9.5 Public Procurement and Local Content Requirements
- 9.6 Environmental and Sustainability Compliance
- 9.7 Upcoming Policy Changes and Market Implications
Chapter 10 Global Medical Consumables Market Hotspots and Opportunities
- 10.1 Market Opportunity Mapping and Growth Hotspots
- 10.2 High-Growth Applications and Customer Groups
- 10.3 Underserved Markets and White-Space Opportunities
- 10.4 Emerging Technology and Product Opportunities
- 10.5 New Capacity and Investment Hotspots
- 10.6 Market Entry and Expansion Opportunities
- 10.7 Distribution and Partnership Opportunities
- 10.8 Near-Term and Long-Term Commercial Potential
- 10.9 Opportunity Attractiveness and Execution Risks
Chapter 11 Global Medical Consumables Market Outlook, 2025-2035
- 11.1 Market Size and Analysis
- 11.1.1 Revenue (Market Measurement: 2025: USD 412.41 billion → 2035: USD 616.37 billion)
- 11.1.2 Market Volume and Quantity Sold
- 11.1.3 Historical Market Size, 2018-2025
- 11.1.4 Base-Year Market Size, 2025
- 11.2 Market Forecast, 2025-2035
- 11.2.1 Revenue Forecast to 2035
- 11.2.2 Volume Forecast to 2035
- 11.2.3 CAGR and Year-on-Year Growth
- 11.2.4 Incremental Revenue Opportunity
- 11.3 Forecast Assumptions and Scenario Analysis
- 11.3.1 Base-Case Forecast
- 11.3.2 Optimistic and Conservative Scenarios
- 11.3.3 Technology, Pricing and Policy Sensitivities
- 11.4 Market Attractiveness and Growth Outlook
Chapter 12 Global Medical Consumables Market Segmentation and Outlook
- 12.1 Segmentation Summary and Market Shares, 2025
- 12.2 Largest and Fastest-Growing Segments
- 12.3 By Product - Market Size and Forecast, 2025-2035
- 12.3.1 Segment Definition and Scope
- 12.3.2 Historical Market Size, 2018-2025
- 12.3.3 Revenue Forecast, 2025-2035
- 12.3.4 Volume Forecast, 2025-2035
- 12.3.5 Base-Year Market Share, 2025
- 12.3.6 Segment CAGR and Growth Drivers
- 12.3.7 Subsegment Market Size and Forecast
- 12.3.7.1 Sterilization Consumables
- 12.3.7.2 Hand Sanitizers
- 12.3.7.3 Wound Care Consumables
- 12.3.7.4 Diagnostic Consumables
- 12.3.7.5 Respiratory Supplies
- 12.3.7.6 Drug Delivery Products
- 12.3.7.7 Dialysis Consumables
- 12.3.7.8 Incontinence Products
- 12.3.7.9 Disposable Gloves
- 12.3.7.10 Disposable Masks
- 12.3.7.11 Others
- 12.3.8 Subsegment Pricing and Adoption Trends
- 12.3.9 Leading Suppliers and Competition
- 12.3.10 Regional Demand and Opportunities
- 12.4 By Material - Market Size and Forecast, 2025-2035
- 12.4.1 Segment Definition and Scope
- 12.4.2 Historical Market Size, 2018-2025
- 12.4.3 Revenue Forecast, 2025-2035
- 12.4.4 Volume Forecast, 2025-2035
- 12.4.5 Base-Year Market Share, 2025
- 12.4.6 Segment CAGR and Growth Drivers
- 12.4.7 Subsegment Market Size and Forecast
- 12.4.7.1 Plastic Resin
- 12.4.7.2 Non-woven Materials
- 12.4.7.3 Rubber
- 12.4.7.4 Glass
- 12.4.7.5 Metals
- 12.4.7.6 Paper
- 12.4.7.7 Others
- 12.4.8 Subsegment Pricing and Adoption Trends
- 12.4.9 Leading Suppliers and Competition
- 12.4.10 Regional Demand and Opportunities
- 12.5 By End User - Market Size and Forecast, 2025-2035
- 12.5.1 Segment Definition and Scope
- 12.5.2 Historical Market Size, 2018-2025
- 12.5.3 Revenue Forecast, 2025-2035
- 12.5.4 Volume Forecast, 2025-2035
- 12.5.5 Base-Year Market Share, 2025
- 12.5.6 Segment CAGR and Growth Drivers
- 12.5.7 Subsegment Market Size and Forecast
- 12.5.7.1 Hospitals
- 12.5.7.2 Ambulatory Surgical Centers
- 12.5.7.3 Specialty Clinics
- 12.5.7.4 Home Care Settings
- 12.5.7.5 Others
- 12.5.8 Subsegment Pricing and Adoption Trends
- 12.5.9 Leading Suppliers and Competition
- 12.5.10 Regional Demand and Opportunities
- 12.6 Segment Growth Comparison
- 12.7 Segment Attractiveness and Priority Matrix
Chapter 13 Global Medical Consumables End-Use and Application Market Outlook
- 13.1 End-Use Industry and Customer Demand Structure
- 13.2 Leading Applications and Customer Groups
- 13.3 End-Use Market Size, Share and Forecast
- 13.4 Major End-Use Industry Deep Dives
- 13.4.1 Customer Requirements and Use Cases
- 13.4.2 Demand and Replacement Cycles
- 13.4.3 Technical and Regulatory Considerations
- 13.4.4 Purchasing and Procurement Models
- 13.4.5 Leading Vendors and Distribution Channels
- 13.4.6 Forecast and Commercial Opportunities
- 13.5 Emerging Applications and Cross-Segment Demand
- 13.6 End-Use Industry Investment Priorities
Chapter 14 Global Medical Consumables Geographic Market Outlook, 2025-2035
- 14.1 Regional Market Size and Share, 2025
- 14.2 Regional Market Forecast, 2025-2035
- 14.3 Regional Pricing, Production and Demand Differences
- 14.4 North America
- 14.4.1 United States
- 14.4.2 Canada
- 14.4.3 Mexico
- 14.5 Europe
- 14.5.1 Germany
- 14.5.2 France
- 14.5.3 Italy
- 14.5.4 United Kingdom
- 14.5.5 Spain
- 14.5.6 Poland
- 14.5.7 Russia
- 14.5.8 Netherlands
- 14.5.9 Belgium
- 14.5.10 Sweden
- 14.5.11 Denmark
- 14.5.12 Norway
- 14.5.13 Rest of Europe
- 14.6 Asia Pacific
- 14.6.1 China
- 14.6.2 India
- 14.6.3 Japan
- 14.6.4 South Korea
- 14.6.5 Thailand
- 14.6.6 Indonesia
- 14.6.7 Vietnam
- 14.6.8 Malaysia
- 14.6.9 Australia
- 14.6.10 Rest of Asia Pacific
- 14.7 Latin America
- 14.7.1 Brazil
- 14.7.2 Argentina
- 14.7.3 Colombia
- 14.7.4 Chile
- 14.7.5 Rest of Latin America
- 14.8 Middle East
- 14.8.1 Saudi Arabia
- 14.8.2 United Arab Emirates
- 14.8.3 Turkey
- 14.8.4 Israel
- 14.8.5 Iran
- 14.8.6 Rest of the Middle East
- 14.9 Africa
- 14.9.1 South Africa
- 14.9.2 Egypt
- 14.9.3 Nigeria
- 14.9.4 Morocco
- 14.9.5 Rest of Africa
- 14.10 Regional Investment, Policy and Supply Chain Differences
- 14.11 Regional Competitive Landscape
- 14.12 Geographic Growth Hotspots
Chapter 15 Global Medical Consumables Technology, Innovation and Sustainability Outlook
- 15.1 Technology Landscape and Maturity
- 15.2 Product, Process and Service Innovation
- 15.3 AI, Automation and Digital Tools in the Industry
- 15.4 Technology Adoption and Performance Benchmarking
- 15.5 Innovation Pipeline and R&D Investment
- 15.6 Patent and Intellectual Property Trends
- 15.7 Energy Efficiency and Resource Management
- 15.8 Sustainability, Recycling and Circularity
- 15.9 Technology Roadmap, 2025-2035
- 15.10 Risks of Obsolescence and Technology Substitution
Chapter 16 Global Medical Consumables Market Key Strategic Imperatives
- 16.1 Growth and Market Entry Priorities
- 16.2 High-Return Products and Segments
- 16.3 Pricing, Profitability and Cost Optimization
- 16.4 Technology Investment and Product Differentiation
- 16.5 Supply Chain Localization and Resilience
- 16.6 Distribution and Customer Acquisition
- 16.7 Partnership, Acquisition and Capacity Strategy
- 16.8 Regional Expansion Priorities
- 16.9 Short-, Medium- and Long-Term Actions
Chapter 17 Competition Outlook
- 17.1 Industry Competition Characteristics
- 17.2 Market Structure and Concentration
- 17.3 Market Share and Competitive Positioning, 2025
- 17.4 Company-Wise Revenue and Product Benchmarking
- 17.5 Production and Service Capacity Benchmarking
- 17.6 Technology, Pricing and Differentiation
- 17.7 Regional Footprint and Distribution Strength
- 17.8 Mergers, Acquisitions and Strategic Alliances
- 17.9 New Entrants and Competitive Threats
- 17.10 Porter's Five Forces and Industry Attractiveness
- 17.11 Competitive Outlook, 2025-2035
Chapter 18 Company Profiles
- 18.1 Company Coverage and Selection Criteria
- 18.2 3M
- 18.2.1 Business Description
- 18.2.2 Company Ownership and Geographic Presence
- 18.2.3 Product and Service Portfolio
- 18.2.4 Manufacturing and Operating Footprint
- 18.2.5 Production Capacity and Expansion Plans
- 18.2.6 Financial Performance and Investment
- 18.2.7 Market Share and Competitive Position
- 18.2.8 Technology and Innovation Capabilities
- 18.2.9 Strategic Alliances or Partnerships
- 18.2.10 Recent Developments
- 18.2.11 Growth Strategy and Outlook
- 18.3 Ansell Ltd.
- 18.4 Avanos Medical Inc.
- 18.5 Avery Dennison Corp.
- 18.6 B.Braun SE
- 18.7 Baxter International Inc.
- 18.8 Becton, Dickinson and Company
- 18.9 Cardinal Health Inc.
- 18.10 Coloplast A/S
- 18.11 Convatec Group plc
- 18.12 Cook Group Inc.
- 18.13 Hollister Inc.
- 18.14 Johnson & Johnson
- 18.15 Kimberly-Clark Corp.
- 18.16 Medline Industries LP
- 18.17 Medtronic plc
- 18.18 Smith & Nephew plc
- 18.19 Teleflex Inc.
- 18.20 Terumo Corp.
- 18.21 Thermo Fisher Scientific Inc.
- 18.22 Other Relevant Market Participants
Note: Every listed company is profiled on the structure shown under the first company. The company list is preliminary and may change based on research findings, market developments, data availability and client requirements.
Chapter 19 Disclaimer
- 19.1 Research and Forecast Disclaimer
- 19.2 Data Source and Estimation Limitations
Note: The depth of individual sections depends on data availability for this market. Volume, capacity, trade and other unit-based metrics are included where applicable.

