
Kidney failure burden keeps dialysis machines in demand
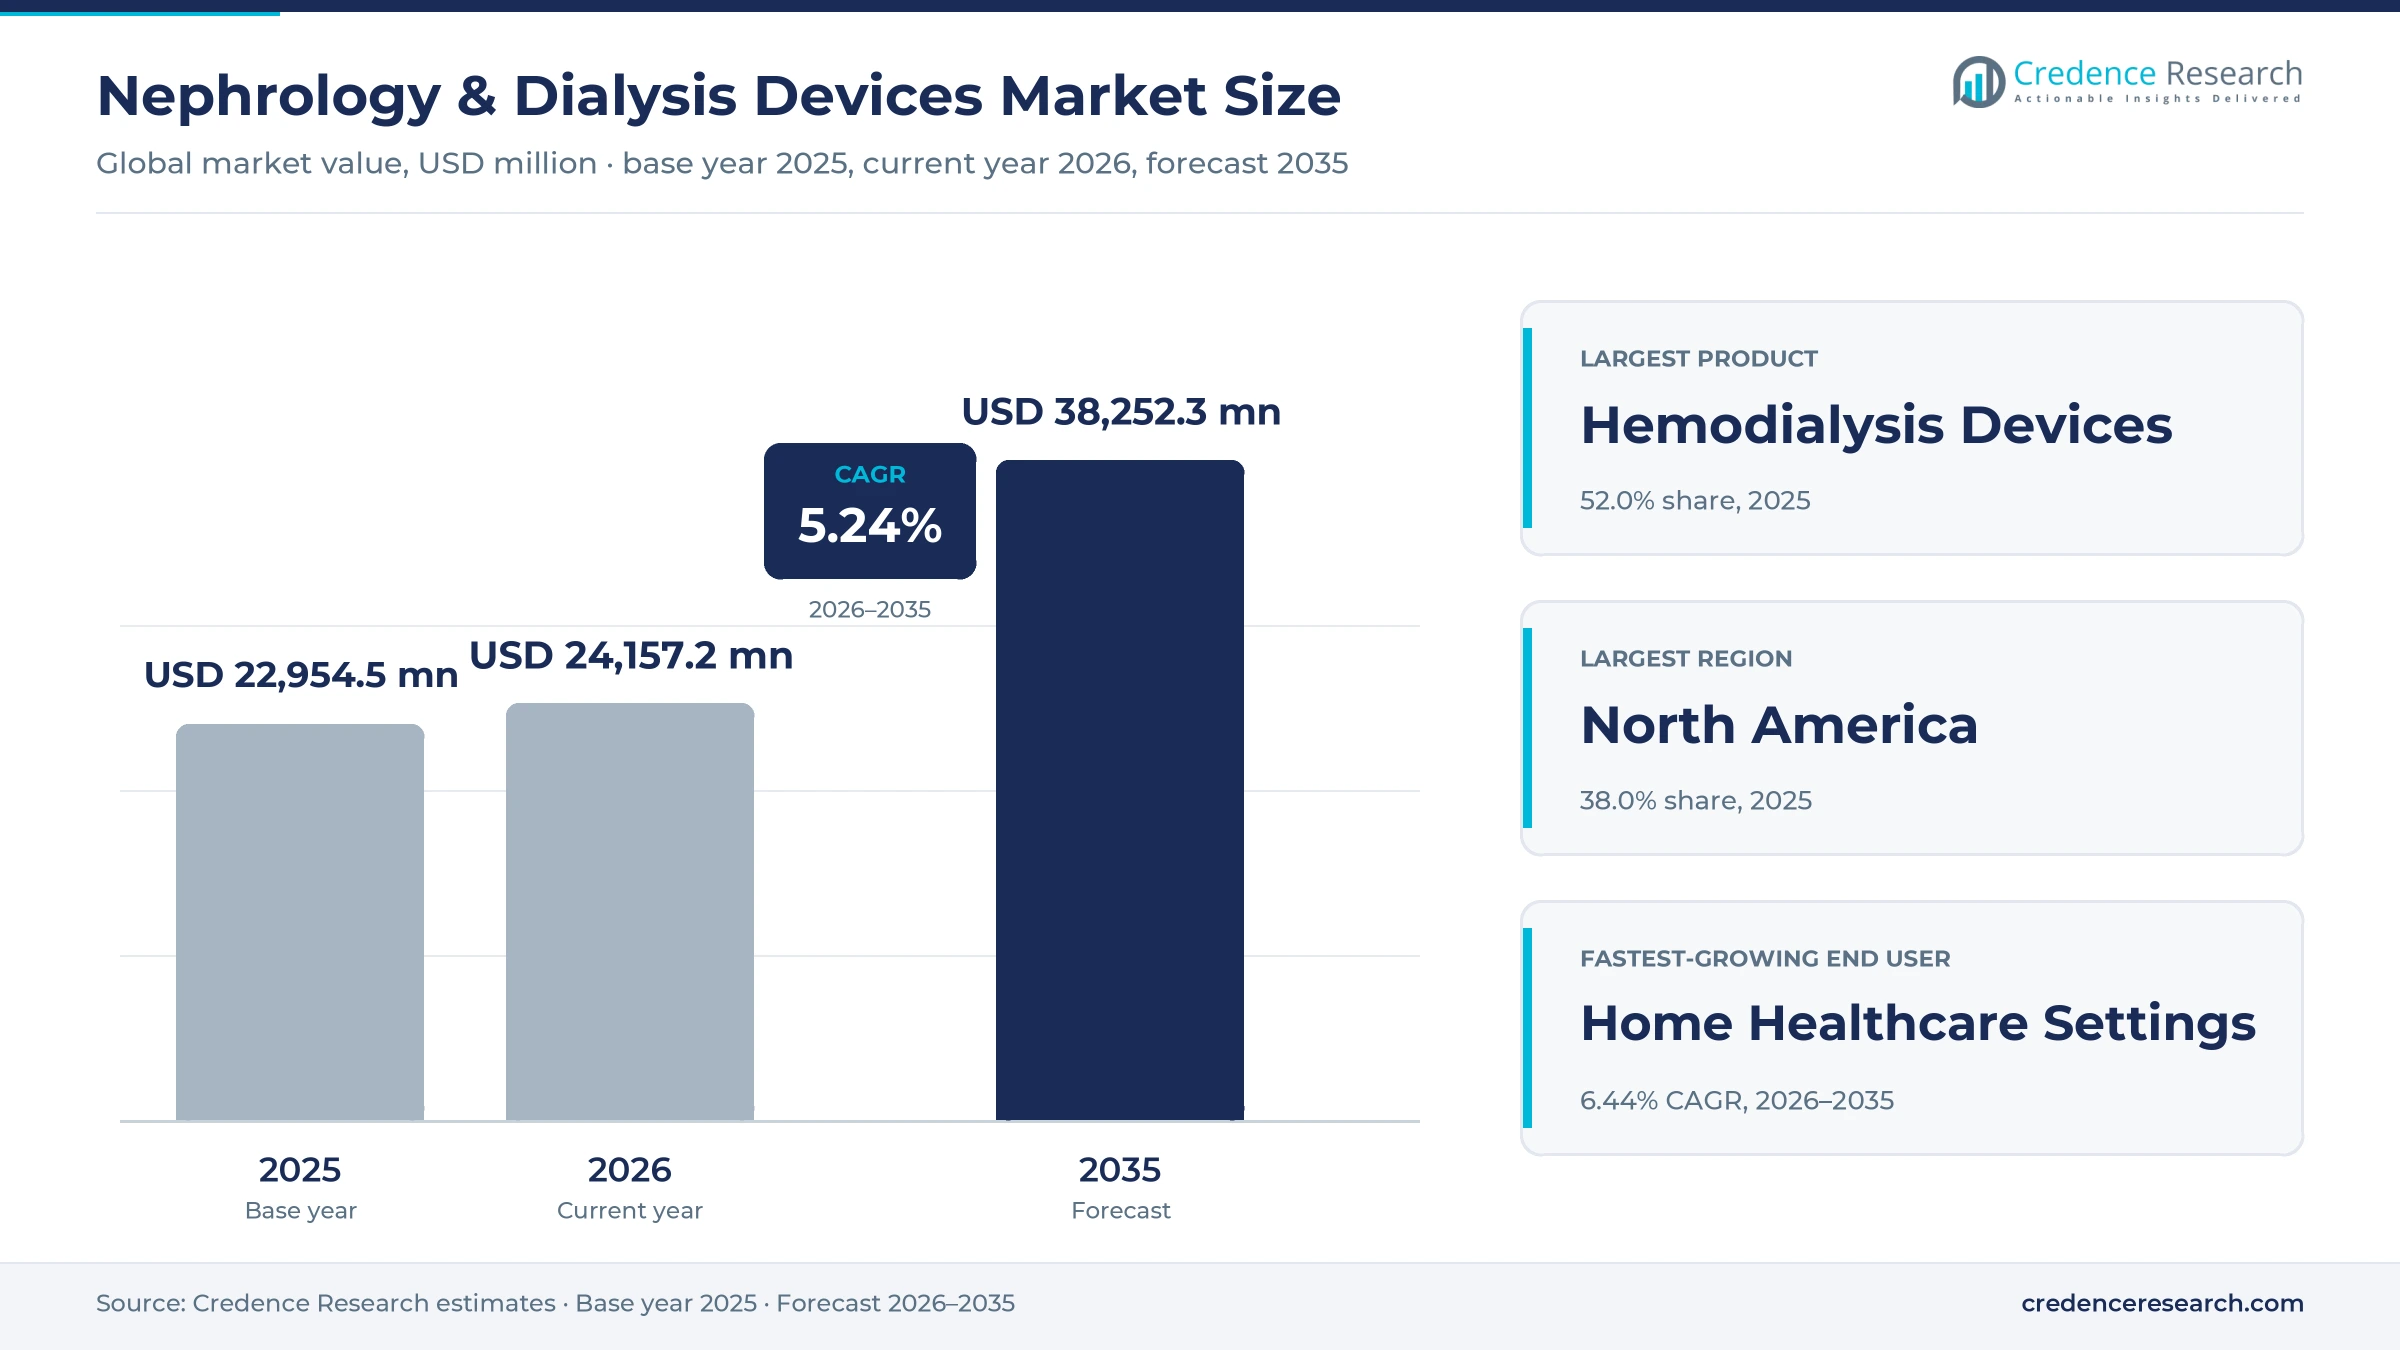
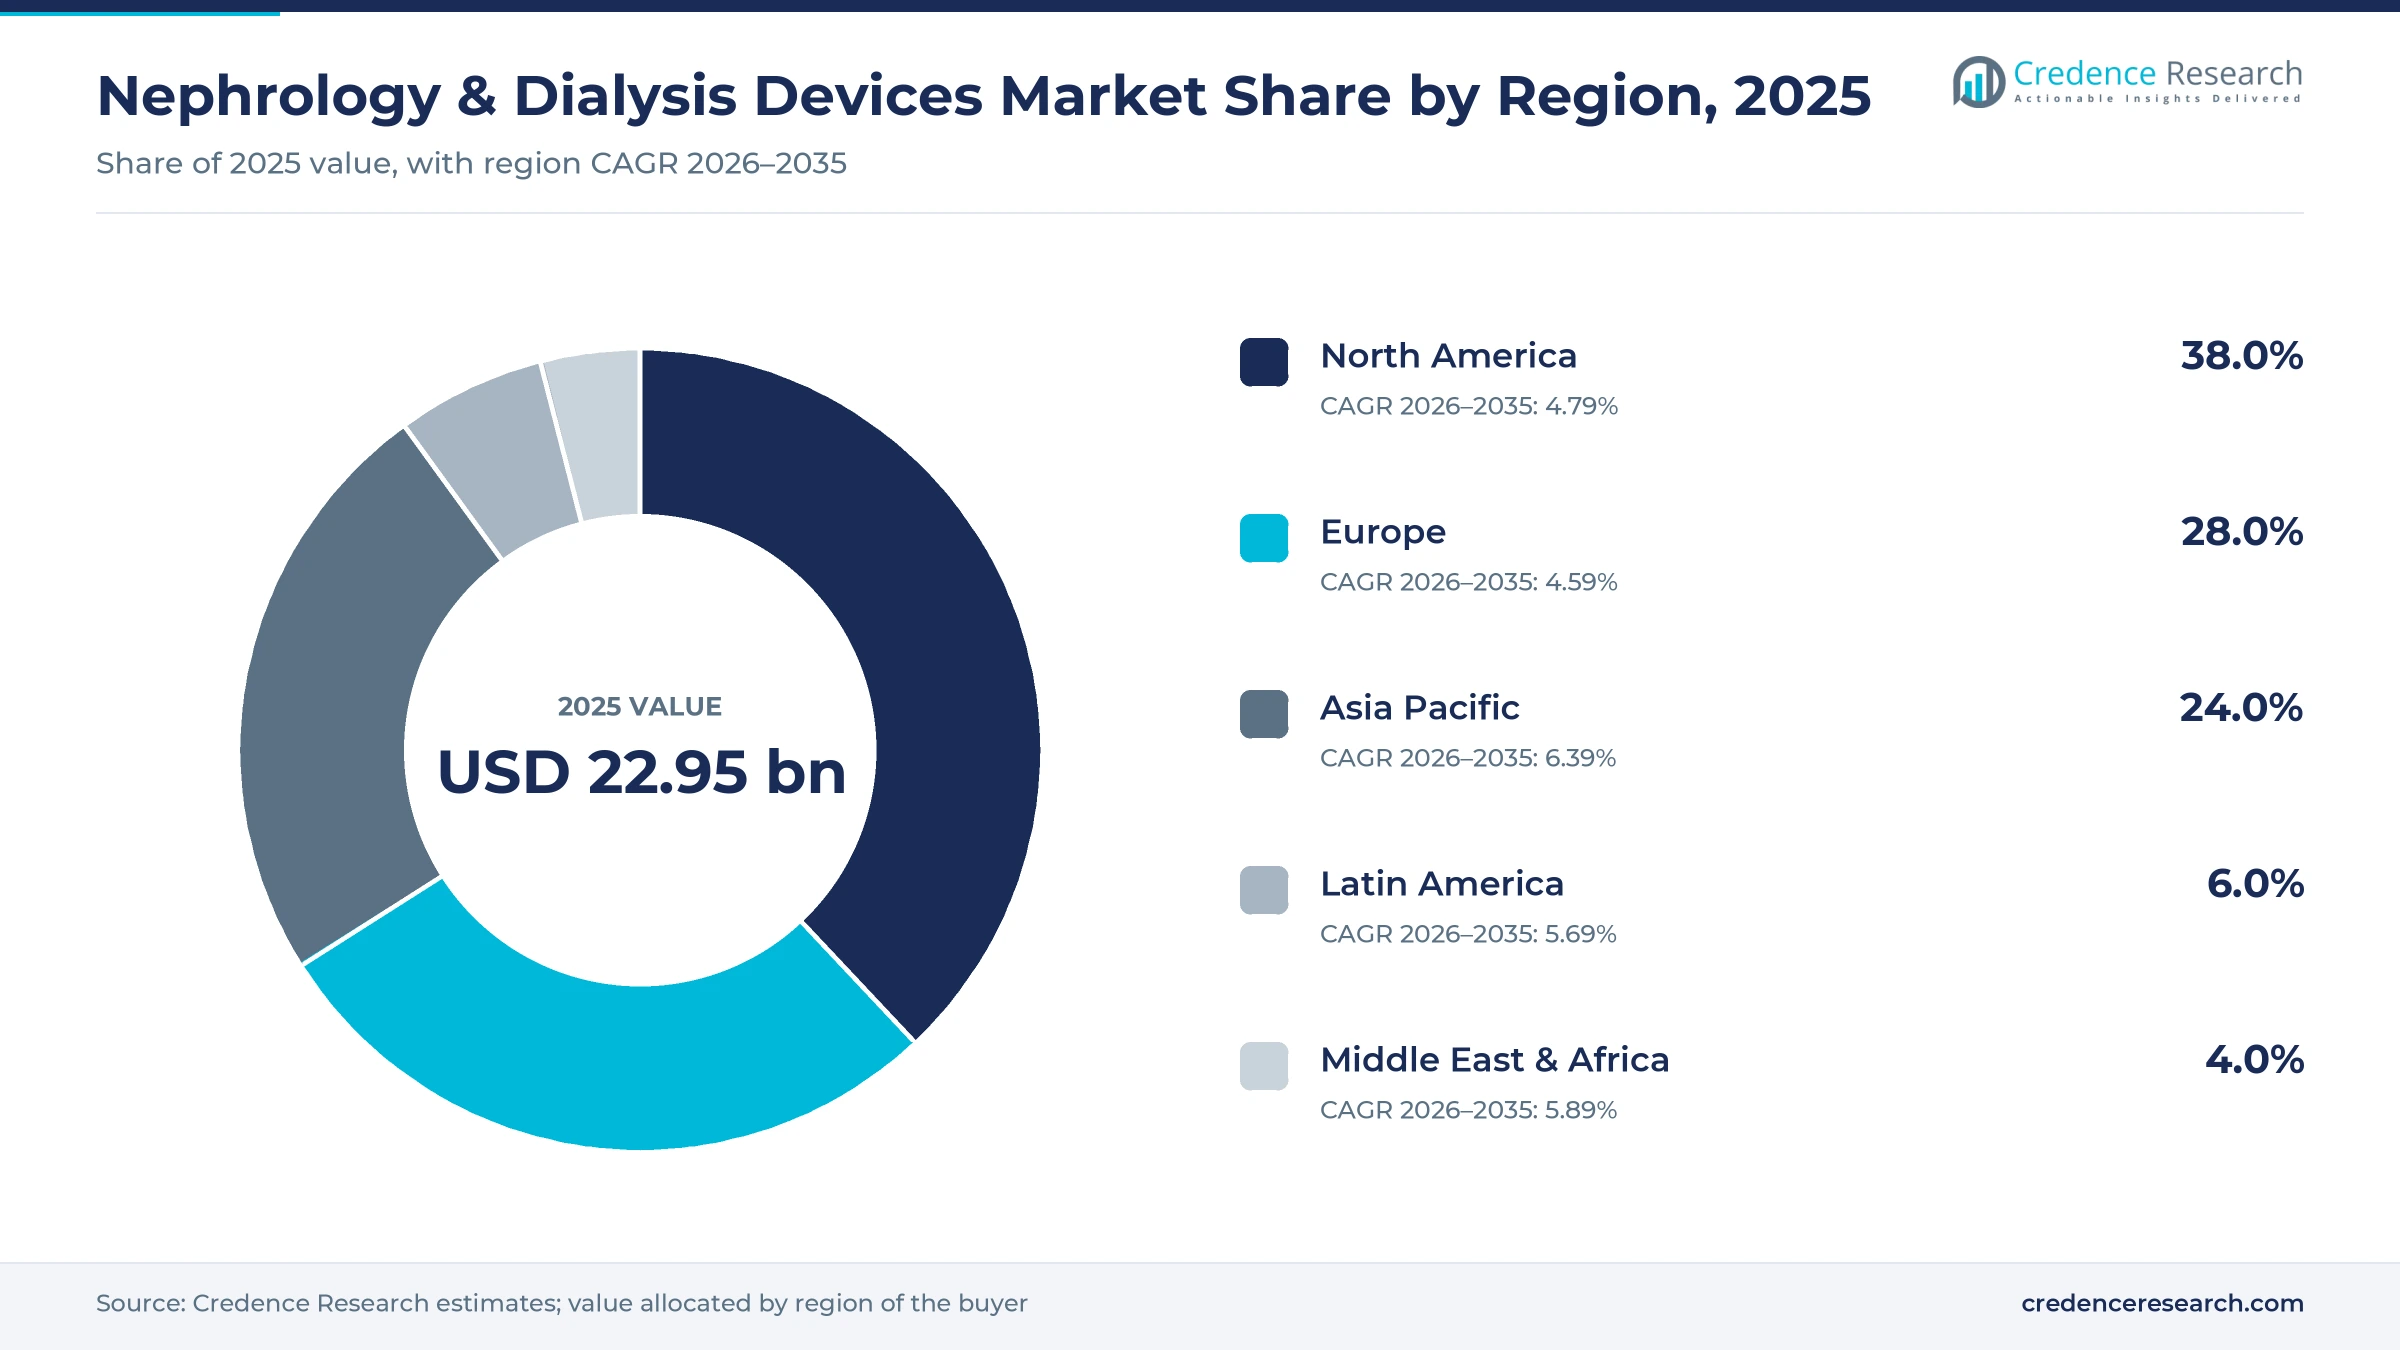
The global nephrology and dialysis devices market was valued at USD 22.95 billion in 2025 and is projected to increase from USD 24.16 billion in 2026 to USD 38.25 billion by 2035, registering a CAGR of 5.24% during 2026–2035. Demand comes from a growing number of people with chronic kidney disease and kidney failure, longer survival on dialysis and steady replacement of machines, dialyzers and water systems in treatment centers. North America held the largest regional share, 38.0% in 2025, because the United States treats a large dialysis population with high equipment and service spending. Asia Pacific is the fastest-growing region at 6.39% a year, as China and India add dialysis centers and expand public coverage for kidney failure. The technology picture changed in May 2025, when Fresenius Medical Care received U.S. clearance for an updated hemodiafiltration machine. As a result, U.S. providers are now evaluating convective therapy that was already common in Europe and Japan.
Which kidney care products does this analysis cover?
The analysis counts hemodialysis machines and dialyzers, peritoneal dialysis cyclers and sets, continuous renal replacement therapy systems, renal function monitors, dialysis water treatment systems, vascular access products and related equipment. Values are based on manufacturer selling prices, including disposables sold for use with each platform.
Dialysis services, clinic staffing, drugs and kidney transplants sit outside the scope of this analysis. The value chain runs from membrane and component makers through device manufacturers and distributors to hospitals, dialysis center chains, specialty clinics and home therapy programs that train patients and deliver supplies.
Nephrology & Dialysis Devices Market Insights
- The nephrology and dialysis devices market grows from USD 22.95 billion in 2025 to USD 38.25 billion by 2035, a 5.24% CAGR as kidney failure treatment volumes keep rising.
- North America held 38.0% of global kidney care equipment value in 2025, supported by a large U.S. dialysis population and high service spending.
- Hemodialysis devices led product spending with 52.0% of 2025 value, while peritoneal dialysis devices grow fastest at 6.08% a year.
- In May 2025, the World Health Assembly adopted its first resolution on kidney health, which places prevention and treatment access on national agendas.
- In July 2026, Nipro received FDA clearance for a medium cutoff dialyzer that works on existing machines, which widens competition in U.S. dialyzers.
Hemodialysis leads while home peritoneal care gains
Why do hemodialysis devices lead product spending?
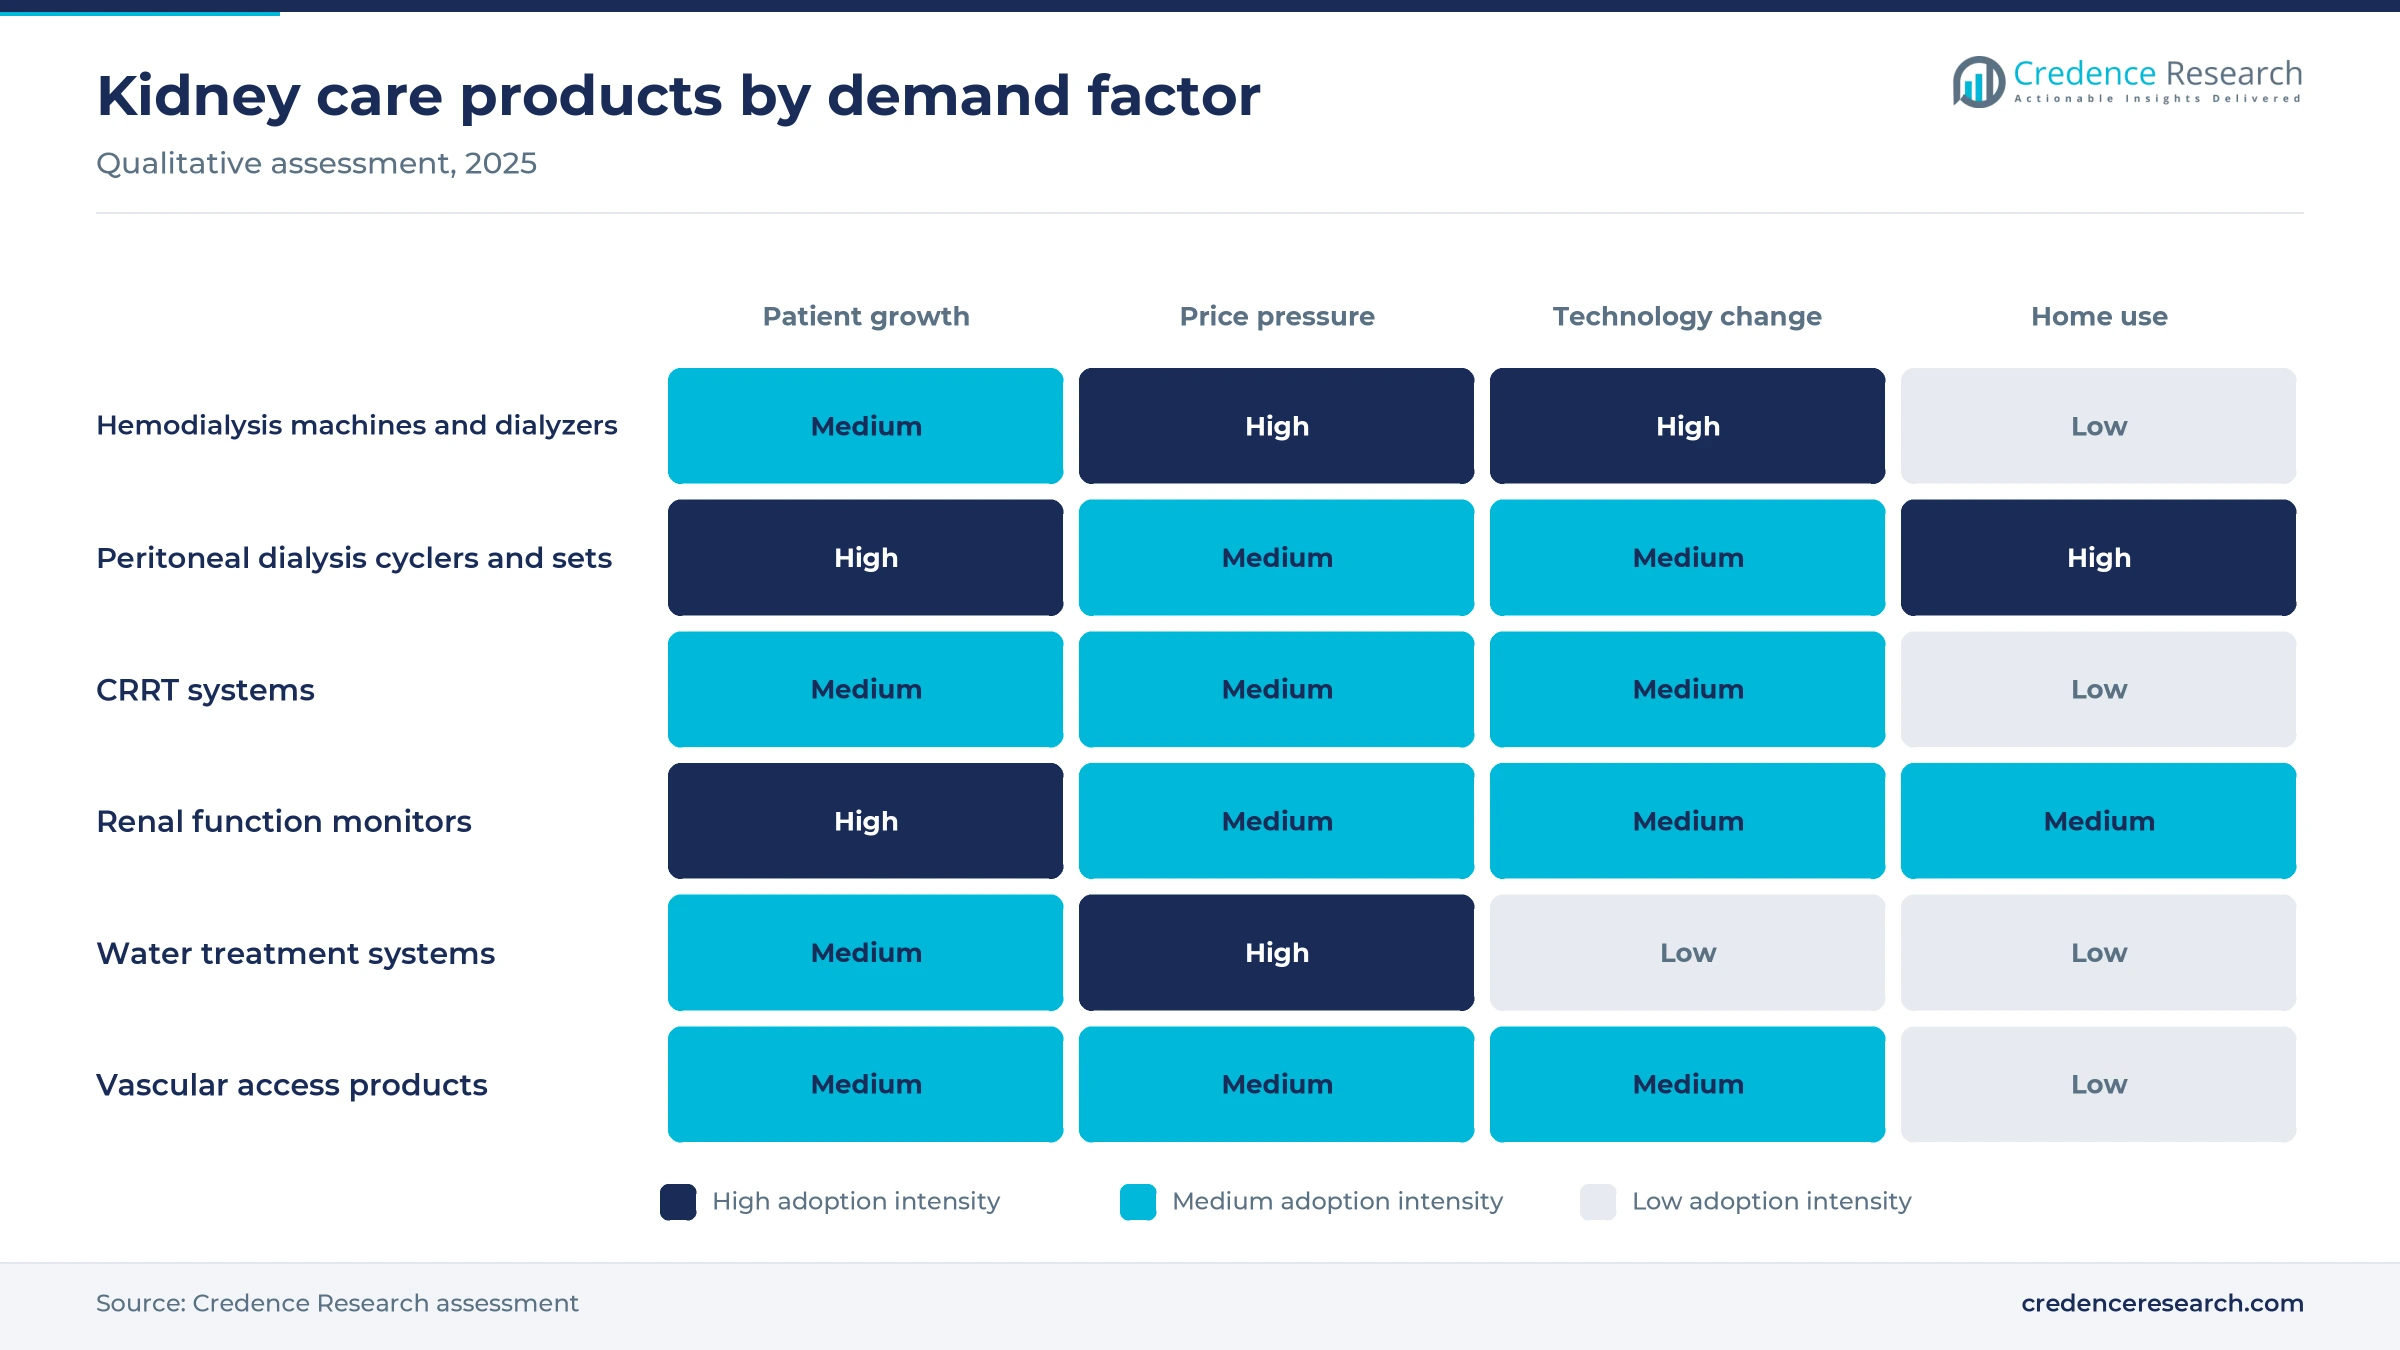
Based on product, the market is categorized into hemodialysis devices, peritoneal dialysis devices, continuous renal replacement therapy (CRRT) systems, renal function monitoring devices, dialysis water treatment systems, vascular access devices and others. Hemodialysis Devices led with a 52.0% share of 2025 value, because most kidney failure patients receive in-center treatment three times a week with single-use dialyzers. Peritoneal Dialysis Devices grow fastest at 6.08% a year, as payers and providers push home therapy. Intensive care units also need continuous renal replacement therapy for acute kidney injury.
Where are dialysis machines used most often?
Based on end user, the market is categorized into hospitals and dialysis centers, home healthcare settings and specialty nephrology clinics. Hospitals & Dialysis Centers led with a 74.0% share of 2025 value, because large center chains run machine fleets and buy disposables under long contracts. Home Healthcare Settings grow fastest at 6.44% a year, as more patients choose peritoneal dialysis or home hemodialysis after training. Specialty clinics add demand for monitoring and vascular access care.
| Segment Group | Leading Sub-segment | Share, 2025 | Fastest-growing Sub-segment | CAGR, 2026–2035 |
|---|---|---|---|---|
| By Product | Hemodialysis Devices | 52.0% | Peritoneal Dialysis Devices | 6.08% |
| By End User | Hospitals & Dialysis Centers | 74.0% | Home Healthcare Settings | 6.44% |
Request a Free Sample
Fill in your details and we'll send you a free sample report.
- Sample data tables & charts
- Research methodology
Chronic kidney disease and aging lift treatment volumes
How does chronic kidney disease prevalence sustain demand?
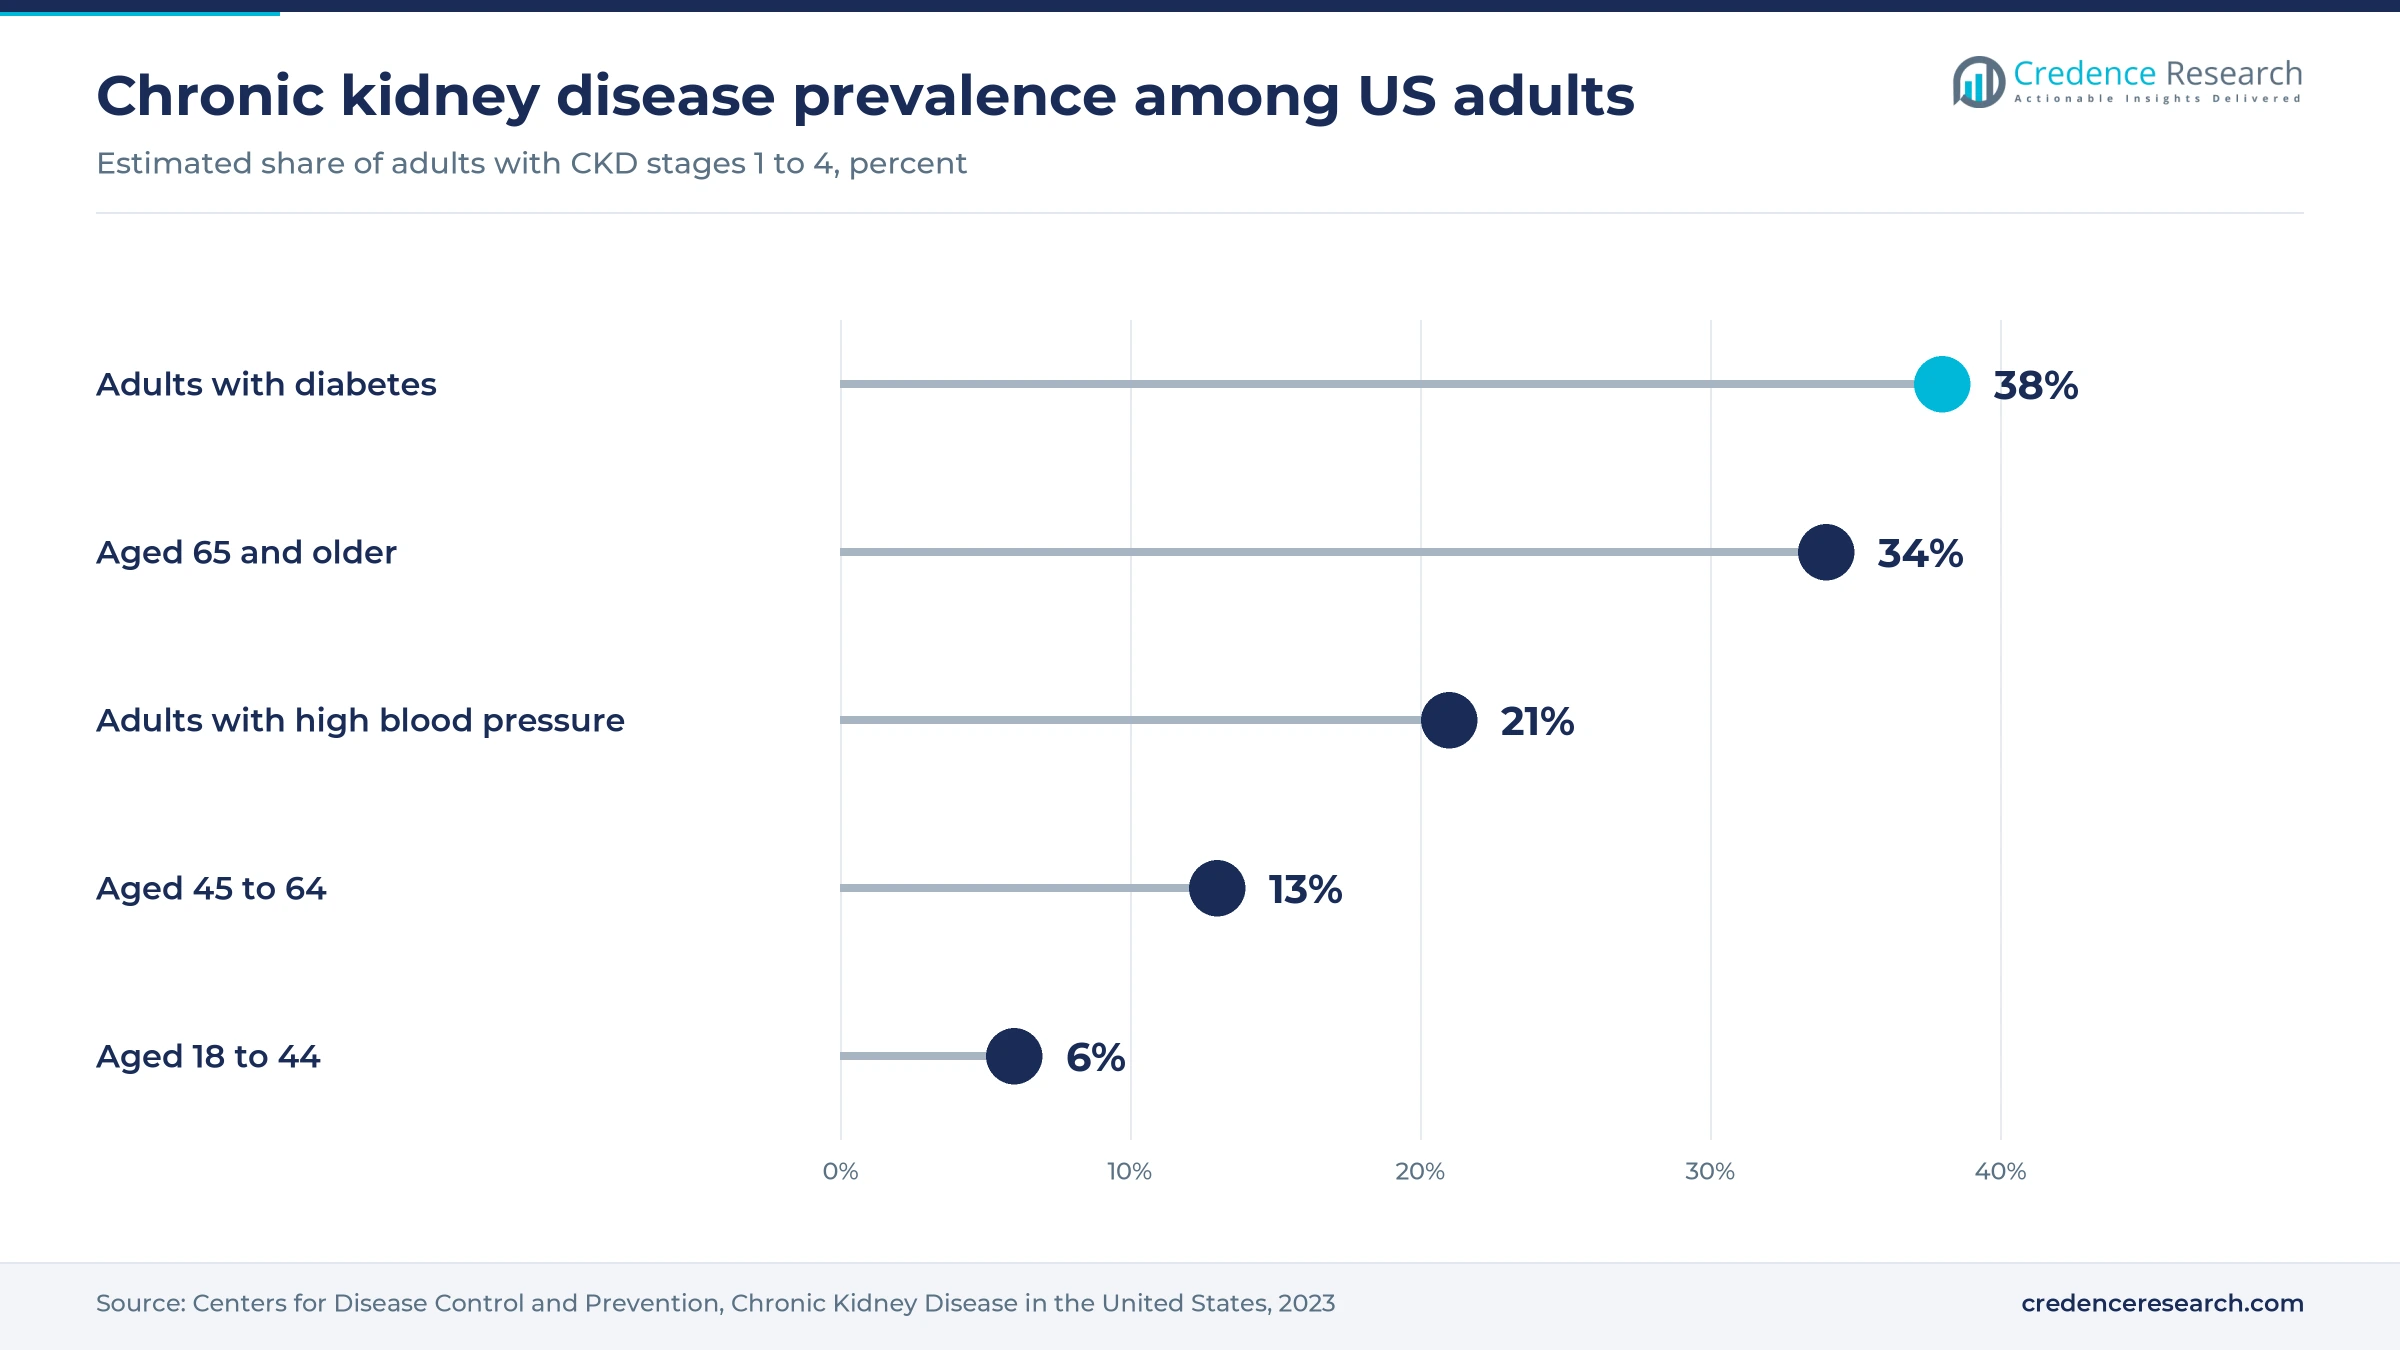
Chronic kidney disease prevalence sustains demand, because a share of patients progresses to kidney failure and needs dialysis for life. The Centers for Disease Control and Prevention estimates that 14% of U.S. adults, or about 37 million people, have the condition and about 87% of them do not know it. This late detection means many patients start dialysis urgently, often in hospital emergency or inpatient units. As a result, treatment volumes keep rising even where prevention programs improve.
Why do diabetes and high blood pressure lift kidney failure cases?
Diabetes and high blood pressure lift kidney failure cases, because both conditions damage kidney filters over many years. The same CDC estimates show that about 38% of adults with diabetes and 21% of adults with high blood pressure have chronic kidney disease. Rising diabetes rates in Asia, the Middle East and Latin America therefore add future dialysis patients in those regions. In turn, governments plan new treatment capacity, and suppliers sell more machines, dialyzers and water systems.
How does global policy attention support treatment access?
Global policy attention supports treatment access, because kidney care had long been absent from major health agendas. The International Society of Nephrology reported that the 78th World Health Assembly adopted the first resolution on kidney health in May 2025. The resolution encourages member states to improve prevention, early detection and access to kidney replacement therapy. As a result, ministries in lower-income countries have stronger grounds to fund dialysis centers and equipment purchases through 2035.
Why does aging raise the need for kidney replacement therapy?
Aging raises the need for kidney replacement therapy, because kidney function declines with age and older adults carry more chronic disease. The CDC estimates that 34% of U.S. adults aged 65 and older have chronic kidney disease, compared with 6% of adults aged 18 to 44. Many older patients also live with heart disease, which makes them likely candidates for chronic kidney disease monitoring and later dialysis. In turn, aging populations in Japan, Europe and North America keep treatment demand high.
Hemodiafiltration and home therapy reshape purchasing
How is hemodiafiltration shifting U.S. machine purchasing?
Hemodiafiltration is shifting U.S. machine purchasing, because providers want therapy that removes larger toxins than standard hemodialysis. In June 2025, Fresenius Medical Care announced a broader U.S. rollout of its 5008X CAREsystem after an updated FDA clearance in May 2025. The company cited the CONVINCE study, in which high-volume hemodiafiltration patients showed a 23% lower mortality rate than high-flux hemodialysis patients. As a result, U.S. center chains now weigh convective capability in fleet replacement plans.
Why are home dialysis programs rising in importance?
Home dialysis programs are rising in importance, because payers and patients both favor treatment outside crowded centers. In November 2024, Quanta Dialysis Technologies announced FDA clearance for home use of its compact hemodialysis system. Quanta noted that only 2.4% of about 550,000 U.S. dialysis patients received home hemodialysis, based on 2022 national renal data. This low base leaves wide room for growth in home treatment. In turn, suppliers are designing smaller machines with simpler training and remote monitoring.
Can new dialyzer membranes open demand without new machines?
Dialyzer makers have a clear opening in new membrane designs, because providers can adopt them without replacing installed machines. In July 2026, Nipro received FDA 510(k) clearance for the ELISIO-HX dialyzer, a medium cutoff product that removes larger middle molecules while retaining albumin. In July 2026, the company announced U.S. commercialization and said providers can use existing machines and workflows for the new therapy. As a result, membrane innovation can lift value per treatment even when machine fleets stay unchanged.
Where can monitoring and access products add value?
Monitoring and access products give suppliers room to add value, because many dialysis complications start with vascular access failure or late detection. Clinics need fistula surveillance, catheters and vascular grafts that stay open longer between interventions. Regular kidney function testing also helps nephrologists plan treatment well before kidney failure arrives. In turn, suppliers that link access, monitoring and therapy data can strengthen ties with large providers.
Staffing, water quality and payment limits slow uptake
Why do staffing shortages limit treatment capacity?
Staffing shortages limit treatment capacity, because each dialysis shift needs trained nurses and technicians at the chair. Many centers in North America and Europe struggle to hire enough staff, which caps the number of shifts they can run. Home therapy programs also need training nurses who teach patients and support them remotely. As a result, providers delay new center openings and favor equipment that cuts setup time and simplifies daily operation.
How do water quality requirements raise setup costs?
Water quality requirements raise setup costs, because hemodialysis uses large volumes of purified water for each treatment. Centers must install reverse osmosis systems, distribution loops and regular testing to meet safety standards. These costs are hardest to carry in rural areas and lower-income countries where water supply is unreliable. In turn, many new centers there start small, which slows machine purchases and favors suppliers that bundle water systems.
Why do payment limits slow upgrades in many countries?
Payment limits slow upgrades in many countries, because governments pay dialysis providers fixed rates per treatment. Providers with tight margins often extend machine lives and choose lower-priced dialyzers in public tenders. Several countries in Asia and Latin America still cover dialysis only partly, so patients pay part of the cost. As a result, value growth in these markets trails the growth in treated patients.
How does late diagnosis keep patients in costly urgent care?
Late diagnosis keeps patients in costly urgent care, because many people learn about kidney failure only when symptoms become severe. Patients who start dialysis urgently usually begin in hospitals with temporary catheters rather than planned fistulas. This path raises infection risk and reduces the chance of choosing home therapy later. In turn, screening with renal biomarkers and primary care testing matters for the long-term mix of therapies.
North America leads as Asia Pacific adds capacity
| Region | Value, 2025 (USD billion) | Share, 2025 | CAGR, 2026–2035 |
|---|---|---|---|
| North America | 8.72 | 38.0% | 4.79% |
| Europe | 6.43 | 28.0% | 4.59% |
| Asia Pacific | 5.51 | 24.0% | 6.39% |
| Latin America | 1.38 | 6.0% | 5.69% |
| Middle East & Africa | 0.92 | 4.0% | 5.89% |
Why does North America hold the largest regional share?
North America held a 38.0% share of 2025 value and grows at 4.79% a year through 2035. The United States drives this position, because a large dialysis population receives treatment in center chains with high equipment and service spending. Fresenius Medical Care began deploying its 5008X machine to a first wave of U.S. clinics in 2025, which opens a new replacement cycle. Home hemodialysis remains a small share of U.S. treatment, so new home systems add room for growth.
Why do China and India drive Asia Pacific kidney care growth?
Asia Pacific held a 24.0% share of 2025 value and is the fastest-growing region at 6.39% a year. China and India add dialysis centers as public insurance programs expand coverage for kidney failure. Japan has a large treated kidney failure population and a strong domestic supply base led by Nikkiso, Nipro and Asahi Kasei Corporation. This mix of volume growth and local manufacturing keeps competition intense across the region.
What shapes demand across Europe?
Europe held a 28.0% share of 2025 value and grows at 4.59% a year, the slowest pace of the five regions. Germany, France, Italy and Spain account for much of the spending, and hemodiafiltration is already common in many European centers. National health systems buy through tenders that reward price and service. However, long machine lives and fixed treatment payments keep value growth below the global average.
Where is Latin America adding demand?
Latin America held a 6.0% share of 2025 value and grows at 5.69% a year through 2035. Brazil and Mexico lead regional spending, because diabetes rates are high and private center networks are expanding. Coverage gaps still limit access in poorer areas, which keeps many patients on late, urgent treatment.
What limits growth in the Middle East and Africa?
The Middle East and Africa held a 4.0% share of 2025 value and grows at 5.89% a year through 2035. Gulf states fund modern centers with high diabetes-related demand, while much of Africa has limited dialysis capacity. The 2025 kidney health resolution gives health ministries a framework to plan new treatment services.
FDA clearances and ownership changes since 2024
| Development | Status and market relevance |
|---|---|
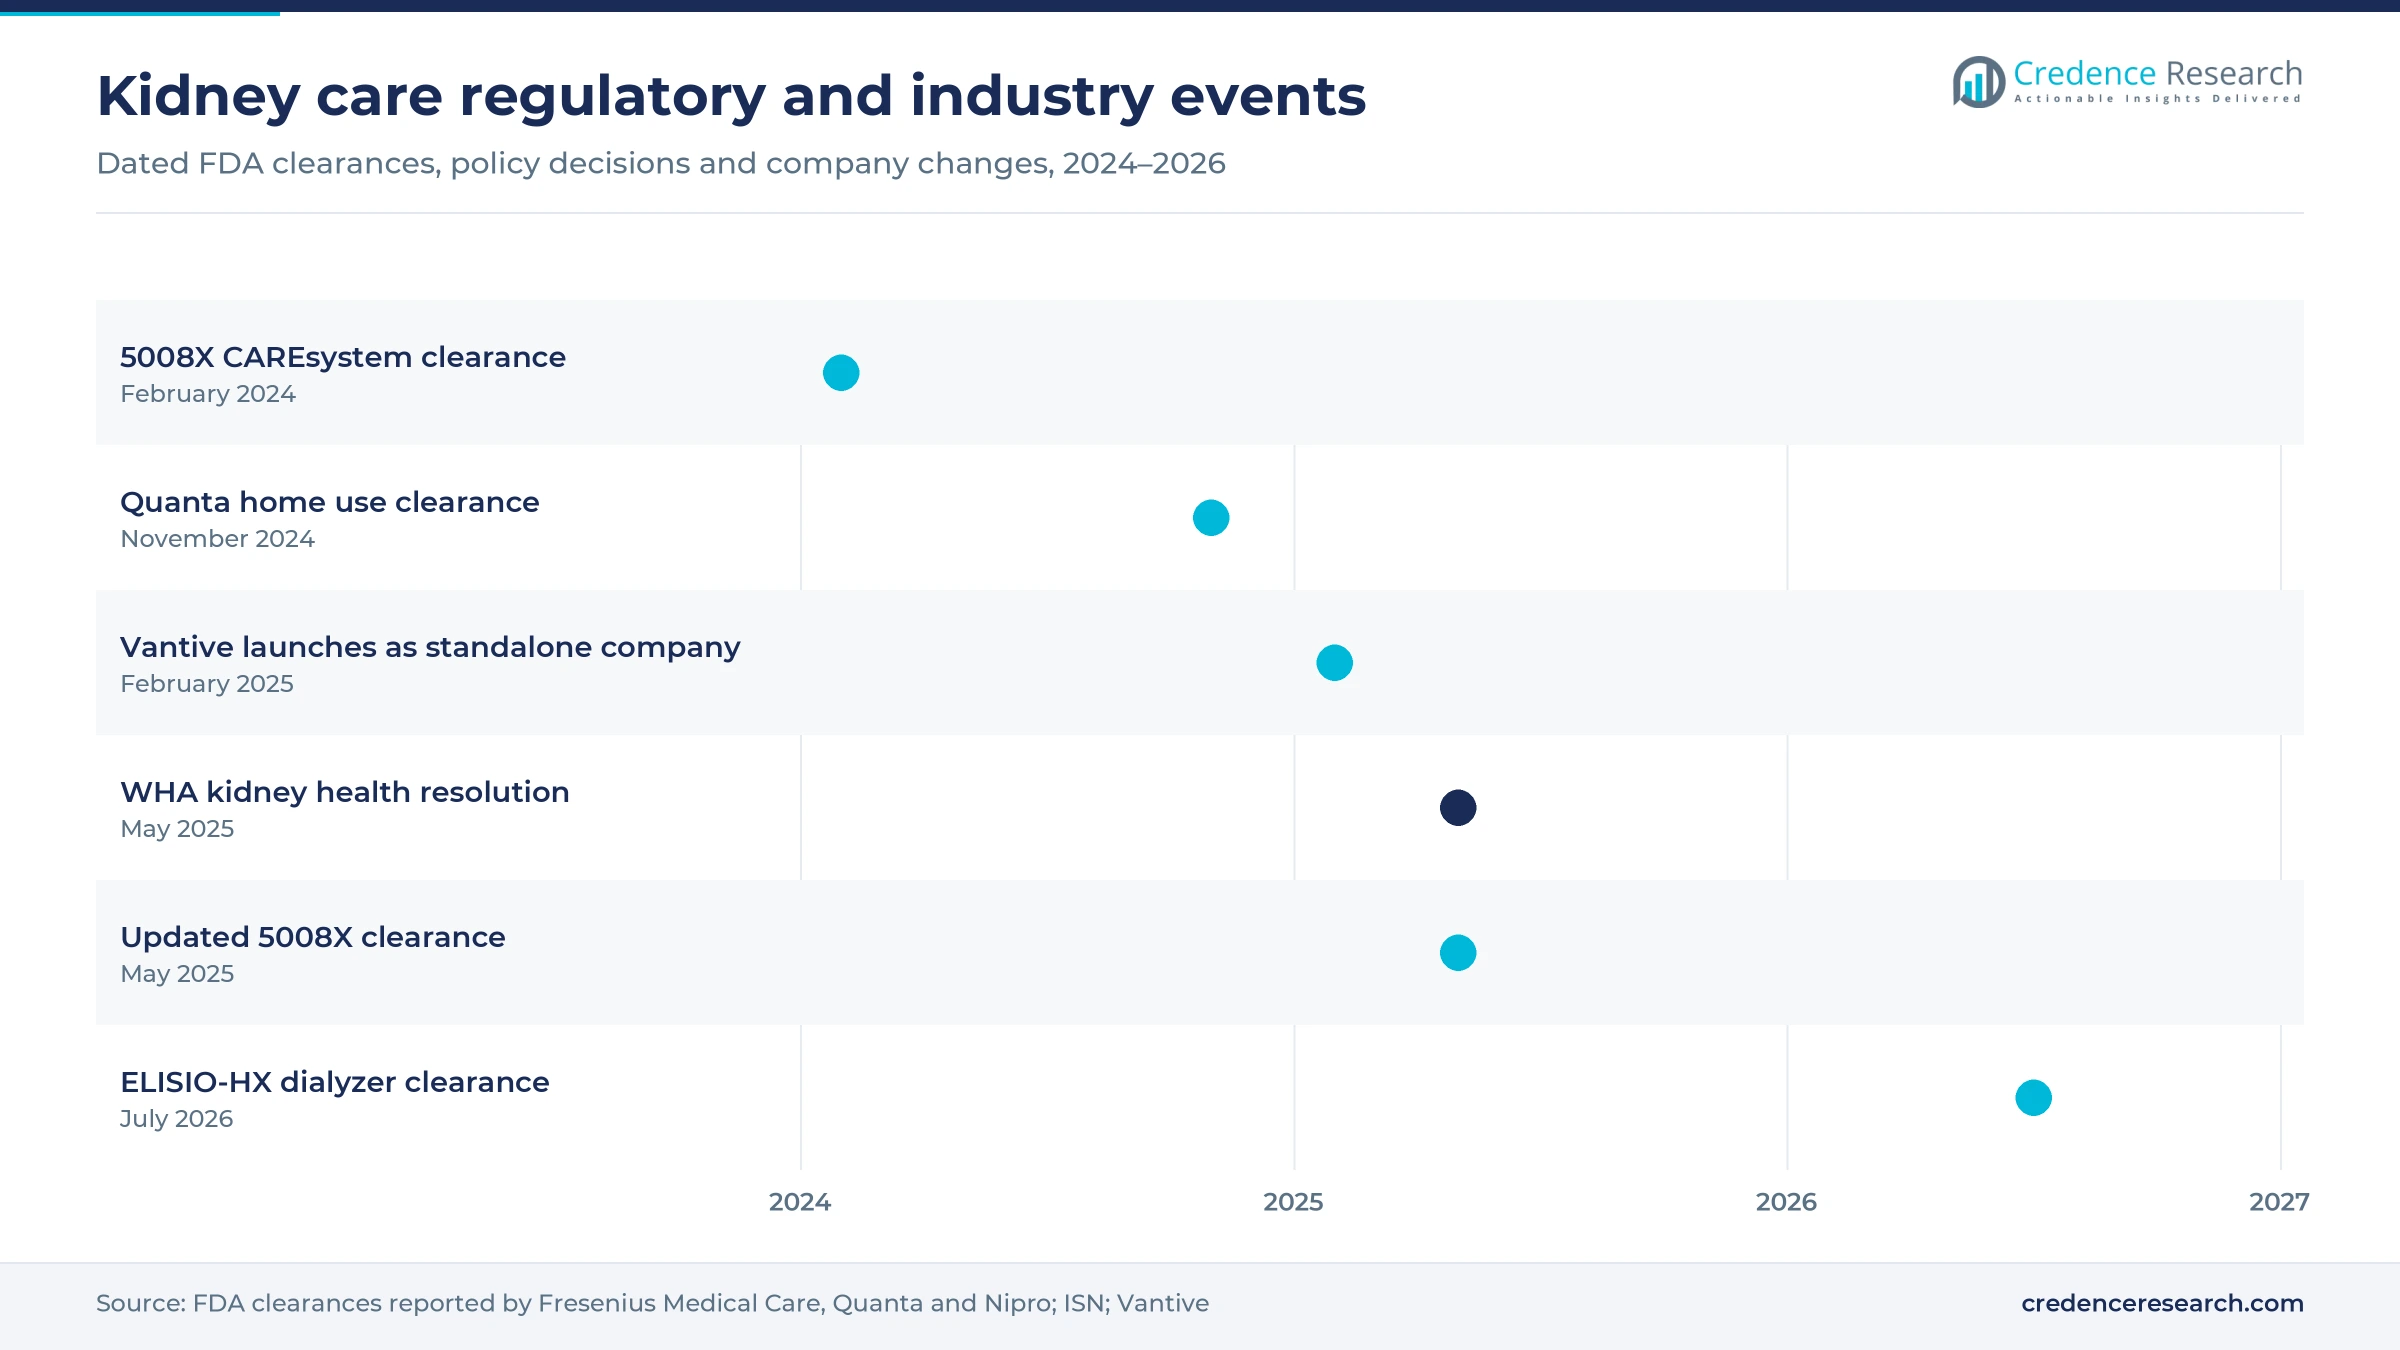
| In February 2024, Fresenius Medical Care received FDA 510(k) clearance for its hemodiafiltration-capable 5008X CAREsystem. | Cleared; enabled pilot clinic testing and user studies in the United States |
| In November 2024, Quanta Dialysis Technologies confirmed FDA 510(k) clearance for home use of the Quanta Dialysis System. | Cleared; extends a compact hemodialysis system from acute care to the home |
| In February 2025, Baxter Kidney Care launched as Vantive, a standalone company, after its acquisition by funds managed by Carlyle. | Completed; Vantive serves patients in more than 100 countries |
| In May 2025, Fresenius Medical Care received FDA 510(k) clearance for an updated 5008X CAREsystem with chairside data exchange. | Cleared; supports the first wave of U.S. clinic rollouts from June 2025 |
| In July 2026, Nipro received FDA 510(k) clearance for the ELISIO-HX medium cutoff dialyzer. | Cleared; commercialization in the United States began immediately |
Membranes, connected machines and home systems advance
- High-volume hemodiafiltration adds convective clearance to standard hemodialysis, which removes larger toxins and has been linked with lower mortality in clinical study.
- Medium cutoff membranes remove larger middle molecules while keeping albumin in the blood, which lets providers improve therapy on existing machines.
- Compact home hemodialysis systems use smaller machines with simpler setup, which makes treatment at home practical for more patients and caregivers.
- Connected chairside data exchange sends treatment data from machines to clinic records, which cuts manual charting and helps nurses track each session.
- Automated peritoneal dialysis cyclers run exchanges overnight with remote monitoring, which lets clinicians adjust therapy without frequent clinic visits.
Need a Custom Version of This Report?
Tailor the scope, geography, or segments to your exact requirements.
- Custom geography or segment scope
- Direct access to our analyst team
Dialysis suppliers compete on therapy breadth and service
Competition is led by a small number of companies with broad kidney care portfolios, large installed bases and long service relationships. Fresenius Medical Care AG & Co. KGaA combines machines, dialyzers and water systems with its own clinic network. In February 2025, Baxter International Inc. completed the sale of its kidney care business, which launched as Vantive after the Carlyle acquisition. B.Braun Melsungen AG, Nipro Corporation, Nikkiso Co. Ltd and Asahi Kasei Corporation compete strongly in machines, dialyzers and blood lines, with deep roots in Europe and Japan. Becton, Dickinson and Company and Boston Scientific Corporation serve vascular access and related procedures. Cantel Medical Corporation is linked with water treatment and reprocessing products, while Dornier MedTech GmbH serves kidney stone care. As a result, buyers favor suppliers that cover several therapies and provide reliable field service.
Companies profiled and their roles in this market
| Company | Type | Role in the market |
|---|---|---|
| Fresenius Medical Care AG & Co. KGaA | Integrated | 5008X CAREsystem, dialyzers, water technology and home therapies |
| Baxter International Inc. | Diversified | Former kidney care unit now operating as Vantive |
| B.Braun Melsungen AG | Diversified | Hemodialysis machines, dialyzers and acute therapy products |
| Nipro Corporation | Specialist | ELISIO dialyzers and hemodialysis products |
| Nikkiso Co. Ltd | Specialist | Hemodialysis machines with a strong base in Japan |
| Asahi Kasei Corporation | Diversified | Dialyzer membranes and blood purification products |
| Becton, Dickinson and Company | Diversified | Vascular access catheters and related products |
| Boston Scientific Corporation | Diversified | Interventional products used in access care |
| Cantel Medical Corporation | Specialist | Water treatment and reprocessing products for dialysis |
| Dornier MedTech GmbH | Specialist | Lithotripsy and urology systems for kidney stone care |
Home care and convective therapy set the growth pace
Credence Research's view is that home therapy and convective treatment will set the pace of growth through 2035, because providers want better outcomes without adding center staff. The overall market grows at 5.24% a year, supported by rising chronic kidney disease prevalence, aging and new policy attention after the 2025 kidney health resolution. Peritoneal dialysis and home settings grow faster than in-center hemodialysis. Companies that combine machines, membranes, water systems and remote support will win the most provider contracts.
How Credence Research sized kidney care equipment
The report uses 2025 as the base year and 2026 to 2035 as the forecast period. Market values come from the Credence Research model, which builds spending by product, end user and region. Regional and segment splits are Credence Research estimates informed by U.S. public health statistics, World Health Assembly decisions, U.S. regulator clearances and company press releases. No primary interviews or surveys were used in preparing this edition of the report.
Kidney replacement equipment outlook to 2035
By 2035, the nephrology and dialysis devices market is projected to reach USD 38.25 billion, with growth led by hemodiafiltration machines, new dialyzer membranes and home therapy systems. Hemodialysis devices will remain the largest product area, as center chains renew machine fleets and buy disposables for each treatment. North America keeps the highest spending per patient, while Asia Pacific adds the most new treatment capacity. Home settings will take a larger share of value, because payers and patients prefer treatment outside centers. As a result, advantage will depend on outcomes, simplicity and service.
Frequently Asked Questions
How big is the global nephrology and dialysis devices market?
Which product leads nephrology and dialysis device spending?
Which region leads spending on dialysis equipment?
Which end user accounts for most dialysis equipment use?
Why is hemodiafiltration gaining attention in the United States?
What recent FDA actions affect dialysis devices?
Who are the leading nephrology and dialysis device companies?
What restrains growth in nephrology and dialysis devices?
Table of Content
Chapter 1 Market Segmentation
- 1.1 Segmentation Framework
- 1.1.1 Product and Service Classification
- 1.1.2 Application and End-Use Classification
- 1.1.3 Technology and Solution Classification
- 1.1.4 Customer and Distribution Channel Classification
- 1.1.5 Geographic Segmentation
- 1.1.6 Market Segment Definitions and Boundaries
- 1.2 By Product
- 1.2.1 Hemodialysis Devices
- 1.2.2 Peritoneal Dialysis Devices
- 1.2.3 Continuous Renal Replacement Therapy (CRRT) Systems
- 1.2.4 Renal Function Monitoring Devices
- 1.2.5 Dialysis Water Treatment Systems
- 1.2.6 Vascular Access Devices
- 1.2.7 Others
- 1.3 By End User
- 1.3.1 Hospitals & Dialysis Centers
- 1.3.2 Home Healthcare Settings
- 1.3.3 Specialty Nephrology Clinics
Chapter 2 Introduction
- 2.1 Report Objectives and Scope
- 2.2 Product Definition and Industry Terminology
- 2.3 Market Inclusions and Exclusions
- 2.4 Research Process
- 2.4.1 Primary Research and Expert Interviews
- 2.4.2 Secondary Research and Source Review
- 2.4.3 Top-Down and Bottom-Up Estimation
- 2.4.4 Data Triangulation and Verification
- 2.5 Market Size Measurement Basis
- 2.5.1 2025: USD 22.95 billion → 2035: USD 38.25 billion
- 2.6 Historical and Forecast Reference Periods
- 2.6.1 Historical Period: 2018-2025
- 2.6.2 Base Year: 2025
- 2.6.3 Forecast Period: 2025-2035
- 2.7 Research Assumptions and Limitations
Chapter 3 Executive Summary
- 3.1 Market Snapshot and Key Findings
- 3.2 Base-Year Market Size, 2025
- 3.3 Forecast Market Size, 2035
- 3.4 Revenue and Volume Growth Outlook
- 3.5 Key Demand and Supply Indicators
- 3.6 Leading Market Segments
- 3.7 Fastest-Growing Market Opportunities
- 3.8 Regional Performance Highlights
- 3.9 Technology and Industry Transformation
- 3.10 Competitive Landscape Summary
- 3.11 Analyst View and Strategic Implications
Chapter 4 Global Nephrology & Dialysis Devices Market Trends and Developments
- 4.1 Historical Industry Development, 2018-2025
- 4.2 Recent Market Trends and Developments
- 4.3 Demand and Customer Behavior Trends
- 4.4 Technology and Product Innovation
- 4.5 Artificial Intelligence, Automation and Digitalization
- 4.6 Local Manufacturing and Supply Chain Realignment
- 4.7 Industry Partnerships, Mergers and Acquisitions
- 4.8 Sustainability and Circular Economy Developments
- 4.9 Government and Private Sector Investment Trends
- 4.10 Emerging Business Models and Commercialization
- 4.11 Industry Developments and Announcements
Chapter 5 Global Nephrology & Dialysis Devices Market Production, Supply and Demand Analysis
- 5.1 Demand Trend and Consumption Analysis, 2018-2025
- 5.2 Demand Forecast, 2025-2035
- 5.3 Production and Output Trend, 2018-2025
- 5.4 Production and Output Forecast, 2025-2035
- 5.5 Installed Capacity and Capacity Utilization
- 5.6 Company-Wise Production Plants and Statistics
- 5.6.1 Installed Production Capacity
- 5.6.2 Actual Production
- 5.6.3 Planned Capacity and Expansion Targets
- 5.7 Supply Chain Structure and Procurement Trends
- 5.8 Supply-Demand Gap and Bottlenecks
- 5.9 Import Dependence and Sourcing Structure
- 5.10 Contract Manufacturing and Outsourcing
- 5.11 Regional Supply and Demand Concentration
Chapter 6 Global Nephrology & Dialysis Devices Market Pricing Analysis
- 6.1 Pricing Structure and Measurement
- 6.2 Historical Pricing Trends, 2018-2025
- 6.3 Pricing Outlook, 2025-2035
- 6.4 Average Selling Price and Unit Economics
- 6.5 Pricing by Product and Market Segment
- 6.6 Geographic Pricing Differences
- 6.7 Key Input, Energy, Labor and Logistics Costs
- 6.8 Contract Pricing and Purchasing Models
- 6.9 Pricing Sensitivity and Competitive Positioning
- 6.10 Price, Margin and Profitability Implications
Chapter 7 Global Nephrology & Dialysis Devices Market Dynamics
- 7.1 Market Growth Drivers
- 7.1.1 Demand-Side Drivers
- 7.1.2 Technology and Innovation Drivers
- 7.1.3 Infrastructure and Investment Drivers
- 7.1.4 Regulatory and Policy Drivers
- 7.2 Market Restraints
- 7.2.1 Cost and Affordability Constraints
- 7.2.2 Technology and Adoption Barriers
- 7.2.3 Supply Chain and Operational Constraints
- 7.3 Market Challenges
- 7.3.1 Competitive Pressure and Margin Erosion
- 7.3.2 Skills, Infrastructure and Implementation Gaps
- 7.4 Emerging Market Opportunities
- 7.5 Market Dynamics Impact and Time-Horizon Assessment
Chapter 8 Global Nephrology & Dialysis Devices Value Chain Analysis
- 8.1 Industry Value Chain Overview
- 8.2 Upstream Suppliers and Critical Inputs
- 8.3 Technology and Component Providers
- 8.4 Manufacturing or Service Delivery
- 8.5 Distribution, Channel Partners and Integrators
- 8.6 Downstream Applications and End Users
- 8.7 Value Addition and Profit Pools
- 8.8 Vertical Integration and Outsourcing
- 8.9 Supplier Concentration and Risk
- 8.10 Supply Chain Localization and Resilience
Chapter 9 Global Nephrology & Dialysis Devices Market Regulations and Policies
- 9.1 Relevant Laws, Standards and Compliance Frameworks
- 9.2 Product, Service, Safety and Quality Requirements
- 9.3 Government Policies, Incentives and Subsidies
- 9.4 Imports, Exports and Trade Barriers
- 9.5 Public Procurement and Local Content Requirements
- 9.6 Environmental and Sustainability Compliance
- 9.7 Upcoming Policy Changes and Market Implications
Chapter 10 Global Nephrology & Dialysis Devices Market Hotspots and Opportunities
- 10.1 Market Opportunity Mapping and Growth Hotspots
- 10.2 High-Growth Applications and Customer Groups
- 10.3 Underserved Markets and White-Space Opportunities
- 10.4 Emerging Technology and Product Opportunities
- 10.5 New Capacity and Investment Hotspots
- 10.6 Market Entry and Expansion Opportunities
- 10.7 Distribution and Partnership Opportunities
- 10.8 Near-Term and Long-Term Commercial Potential
- 10.9 Opportunity Attractiveness and Execution Risks
Chapter 11 Global Nephrology & Dialysis Devices Market Outlook, 2025-2035
- 11.1 Market Size and Analysis
- 11.1.1 Revenue (Market Measurement: 2025: USD 22.95 billion → 2035: USD 38.25 billion)
- 11.1.2 Market Volume and Quantity Sold
- 11.1.3 Historical Market Size, 2018-2025
- 11.1.4 Base-Year Market Size, 2025
- 11.2 Market Forecast, 2025-2035
- 11.2.1 Revenue Forecast to 2035
- 11.2.2 Volume Forecast to 2035
- 11.2.3 CAGR and Year-on-Year Growth
- 11.2.4 Incremental Revenue Opportunity
- 11.3 Forecast Assumptions and Scenario Analysis
- 11.3.1 Base-Case Forecast
- 11.3.2 Optimistic and Conservative Scenarios
- 11.3.3 Technology, Pricing and Policy Sensitivities
- 11.4 Market Attractiveness and Growth Outlook
Chapter 12 Global Nephrology & Dialysis Devices Market Segmentation and Outlook
- 12.1 Segmentation Summary and Market Shares, 2025
- 12.2 Largest and Fastest-Growing Segments
- 12.3 By Product - Market Size and Forecast, 2025-2035
- 12.3.1 Segment Definition and Scope
- 12.3.2 Historical Market Size, 2018-2025
- 12.3.3 Revenue Forecast, 2025-2035
- 12.3.4 Volume Forecast, 2025-2035
- 12.3.5 Base-Year Market Share, 2025
- 12.3.6 Segment CAGR and Growth Drivers
- 12.3.7 Subsegment Market Size and Forecast
- 12.3.7.1 Hemodialysis Devices
- 12.3.7.2 Peritoneal Dialysis Devices
- 12.3.7.3 Continuous Renal Replacement Therapy (CRRT) Systems
- 12.3.7.4 Renal Function Monitoring Devices
- 12.3.7.5 Dialysis Water Treatment Systems
- 12.3.7.6 Vascular Access Devices
- 12.3.7.7 Others
- 12.3.8 Subsegment Pricing and Adoption Trends
- 12.3.9 Leading Suppliers and Competition
- 12.3.10 Regional Demand and Opportunities
- 12.4 By End User - Market Size and Forecast, 2025-2035
- 12.4.1 Segment Definition and Scope
- 12.4.2 Historical Market Size, 2018-2025
- 12.4.3 Revenue Forecast, 2025-2035
- 12.4.4 Volume Forecast, 2025-2035
- 12.4.5 Base-Year Market Share, 2025
- 12.4.6 Segment CAGR and Growth Drivers
- 12.4.7 Subsegment Market Size and Forecast
- 12.4.7.1 Hospitals & Dialysis Centers
- 12.4.7.2 Home Healthcare Settings
- 12.4.7.3 Specialty Nephrology Clinics
- 12.4.8 Subsegment Pricing and Adoption Trends
- 12.4.9 Leading Suppliers and Competition
- 12.4.10 Regional Demand and Opportunities
- 12.5 Segment Growth Comparison
- 12.6 Segment Attractiveness and Priority Matrix
Chapter 13 Global Nephrology & Dialysis Devices End-Use and Application Market Outlook
- 13.1 End-Use Industry and Customer Demand Structure
- 13.2 Leading Applications and Customer Groups
- 13.3 End-Use Market Size, Share and Forecast
- 13.4 Major End-Use Industry Deep Dives
- 13.4.1 Customer Requirements and Use Cases
- 13.4.2 Demand and Replacement Cycles
- 13.4.3 Technical and Regulatory Considerations
- 13.4.4 Purchasing and Procurement Models
- 13.4.5 Leading Vendors and Distribution Channels
- 13.4.6 Forecast and Commercial Opportunities
- 13.5 Emerging Applications and Cross-Segment Demand
- 13.6 End-Use Industry Investment Priorities
Chapter 14 Global Nephrology & Dialysis Devices Geographic Market Outlook, 2025-2035
- 14.1 Regional Market Size and Share, 2025
- 14.2 Regional Market Forecast, 2025-2035
- 14.3 Regional Pricing, Production and Demand Differences
- 14.4 North America
- 14.4.1 United States
- 14.4.2 Canada
- 14.4.3 Mexico
- 14.5 Europe
- 14.5.1 Germany
- 14.5.2 France
- 14.5.3 Italy
- 14.5.4 United Kingdom
- 14.5.5 Spain
- 14.5.6 Poland
- 14.5.7 Russia
- 14.5.8 Netherlands
- 14.5.9 Belgium
- 14.5.10 Sweden
- 14.5.11 Denmark
- 14.5.12 Norway
- 14.5.13 Rest of Europe
- 14.6 Asia Pacific
- 14.6.1 China
- 14.6.2 India
- 14.6.3 Japan
- 14.6.4 South Korea
- 14.6.5 Thailand
- 14.6.6 Indonesia
- 14.6.7 Vietnam
- 14.6.8 Malaysia
- 14.6.9 Australia
- 14.6.10 Rest of Asia Pacific
- 14.7 Latin America
- 14.7.1 Brazil
- 14.7.2 Argentina
- 14.7.3 Colombia
- 14.7.4 Chile
- 14.7.5 Rest of Latin America
- 14.8 Middle East
- 14.8.1 Saudi Arabia
- 14.8.2 United Arab Emirates
- 14.8.3 Turkey
- 14.8.4 Israel
- 14.8.5 Iran
- 14.8.6 Rest of the Middle East
- 14.9 Africa
- 14.9.1 South Africa
- 14.9.2 Egypt
- 14.9.3 Nigeria
- 14.9.4 Morocco
- 14.9.5 Rest of Africa
- 14.10 Regional Investment, Policy and Supply Chain Differences
- 14.11 Regional Competitive Landscape
- 14.12 Geographic Growth Hotspots
Chapter 15 Global Nephrology & Dialysis Devices Technology, Innovation and Sustainability Outlook
- 15.1 Technology Landscape and Maturity
- 15.2 Product, Process and Service Innovation
- 15.3 AI, Automation and Digital Tools in the Industry
- 15.4 Technology Adoption and Performance Benchmarking
- 15.5 Innovation Pipeline and R&D Investment
- 15.6 Patent and Intellectual Property Trends
- 15.7 Energy Efficiency and Resource Management
- 15.8 Sustainability, Recycling and Circularity
- 15.9 Technology Roadmap, 2025-2035
- 15.10 Risks of Obsolescence and Technology Substitution
Chapter 16 Global Nephrology & Dialysis Devices Market Key Strategic Imperatives
- 16.1 Growth and Market Entry Priorities
- 16.2 High-Return Products and Segments
- 16.3 Pricing, Profitability and Cost Optimization
- 16.4 Technology Investment and Product Differentiation
- 16.5 Supply Chain Localization and Resilience
- 16.6 Distribution and Customer Acquisition
- 16.7 Partnership, Acquisition and Capacity Strategy
- 16.8 Regional Expansion Priorities
- 16.9 Short-, Medium- and Long-Term Actions
Chapter 17 Competition Outlook
- 17.1 Industry Competition Characteristics
- 17.2 Market Structure and Concentration
- 17.3 Market Share and Competitive Positioning, 2025
- 17.4 Company-Wise Revenue and Product Benchmarking
- 17.5 Production and Service Capacity Benchmarking
- 17.6 Technology, Pricing and Differentiation
- 17.7 Regional Footprint and Distribution Strength
- 17.8 Mergers, Acquisitions and Strategic Alliances
- 17.9 New Entrants and Competitive Threats
- 17.10 Porter's Five Forces and Industry Attractiveness
- 17.11 Competitive Outlook, 2025-2035
Chapter 18 Company Profiles
- 18.1 Company Coverage and Selection Criteria
- 18.2 B.Braun Melsungen AG
- 18.2.1 Business Description
- 18.2.2 Company Ownership and Geographic Presence
- 18.2.3 Product and Service Portfolio
- 18.2.4 Manufacturing and Operating Footprint
- 18.2.5 Production Capacity and Expansion Plans
- 18.2.6 Financial Performance and Investment
- 18.2.7 Market Share and Competitive Position
- 18.2.8 Technology and Innovation Capabilities
- 18.2.9 Strategic Alliances or Partnerships
- 18.2.10 Recent Developments
- 18.2.11 Growth Strategy and Outlook
- 18.3 Baxter International Inc.
- 18.4 Nipro Corporation
- 18.5 Cantel Medical Corporation
- 18.6 Nikkiso Co. Ltd
- 18.7 Becton, Dickinson and Company
- 18.8 Dornier MedTech GmbH
- 18.9 Boston Scientific Corporation
- 18.10 Asahi Kasei Corporation
- 18.11 Fresenius Medical Care AG & Co. KGaA
- 18.12 Other Relevant Market Participants
Note: Every listed company is profiled on the structure shown under the first company. The company list is preliminary and may change based on research findings, market developments, data availability and client requirements.
Chapter 19 Disclaimer
- 19.1 Research and Forecast Disclaimer
- 19.2 Data Source and Estimation Limitations
Note: The depth of individual sections depends on data availability for this market. Volume, capacity, trade and other unit-based metrics are included where applicable.

