
Eye imaging and screening lead diagnostic spending
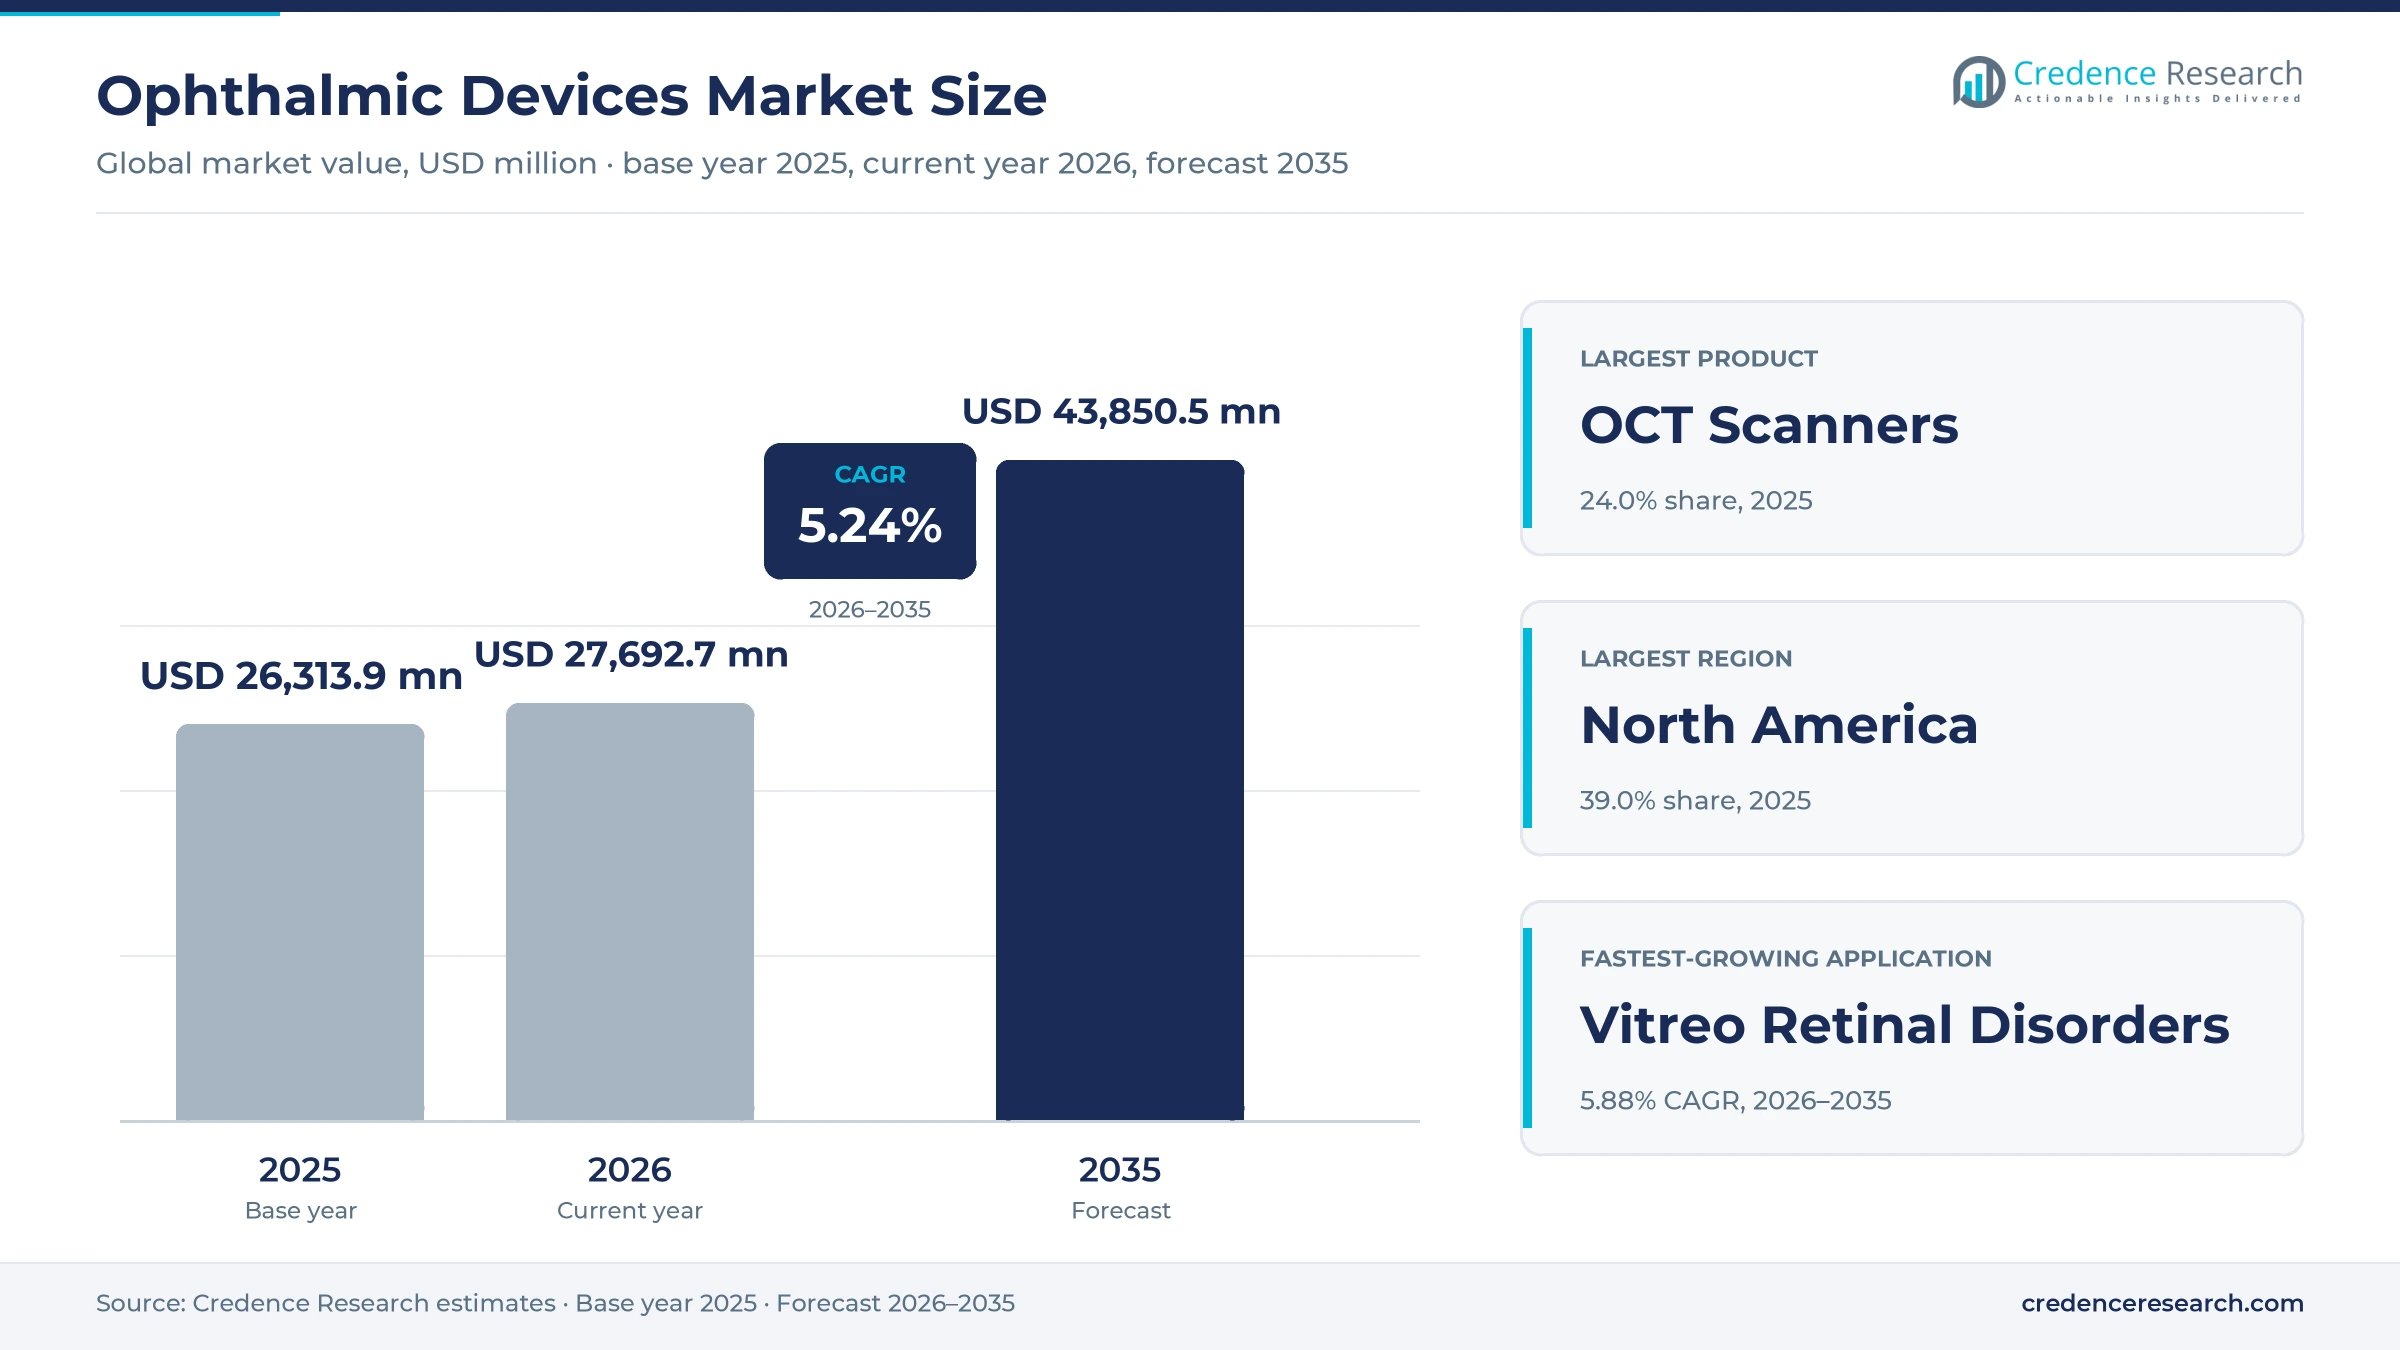
The global ophthalmic devices market was valued at USD 4.19 billion in 2025 and is projected to increase from USD 4.41 billion in 2026 to USD 6.98 billion by 2035, registering a CAGR of 5.24% during 2026–2035. Demand comes from a large and aging population with cataract, refractive error, glaucoma and retinal disease, wider screening for diabetic eye damage and the replacement of older imaging systems in clinics and hospitals. North America held the largest regional share, 39.0% in 2025, because U.S. eye care practices buy high-end imaging and surgical planning systems. Asia Pacific is the fastest-growing region at 6.39% a year, as China and India expand eye hospitals and cataract programs. The screening picture changed in April 2024, when a handheld fundus camera with artificial intelligence software received U.S. clearance. As a result, primary care and diabetes clinics can now screen patients without an eye specialist on site.
Which eye diagnostic products does this analysis cover?
The analysis counts optical coherence tomography scanners, fundus cameras, visual field analyzers, autorefractors and keratometers, ultrasound imaging systems, tonometers, slit lamps, optical biometry systems, lensmeters, corneal topography systems, retinoscopes and other examination equipment. Values are based on manufacturer selling prices, including software sold with each system.
Contact lenses, spectacles, eye drugs and surgical consumables sit outside the scope of this analysis. The value chain runs from optics, sensor and software suppliers through equipment makers and distributors to hospitals, ambulatory surgery centers, eye clinics, optometry practices and screening programs.
Ophthalmic Devices Market Insights
- The ophthalmic devices market grows from USD 4.19 billion in 2025 to USD 6.98 billion by 2035, a 5.24% CAGR as eye imaging and screening expand worldwide.
- North America held 39.0% of global eye diagnostic equipment value in 2025, supported by high imaging adoption in U.S. practices.
- Optical coherence tomography scanners led products with 24.0% of 2025 value and also grow fastest at 5.93% a year.
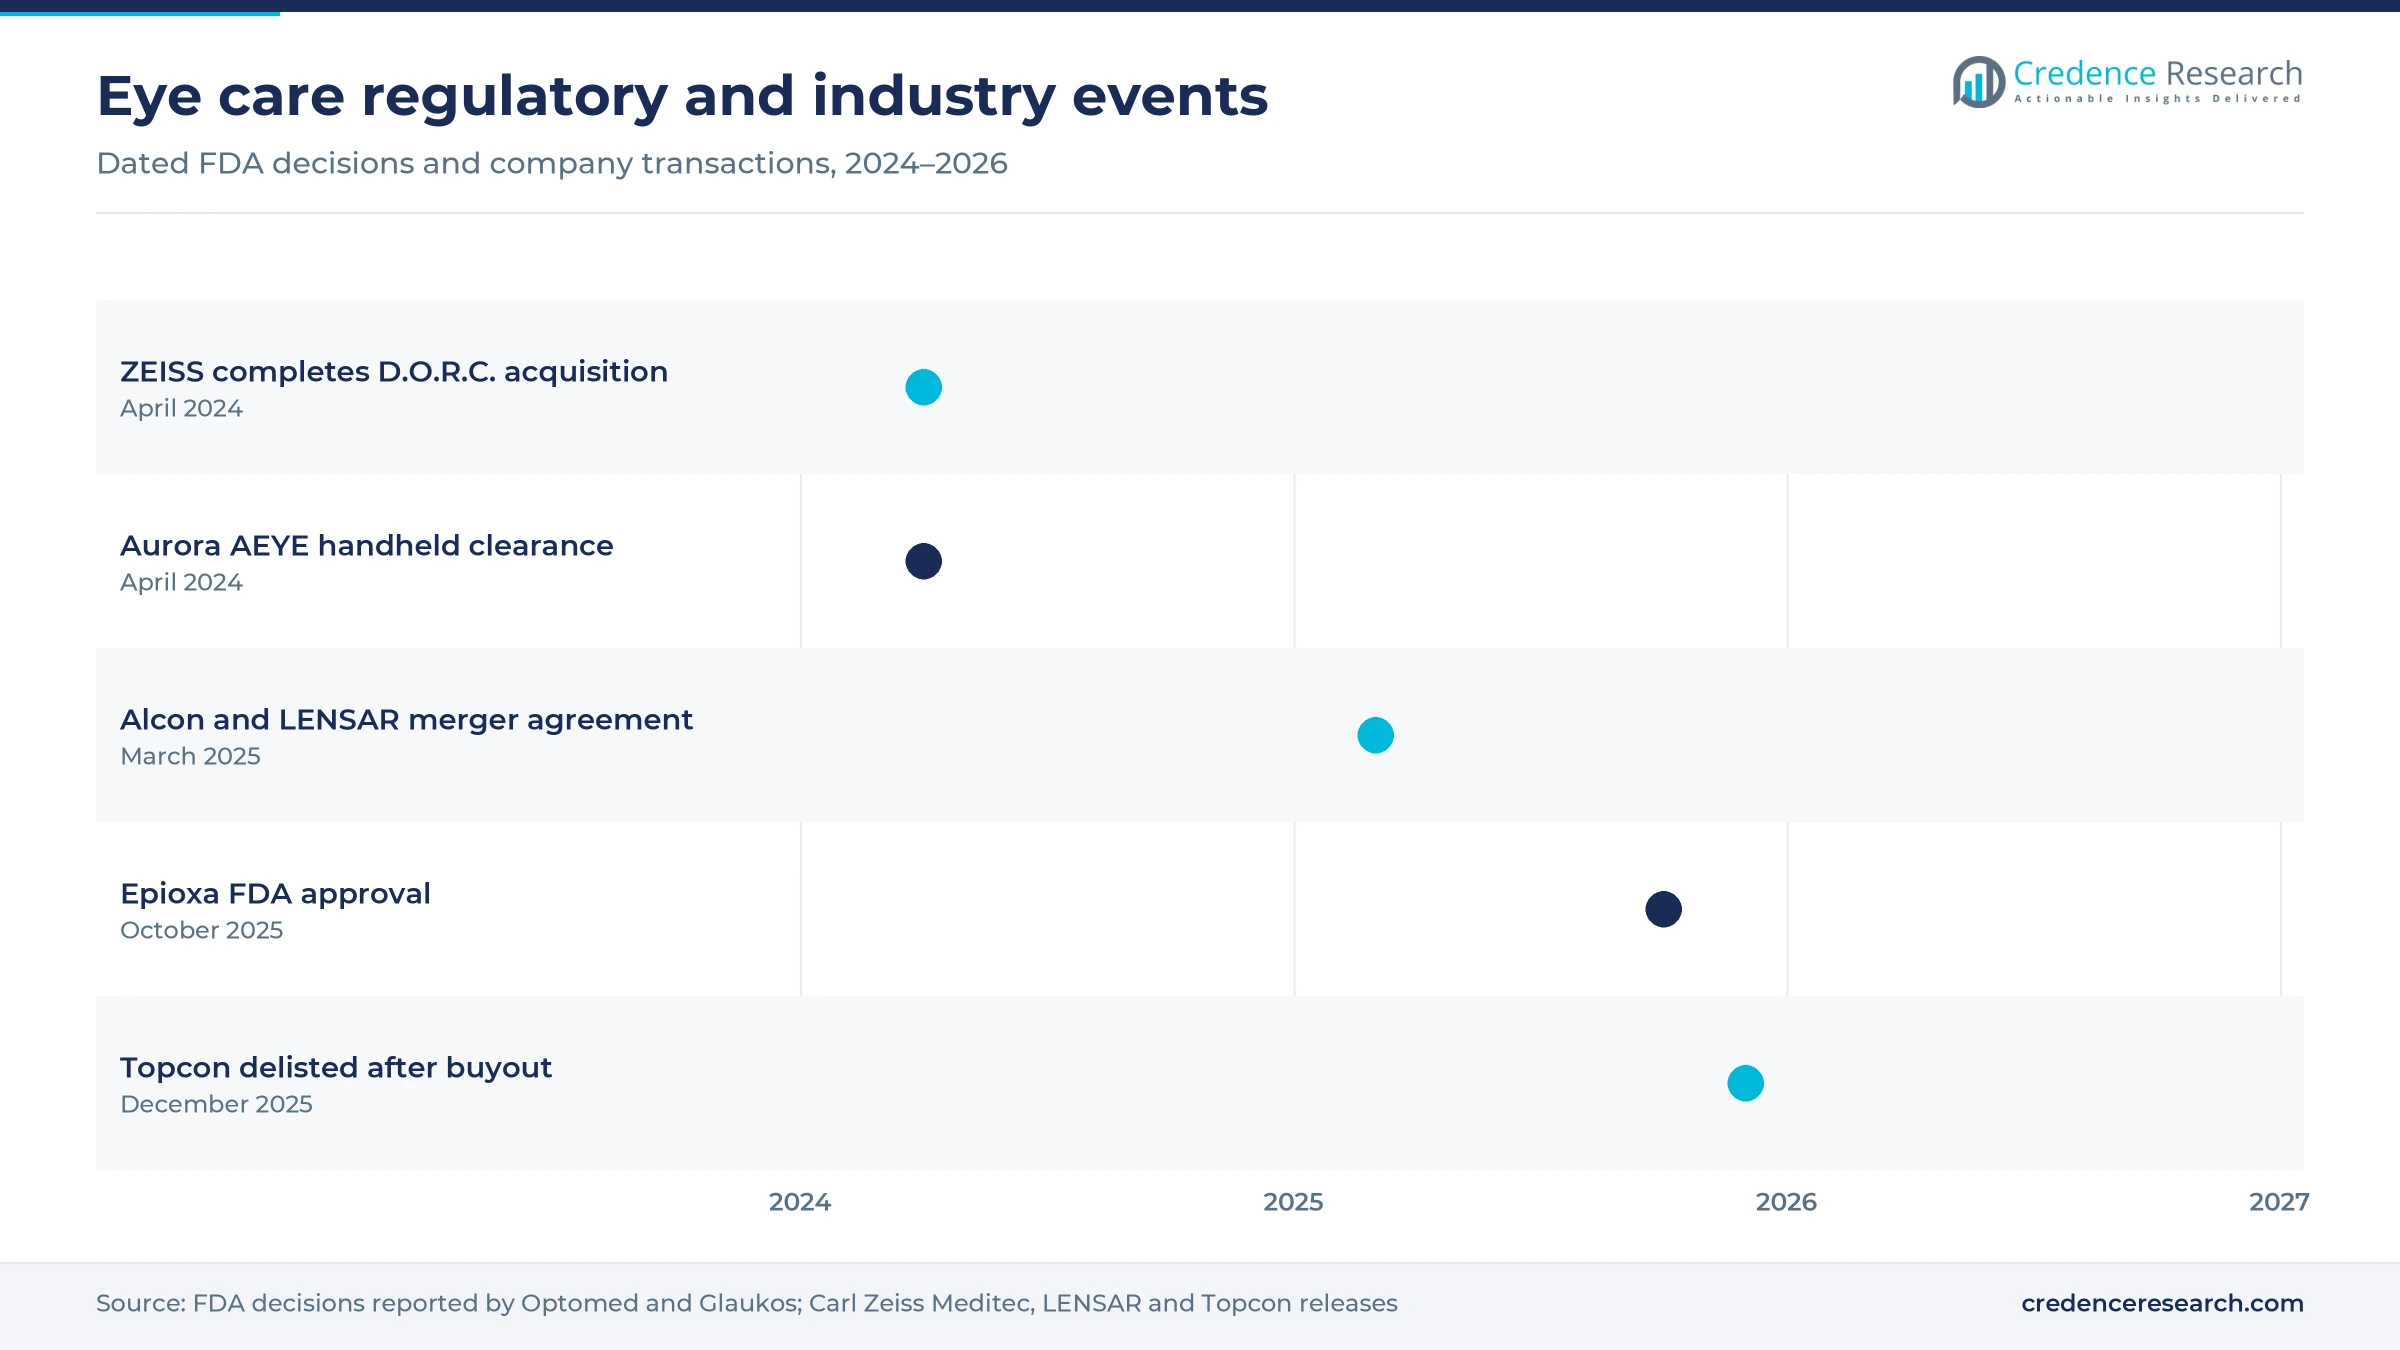
- In April 2024, Carl Zeiss Meditec completed its acquisition of D.O.R.C., adding retinal surgery equipment to its imaging portfolio.
- In December 2025, Topcon shares were delisted after a management buyout backed by KKR and JIC Capital, which changed ownership of a major supplier.
OCT scanners lead as retinal care grows fastest
Why do OCT scanners lead product spending?
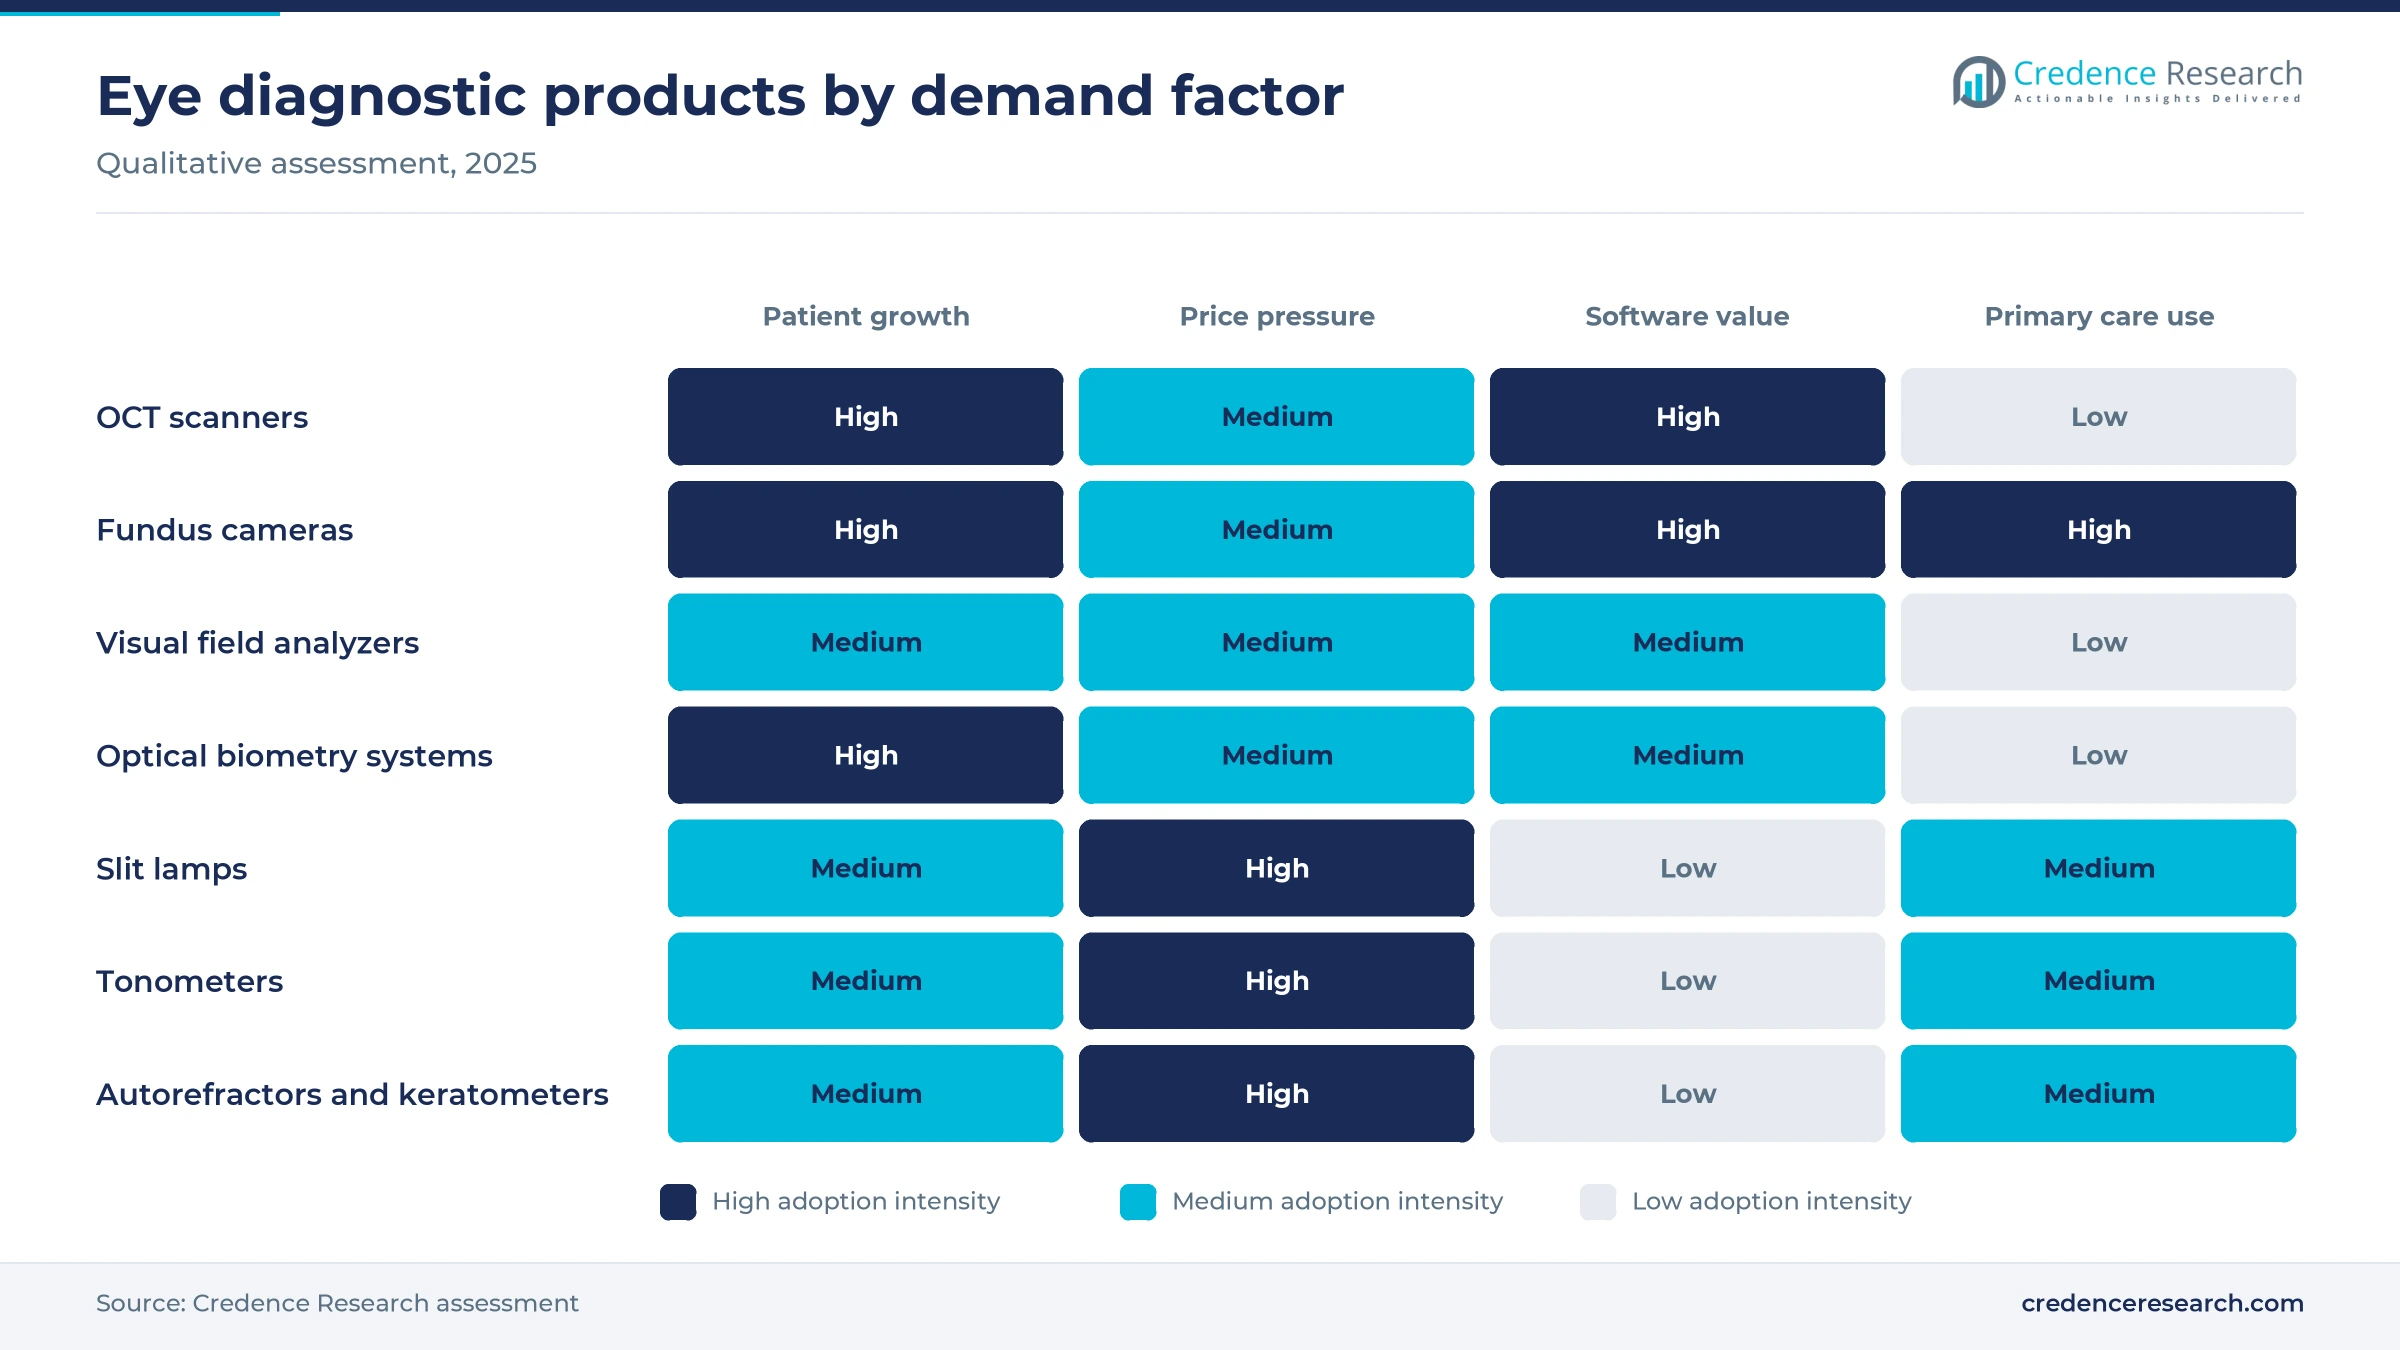
Based on product, the market is categorized into optical coherence tomography scanners, fundus cameras, perimeters and visual field analyzers, autorefractors and keratometers, ultrasound imaging systems, tonometers, slit lamps, optical biometry systems, lensmeters, corneal topography systems, retinoscopes and others. Optical Coherence Tomography Scanners led with a 24.0% share of 2025 value and also grow fastest at 5.93% a year. This position reflects their role in managing glaucoma, macular degeneration and diabetic eye disease. Clinics also replace fundus cameras with wider-field and portable models.
Why do retinal disorders grow fastest?
Based on application, the market is categorized into cataract, vitreo retinal disorders, refractive disorders and others. Cataract led with a 38.0% share of 2025 value, because every cataract operation needs biometry, keratometry and slit lamp examination. Vitreo Retinal Disorders grow fastest at 5.88% a year, as patients receiving injections for macular disease need repeated imaging. Screening for diabetic retinopathy adds further demand for retinal cameras.
Where is eye diagnostic equipment used most often?
Based on end user, the market is categorized into hospitals and ASCs, eye clinics and others. Hospitals & ASCs led with a 48.0% share of 2025 value, because surgical centers combine diagnostic suites with cataract and retinal operating rooms. Eye Clinics grow fastest at 5.70% a year, as group practices and retail eye care chains add imaging to routine examinations. Other users include optical retailers, screening programs and academic centers.
| Segment Group | Leading Sub-segment | Share, 2025 | Fastest-growing Sub-segment | CAGR, 2026–2035 |
|---|---|---|---|---|
| By Product | Optical Coherence Tomography Scanners | 24.0% | Optical Coherence Tomography Scanners | 5.93% |
| By Application | Cataract | 38.0% | Vitreo Retinal Disorders | 5.88% |
| By End User | Hospitals & ASCs | 48.0% | Eye Clinics | 5.70% |
Request a Free Sample
Fill in your details and we'll send you a free sample report.
- Sample data tables & charts
- Research methodology
Vision loss, aging and cataract backlogs lift demand
How does the global burden of vision loss sustain demand?
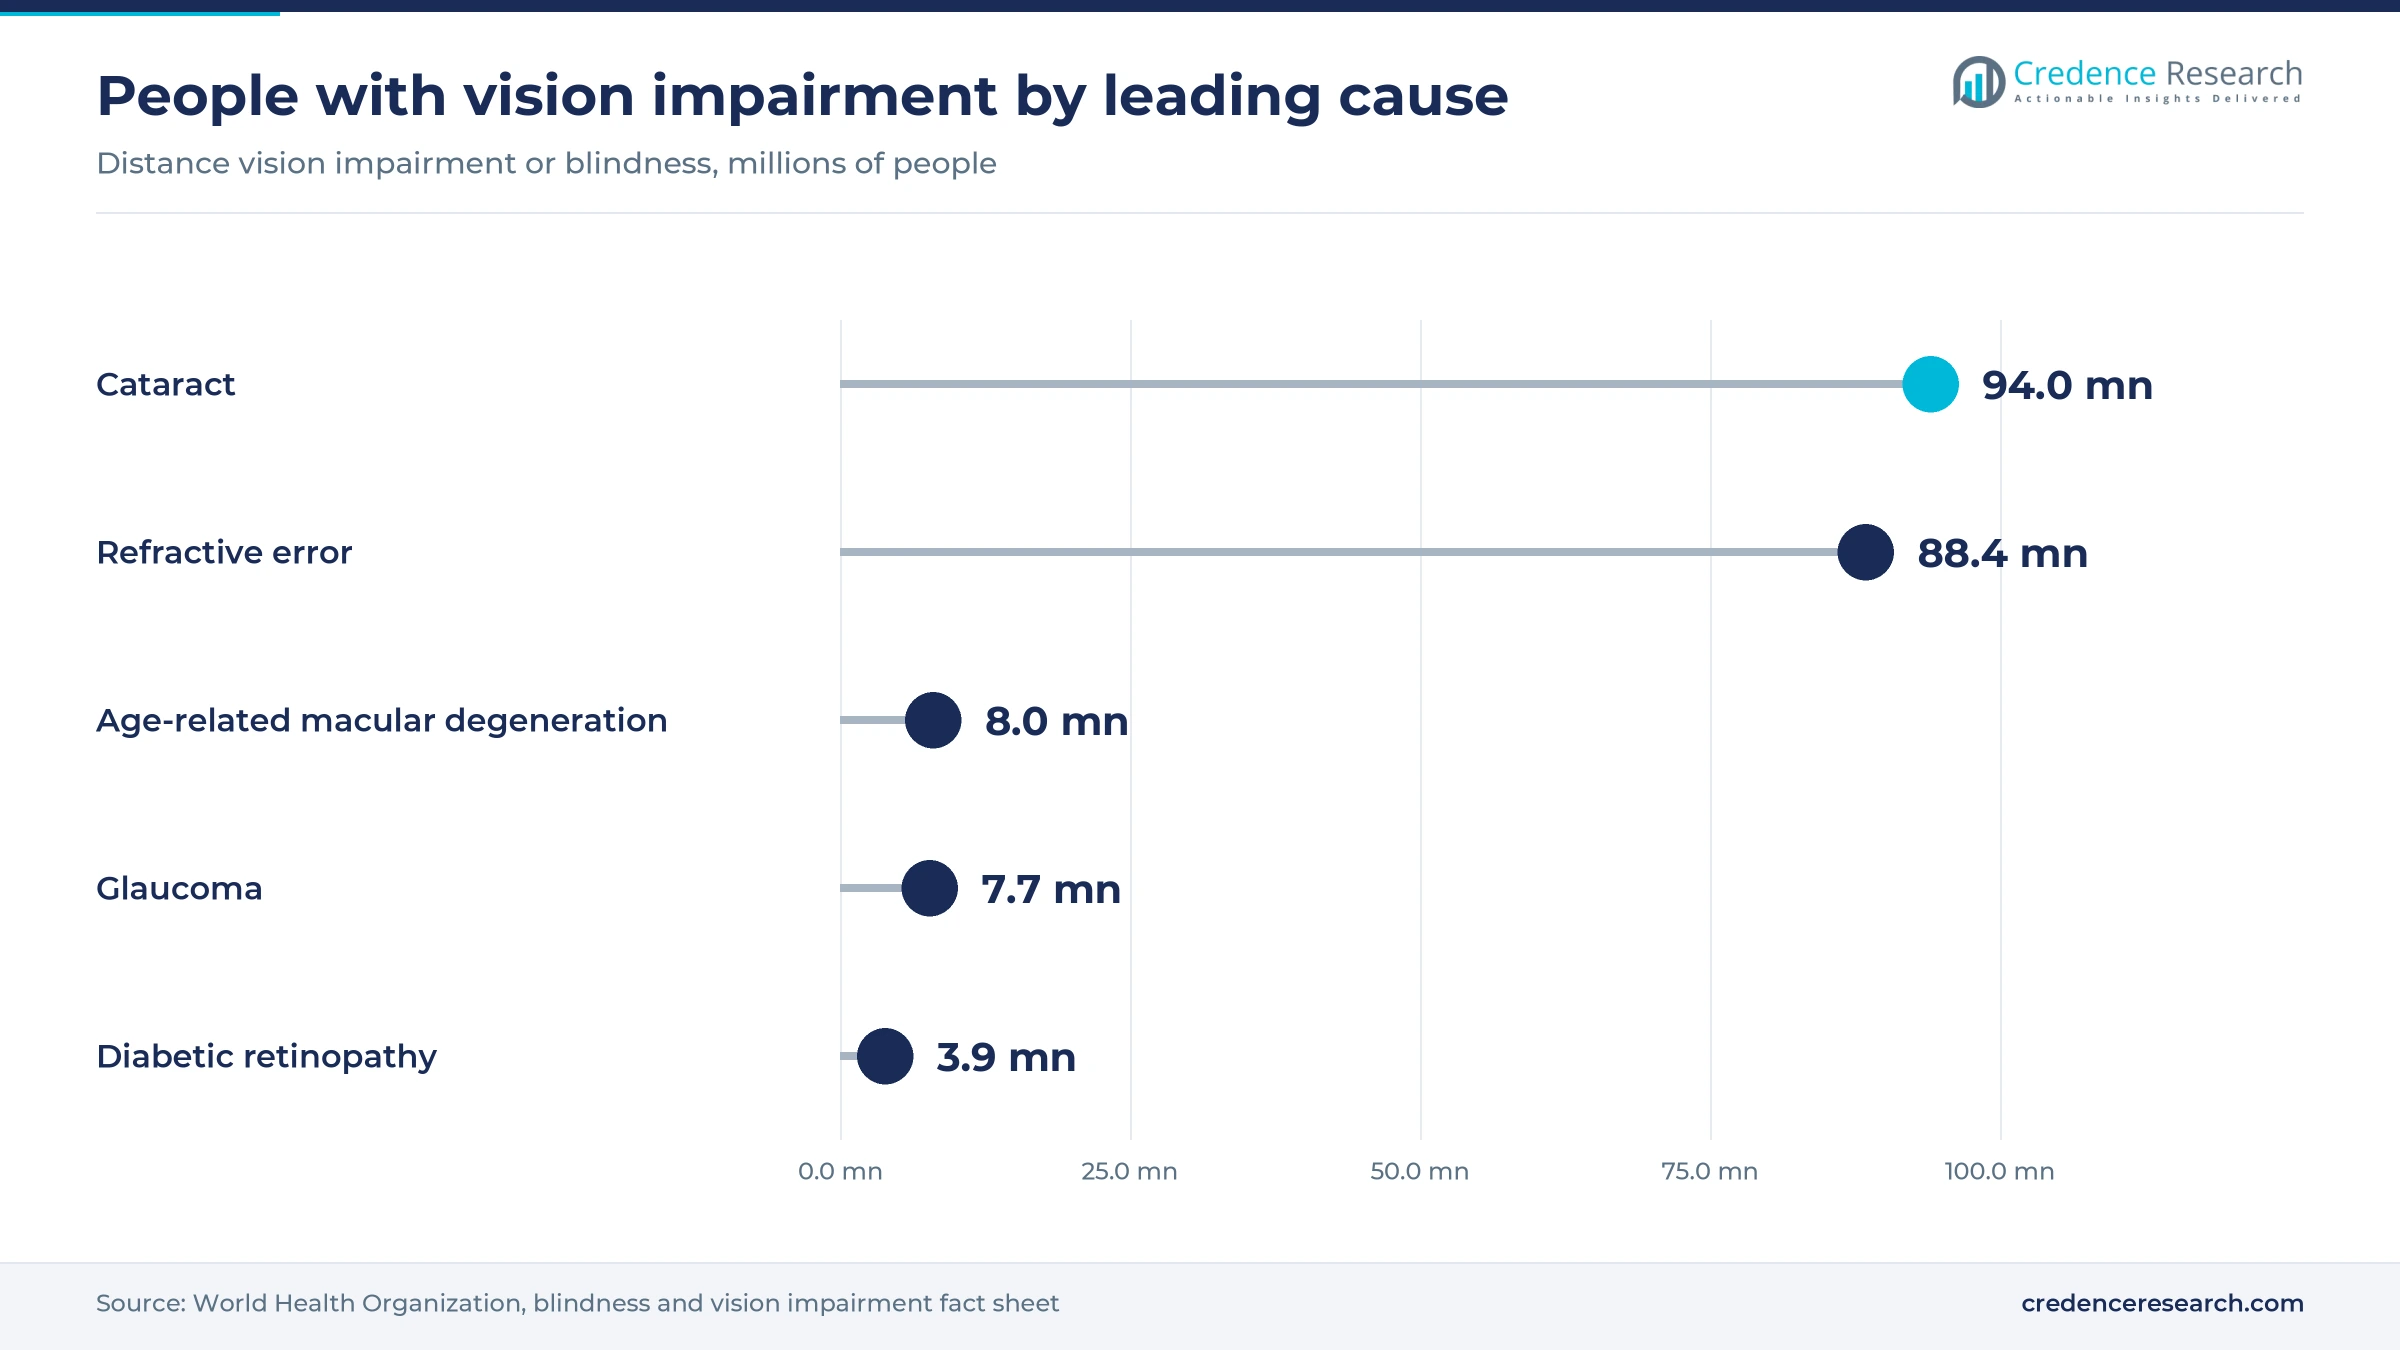
At least 2.2 billion people worldwide live with near or distance vision impairment, according to World Health Organization estimates. In at least 1 billion of these cases, the impairment could have been prevented or has not yet been addressed. Each of these patients needs examination, measurement and follow-up, which ties equipment demand directly to the size of the unmet need. The burden is uneven, because WHO puts the prevalence of distance vision impairment in low- and middle-income regions at 4 times the rate in high-income regions. WHO also estimates that closing this gap would cost about USD 25 billion, far less than the annual productivity loss. As a result, governments and private eye care chains keep adding diagnostic equipment in clinics and screening programs.
Why does cataract backlog drive biometry and examination purchases?
Cataract is the largest single cause of distance vision impairment or blindness, affecting 94 million people in WHO estimates. Access remains the bottleneck, because 1 in 2 people globally who need cataract surgery cannot get it, according to the same WHO data. Every operation that clears this backlog needs accurate eye measurement before surgery. Surgeons use optical biometry, keratometry and corneal topography to choose intraocular lenses for each patient, and many centers repeat measurements when results look unusual. In turn, countries that expand cataract surgery programs also buy more diagnostic systems for surgical planning, often as part of a new operating suite. Training programs for surgeons and technicians add further demand for slit lamps and biometers in teaching hospitals.
How do retinal diseases raise imaging frequency?
Patients with macular degeneration and diabetic eye damage need scans at regular visits, often for the rest of their lives. WHO data show that age-related macular degeneration causes distance vision impairment in 8 million people, while diabetic retinopathy accounts for 3.9 million people. Clinics use optical coherence tomography to decide when injections are needed and to track results after each treatment. Because most people with vision impairment and blindness are over the age of 50, aging high-income countries carry the heaviest imaging load. Diabetic retinopathy also reaches working-age adults, which adds younger patients to long-term imaging schedules. As a result, imaging demand rises with every patient added to long-term retinal care, and each added patient returns for several scans a year.
Why does refractive error create steady examination demand?
Uncorrected refractive error causes distance vision impairment in 88.4 million people, and presbyopia affects 826 million people at near distance, according to WHO. Most of these patients need regular checks for glasses or contact lenses, and each visit relies on autorefractors, keratometers, lensmeters and retinoscopes. Access is far from complete, because 2 out of 3 people in low-income countries who need eyeglasses do not have them. Rates of unaddressed near vision impairment exceed 80% in western, eastern and central sub-Saharan Africa, compared with less than 10% in high-income regions. In turn, growing eye care chains in Asia, Latin America and the Middle East buy large volumes of examination equipment for new stores and mobile screening units.
AI screening and portable imaging reshape eye care
How is AI screening shifting where eye exams happen?
Software can now read retinal images without an eye specialist present, which moves screening into primary care. On April 30, 2024, Optomed announced FDA clearance of its Aurora handheld camera with AEYE artificial intelligence software for diabetic retinopathy screening. The companies described it as the first handheld AI screening solution to obtain FDA clearance in the United States. The system needs one image per eye and returns a result in about 60 seconds, and an existing U.S. reimbursement code supports its use. Optomed sells its products in more than 60 countries, which gives the format a route into many health systems. As a result, primary care offices and diabetes clinics are becoming new buyers of retinal imaging.
Why are OCT systems rising with built-in analysis tools?
Clinicians want faster decisions from the large image volumes that modern scanners produce at every visit. In 2025, Carl Zeiss Meditec received U.S. approval for an AI-guided image assessment tool on its Cirrus 6000 OCT platform. The platform scans at 100,000 A-scans per second and draws on a U.S. reference database of 870 healthy eyes. Automated measurements help clinics that see many retinal and glaucoma patients each day, because staff can flag changes between visits more quickly. Software updates can also extend the useful life of installed scanners. In turn, buyers now compare software and data management as closely as scan speed when they replace older optical coherence tomography systems.
Can new corneal therapies open demand for topography systems?
Equipment makers have a clear opening in corneal care, because new treatments increase the number of patients who need corneal mapping. In October 2025, Glaukos announced FDA approval of Epioxa, an incision-free cross-linking therapy for keratoconus in patients aged 13 and older, after 2 Phase 3 trials that randomized more than 400 patients. Clinics that offer this therapy need corneal topography and tomography to diagnose patients and track disease progression. Because the approval covers patients from age 13, clinics may follow treated patients with repeated corneal maps for many years. The same instruments also screen candidates for laser vision correction, so one system serves several services. As a result, demand for corneal imaging can grow as treatment becomes easier.
Where can glaucoma care add demand for testing equipment?
WHO estimates that glaucoma causes distance vision impairment or blindness in 7.7 million people, and the disease is often silent until vision is lost. Early detection matters, because vision already lost to glaucoma cannot be restored with current treatment. Detection relies on tonometers, visual field analyzers and optic nerve imaging at regular intervals. In 2020, the World Health Assembly adopted a resolution on integrated, people-centered eye care and WHO now works with member states to monitor global eye care targets for 2030. These targets push health systems to build routine eye testing into primary care. In turn, screening programs that add pressure checks and imaging to routine exams create steady demand for these systems.
Equipment costs and specialist gaps slow adoption
Why do high equipment costs slow adoption in smaller clinics?
Advanced imaging systems require large upfront spending, which strains the budgets of smaller clinics. Many independent practices extend the life of older scanners and cameras instead of buying new models. Payment for imaging also varies between countries and insurers, which makes returns harder to predict. As a result, suppliers rely on leasing, refurbished units and service bundles to reach smaller buyers. The economic case for wider access is strong, because WHO puts the annual productivity loss from vision impairment at about USD 411 billion.
How do specialist shortages limit diagnostic capacity?
Many countries have too few ophthalmologists and trained technicians to examine every patient who needs care. Rural areas in Africa and South Asia often lack any eye specialist within easy reach of patients. This gap leaves expensive equipment underused in some centers while patients go unexamined elsewhere. In turn, the industry is turning toward automated and remote reading tools to extend specialist reach. WHO has also launched SPECS 2030 to reach more than 800 million people who need refractive error services.
Why does data integration remain a barrier for buyers?
Imaging systems from different makers often use separate software and file formats, which complicates daily clinic work. Clinics with mixed fleets struggle to compare scans over time or share them with referring doctors. Cybersecurity requirements also add costs when devices connect to clinic networks. As a result, buyers often favor a single supplier, which limits competition and slows the uptake of new entrants. Vendor-neutral viewers and standard image formats help, although support across older instruments remains uneven.
How do regulatory requirements slow new product entry?
Imaging and AI software must show accuracy before clearance in each market, which delays launches of new products. Developers need clinical data across diverse patient groups and camera types, which takes time and money to collect. Updates to software models may also require new reviews before release. In turn, smaller developers often partner with established equipment makers to reach customers. Developers that pair AI software with new cameras must often show performance for each combination, which adds cost.
North America leads as Asia Pacific gains pace
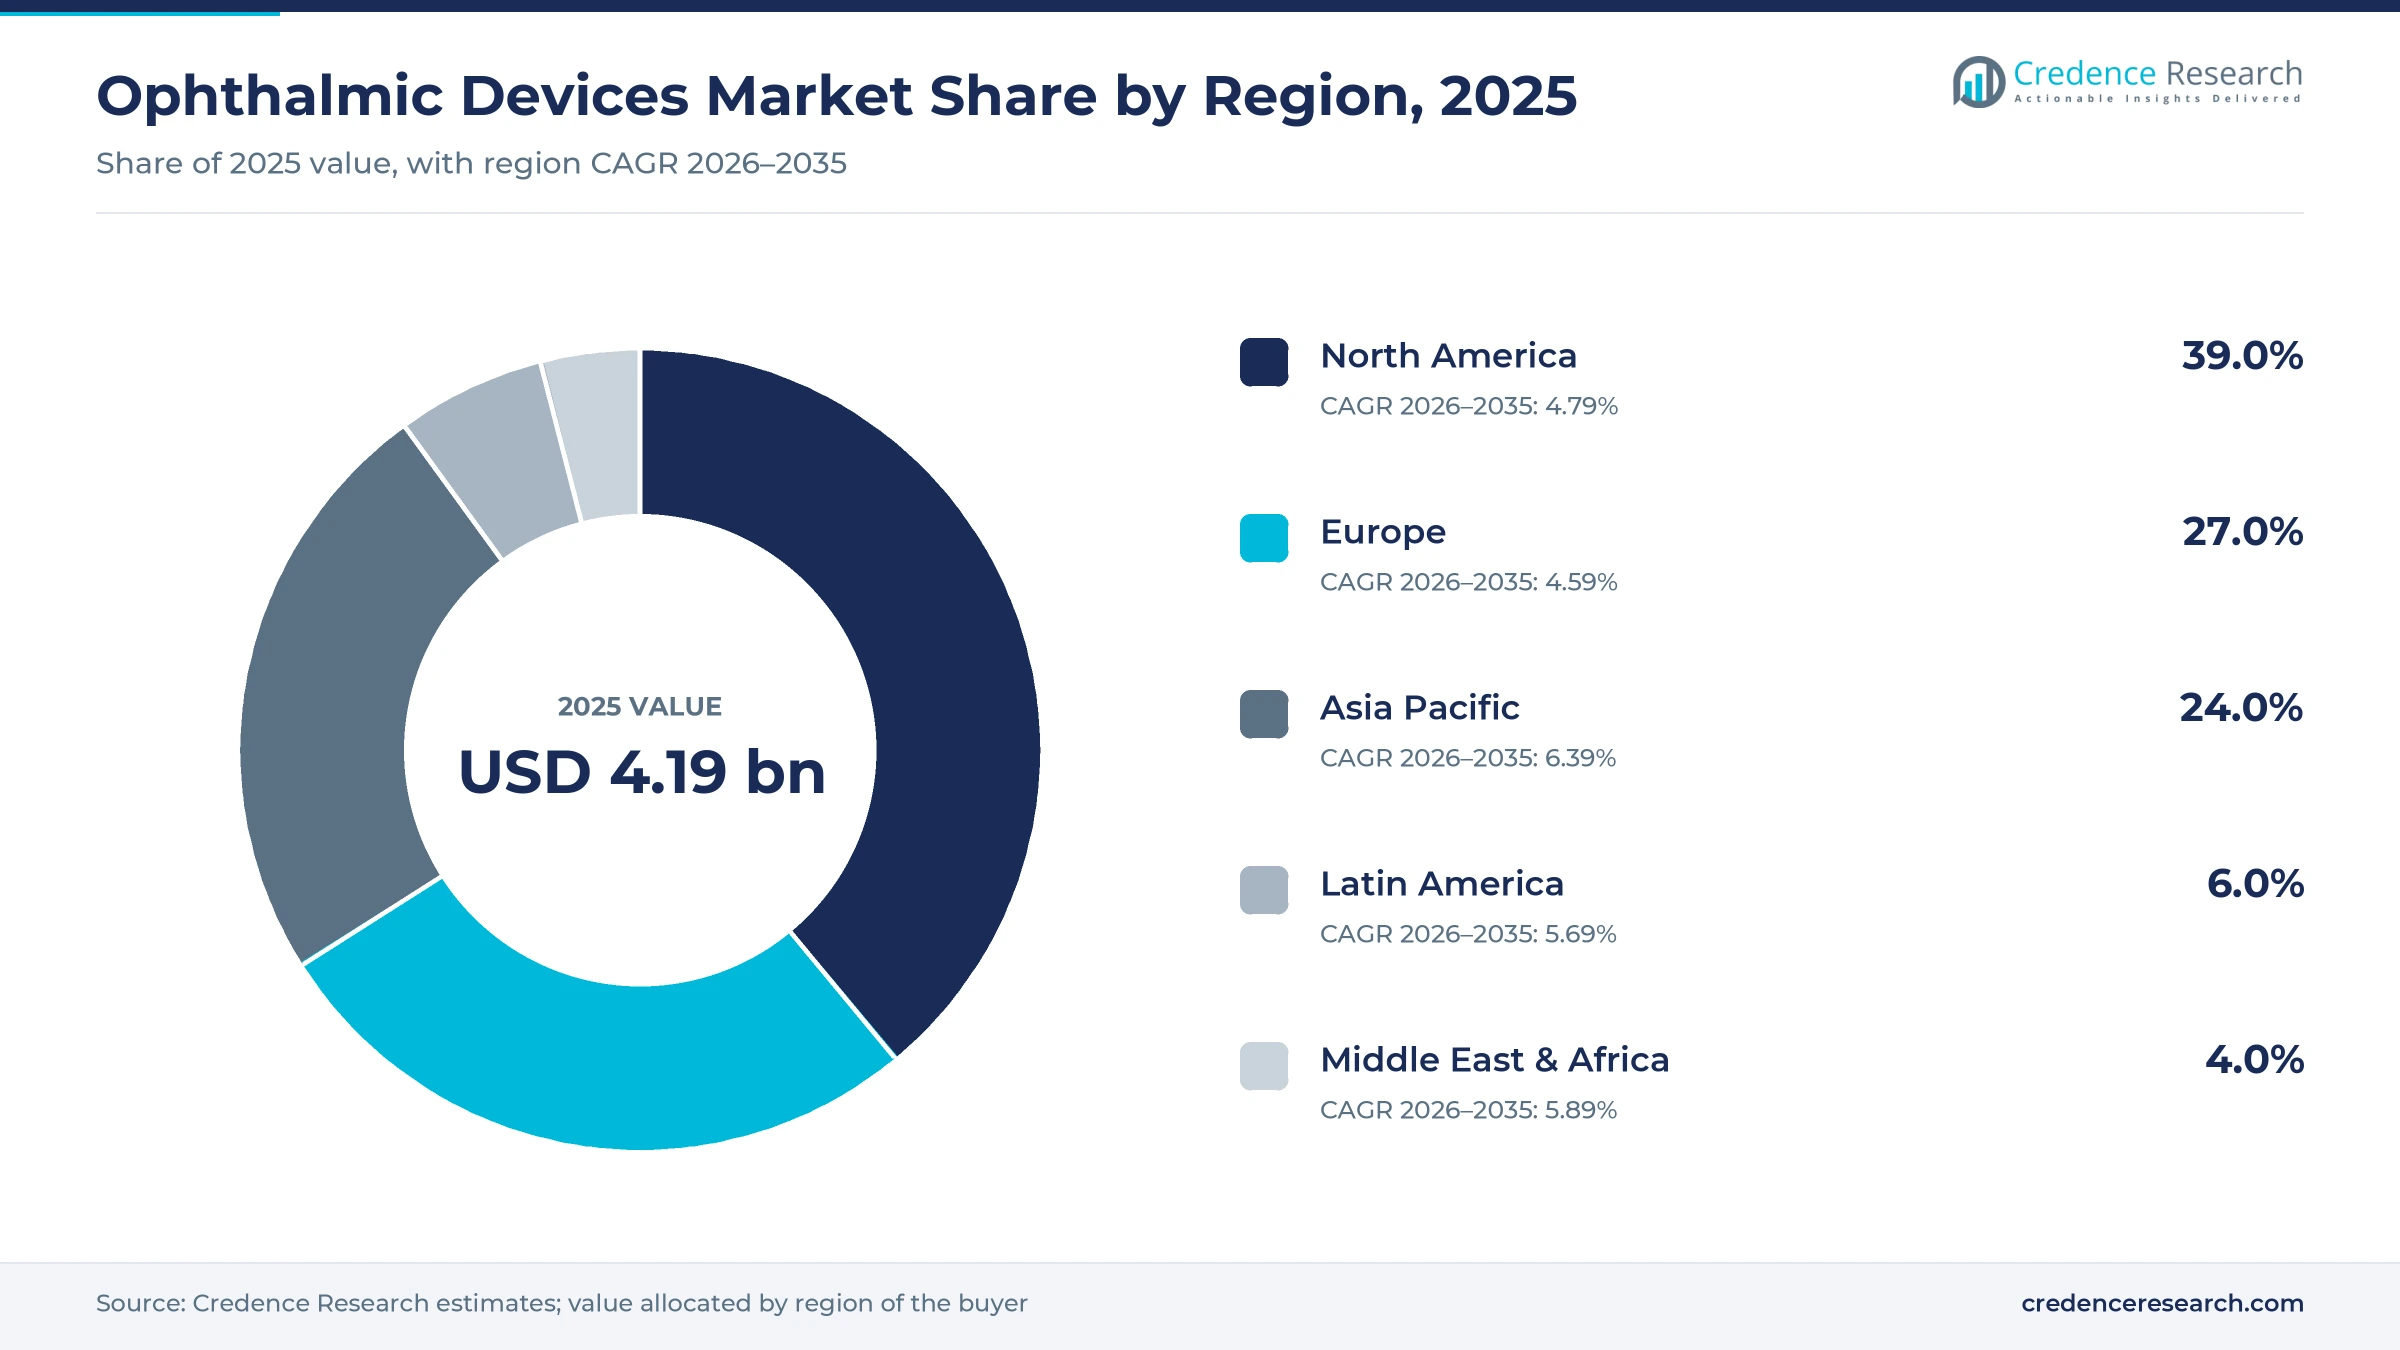
| Region | Value, 2025 (USD billion) | Share, 2025 | CAGR, 2026–2035 |
|---|---|---|---|
| North America | 1.63 | 39.0% | 4.79% |
| Europe | 1.13 | 27.0% | 4.59% |
| Asia Pacific | 1.00 | 24.0% | 6.39% |
| Latin America | 0.25 | 6.0% | 5.69% |
| Middle East & Africa | 0.17 | 4.0% | 5.89% |
Why do U.S. eye practices keep North America in the lead?
North America held a 39.0% share of 2025 value and grows at 4.79% a year through 2035. The United States drives this position, because eye care practices use optical coherence tomography and biometry as routine tools. U.S. regulators cleared handheld AI screening in 2024 and approved new corneal therapy in 2025, which widen the base of buyers. Large group practices and retail optometry chains also renew imaging fleets on regular cycles.
Why do China and India drive Asia Pacific eye care growth?
Asia Pacific held a 24.0% share of 2025 value and is the fastest-growing region at 6.39% a year. China and India expand eye hospital networks and cataract surgery programs, which need biometry, slit lamps and imaging systems. Japan hosts major suppliers such as Topcon Corporation and Nidek Co. Ltd., which compete strongly across the region. This mix of volume growth and local supply keeps prices competitive.
How do European tenders shape eye imaging purchases?
Europe held a 27.0% share of 2025 value and grows at 4.59% a year, the slowest pace of the five regions. Germany, France, the United Kingdom and Italy account for much of the spending, and suppliers such as Carl Zeiss Meditec AG and Haag-Streit Group are based in the region. However, public tenders and long equipment lives keep value growth below the global average.
Why are private eye hospitals lifting Latin American demand?
Latin America held a 6.0% share of 2025 value and grows at 5.69% a year through 2035. Brazil and Mexico lead regional spending, because private eye hospitals and optical chains are expanding. Public systems still face long cataract waiting lists, which keeps demand for basic examination equipment strong.
Why does specialist scarcity cap eye care in Africa?
The Middle East and Africa held a 4.0% share of 2025 value and grows at 5.89% a year through 2035. Gulf states fund modern eye hospitals, while much of Africa has few eye specialists. This gap limits the use of advanced imaging outside major cities and private centers.
Acquisitions and FDA decisions in eye care since 2024
| Development | Status and market relevance |
|---|---|
| In April 2024, Carl Zeiss Meditec completed its acquisition of 100% of D.O.R.C. after receiving all regulatory approvals. | Completed; adds the EVA NEXUS vitreo-retinal and cataract surgery platform |
| In April 2024, Optomed received FDA 510(k) clearance for the Aurora handheld fundus camera with AEYE screening software. | Cleared; first handheld AI screening solution to obtain FDA clearance, according to Optomed |
| In March 2025, Alcon and LENSAR entered a definitive merger agreement for Alcon to acquire LENSAR. | Agreement; adds the ALLY robotic cataract laser system to Alcon |
| In October 2025, Glaukos received FDA approval for Epioxa, an incision-free keratoconus therapy. | Approved; commercial availability expected in the first quarter of 2026; follows Photrexa, approved in 2016 |
| In December 2025, Topcon shares were delisted after a management buyout backed by KKR and JIC Capital. | Completed; Topcon announced the completion of the buyout |
OCT angiography, AI reading and handheld cameras advance
- OCT angiography shows blood flow in the retina without dye injection, which helps clinicians manage diabetic eye disease and macular degeneration.
- AI image reading grades retinal images automatically, which lets primary care sites screen patients without an eye specialist present.
- Handheld fundus cameras bring retinal imaging to clinics, homes and rural sites, which widens screening outside eye hospitals.
- Swept-source optical biometry measures the eye quickly and accurately before cataract surgery, which improves lens choice and outcomes.
- Connected data platforms link instruments from one supplier in a shared viewer, which helps clinics compare scans over time.
Need a Custom Version of This Report?
Tailor the scope, geography, or segments to your exact requirements.
- Custom geography or segment scope
- Direct access to our analyst team
Eye care suppliers compete on imaging and workflow
Competition is led by a group of established eye care companies with broad imaging and surgical portfolios. Carl Zeiss Meditec AG, Topcon Corporation, Nidek Co. Ltd. and Haag-Streit Group compete in optical coherence tomography, biometry, slit lamps and examination systems. Alcon Vision LLC, Johnson & Johnson Vision Care and Bausch & Lomb Incorporated link diagnostic equipment with surgical systems and lenses. Ziemer Ophthalmic Systems Ltd focuses on surgical lasers and related diagnostics. Essilor International S.A serves optometry and vision testing practices with examination equipment and lenses. Glaukos Corporation adds glaucoma and corneal therapies that rely on diagnostic testing. In December 2025, Topcon moved to private ownership, which may change its investment pace. As a result, buyers favor suppliers that combine accurate instruments, integrated software and reliable service.
Companies profiled and their roles in this market
| Company | Type | Role in the market |
|---|---|---|
| Carl Zeiss Meditec AG | Diversified | Cirrus OCT, biometry and D.O.R.C. retinal surgery systems |
| Topcon Corporation | Specialist | OCT, fundus cameras and examination equipment |
| Alcon Vision LLC | Diversified | Cataract and refractive surgery systems with diagnostics |
| Johnson & Johnson Vision Care | Diversified | Surgical vision systems and contact lenses |
| Bausch & Lomb Incorporated | Diversified | Surgical systems, lenses and eye health products |
| Nidek Co. Ltd. | Specialist | Autorefractors, tonometers and imaging systems |
| Haag-Streit Group | Specialist | Slit lamps, perimeters and biometry systems |
| Ziemer Ophthalmic Systems Ltd | Specialist | Femtosecond surgical lasers and related equipment |
| Essilor International S.A | Diversified | Vision testing equipment and lenses |
| Glaukos Corporation | Specialist | Glaucoma and corneal cross-linking therapies |
Retinal imaging and screening set the growth pace
Credence Research's view is that retinal imaging and screening will set the pace of growth through 2035, because the number of patients in long-term eye care keeps rising. The overall market grows at 5.24% a year, supported by aging, diabetes and large gaps in vision care access. Optical coherence tomography scanners grow faster than basic examination tools as clinics add imaging to routine visits. Companies that combine accurate instruments, AI reading and connected data will win the most clinic and hospital contracts.
How Credence Research sized eye diagnostic equipment
The report uses 2025 as the base year and 2026 to 2035 as the forecast period. Market values come from the Credence Research model, which builds spending by product, application, end user and region. Regional and segment splits are Credence Research estimates informed by World Health Organization statistics, U.S. regulator decisions and company press releases. No primary interviews or surveys were used in preparing this edition of the report.
Eye diagnostic equipment outlook to 2035
By 2035, the ophthalmic devices market is projected to reach USD 6.98 billion, with growth led by optical coherence tomography, retinal screening and cataract surgical planning. Imaging scanners will remain the largest product area, as clinics renew systems with built-in analysis tools. North America keeps the highest spending per practice, while Asia Pacific adds the most new installations. Screening will move further into primary care and diabetes clinics, because AI reading reduces the need for specialists on site. As a result, advantage will depend on accuracy, software and service.
Frequently Asked Questions
How big is the global ophthalmic devices market?
Which product leads the ophthalmic devices market?
Which region leads spending on eye diagnostic equipment?
Which application accounts for most ophthalmic device use?
How is AI changing eye disease screening?
What recent deals and approvals affect eye care equipment?
Who are the leading ophthalmic device companies?
What restrains growth in ophthalmic devices?
Table of Content
Chapter 1 Market Segmentation
- 1.1 Segmentation Framework
- 1.1.1 Product and Service Classification
- 1.1.2 Application and End-Use Classification
- 1.1.3 Technology and Solution Classification
- 1.1.4 Customer and Distribution Channel Classification
- 1.1.5 Geographic Segmentation
- 1.1.6 Market Segment Definitions and Boundaries
- 1.2 By Product
- 1.2.1 Optical Coherence Tomography Scanners
- 1.2.2 Fundus Camera
- 1.2.3 Perimeters/Visual Field Analyzers
- 1.2.4 Autorefractors and Keratometers
- 1.2.5 Ophthalmic Ultrasound Imaging Systems
- 1.2.6 Tonometers
- 1.2.7 Slit Lamps
- 1.2.8 Optical Biometry Systems
- 1.2.9 Lensmeters
- 1.2.10 Corneal Topography Systems
- 1.2.11 Retinoscopes
- 1.2.12 Others
- 1.3 By Application
- 1.3.1 Cataract
- 1.3.2 Vitreo Retinal Disorders
- 1.3.3 Refractive Disorders
- 1.3.4 Others
- 1.4 By End User
- 1.4.1 Hospitals & ASCs
- 1.4.2 Eye Clinics
- 1.4.3 Others
Chapter 2 Introduction
- 2.1 Report Objectives and Scope
- 2.2 Product Definition and Industry Terminology
- 2.3 Market Inclusions and Exclusions
- 2.4 Research Process
- 2.4.1 Primary Research and Expert Interviews
- 2.4.2 Secondary Research and Source Review
- 2.4.3 Top-Down and Bottom-Up Estimation
- 2.4.4 Data Triangulation and Verification
- 2.5 Market Size Measurement Basis
- 2.5.1 2025: USD 4.19 billion → 2035: USD 6.98 billion
- 2.6 Historical and Forecast Reference Periods
- 2.6.1 Historical Period: 2018-2025
- 2.6.2 Base Year: 2025
- 2.6.3 Forecast Period: 2025-2035
- 2.7 Research Assumptions and Limitations
Chapter 3 Executive Summary
- 3.1 Market Snapshot and Key Findings
- 3.2 Base-Year Market Size, 2025
- 3.3 Forecast Market Size, 2035
- 3.4 Revenue and Volume Growth Outlook
- 3.5 Key Demand and Supply Indicators
- 3.6 Leading Market Segments
- 3.7 Fastest-Growing Market Opportunities
- 3.8 Regional Performance Highlights
- 3.9 Technology and Industry Transformation
- 3.10 Competitive Landscape Summary
- 3.11 Analyst View and Strategic Implications
Chapter 4 Global Ophthalmic Devices Market Trends and Developments
- 4.1 Historical Industry Development, 2018-2025
- 4.2 Recent Market Trends and Developments
- 4.3 Demand and Customer Behavior Trends
- 4.4 Technology and Product Innovation
- 4.5 Artificial Intelligence, Automation and Digitalization
- 4.6 Local Manufacturing and Supply Chain Realignment
- 4.7 Industry Partnerships, Mergers and Acquisitions
- 4.8 Sustainability and Circular Economy Developments
- 4.9 Government and Private Sector Investment Trends
- 4.10 Emerging Business Models and Commercialization
- 4.11 Industry Developments and Announcements
Chapter 5 Global Ophthalmic Devices Market Production, Supply and Demand Analysis
- 5.1 Demand Trend and Consumption Analysis, 2018-2025
- 5.2 Demand Forecast, 2025-2035
- 5.3 Production and Output Trend, 2018-2025
- 5.4 Production and Output Forecast, 2025-2035
- 5.5 Installed Capacity and Capacity Utilization
- 5.6 Company-Wise Production Plants and Statistics
- 5.6.1 Installed Production Capacity
- 5.6.2 Actual Production
- 5.6.3 Planned Capacity and Expansion Targets
- 5.7 Supply Chain Structure and Procurement Trends
- 5.8 Supply-Demand Gap and Bottlenecks
- 5.9 Import Dependence and Sourcing Structure
- 5.10 Contract Manufacturing and Outsourcing
- 5.11 Regional Supply and Demand Concentration
Chapter 6 Global Ophthalmic Devices Market Pricing Analysis
- 6.1 Pricing Structure and Measurement
- 6.2 Historical Pricing Trends, 2018-2025
- 6.3 Pricing Outlook, 2025-2035
- 6.4 Average Selling Price and Unit Economics
- 6.5 Pricing by Product and Market Segment
- 6.6 Geographic Pricing Differences
- 6.7 Key Input, Energy, Labor and Logistics Costs
- 6.8 Contract Pricing and Purchasing Models
- 6.9 Pricing Sensitivity and Competitive Positioning
- 6.10 Price, Margin and Profitability Implications
Chapter 7 Global Ophthalmic Devices Market Dynamics
- 7.1 Market Growth Drivers
- 7.1.1 Demand-Side Drivers
- 7.1.2 Technology and Innovation Drivers
- 7.1.3 Infrastructure and Investment Drivers
- 7.1.4 Regulatory and Policy Drivers
- 7.2 Market Restraints
- 7.2.1 Cost and Affordability Constraints
- 7.2.2 Technology and Adoption Barriers
- 7.2.3 Supply Chain and Operational Constraints
- 7.3 Market Challenges
- 7.3.1 Competitive Pressure and Margin Erosion
- 7.3.2 Skills, Infrastructure and Implementation Gaps
- 7.4 Emerging Market Opportunities
- 7.5 Market Dynamics Impact and Time-Horizon Assessment
Chapter 8 Global Ophthalmic Devices Value Chain Analysis
- 8.1 Industry Value Chain Overview
- 8.2 Upstream Suppliers and Critical Inputs
- 8.3 Technology and Component Providers
- 8.4 Manufacturing or Service Delivery
- 8.5 Distribution, Channel Partners and Integrators
- 8.6 Downstream Applications and End Users
- 8.7 Value Addition and Profit Pools
- 8.8 Vertical Integration and Outsourcing
- 8.9 Supplier Concentration and Risk
- 8.10 Supply Chain Localization and Resilience
Chapter 9 Global Ophthalmic Devices Market Regulations and Policies
- 9.1 Relevant Laws, Standards and Compliance Frameworks
- 9.2 Product, Service, Safety and Quality Requirements
- 9.3 Government Policies, Incentives and Subsidies
- 9.4 Imports, Exports and Trade Barriers
- 9.5 Public Procurement and Local Content Requirements
- 9.6 Environmental and Sustainability Compliance
- 9.7 Upcoming Policy Changes and Market Implications
Chapter 10 Global Ophthalmic Devices Market Hotspots and Opportunities
- 10.1 Market Opportunity Mapping and Growth Hotspots
- 10.2 High-Growth Applications and Customer Groups
- 10.3 Underserved Markets and White-Space Opportunities
- 10.4 Emerging Technology and Product Opportunities
- 10.5 New Capacity and Investment Hotspots
- 10.6 Market Entry and Expansion Opportunities
- 10.7 Distribution and Partnership Opportunities
- 10.8 Near-Term and Long-Term Commercial Potential
- 10.9 Opportunity Attractiveness and Execution Risks
Chapter 11 Global Ophthalmic Devices Market Outlook, 2025-2035
- 11.1 Market Size and Analysis
- 11.1.1 Revenue (Market Measurement: 2025: USD 4.19 billion → 2035: USD 6.98 billion)
- 11.1.2 Market Volume and Quantity Sold
- 11.1.3 Historical Market Size, 2018-2025
- 11.1.4 Base-Year Market Size, 2025
- 11.2 Market Forecast, 2025-2035
- 11.2.1 Revenue Forecast to 2035
- 11.2.2 Volume Forecast to 2035
- 11.2.3 CAGR and Year-on-Year Growth
- 11.2.4 Incremental Revenue Opportunity
- 11.3 Forecast Assumptions and Scenario Analysis
- 11.3.1 Base-Case Forecast
- 11.3.2 Optimistic and Conservative Scenarios
- 11.3.3 Technology, Pricing and Policy Sensitivities
- 11.4 Market Attractiveness and Growth Outlook
Chapter 12 Global Ophthalmic Devices Market Segmentation and Outlook
- 12.1 Segmentation Summary and Market Shares, 2025
- 12.2 Largest and Fastest-Growing Segments
- 12.3 By Product - Market Size and Forecast, 2025-2035
- 12.3.1 Segment Definition and Scope
- 12.3.2 Historical Market Size, 2018-2025
- 12.3.3 Revenue Forecast, 2025-2035
- 12.3.4 Volume Forecast, 2025-2035
- 12.3.5 Base-Year Market Share, 2025
- 12.3.6 Segment CAGR and Growth Drivers
- 12.3.7 Subsegment Market Size and Forecast
- 12.3.7.1 Optical Coherence Tomography Scanners
- 12.3.7.2 Fundus Camera
- 12.3.7.3 Perimeters/Visual Field Analyzers
- 12.3.7.4 Autorefractors and Keratometers
- 12.3.7.5 Ophthalmic Ultrasound Imaging Systems
- 12.3.7.6 Tonometers
- 12.3.7.7 Slit Lamps
- 12.3.7.8 Optical Biometry Systems
- 12.3.7.9 Lensmeters
- 12.3.7.10 Corneal Topography Systems
- 12.3.7.11 Retinoscopes
- 12.3.7.12 Others
- 12.3.8 Subsegment Pricing and Adoption Trends
- 12.3.9 Leading Suppliers and Competition
- 12.3.10 Regional Demand and Opportunities
- 12.4 By Application - Market Size and Forecast, 2025-2035
- 12.4.1 Segment Definition and Scope
- 12.4.2 Historical Market Size, 2018-2025
- 12.4.3 Revenue Forecast, 2025-2035
- 12.4.4 Volume Forecast, 2025-2035
- 12.4.5 Base-Year Market Share, 2025
- 12.4.6 Segment CAGR and Growth Drivers
- 12.4.7 Subsegment Market Size and Forecast
- 12.4.7.1 Cataract
- 12.4.7.2 Vitreo Retinal Disorders
- 12.4.7.3 Refractive Disorders
- 12.4.7.4 Others
- 12.4.8 Subsegment Pricing and Adoption Trends
- 12.4.9 Leading Suppliers and Competition
- 12.4.10 Regional Demand and Opportunities
- 12.5 By End User - Market Size and Forecast, 2025-2035
- 12.5.1 Segment Definition and Scope
- 12.5.2 Historical Market Size, 2018-2025
- 12.5.3 Revenue Forecast, 2025-2035
- 12.5.4 Volume Forecast, 2025-2035
- 12.5.5 Base-Year Market Share, 2025
- 12.5.6 Segment CAGR and Growth Drivers
- 12.5.7 Subsegment Market Size and Forecast
- 12.5.7.1 Hospitals & ASCs
- 12.5.7.2 Eye Clinics
- 12.5.7.3 Others
- 12.5.8 Subsegment Pricing and Adoption Trends
- 12.5.9 Leading Suppliers and Competition
- 12.5.10 Regional Demand and Opportunities
- 12.6 Segment Growth Comparison
- 12.7 Segment Attractiveness and Priority Matrix
Chapter 13 Global Ophthalmic Devices End-Use and Application Market Outlook
- 13.1 End-Use Industry and Customer Demand Structure
- 13.2 Leading Applications and Customer Groups
- 13.3 End-Use Market Size, Share and Forecast
- 13.4 Major End-Use Industry Deep Dives
- 13.4.1 Customer Requirements and Use Cases
- 13.4.2 Demand and Replacement Cycles
- 13.4.3 Technical and Regulatory Considerations
- 13.4.4 Purchasing and Procurement Models
- 13.4.5 Leading Vendors and Distribution Channels
- 13.4.6 Forecast and Commercial Opportunities
- 13.5 Emerging Applications and Cross-Segment Demand
- 13.6 End-Use Industry Investment Priorities
Chapter 14 Global Ophthalmic Devices Geographic Market Outlook, 2025-2035
- 14.1 Regional Market Size and Share, 2025
- 14.2 Regional Market Forecast, 2025-2035
- 14.3 Regional Pricing, Production and Demand Differences
- 14.4 North America
- 14.4.1 United States
- 14.4.2 Canada
- 14.4.3 Mexico
- 14.5 Europe
- 14.5.1 Germany
- 14.5.2 France
- 14.5.3 Italy
- 14.5.4 United Kingdom
- 14.5.5 Spain
- 14.5.6 Poland
- 14.5.7 Russia
- 14.5.8 Netherlands
- 14.5.9 Belgium
- 14.5.10 Sweden
- 14.5.11 Denmark
- 14.5.12 Norway
- 14.5.13 Rest of Europe
- 14.6 Asia Pacific
- 14.6.1 China
- 14.6.2 India
- 14.6.3 Japan
- 14.6.4 South Korea
- 14.6.5 Thailand
- 14.6.6 Indonesia
- 14.6.7 Vietnam
- 14.6.8 Malaysia
- 14.6.9 Australia
- 14.6.10 Rest of Asia Pacific
- 14.7 Latin America
- 14.7.1 Brazil
- 14.7.2 Argentina
- 14.7.3 Colombia
- 14.7.4 Chile
- 14.7.5 Rest of Latin America
- 14.8 Middle East
- 14.8.1 Saudi Arabia
- 14.8.2 United Arab Emirates
- 14.8.3 Turkey
- 14.8.4 Israel
- 14.8.5 Iran
- 14.8.6 Rest of the Middle East
- 14.9 Africa
- 14.9.1 South Africa
- 14.9.2 Egypt
- 14.9.3 Nigeria
- 14.9.4 Morocco
- 14.9.5 Rest of Africa
- 14.10 Regional Investment, Policy and Supply Chain Differences
- 14.11 Regional Competitive Landscape
- 14.12 Geographic Growth Hotspots
Chapter 15 Global Ophthalmic Devices Technology, Innovation and Sustainability Outlook
- 15.1 Technology Landscape and Maturity
- 15.2 Product, Process and Service Innovation
- 15.3 AI, Automation and Digital Tools in the Industry
- 15.4 Technology Adoption and Performance Benchmarking
- 15.5 Innovation Pipeline and R&D Investment
- 15.6 Patent and Intellectual Property Trends
- 15.7 Energy Efficiency and Resource Management
- 15.8 Sustainability, Recycling and Circularity
- 15.9 Technology Roadmap, 2025-2035
- 15.10 Risks of Obsolescence and Technology Substitution
Chapter 16 Global Ophthalmic Devices Market Key Strategic Imperatives
- 16.1 Growth and Market Entry Priorities
- 16.2 High-Return Products and Segments
- 16.3 Pricing, Profitability and Cost Optimization
- 16.4 Technology Investment and Product Differentiation
- 16.5 Supply Chain Localization and Resilience
- 16.6 Distribution and Customer Acquisition
- 16.7 Partnership, Acquisition and Capacity Strategy
- 16.8 Regional Expansion Priorities
- 16.9 Short-, Medium- and Long-Term Actions
Chapter 17 Competition Outlook
- 17.1 Industry Competition Characteristics
- 17.2 Market Structure and Concentration
- 17.3 Market Share and Competitive Positioning, 2025
- 17.4 Company-Wise Revenue and Product Benchmarking
- 17.5 Production and Service Capacity Benchmarking
- 17.6 Technology, Pricing and Differentiation
- 17.7 Regional Footprint and Distribution Strength
- 17.8 Mergers, Acquisitions and Strategic Alliances
- 17.9 New Entrants and Competitive Threats
- 17.10 Porter's Five Forces and Industry Attractiveness
- 17.11 Competitive Outlook, 2025-2035
Chapter 18 Company Profiles
- 18.1 Company Coverage and Selection Criteria
- 18.2 Johnson & Johnson Vision Care
- 18.2.1 Business Description
- 18.2.2 Company Ownership and Geographic Presence
- 18.2.3 Product and Service Portfolio
- 18.2.4 Manufacturing and Operating Footprint
- 18.2.5 Production Capacity and Expansion Plans
- 18.2.6 Financial Performance and Investment
- 18.2.7 Market Share and Competitive Position
- 18.2.8 Technology and Innovation Capabilities
- 18.2.9 Strategic Alliances or Partnerships
- 18.2.10 Recent Developments
- 18.2.11 Growth Strategy and Outlook
- 18.3 Alcon Vision LLC
- 18.4 Carl Zeiss Meditec AG
- 18.5 Bausch & Lomb Incorporated
- 18.6 Essilor International S.A
- 18.7 Ziemer Ophthalmic Systems Ltd
- 18.8 Nidek Co. Ltd.
- 18.9 Topcon Corporation
- 18.10 Haag-Streit Group
- 18.11 Glaukos Corporation
- 18.12 Other Relevant Market Participants
Note: Every listed company is profiled on the structure shown under the first company. The company list is preliminary and may change based on research findings, market developments, data availability and client requirements.
Chapter 19 Disclaimer
- 19.1 Research and Forecast Disclaimer
- 19.2 Data Source and Estimation Limitations
Note: The depth of individual sections depends on data availability for this market. Volume, capacity, trade and other unit-based metrics are included where applicable.

