
Farm losses and processing zones lift cooling demand
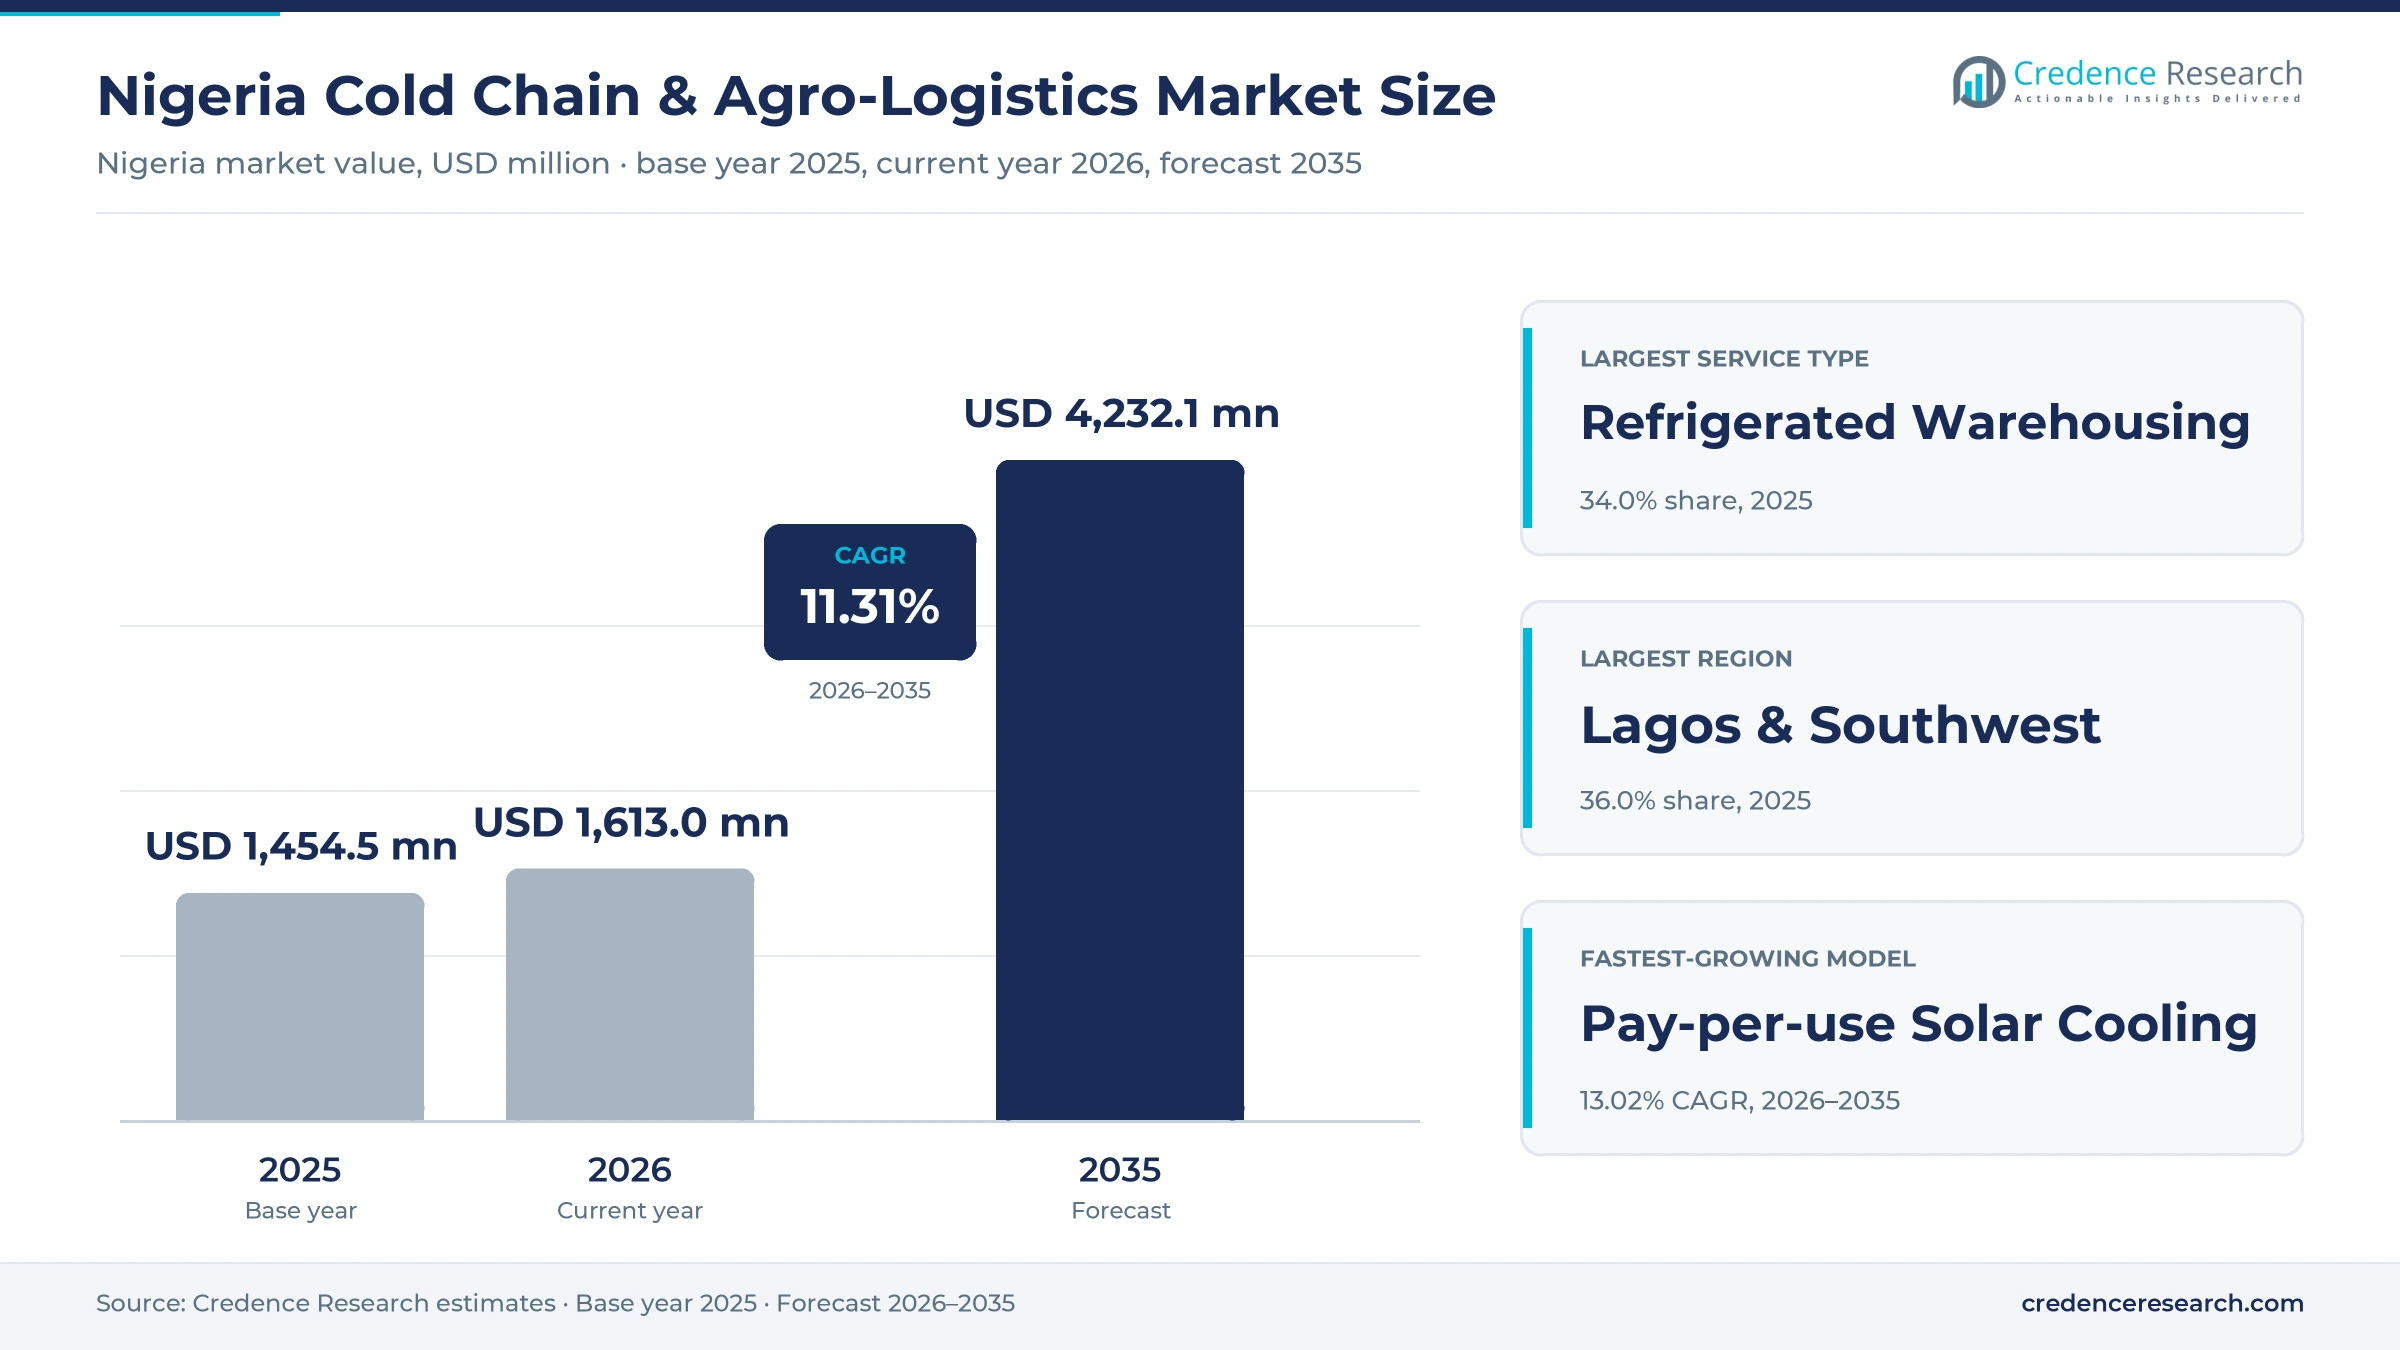
The Nigeria cold chain & agro-logistics market was valued at USD 1.45 billion in 2025 and is projected to increase from USD 1.61 billion in 2026 to USD 4.23 billion by 2035, registering a CAGR of 11.31% during 2026–2035. Demand comes from food processors, importers, modern retailers and pharmaceutical distributors that need chilled and frozen capacity, and from farm groups that lose large volumes of produce after harvest. Lagos & Southwest held the largest regional share, 36.0% in 2025, because the Lagos port complex and the biggest consumer base sit in the zone. The Northwest Production Belt is the fastest-growing region at 12.08% a year, as tomato, maize and livestock clusters gain aggregation and cooling points. In April 2025, the federal government and the African Development Bank broke ground on the first Special Agro-Industrial Processing Zones in Kaduna and Cross River. As a result, demand is spreading from port-led import flows toward inland production hubs that need pre-cooling, storage and refrigerated trucking.
What does the Nigerian cold chain estimate count?
The estimate counts revenue from refrigerated warehousing, refrigerated road, ocean and air transport, pre-cooling and packhouse handling, and value-added services such as sorting, labeling and temperature monitoring inside Nigeria. It also counts fees for coordinating the movement of perishable farm goods between farms, hubs, processors and city markets. Buyers pay per pallet, per crate, per trip or through dedicated contracts.
The estimate excludes the sale of refrigeration equipment, reefer containers and trucks to end users, because those are capital goods rather than services. It also excludes in-store freezers that supermarkets and restaurants own and operate. The value chain runs from smallholders, fishers and importers through storage and transport operators to processors, retailers, hospitals and exporters.
Nigeria Cold Chain & Agro-Logistics Market Insights
- The market was valued at USD 1.45 billion in 2025 and is projected to reach USD 4.23 billion by 2035, registering a CAGR of 11.31% during 2026–2035.
- Lagos & Southwest held 36.0% of Nigerian value in 2025, because the main ports and the largest city markets sit there.
- Refrigerated warehousing led service types with 34.0% of 2025 value, as importers and processors hold frozen stock near cities.
- Phase 1 of the Special Agro-Industrial Processing Zones program is worth $538 million and broke ground in Kaduna on April 8, 2025.
- Nigeria received 1,653 solar direct-drive vaccine refrigerators worth about $11 million in August 2025, spread across all 36 states and the FCT.
Warehousing leads while solar pay-per-use grows fastest
Why does refrigerated warehousing hold the largest share?
Based on service type, the market is categorized into refrigerated warehousing, refrigerated transport, pre-cooling and packhouse logistics, value-added services and agro-distribution coordination. Refrigerated Warehousing led with 34.0% of 2025 value, because frozen fish, meat and dairy imports stay in city stores until sale. Pre-Cooling & Packhouse Logistics grows fastest at 12.22% a year, as processing zones need cooling at the point of aggregation.
Which products fill Nigerian cold rooms and trucks?
Based on end-use industry, the market is categorized into seafood and meat, fruits and vegetables, dairy and frozen foods, pharmaceuticals and vaccines, and seeds and high-value agriculture. Seafood & Meat led with 30.0% of 2025 value, because imported frozen fish and poultry need constant deep-freeze handling. Fruits & Vegetables grow fastest at 11.82% a year, as farm groups adopt shared cooling to cut spoilage.
Who buys most cooling and transport capacity?
Based on customer type, the market is categorized into food processors and manufacturers, modern retail and foodservice, exporters and commodity traders, pharma and healthcare distributors, and smallholder aggregators and cooperatives. Food Processors & Manufacturers led with 28.0% of 2025 value, because they run steady inbound and outbound cold flows. Smallholder Aggregators & Cooperatives grow fastest at 12.19% a year, as rental cold rooms reach farm markets.
How fast is pay-per-use solar cooling spreading?
Based on business model, the market is categorized into integrated 3PL, dedicated contract logistics, shared cold storage, asset-light brokerage and pay-per-use solar cooling. Integrated 3PL led with 30.0% of 2025 value, because large shippers buy storage, haulage and distribution together. Pay-per-use Solar Cooling grows fastest at 13.02% a year, as traders rent crates by the day without buying equipment.
| Segment Group | Leading Sub-segment | Share, 2025 | Fastest-growing Sub-segment | CAGR, 2026–2035 |
|---|---|---|---|---|
| By Service Type | Refrigerated Warehousing | 34.0% | Pre-Cooling & Packhouse Logistics | 12.22% |
| By End-Use Industry | Seafood & Meat | 30.0% | Fruits & Vegetables | 11.82% |
| By Customer Type | Food Processors & Manufacturers | 28.0% | Smallholder Aggregators & Cooperatives | 12.19% |
| By Business Model | Integrated 3PL | 30.0% | Pay-per-use Solar Cooling | 13.02% |
Request a Free Sample
Fill in your details and we'll send you a free sample report.
- Sample data tables & charts
- Research methodology
Processing zones, spoilage and food imports drive demand
How do agro-industrial processing zones lift demand?
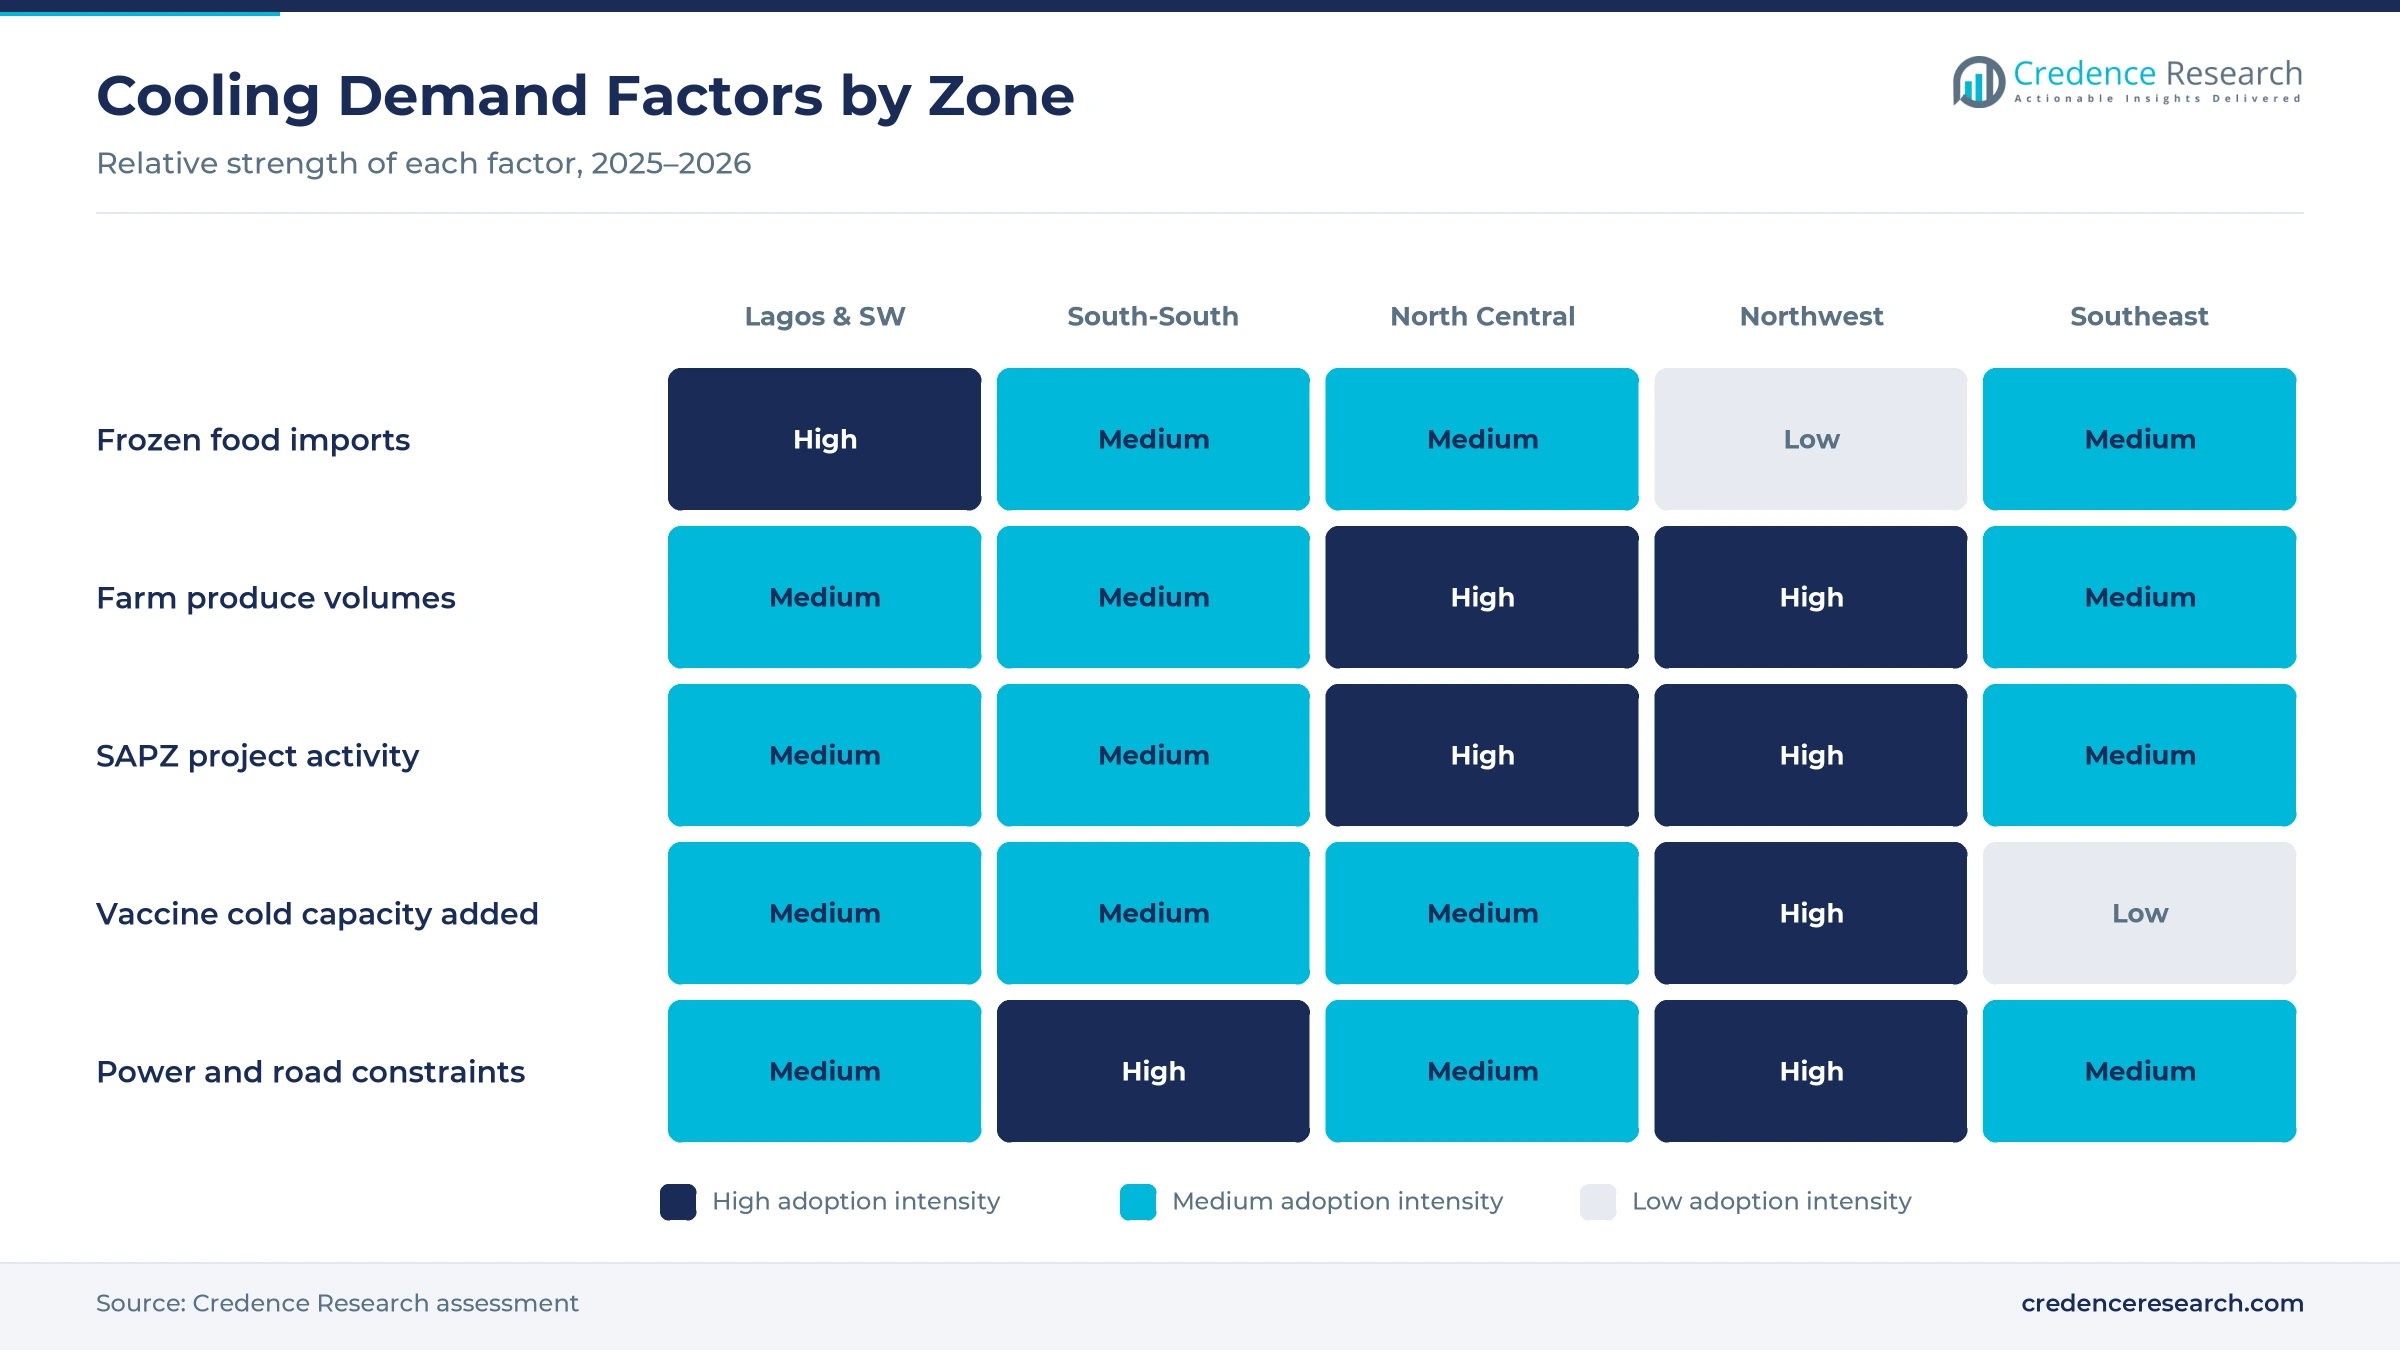
Investment in Special Agro-Industrial Processing Zones is the first driver, because processing hubs need cooled aggregation, storage and transport links to receive perishable crops. Phase 1 of the program is worth $538 million and covers Kaduna, Kano, Kwara, Cross River, Imo, Ogun, Oyo and the Federal Capital Territory, according to allAfrica. Groundbreaking took place in Kaduna on April 8, 2025, followed by a second ceremony in Cross River State. The African Development Bank provided $210 million at launch, with support from the Islamic Development Bank and IFAD. Each pioneer state could gain more than 60,000 jobs, while the Kaduna hub targets maize, soybeans, ginger and tomatoes. As a result, pre-cooling and packhouse logistics grows at 12.22% a year.
Why does post-harvest loss reduction matter so much?
The need to cut post-harvest losses is the second driver, because spoilage destroys farm income before produce reaches city markets. About 45% of food in Nigeria spoils because of a lack of cold storage, according to a study cited by IFPRI, and small farmers lose about 25% of their annual income. Tomatoes trucked from Kano to southern markets travel about 14 hours in heat close to 90 degrees Fahrenheit. Wholesale prices can then fall from about $60 per basket in the morning to $10 to $15 by evening. Solar cold rooms extend produce shelf life from two days to about 21 days. Therefore, smallholder aggregators and cooperatives grow at 12.19% a year.
How does a large food economy shape cold flows?
A large food economy and heavy import distribution form the third driver, because frozen fish, meat, dairy and processed foods move from ports to inland cities. Nigeria's population reached about 237.5 million in 2025, and 63.8% of residents lived in urban areas, based on World Bank data. Food made up 12.3% of merchandise imports in 2025, up from 11.0% in 2024. The country spent about $4.7 billion on food imports in the year before the April 2025 SAPZ launch, according to statements at the event. Agriculture also accounted for 23.0% of GDP in 2025, which keeps large volumes of perishable output in domestic channels. Consequently, frozen seafood and meat remain the core of storage and transport demand in the country.
Why do vaccine and medicine flows need more capacity?
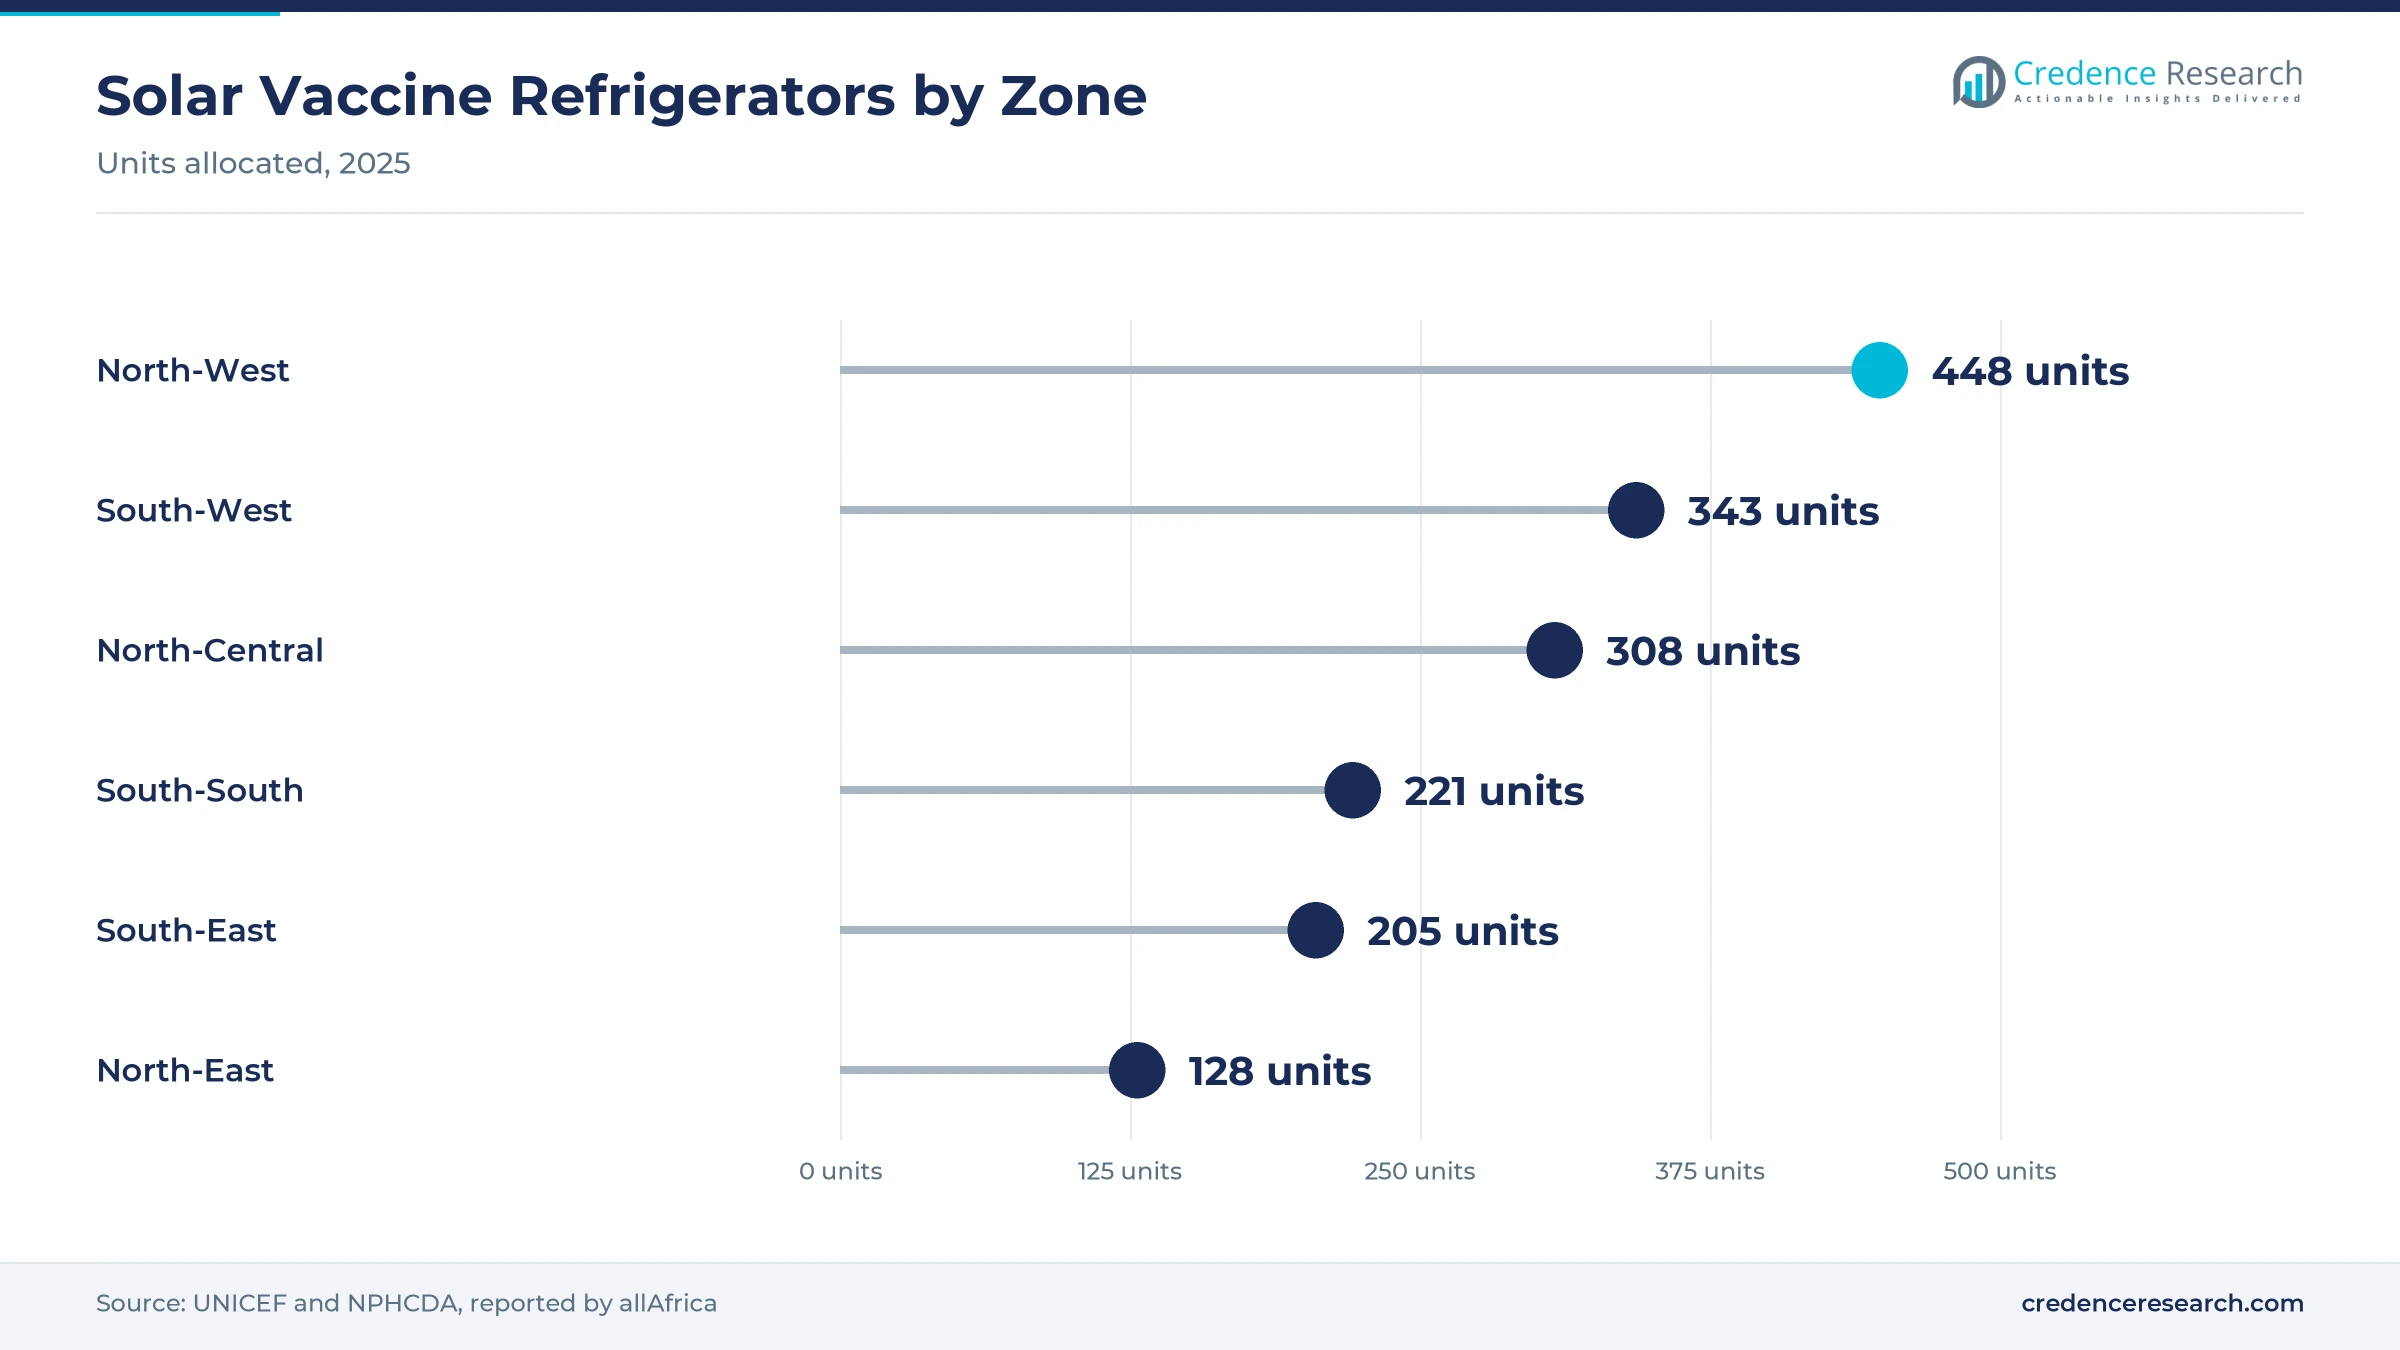
Pharmaceutical and vaccine distribution adds a fourth driver, because medicines need validated temperature control from port to clinic. In August 2025, Nigeria received 1,653 solar direct-drive refrigerators worth about $11 million, funded by Gavi, UNICEF and the federal government. The units were allocated to all 36 states and the Federal Capital Territory, with 448 going to the North-West zone. NAFDAC Good Storage and Distribution Practice guidelines took effect on Nov. 26, 2024, and require refrigerated vehicles to hold set temperatures with calibrated sensors and alarms. Nigeria also runs 835 vaccine cold stores that are tracked through the OpenLMIS system. In turn, pharma and healthcare distributors buy more validated storage and refrigerated transport.
Solar cold rooms and reefer trucks reshape supply
Why are pay-per-use solar cold rooms rising?
Pay-per-use solar cold rooms are rising, because many farm markets lack reliable grid power and cannot fund their own refrigeration. ColdHubs had installed 58 solar-powered cold rooms on farms, at aggregation centers and in open markets across 28 states by July 2023, according to the News Agency of Nigeria. Users rent crates by the day, which suits traders who cannot buy their own equipment. In June 2026, All On invested $1 million in Eja-Ice to expand manufacturing of solar-powered cold storage and ice products. Eja-Ice targets small-scale fishers, traders and cooperatives in rural and coastal communities with weak power supply. As a result, pay-per-use solar cooling grows at 13.02% a year, the fastest of any business model in the country.
How is integrated refrigerated transport emerging?
Integrated refrigerated transport is an emerging shift, because cold rooms alone cannot protect produce that travels long distances to southern cities. In July 2023, ColdHubs added five refrigerated trucks with 20-ton capacity each, bringing its fleet to seven, and planned further additions before the end of that year. The trucks serve Nigeria and West Africa and carry produce, meat, dairy, seafood and pharmaceuticals. They also carry tracking devices that report temperature and driver activity to customers in real time. MDS Logistics, which began in 1965 as a warehousing operator, now runs warehousing, haulage and distribution in 31 states. Consequently, buyers increasingly favor providers that combine storage with refrigerated trucks under one contract.
Can temperature data and insurance open new revenue?
Data-led monitoring is an opening, because shippers and insurers need proof that goods stayed within safe temperatures. Figorr, formerly Gricd, raised $1.5 million in seed funding in May 2023, as reported by TechCrunch. Its devices track location, humidity and temperature, and customers pay a subscription for the data. In Nigeria, the devices are mainly used for vaccines and insulin, and the company planned a risk platform to help insurers design cover for perishables. NAFDAC rules from November 2024 also call for calibrated sensors at likely temperature extremes in refrigerated vehicles. Therefore, providers that add IoT sensors can win pharmaceutical contracts and charge for value-added services.
Will processing zone hubs open cooling demand inland?
Pre-cooling and packhouse capacity near production zones is a second opening, because SAPZ hubs will gather crops before they move to processors. The program plans Agro-Industrial Hubs, Agricultural Transformation Centers and aggregation centers inside production clusters, starting with hubs in Kaduna and Cross River. The African Development Bank board approved the Nigerian SAPZ loan in December 2021, after the bank launched the project in the country in September 2021. The program also expects agricultural productivity to rise by more than 60%, which would raise the volumes that need fast cooling. Ogun poultry and fish clusters will also need chilled capacity for frozen foods moving to Lagos. As a result, pre-cooling near farms becomes a priority investment for providers in the north.
Power, roads and costly equipment squeeze operators
Why do power costs weigh on operator margins?
Unreliable grid power is the largest operating problem in cold chain agro-logistics, because compressors must run around the clock in a hot climate. Many warehouses and packhouses rely on diesel generators, so energy bills rise sharply when fuel prices climb. As a result, storage rates must cover high energy costs, which smaller traders and farm groups struggle to pay. Operators respond with solar-powered storage systems, batteries and better insulation, although these raise upfront capital needs.
How do road conditions and long hauls affect loads?
Long road hauls from northern farms to southern markets expose perishable loads to heat, delays and checkpoints. Poor road surfaces also raise fuel use and wear on refrigerated trucks, which pushes up the cost per trip. Consequently, spoilage risk remains high when trucks break down far from repair shops. Route planning, tracking devices and regional hubs closer to farms help operators reduce these losses over time.
Why is imported equipment so costly for operators?
Most refrigeration units, insulated panels, reefer trucks and sensors are imported, so their cost rises when the naira weakens. This makes it hard for operators to plan expansions and price long-term contracts in local currency. Therefore, many small cold rooms stay underused or poorly maintained, which limits capacity outside the main cities. Local assembly, lease finance and development bank credit lines help ease the burden for new projects.
Do skills gaps and fragmented supply slow growth?
Skills gaps and fragmented supply chains slow growth in cold chain agro-logistics, because many farm markets lack trained technicians and handlers. Smallholders also sell in small lots, which makes it costly to fill trucks and cold rooms efficiently. As a result, operators face low utilization in rural areas and long payback periods. Aggregation centers, cooperative contracts and digital booking tools are the main ways companies close these gaps.
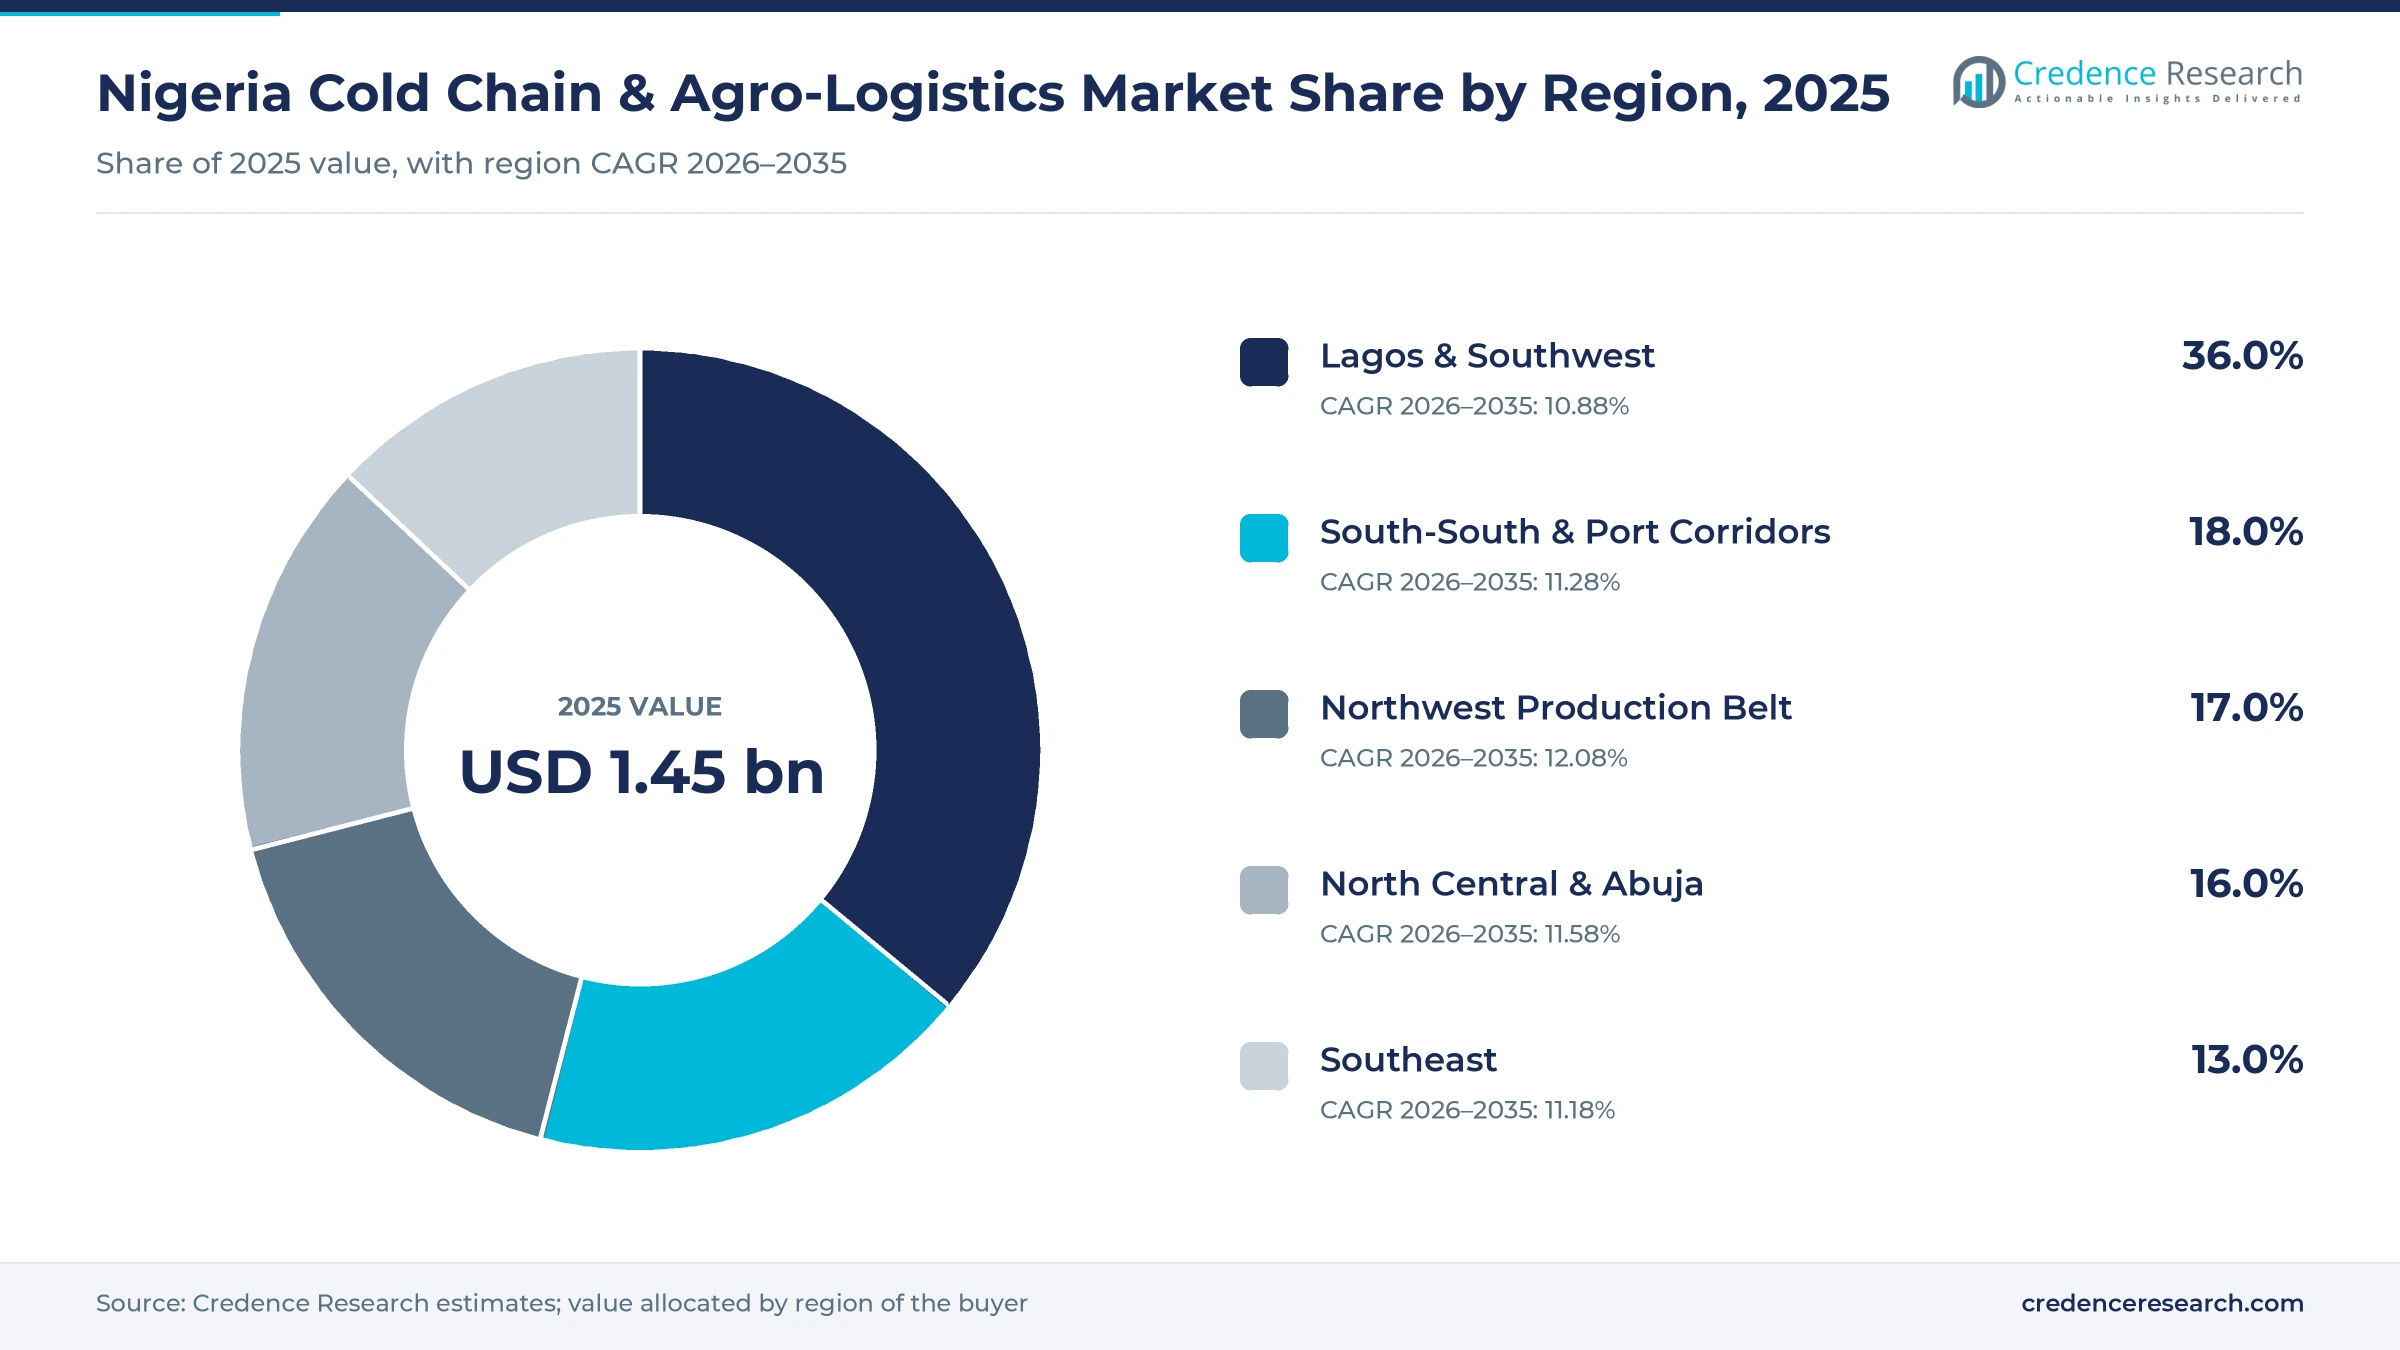
Lagos and the Southwest hold the largest share
| Region | Value, 2025 (USD billion) | Share, 2025 | CAGR, 2026–2035 |
|---|---|---|---|
| Lagos & Southwest | 0.52 | 36.0% | 10.88% |
| South-South & Port Corridors | 0.26 | 18.0% | 11.28% |
| Northwest Production Belt | 0.25 | 17.0% | 12.08% |
| North Central & Abuja | 0.23 | 16.0% | 11.58% |
| Southeast | 0.19 | 13.0% | 11.18% |
Why does Lagos & Southwest lead demand?
Lagos & Southwest held 36.0% of 2025 value and grows at 10.88% a year. The lead reflects the Lagos port complex, where most frozen fish, meat and dairy imports arrive, and the largest urban consumer base. Ogun and Oyo are also SAPZ Phase 1 states, with cassava, rice, poultry and fisheries clusters. The zone received 343 of the 1,653 solar vaccine refrigerators delivered in 2025. However, growth is slower than in the north, because the zone already holds the deepest capacity.
How do South-South port corridors use cold capacity?
South-South & Port Corridors held 18.0% of 2025 value and grows at 11.28% a year. Ports and coastal fishing communities in the zone create steady demand for ice, chilled storage and seafood transport. Cross River hosts one of the first two SAPZ hubs, with a focus on cocoa, cassava and rice. The zone also received 221 solar vaccine refrigerators in 2025, which expands health-sector cold capacity across its states.
Why is the Northwest Production Belt the fastest-growing zone?
The Northwest Production Belt held 17.0% of 2025 value and grows at 12.08% a year, the fastest of the five zones. Kaduna and Kano are SAPZ Phase 1 states, with tomato, maize, ginger, rice and groundnut clusters that need cooling near farms. The zone also received the largest allocation of 448 solar vaccine refrigerators in 2025. Therefore, new aggregation and pre-cooling points cut the long hauls that spoil produce bound for southern markets.
What drives demand in north Central & Abuja?
North Central & Abuja held 16.0% of 2025 value and grows at 11.58% a year. The Federal Capital Territory and Kwara are SAPZ Phase 1 locations, with beef, dairy and livestock projects that need chilled handling. Abuja also hosts federal health agencies and a growing base of supermarkets and hotels. The zone received 308 solar vaccine refrigerators in 2025, which lifts demand for pharmaceutical storage and last-mile distribution.
How does the southeast build cooling capacity?
The Southeast held 13.0% of 2025 value and grows at 11.18% a year. ColdHubs was founded in Owerri, Imo State, in 2015 and built its first solar cold rooms for traders in local markets. Imo is also a SAPZ Phase 1 state, with beef and dairy livestock projects. The zone received 205 solar vaccine refrigerators in 2025, while busy trading cities such as Onitsha and Aba keep demand for chilled food distribution steady.
Policy moves and investments from 2023 to 2026
| Development | Status and market relevance |
|---|---|
| In July 2023, ColdHubs added five refrigerated trucks with 20-ton capacity in Lagos, raising its fleet to seven trucks. | Extends solar cold room services into refrigerated transport |
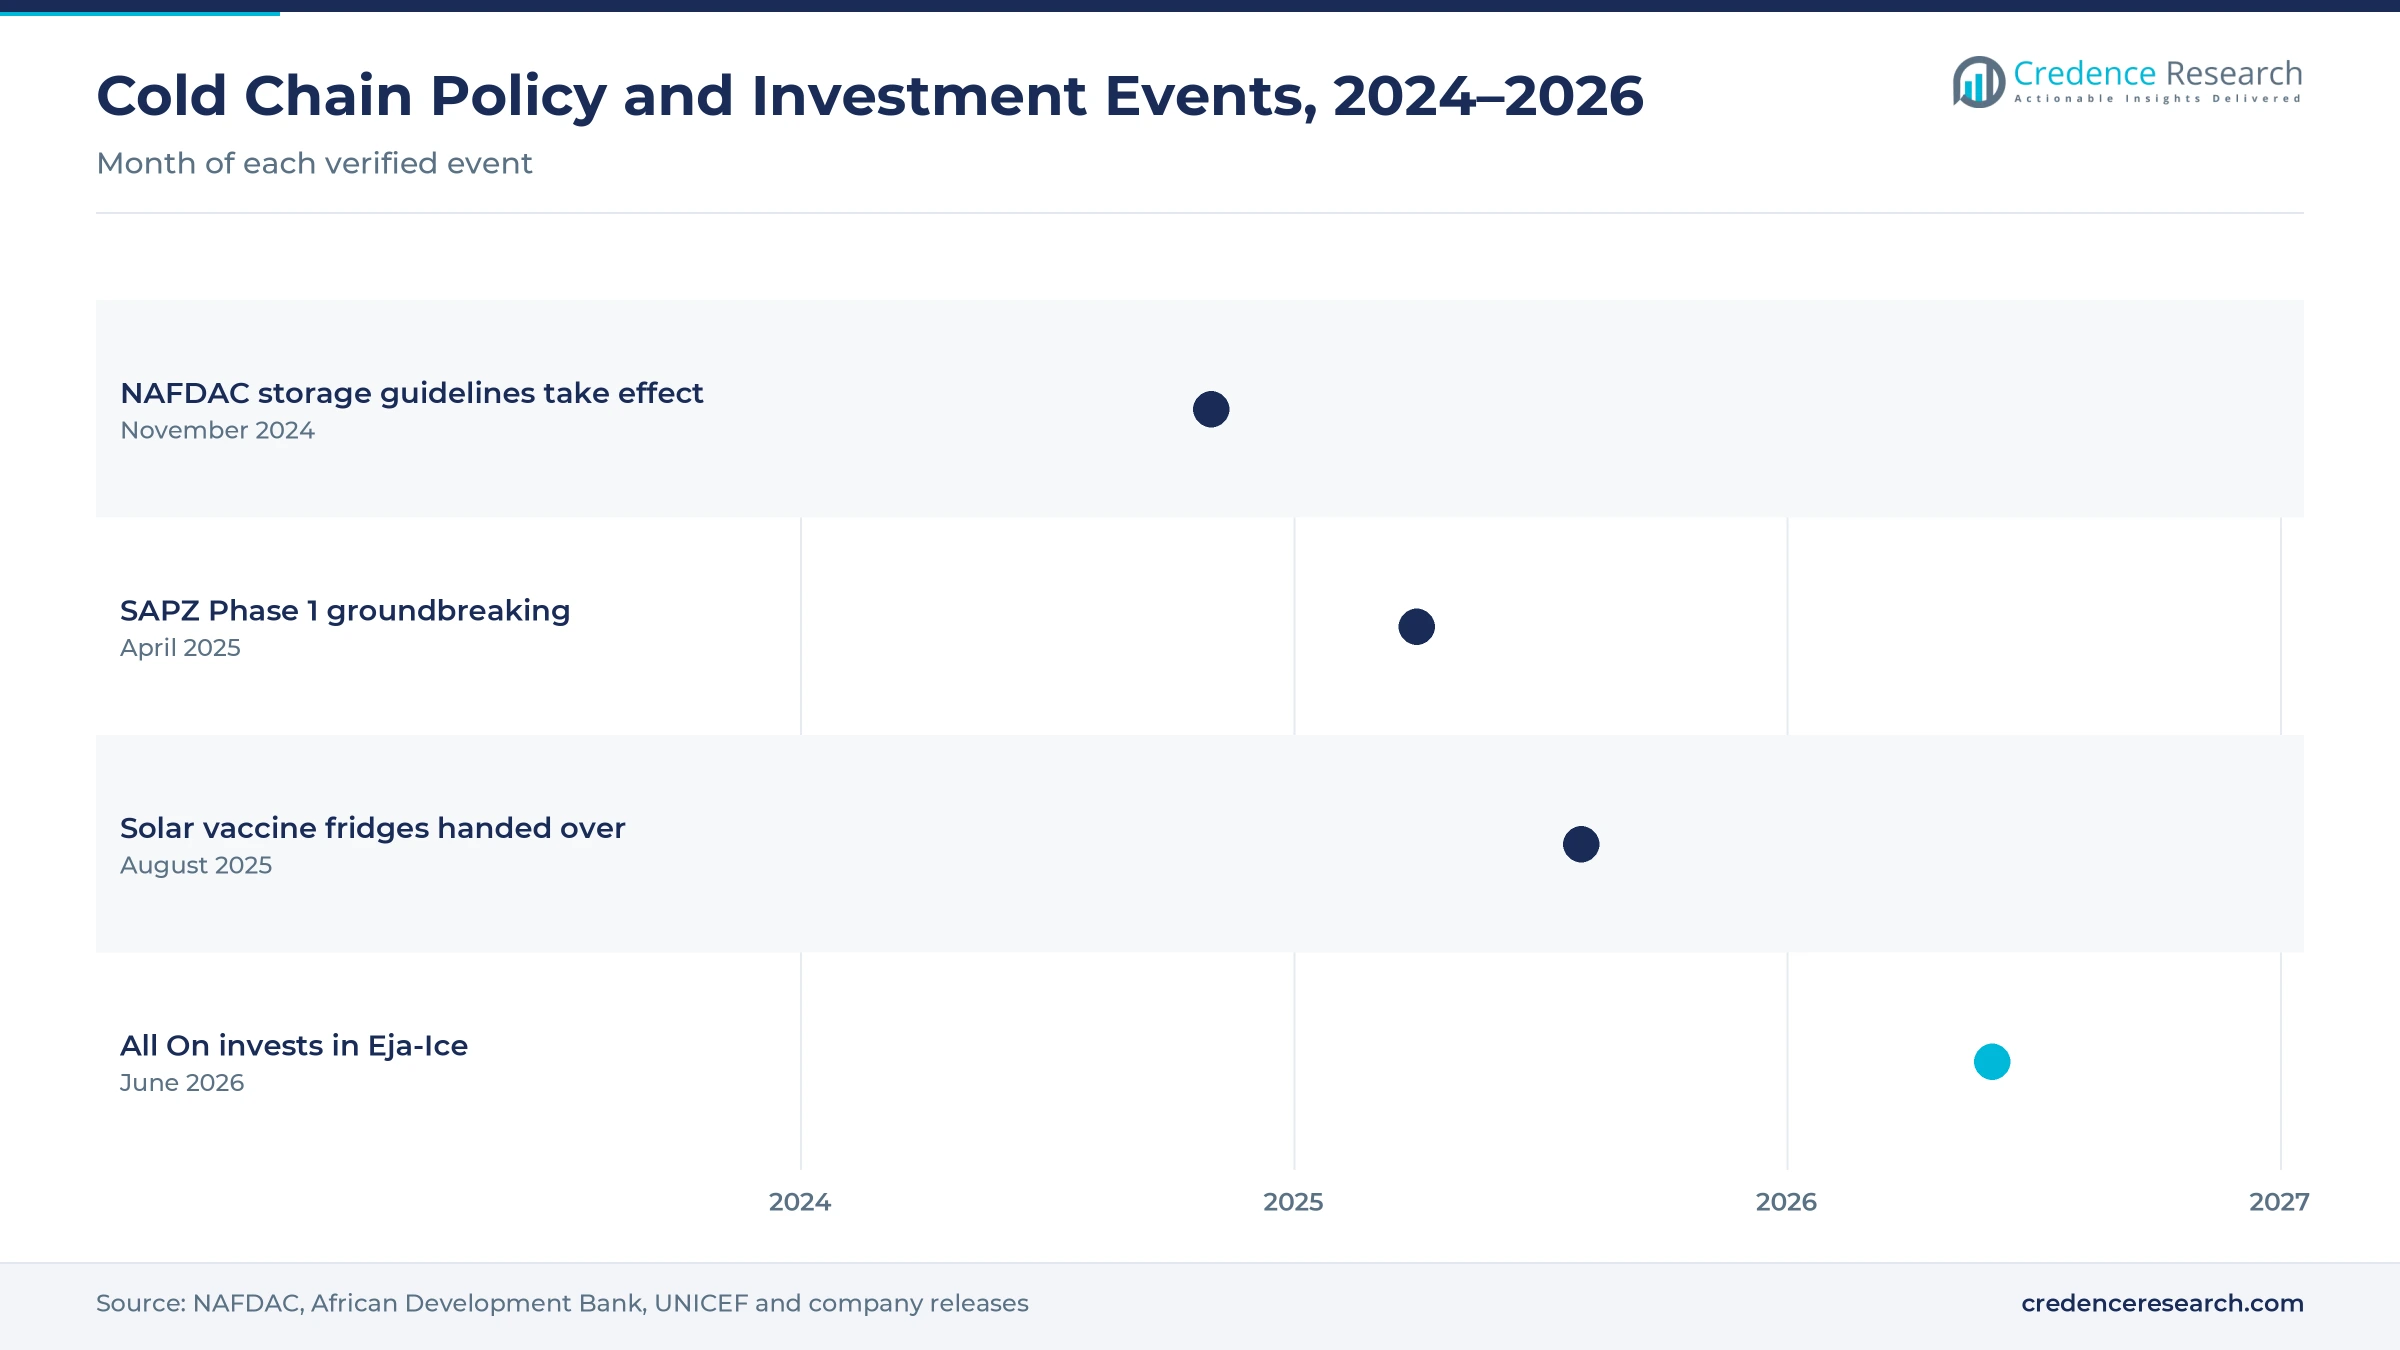
| In November 2024, NAFDAC Good Storage and Distribution Practice guidelines took effect for temperature-sensitive medicines. | Sets sensor, alarm and vehicle rules for pharmaceutical cold transport |
| In April 2025, the federal government and the African Development Bank broke ground on SAPZ Phase 1 in Kaduna and Cross River. | Phase 1 worth $538 million across eight locations |
| In August 2025, Nigeria received 1,653 solar direct-drive vaccine refrigerators funded by Gavi, UNICEF and the federal government. | Allocated to all 36 states and the FCT |
| In June 2026, All On invested $1 million in Eja-Ice to expand solar cold storage and ice manufacturing. | Targets fishers, traders and cooperatives in off-grid areas |
Solar cooling and remote sensors gain ground
- Solar-powered cold rooms run on rooftop panels and thermal storage, which lets farm markets and aggregation centers cool tomatoes, peppers and leafy vegetables without grid power or diesel generators.
- Solar direct-drive refrigerators keep vaccines cold without batteries, which suits primary health centers in remote areas where grid supply is weak and generator fuel is costly.
- Remote temperature sensors send location, humidity and temperature data to shippers through subscription dashboards, which gives insurers, regulators and pharmaceutical clients a full audit trail.
- Tracked refrigerated trucks report temperature and driver activity to customers in real time, which reduces spoilage and theft on long routes from northern farms to southern cities.
Need a Custom Version of This Report?
Tailor the scope, geography, or segments to your exact requirements.
- Custom geography or segment scope
- Direct access to our analyst team
Logistics groups and solar startups compete on reach
Competition in Nigerian cold chain agro-logistics combines national logistics groups, global freight forwarders and solar cooling startups. MDS Logistics runs warehousing, haulage and distribution in 31 states and lists cold storage and pharma logistics among its services. DHL Global Forwarding offers road freight and monitored pharmaceutical shipments in Nigeria. Zenith Carex International provides warehousing, pharmalogistics and cold chain logistics from Lagos. ColdHubs operates pay-per-use solar cold rooms and refrigerated trucks, while Eja-Ice makes solar cold storage and ice products. Figorr supplies temperature sensors and data services to pharmaceutical and food shippers. The company list also covers Maersk Nigeria, MSC Nigeria, CMA CGM Nigeria Shipping and Red Star Logistics. Providers compete on network reach, validated temperature control, tracking data, power backup and the ability to bundle storage with transport.
Companies profiled and their roles in this market
| Company | Type | Role in the market |
|---|---|---|
| MDS Logistics | Integrated logistics provider | Warehousing, haulage and distribution in 31 states, with cold storage and pharma logistics |
| ColdHubs Limited | Solar cold room operator | 58 solar cold rooms in 28 states by July 2023 and seven refrigerated trucks |
| DHL Global Forwarding Nigeria | Freight forwarder | Road freight and monitored inbound pharmaceutical shipments |
| Zenith Carex International | Logistics provider | Lagos-based warehousing, pharmalogistics and cold chain services |
| Figorr | Monitoring technology provider | IoT devices for temperature, humidity and location tracking |
| Eja-Ice Ltd. | Solar cooling manufacturer | Solar cold storage and ice products, backed by a $1 million All On investment |
Credence Research view on Nigerian cooling capacity
Credence Research's view is that the Nigeria cold chain & agro-logistics market will grow fastest away from Lagos over the next decade. Import flows keep city warehouses busy, but the most important change is cooling capacity at farm aggregation points and processing zones in the north. Solar rental models and vaccine refrigerators also bring cold storage to places without stable power. However, energy costs, road conditions and currency swings will keep pressure on margins. Operators that combine solar power, tracked trucks and validated pharmaceutical handling are best placed to win long-term contracts.
Port, farm and vaccine data behind the estimate
The report uses 2025 as the base year on a calendar basis, with values in USD million at current prices. Market values come from the Credence Research model, which links storage and transport capacity, utilization and typical service rates to food and medicine flows that need cold chain agro-logistics services. Regional shares, regional growth rates and segment splits are Credence Research estimates. Sources used are World Bank data, African Development Bank program statements, NAFDAC guidelines, UNICEF and NPHCDA releases, news agency reports and company releases, and no interviews or surveys were used.
Inland hubs and vaccine supply shape growth to 2035
Spending is expected to reach USD 4.23 billion by 2035, an 11.31% CAGR during 2026–2035, as processors, retailers, farm groups and health distributors buy more cold chain agro-logistics services. Growth should be strongest in the late 2020s, when SAPZ hubs in the north and southeast start receiving crops. After that, solar cold rooms, tracked trucks and pharmaceutical storage will shape where operators invest. Power costs and road delays may slow some projects, but a large and urban population keeps the long-term outlook positive.
Frequently Asked Questions
How big is the Nigeria cold chain & agro-logistics market?
Which region leads Nigerian cold chain demand?
Which service type holds the largest share?
How much food spoils in Nigeria without cooling?
What are the Special Agro-Industrial Processing Zones?
Which region grows fastest through 2035?
Which companies compete in this market?
How is the vaccine cold chain changing?
Table of Content
Chapter 1 Market Segmentation
- 1.1 Segmentation Framework
- 1.1.1 Product and Service Classification
- 1.1.2 Application and End-Use Classification
- 1.1.3 Technology and Solution Classification
- 1.1.4 Customer and Distribution Channel Classification
- 1.1.5 Geographic Segmentation
- 1.1.6 Market Segment Definitions and Boundaries
- 1.2 By Service Type
- 1.2.1 Refrigerated Warehousing
- 1.2.2 Refrigerated Transport
- 1.2.3 Pre-Cooling & Packhouse Logistics
- 1.2.4 Cold-Chain Value-Added Services
- 1.2.5 Agro-Distribution Coordination
- 1.3 By End-Use Industry
- 1.3.1 Seafood & Meat
- 1.3.2 Fruits & Vegetables
- 1.3.3 Dairy & Frozen Foods
- 1.3.4 Pharmaceuticals & Vaccines
- 1.3.5 Seeds & High-Value Agriculture
- 1.4 By Customer Type
- 1.4.1 Food Processors & Manufacturers
- 1.4.2 Modern Retail & Foodservice
- 1.4.3 Exporters & Commodity Traders
- 1.4.4 Pharma & Healthcare Distributors
- 1.4.5 Smallholder Aggregators & Cooperatives
- 1.5 By Business Model
- 1.5.1 Integrated 3PL
- 1.5.2 Dedicated Contract Logistics
- 1.5.3 Shared Cold Storage
- 1.5.4 Asset-Light Brokerage
- 1.5.5 Pay-per-use Solar Cooling
Chapter 2 Introduction
- 2.1 Report Objectives and Scope
- 2.2 Product Definition and Industry Terminology
- 2.3 Market Inclusions and Exclusions
- 2.4 Research Process
- 2.4.1 Primary Research and Expert Interviews
- 2.4.2 Secondary Research and Source Review
- 2.4.3 Top-Down and Bottom-Up Estimation
- 2.4.4 Data Triangulation and Verification
- 2.5 Market Size Measurement Basis
- 2.5.1 2025: USD 1.45 billion → 2035: USD 4.23 billion
- 2.6 Historical and Forecast Reference Periods
- 2.6.1 Historical Period: 2018-2025
- 2.6.2 Base Year: 2025
- 2.6.3 Forecast Period: 2025-2035
- 2.7 Research Assumptions and Limitations
Chapter 3 Executive Summary
- 3.1 Market Snapshot and Key Findings
- 3.2 Base-Year Market Size, 2025
- 3.3 Forecast Market Size, 2035
- 3.4 Revenue and Volume Growth Outlook
- 3.5 Key Demand and Supply Indicators
- 3.6 Leading Market Segments
- 3.7 Fastest-Growing Market Opportunities
- 3.8 Regional Performance Highlights
- 3.9 Technology and Industry Transformation
- 3.10 Competitive Landscape Summary
- 3.11 Analyst View and Strategic Implications
Chapter 4 Nigeria Cold Chain & Agro-Logistics Market Trends and Developments
- 4.1 Historical Industry Development, 2018-2025
- 4.2 Recent Market Trends and Developments
- 4.3 Demand and Customer Behavior Trends
- 4.4 Technology and Product Innovation
- 4.5 Artificial Intelligence, Automation and Digitalization
- 4.6 Local Manufacturing and Supply Chain Realignment
- 4.7 Industry Partnerships, Mergers and Acquisitions
- 4.8 Sustainability and Circular Economy Developments
- 4.9 Government and Private Sector Investment Trends
- 4.10 Emerging Business Models and Commercialization
- 4.11 Industry Developments and Announcements
Chapter 5 Nigeria Cold Chain & Agro-Logistics Market Production, Supply and Demand Analysis
- 5.1 Demand Trend and Consumption Analysis, 2018-2025
- 5.2 Demand Forecast, 2025-2035
- 5.3 Production and Output Trend, 2018-2025
- 5.4 Production and Output Forecast, 2025-2035
- 5.5 Installed Capacity and Capacity Utilization
- 5.6 Company-Wise Production Plants and Statistics
- 5.6.1 Installed Production Capacity
- 5.6.2 Actual Production
- 5.6.3 Planned Capacity and Expansion Targets
- 5.7 Supply Chain Structure and Procurement Trends
- 5.8 Supply-Demand Gap and Bottlenecks
- 5.9 Import Dependence and Sourcing Structure
- 5.10 Contract Manufacturing and Outsourcing
- 5.11 Regional Supply and Demand Concentration
Chapter 6 Nigeria Cold Chain & Agro-Logistics Market Pricing Analysis
- 6.1 Pricing Structure and Measurement
- 6.2 Historical Pricing Trends, 2018-2025
- 6.3 Pricing Outlook, 2025-2035
- 6.4 Average Selling Price and Unit Economics
- 6.5 Pricing by Product and Market Segment
- 6.6 Geographic Pricing Differences
- 6.7 Key Input, Energy, Labor and Logistics Costs
- 6.8 Contract Pricing and Purchasing Models
- 6.9 Pricing Sensitivity and Competitive Positioning
- 6.10 Price, Margin and Profitability Implications
Chapter 7 Nigeria Cold Chain & Agro-Logistics Market Dynamics
- 7.1 Market Growth Drivers
- 7.1.1 Demand-Side Drivers
- 7.1.2 Technology and Innovation Drivers
- 7.1.3 Infrastructure and Investment Drivers
- 7.1.4 Regulatory and Policy Drivers
- 7.2 Market Restraints
- 7.2.1 Cost and Affordability Constraints
- 7.2.2 Technology and Adoption Barriers
- 7.2.3 Supply Chain and Operational Constraints
- 7.3 Market Challenges
- 7.3.1 Competitive Pressure and Margin Erosion
- 7.3.2 Skills, Infrastructure and Implementation Gaps
- 7.4 Emerging Market Opportunities
- 7.5 Market Dynamics Impact and Time-Horizon Assessment
Chapter 8 Nigeria Cold Chain & Agro-Logistics Value Chain Analysis
- 8.1 Industry Value Chain Overview
- 8.2 Upstream Suppliers and Critical Inputs
- 8.3 Technology and Component Providers
- 8.4 Manufacturing or Service Delivery
- 8.5 Distribution, Channel Partners and Integrators
- 8.6 Downstream Applications and End Users
- 8.7 Value Addition and Profit Pools
- 8.8 Vertical Integration and Outsourcing
- 8.9 Supplier Concentration and Risk
- 8.10 Supply Chain Localization and Resilience
Chapter 9 Nigeria Cold Chain & Agro-Logistics Market Regulations and Policies
- 9.1 Relevant Laws, Standards and Compliance Frameworks
- 9.2 Product, Service, Safety and Quality Requirements
- 9.3 Government Policies, Incentives and Subsidies
- 9.4 Imports, Exports and Trade Barriers
- 9.5 Public Procurement and Local Content Requirements
- 9.6 Environmental and Sustainability Compliance
- 9.7 Upcoming Policy Changes and Market Implications
Chapter 10 Nigeria Cold Chain & Agro-Logistics Market Hotspots and Opportunities
- 10.1 Market Opportunity Mapping and Growth Hotspots
- 10.2 High-Growth Applications and Customer Groups
- 10.3 Underserved Markets and White-Space Opportunities
- 10.4 Emerging Technology and Product Opportunities
- 10.5 New Capacity and Investment Hotspots
- 10.6 Market Entry and Expansion Opportunities
- 10.7 Distribution and Partnership Opportunities
- 10.8 Near-Term and Long-Term Commercial Potential
- 10.9 Opportunity Attractiveness and Execution Risks
Chapter 11 Nigeria Cold Chain & Agro-Logistics Market Outlook, 2025-2035
- 11.1 Market Size and Analysis
- 11.1.1 Revenue (Market Measurement: 2025: USD 1.45 billion → 2035: USD 4.23 billion)
- 11.1.2 Market Volume and Quantity Sold
- 11.1.3 Historical Market Size, 2018-2025
- 11.1.4 Base-Year Market Size, 2025
- 11.2 Market Forecast, 2025-2035
- 11.2.1 Revenue Forecast to 2035
- 11.2.2 Volume Forecast to 2035
- 11.2.3 CAGR and Year-on-Year Growth
- 11.2.4 Incremental Revenue Opportunity
- 11.3 Forecast Assumptions and Scenario Analysis
- 11.3.1 Base-Case Forecast
- 11.3.2 Optimistic and Conservative Scenarios
- 11.3.3 Technology, Pricing and Policy Sensitivities
- 11.4 Market Attractiveness and Growth Outlook
Chapter 12 Nigeria Cold Chain & Agro-Logistics Market Segmentation and Outlook
- 12.1 Segmentation Summary and Market Shares, 2025
- 12.2 Largest and Fastest-Growing Segments
- 12.3 By Service Type - Market Size and Forecast, 2025-2035
- 12.3.1 Segment Definition and Scope
- 12.3.2 Historical Market Size, 2018-2025
- 12.3.3 Revenue Forecast, 2025-2035
- 12.3.4 Volume Forecast, 2025-2035
- 12.3.5 Base-Year Market Share, 2025
- 12.3.6 Segment CAGR and Growth Drivers
- 12.3.7 Subsegment Market Size and Forecast
- 12.3.7.1 Refrigerated Warehousing
- 12.3.7.2 Refrigerated Transport
- 12.3.7.3 Pre-Cooling & Packhouse Logistics
- 12.3.7.4 Cold-Chain Value-Added Services
- 12.3.7.5 Agro-Distribution Coordination
- 12.3.8 Subsegment Pricing and Adoption Trends
- 12.3.9 Leading Suppliers and Competition
- 12.3.10 Regional Demand and Opportunities
- 12.4 By End-Use Industry - Market Size and Forecast, 2025-2035
- 12.4.1 Segment Definition and Scope
- 12.4.2 Historical Market Size, 2018-2025
- 12.4.3 Revenue Forecast, 2025-2035
- 12.4.4 Volume Forecast, 2025-2035
- 12.4.5 Base-Year Market Share, 2025
- 12.4.6 Segment CAGR and Growth Drivers
- 12.4.7 Subsegment Market Size and Forecast
- 12.4.7.1 Seafood & Meat
- 12.4.7.2 Fruits & Vegetables
- 12.4.7.3 Dairy & Frozen Foods
- 12.4.7.4 Pharmaceuticals & Vaccines
- 12.4.7.5 Seeds & High-Value Agriculture
- 12.4.8 Subsegment Pricing and Adoption Trends
- 12.4.9 Leading Suppliers and Competition
- 12.4.10 Regional Demand and Opportunities
- 12.5 By Customer Type - Market Size and Forecast, 2025-2035
- 12.5.1 Segment Definition and Scope
- 12.5.2 Historical Market Size, 2018-2025
- 12.5.3 Revenue Forecast, 2025-2035
- 12.5.4 Volume Forecast, 2025-2035
- 12.5.5 Base-Year Market Share, 2025
- 12.5.6 Segment CAGR and Growth Drivers
- 12.5.7 Subsegment Market Size and Forecast
- 12.5.7.1 Food Processors & Manufacturers
- 12.5.7.2 Modern Retail & Foodservice
- 12.5.7.3 Exporters & Commodity Traders
- 12.5.7.4 Pharma & Healthcare Distributors
- 12.5.7.5 Smallholder Aggregators & Cooperatives
- 12.5.8 Subsegment Pricing and Adoption Trends
- 12.5.9 Leading Suppliers and Competition
- 12.5.10 Regional Demand and Opportunities
- 12.6 By Business Model - Market Size and Forecast, 2025-2035
- 12.6.1 Segment Definition and Scope
- 12.6.2 Historical Market Size, 2018-2025
- 12.6.3 Revenue Forecast, 2025-2035
- 12.6.4 Volume Forecast, 2025-2035
- 12.6.5 Base-Year Market Share, 2025
- 12.6.6 Segment CAGR and Growth Drivers
- 12.6.7 Subsegment Market Size and Forecast
- 12.6.7.1 Integrated 3PL
- 12.6.7.2 Dedicated Contract Logistics
- 12.6.7.3 Shared Cold Storage
- 12.6.7.4 Asset-Light Brokerage
- 12.6.7.5 Pay-per-use Solar Cooling
- 12.6.8 Subsegment Pricing and Adoption Trends
- 12.6.9 Leading Suppliers and Competition
- 12.6.10 Regional Demand and Opportunities
- 12.7 Segment Growth Comparison
- 12.8 Segment Attractiveness and Priority Matrix
Chapter 13 Nigeria Cold Chain & Agro-Logistics End-Use and Application Market Outlook
- 13.1 End-Use Industry and Customer Demand Structure
- 13.2 Leading Applications and Customer Groups
- 13.3 End-Use Market Size, Share and Forecast
- 13.4 Major End-Use Industry Deep Dives
- 13.4.1 Customer Requirements and Use Cases
- 13.4.2 Demand and Replacement Cycles
- 13.4.3 Technical and Regulatory Considerations
- 13.4.4 Purchasing and Procurement Models
- 13.4.5 Leading Vendors and Distribution Channels
- 13.4.6 Forecast and Commercial Opportunities
- 13.5 Emerging Applications and Cross-Segment Demand
- 13.6 End-Use Industry Investment Priorities
Chapter 14 Nigeria Cold Chain & Agro-Logistics Geographic Market Outlook, 2025-2035
- 14.1 Regional Market Size and Country-Level Shares, 2025
- 14.2 Country Market Size Comparison, 2025
- 14.3 Country Market Forecasts, 2025-2035
- 14.4 Subregional Industrial and Demand Clusters
- 14.5 Intra-Regional Pricing and Cost Differences
- 14.6 Cross-Border Trade and Supply Networks
- 14.7 Regional Supply and Demand Balances
- 14.8 Country Opportunity Comparison and Prioritization
Note: Every listed country is covered on the structure shown under the first country.
Chapter 15 Nigeria Cold Chain & Agro-Logistics Technology, Innovation and Sustainability Outlook
- 15.1 Technology Landscape and Maturity
- 15.2 Product, Process and Service Innovation
- 15.3 AI, Automation and Digital Tools in the Industry
- 15.4 Technology Adoption and Performance Benchmarking
- 15.5 Innovation Pipeline and R&D Investment
- 15.6 Patent and Intellectual Property Trends
- 15.7 Energy Efficiency and Resource Management
- 15.8 Sustainability, Recycling and Circularity
- 15.9 Technology Roadmap, 2025-2035
- 15.10 Risks of Obsolescence and Technology Substitution
Chapter 16 Nigeria Cold Chain & Agro-Logistics Market Key Strategic Imperatives
- 16.1 Growth and Market Entry Priorities
- 16.2 High-Return Products and Segments
- 16.3 Pricing, Profitability and Cost Optimization
- 16.4 Technology Investment and Product Differentiation
- 16.5 Supply Chain Localization and Resilience
- 16.6 Distribution and Customer Acquisition
- 16.7 Partnership, Acquisition and Capacity Strategy
- 16.8 Regional Expansion Priorities
- 16.9 Short-, Medium- and Long-Term Actions
Chapter 17 Competition Outlook
- 17.1 Industry Competition Characteristics
- 17.2 Market Structure and Concentration
- 17.3 Market Share and Competitive Positioning, 2025
- 17.4 Company-Wise Revenue and Product Benchmarking
- 17.5 Production and Service Capacity Benchmarking
- 17.6 Technology, Pricing and Differentiation
- 17.7 Regional Footprint and Distribution Strength
- 17.8 Mergers, Acquisitions and Strategic Alliances
- 17.9 New Entrants and Competitive Threats
- 17.10 Porter's Five Forces and Industry Attractiveness
- 17.11 Competitive Outlook, 2025-2035
Chapter 18 Company Profiles
- 18.1 Company Coverage and Selection Criteria
- 18.2 MDS Logistics
- 18.2.1 Business Description
- 18.2.2 Company Ownership and Geographic Presence
- 18.2.3 Product and Service Portfolio
- 18.2.4 Manufacturing and Operating Footprint
- 18.2.5 Production Capacity and Expansion Plans
- 18.2.6 Financial Performance and Investment
- 18.2.7 Market Share and Competitive Position
- 18.2.8 Technology and Innovation Capabilities
- 18.2.9 Strategic Alliances or Partnerships
- 18.2.10 Recent Developments
- 18.2.11 Growth Strategy and Outlook
- 18.3 Maersk Nigeria Ltd.
- 18.4 MSC Nigeria Ltd.
- 18.5 DHL Global Forwarding Nigeria
- 18.6 CMA CGM Nigeria Shipping Limited
- 18.7 Red Star Logistics
- 18.8 Zenith Carex International
- 18.9 ColdHubs Limited
- 18.10 Figorr
- 18.11 Eja-Ice Ltd.
- 18.12 Other Relevant Market Participants
Note: Every listed company is profiled on the structure shown under the first company. The company list is preliminary and may change based on research findings, market developments, data availability and client requirements.
Chapter 19 Disclaimer
- 19.1 Research and Forecast Disclaimer
- 19.2 Data Source and Estimation Limitations
Note: The depth of individual sections depends on data availability for this market. Volume, capacity, trade and other unit-based metrics are included where applicable.

