
Tourism, holiday travel and fleet outsourcing lift hiring
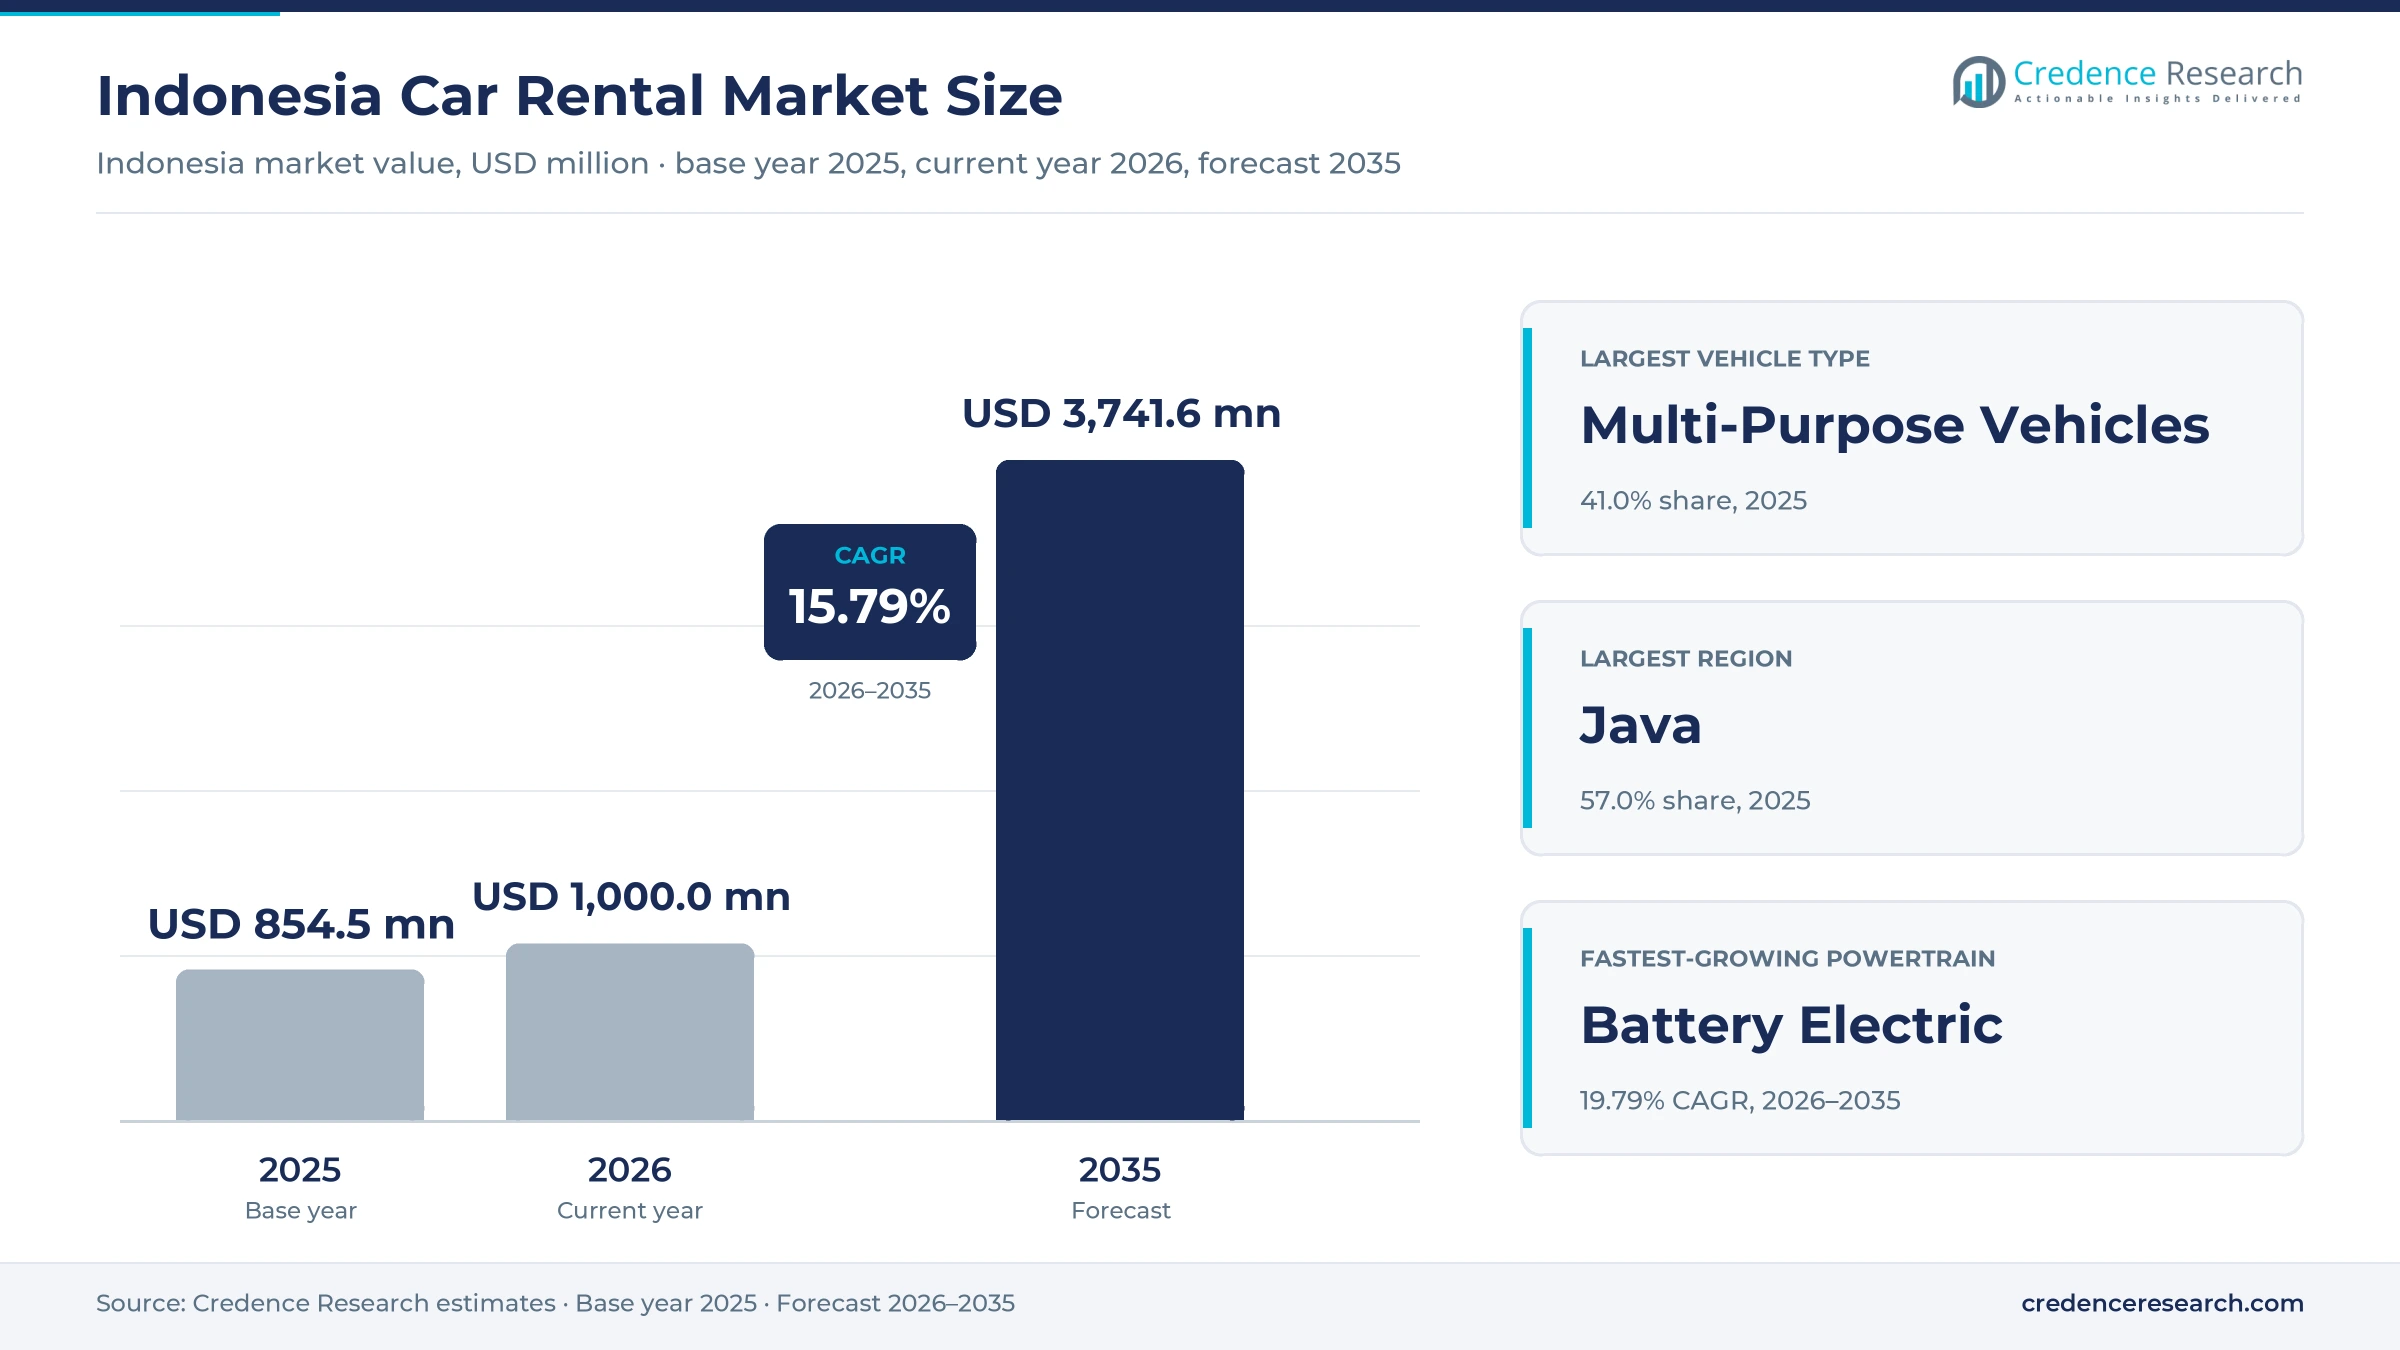
The Indonesia car rental market was valued at USD 854.5 million in 2025 and is projected to increase from USD 1.00 billion in 2026 to USD 3.74 billion by 2035, registering a CAGR of 15.79% during 2026–2035. Demand comes from foreign and domestic tourists, holiday travelers during Lebaran and companies that outsource their fleets instead of owning vehicles. Java held the largest regional share, 57.0% in 2025, because Jakarta, Surabaya and Bandung concentrate corporate head offices, airports and toll road links. Bali and Nusa Tenggara is the fastest-growing region at 17.01% a year, as record foreign arrivals lift self-drive and chauffeur hiring. Multi-purpose vehicles led the fleet mix, while app booking and cashless payment are moving rentals away from counters and phone orders. Electric vehicles are entering rental fleets, supported by a government-borne value-added tax incentive for locally made electric cars in 2025.
Which vehicles and contracts does the vehicle hire estimate cover?
The estimate measures the value of passenger car and light commercial vehicle hire in Indonesia, with or without a driver, for periods from a few hours to multi-year corporate contracts. It covers economy and compact cars, multi-purpose vehicles, sport utility vehicles, premium and luxury cars, and vans and light commercial vehicles. Values are stated in USD million at current prices and include bookings through apps, travel agencies, airport counters and corporate sales teams.
The estimate excludes taxi and ride-hailing trips, motorcycle rental, bus charter, heavy trucks and vehicle sales after lease expiry. It also leaves out financial leasing where the customer takes ownership at the end of the term. The value chain runs from carmakers and financiers through rental operators and their workshop partners to drivers, booking platforms and customers.
Indonesia Car Rental Market Insights
- The Indonesia car rental market was valued at USD 854.5 million in 2025 and is projected to reach USD 3.74 billion by 2035, registering a CAGR of 15.79% during 2026–2035.
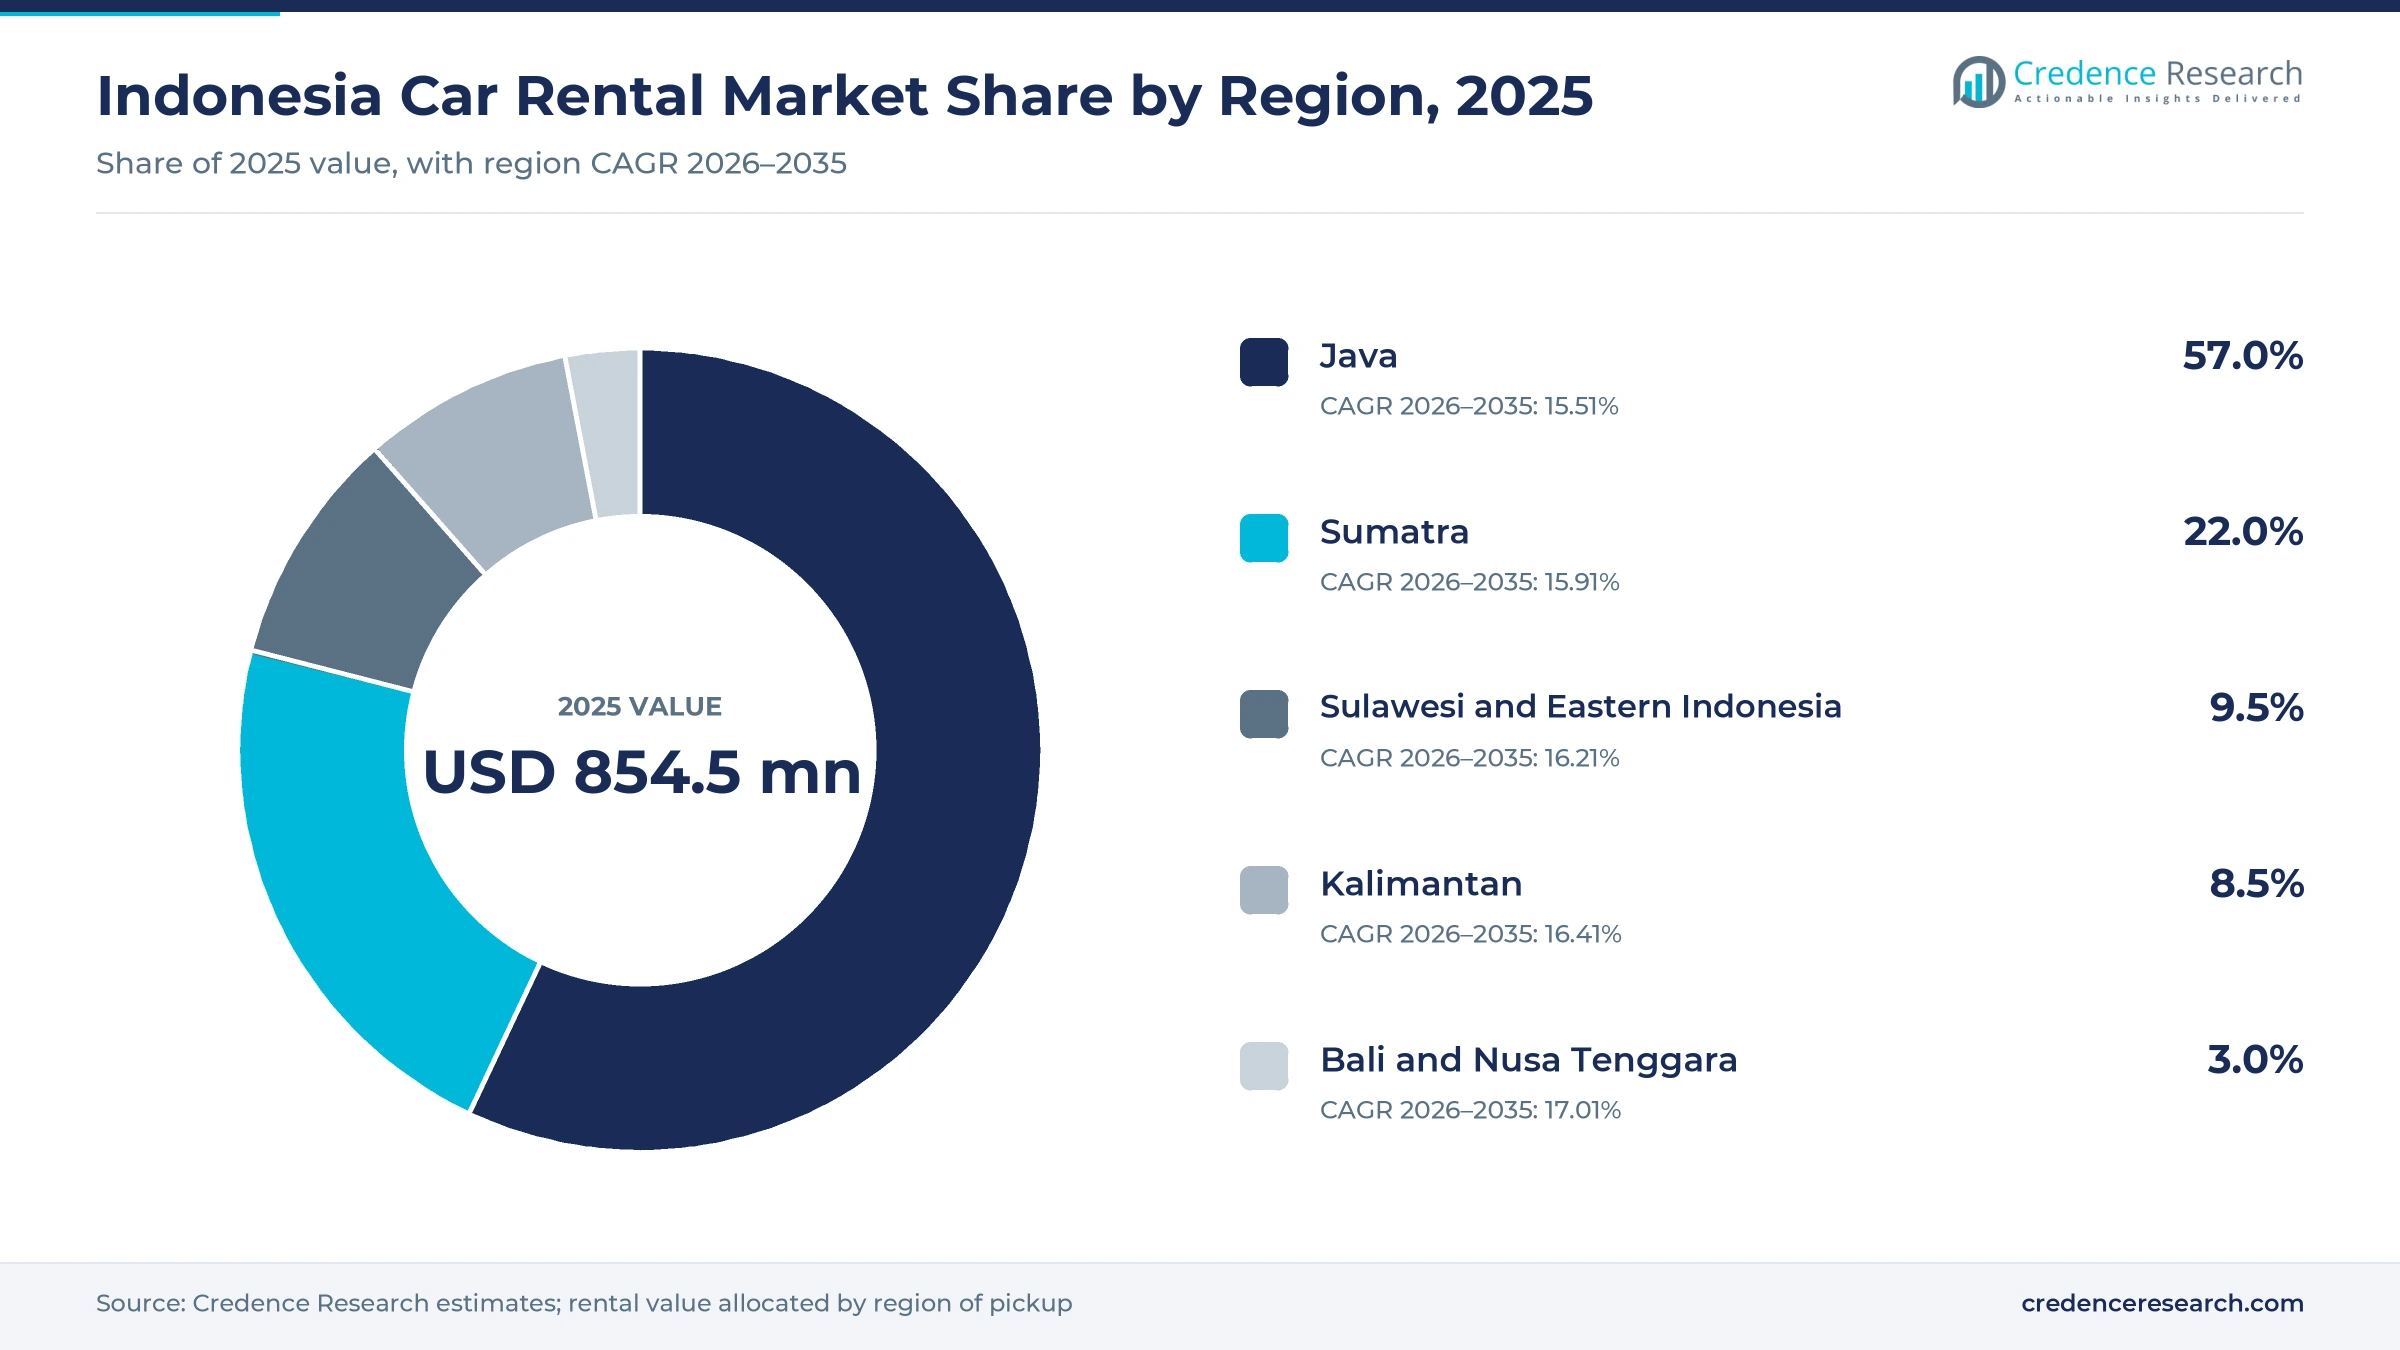
- Java held 57.0% of 2025 rental value, because the island concentrates corporate fleets, main airports and the toll road network used for holiday travel.
- Multi-purpose vehicles led with 41.0% of 2025 value, because family and group travelers prefer seven-seat models such as the Avanza and Innova.
- Foreign tourist arrivals reached 15.39 million in 2025, up 10.80% from 2024, based on Statistics Indonesia figures, which supports airport and resort hiring.
- Adi Sarana Armada secured a Rp 500 billion credit facility in December 2025 to buy new rental units, which signals continued fleet investment.
MPVs lead while battery electric fleets grow fastest
Why do multi-purpose vehicles lead fleet demand?
Based on vehicle type, the market is categorized into economy and compact cars, multi-purpose vehicles, sport utility vehicles, premium and luxury cars, and vans and light commercial vehicles. Multi-Purpose Vehicles led with 41.0% of 2025 value, because seven-seat models carry families and work teams at low cost. Sport Utility Vehicles grow fastest at 16.38% a year, as leisure and corporate users trade up to higher seating positions.
How much do companies and agencies hire?
Based on customer type, the market is categorized into individual leisure travelers, corporate accounts, government and public institutions, and travel trade partners. Corporate Accounts led with 44.0% of 2025 value, because firms outsource staff and operational vehicles under annual contracts. Individual Leisure Travelers grow fastest at 16.36% a year, as tourism and app booking widen self-drive and chauffeur trips.
Which booking channels are gaining share?
Based on sales channel, the market is categorized into direct digital booking, online travel agencies, airport and city counters, corporate direct sales and dealer and partner referrals. Corporate Direct Sales led with 36.0% of 2025 value, because long-term fleet contracts are negotiated by account teams. Direct Digital Booking grows fastest at 16.86% a year, as operator apps offer instant quotes and cashless payment.
How fast are electric vehicles entering rental fleets?
Based on powertrain, the market is categorized into internal combustion engine, hybrid electric and battery electric vehicles. Internal Combustion Engine vehicles led with 86.0% of 2025 value, because petrol and diesel models dominate the existing fleet and refueling is easy nationwide. Battery Electric vehicles grow fastest at 19.79% a year, as tax incentives and corporate sustainability targets bring electric models into fleets.
| Segment Group | Leading Sub-segment | Share, 2025 | Fastest-growing Sub-segment | CAGR, 2026–2035 |
|---|---|---|---|---|
| By Vehicle Type | Multi-Purpose Vehicles | 41.0% | Sport Utility Vehicles | 16.38% |
| By Customer Type | Corporate Accounts | 44.0% | Individual Leisure Travelers | 16.36% |
| By Sales Channel | Corporate Direct Sales | 36.0% | Direct Digital Booking | 16.86% |
| By Powertrain | Internal Combustion Engine | 86.0% | Battery Electric | 19.79% |
Request a Free Sample
Fill in your details and we'll send you a free sample report.
- Sample data tables & charts
- Research methodology
Travel, fleet outsourcing and cashless booking lift hiring
How do tourism recovery and holiday travel lift hiring?
Tourism recovery and intercity holiday travel are the core drivers, because visitors and families hire vehicles when trips involve several stops or large groups. Foreign tourist arrivals reached 15.39 million in 2025, up 10.80% from 2024, and remained close to the 16.1 million recorded in 2019, based on World Bank data. Domestic tourist trips reached 1.02 billion in 2024, up 21.61%, according to Statistics Indonesia. The transport ministry also expected 143.91 million people to travel during Lebaran 2026, with 76.24 million by private car, according to Kontan. As a result, leisure travelers grow at 16.36% a year, the fastest customer rate.
Why does corporate fleet outsourcing widen the contract base?
Corporate fleet outsourcing widens the contract base, because companies prefer to lease vehicles with maintenance and drivers rather than tie up capital in fleet management and vehicle ownership. Adi Sarana Armada operated about 30,000 two-wheel and four-wheel rental units in December 2025 and secured a Rp 500 billion credit facility to buy new fleet, according to Investor Trust. The company set capital spending of Rp 1.5 trillion for 2025 and used Rp 1.04 trillion by September, mostly for new vehicles. MPMRent also manages more than 16,000 active units through 28 offices. In turn, corporate accounts hold 44.0% of 2025 value, supported by annual business contracts that keep utilization high.
How do digital booking and cashless payment raise conversion?
Digital booking and cashless payment raise conversion, because customers can compare vehicles, confirm prices and pay without visiting a counter. QRIS reached 57 million users and 39.3 million merchants in the second quarter of 2025, with transaction volume up 148.50% year on year, according to Media Asuransi News citing Bank Indonesia. Internet penetration also reached 80.66% in 2025, based on the national internet providers association survey. TRAC upgraded its TRACtoGo app in August 2025 to book cars, buses and airport transfers in one place for leisure and business customers. Direct digital booking therefore grows at 16.86% a year, the fastest channel rate through 2035.
Why do tax incentives pull electric models into fleets?
Tax incentives pull electric models into fleets, because lower purchase taxes cut the cost gap with petrol vehicles. In 2025, the government covered 10 percentage points of value-added tax on electric cars with at least 40% local content, so buyers paid only 2%. Bluebird reported that bookings for its e-Goldenbird electric rental service rose 170% in the first quarter of 2025, according to detikFinance, and its electric fleet tripled within a year. In June 2026, MPMRent received its first 50 Wuling BinguoEV Lite units for corporate customers. Battery electric vehicles therefore grow at 19.79% a year, the fastest powertrain rate.
Electric fleets and app booking reshape vehicle hire
How is the shift to electric rental fleets accelerating?
A shift toward electric rental fleets is accelerating, because corporate clients now set emission targets for the vehicles they hire. Battery electric car wholesales reached 23,952 units from January to April 2025, up 209% from 7,745 units a year earlier, based on industry association data. Bluebird offers the Hyundai Ioniq 5, BYD M6, BMW iX and Denza D9 through its premium rental service in 16 cities. MPMRent described its June 2026 Wuling handover as the start of a strategic electric partnership for corporate fleets. As a result, rental firms are adding charging partnerships and training drivers to manage range, while internal combustion engine vehicles still hold 86.0% of value.
Why is the rise of app-based retail rental changing demand?
The rise of app-based retail rental is changing demand, because operators that once served mainly companies now target individual travelers. TRAC expanded into the retail segment in August 2025, offering rentals from four hours to yearly terms with or without a driver. Its fleet uses vehicles less than five years old, and the TRACtoGo app supports both personal and business accounts. Bluebird takes Goldenbird bookings through WhatsApp, call centers, airport and hotel outlets and the MyBluebird app with cashless payment. Goldenbird is available in 16 cities, which shows how far app booking now reaches. In turn, direct digital booking gains share from counters, and leisure renters book shorter, more frequent trips.
Can Bali and eastern tourism open a premium opportunity?
Bali and eastern tourism offer an opening for premium and chauffeur rental, because long-haul visitors spend more and travel between resorts. Bali recorded about 7.05 million foreign air arrivals in 2025, a record high and up 11.3% from 6.33 million in 2024, based on provincial statistics. The region holds only 3.0% of national rental value, which leaves room for formal operators to replace informal drivers. In addition, sustainable tourism programs in Labuan Bajo and Lombok add demand for guided day trips. Premium and luxury cars, together with sport utility vehicles, hold 24% of 2025 value, based on Credence Research estimates.
Is there room for subscription and replacement mobility?
Subscription and replacement mobility offer an opening, because buyers who delay car purchases still need flexible access to vehicles. Car wholesales fell 7.2% to 803,687 units in 2025, while retail sales reached 833,692 units, based on industry association data. Monthly rental and vehicle subscription plans let these households and small firms keep mobility without loans or depreciation risk. MPMRent works with about 1,000 Otoklix workshops and more than 800 partner workshops to service rented cars in remote areas. As a result, operators that combine maintenance, insurance and replacement cars in one monthly fee can win customers away from ownership in larger cities.
Price wars, fleet funding and congestion squeeze margins
How do price wars and informal operators limit margins?
Price wars and informal operators limit margins, because many small rental owners offer cars with drivers through social media at low daily rates. These operators often skip insurance, maintenance records and tax registration, which gives them a cost advantage. As a result, branded firms must match prices during peak seasons. Formal operators respond with newer vehicles, roadside assistance and corporate safety standards that informal rivals cannot offer. Corporate clients that require insured vehicles and trained drivers remain the most loyal base for formal firms.
Why does fleet funding raise financial risk?
Fleet funding raises financial risk, because rental firms must buy vehicles upfront and recover costs over several years. Higher interest rates and weaker resale values for used cars squeeze returns on each unit. In turn, operators delay fleet renewal, which raises maintenance costs and lowers customer satisfaction. Larger groups manage this through bank facilities, auction channels for used vehicles and long contracts that lock in utilization. Strong regional demand for pre-owned vehicles helps operators recover value when they retire fleet units.
How do congestion and peak seasons strain operations?
Congestion and peak seasons strain operations, because demand surges during Lebaran and year-end holidays while toll roads and cities jam. Operators must hold extra vehicles for a few peak weeks and then manage idle fleets for the rest of the year. As a result, utilization swings widely and driver availability becomes tight. Firms respond with dynamic pricing, advance booking discounts and partnerships with smaller operators during peaks, which spreads demand across more vehicles and drivers.
Why does charging infrastructure slow electric rental?
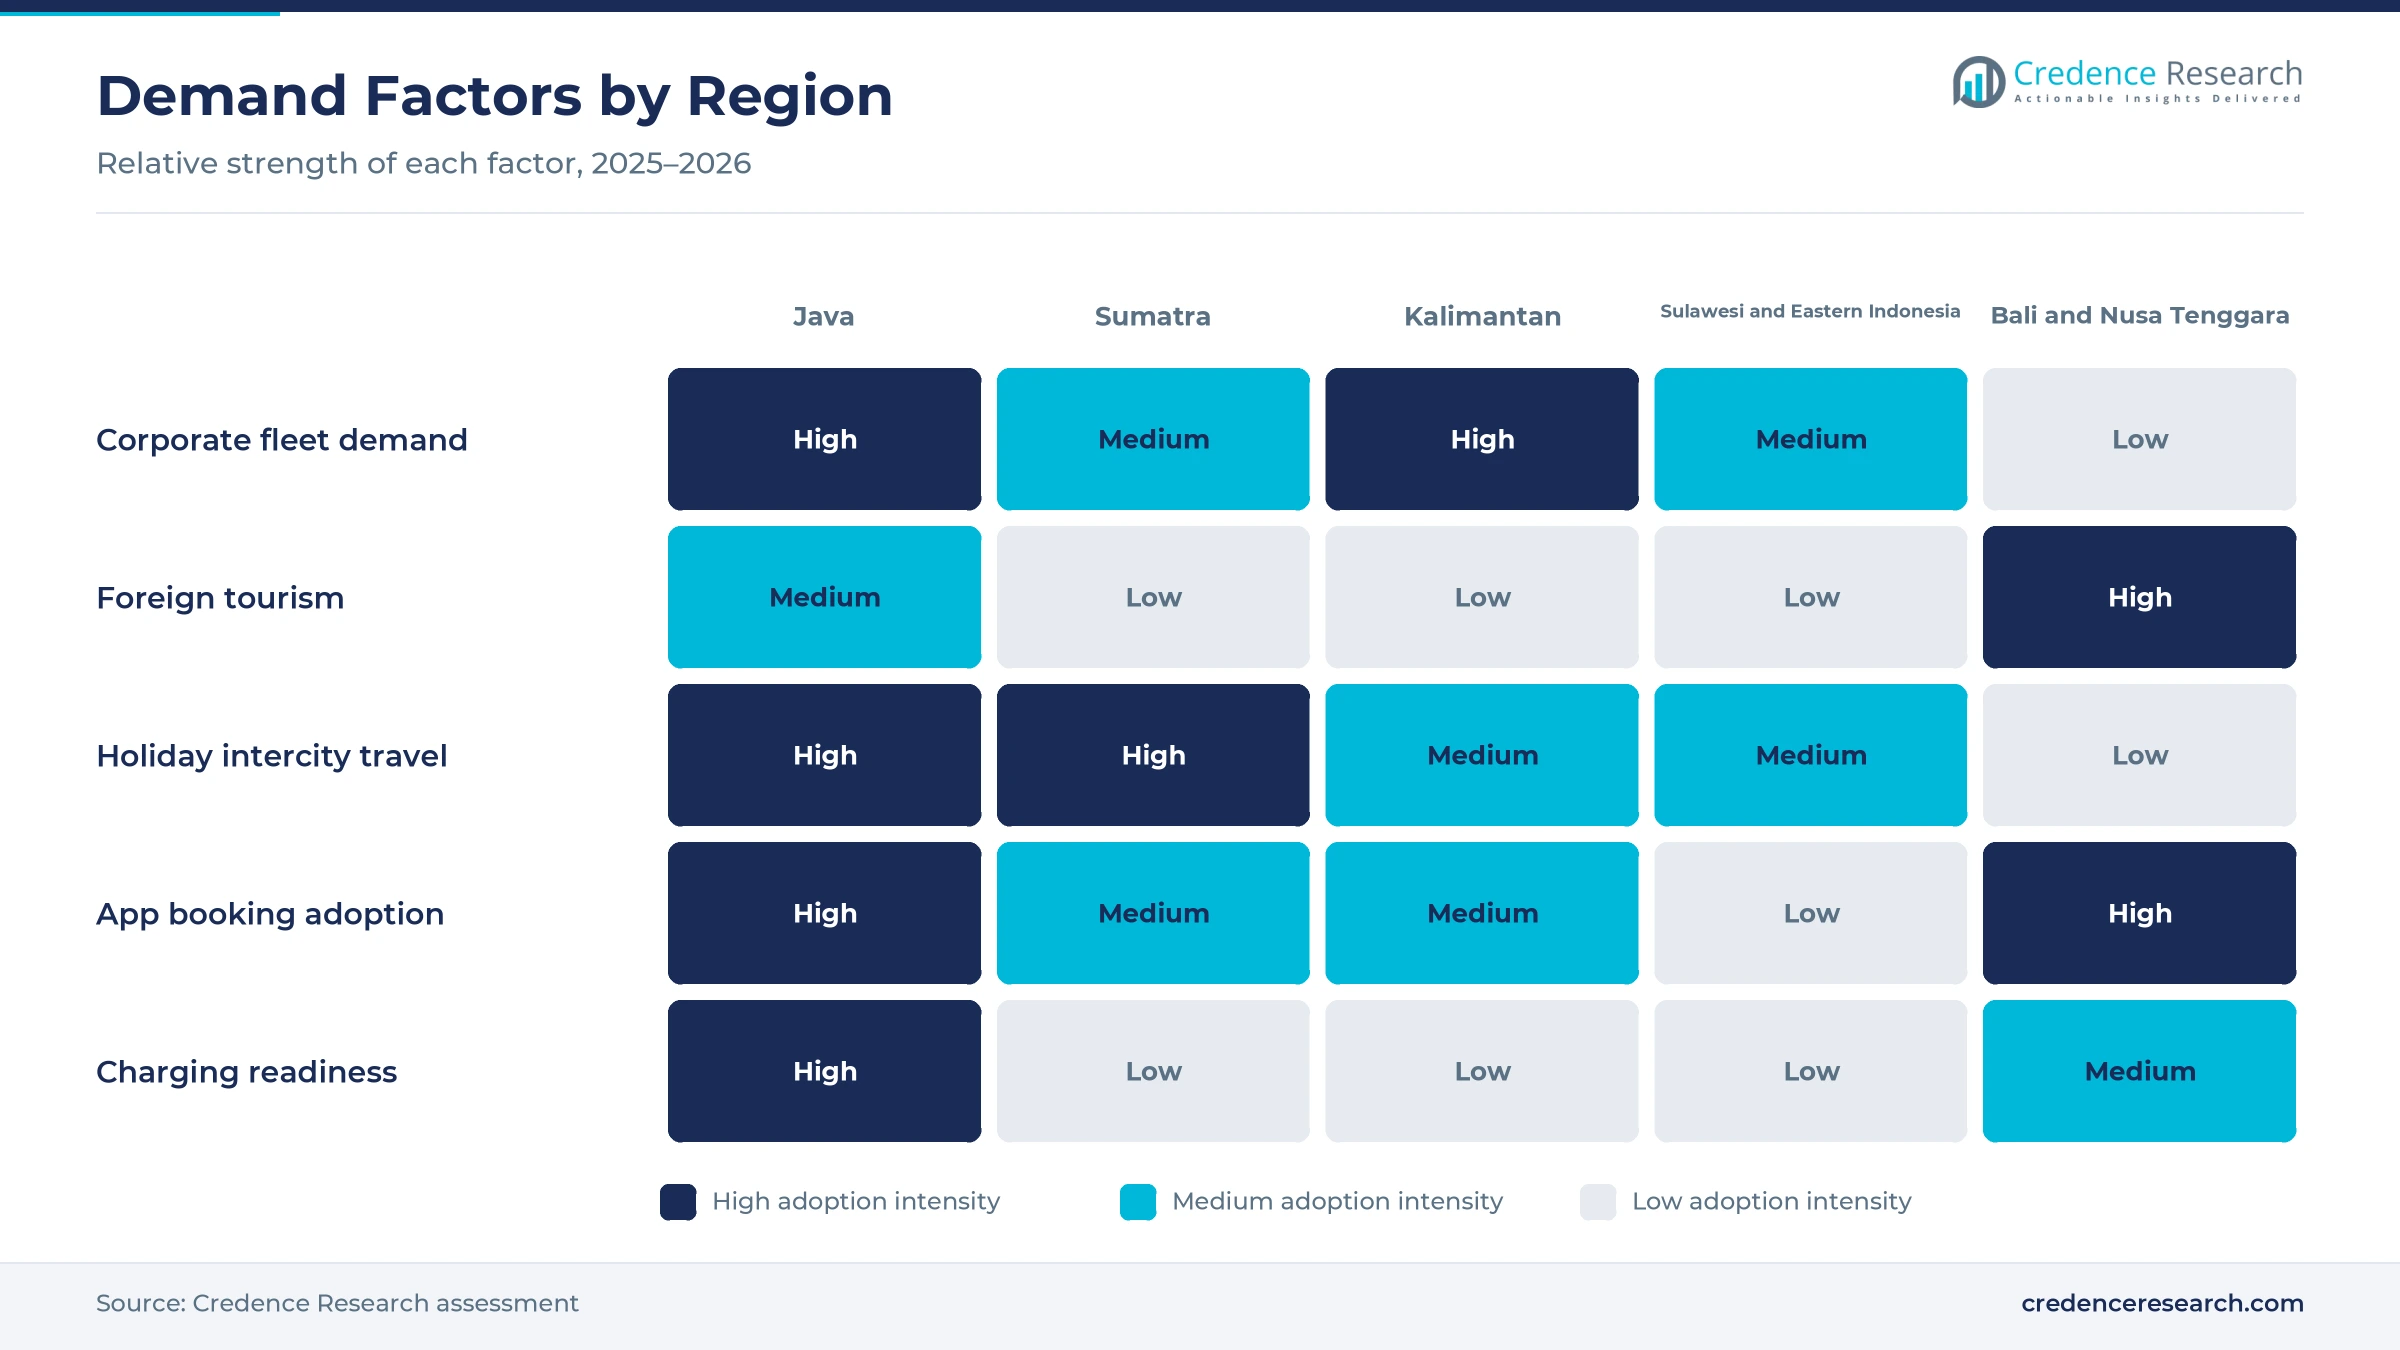
Charging infrastructure slows electric rental, because public chargers remain concentrated in Jakarta, Bali and major Java cities. Renters fear running out of charge on intercity trips, which limits electric cars to city use and airport transfers. In turn, operators must plan routes and charging stops for customers. Many firms therefore deploy electric vehicles first for corporate clients with fixed routes and depot charging, where vehicles return to base each night.
Java leads while Bali and Nusa Tenggara grow fastest
| Region | Value, 2025 (USD million) | Share, 2025 | CAGR, 2026–2035 |
|---|---|---|---|
| Java | 487.1 | 57.0% | 15.51% |
| Sumatra | 188.0 | 22.0% | 15.91% |
| Sulawesi and Eastern Indonesia | 81.2 | 9.5% | 16.21% |
| Kalimantan | 72.6 | 8.5% | 16.41% |
| Bali and Nusa Tenggara | 25.6 | 3.0% | 17.01% |
Why does Java hold the largest share?
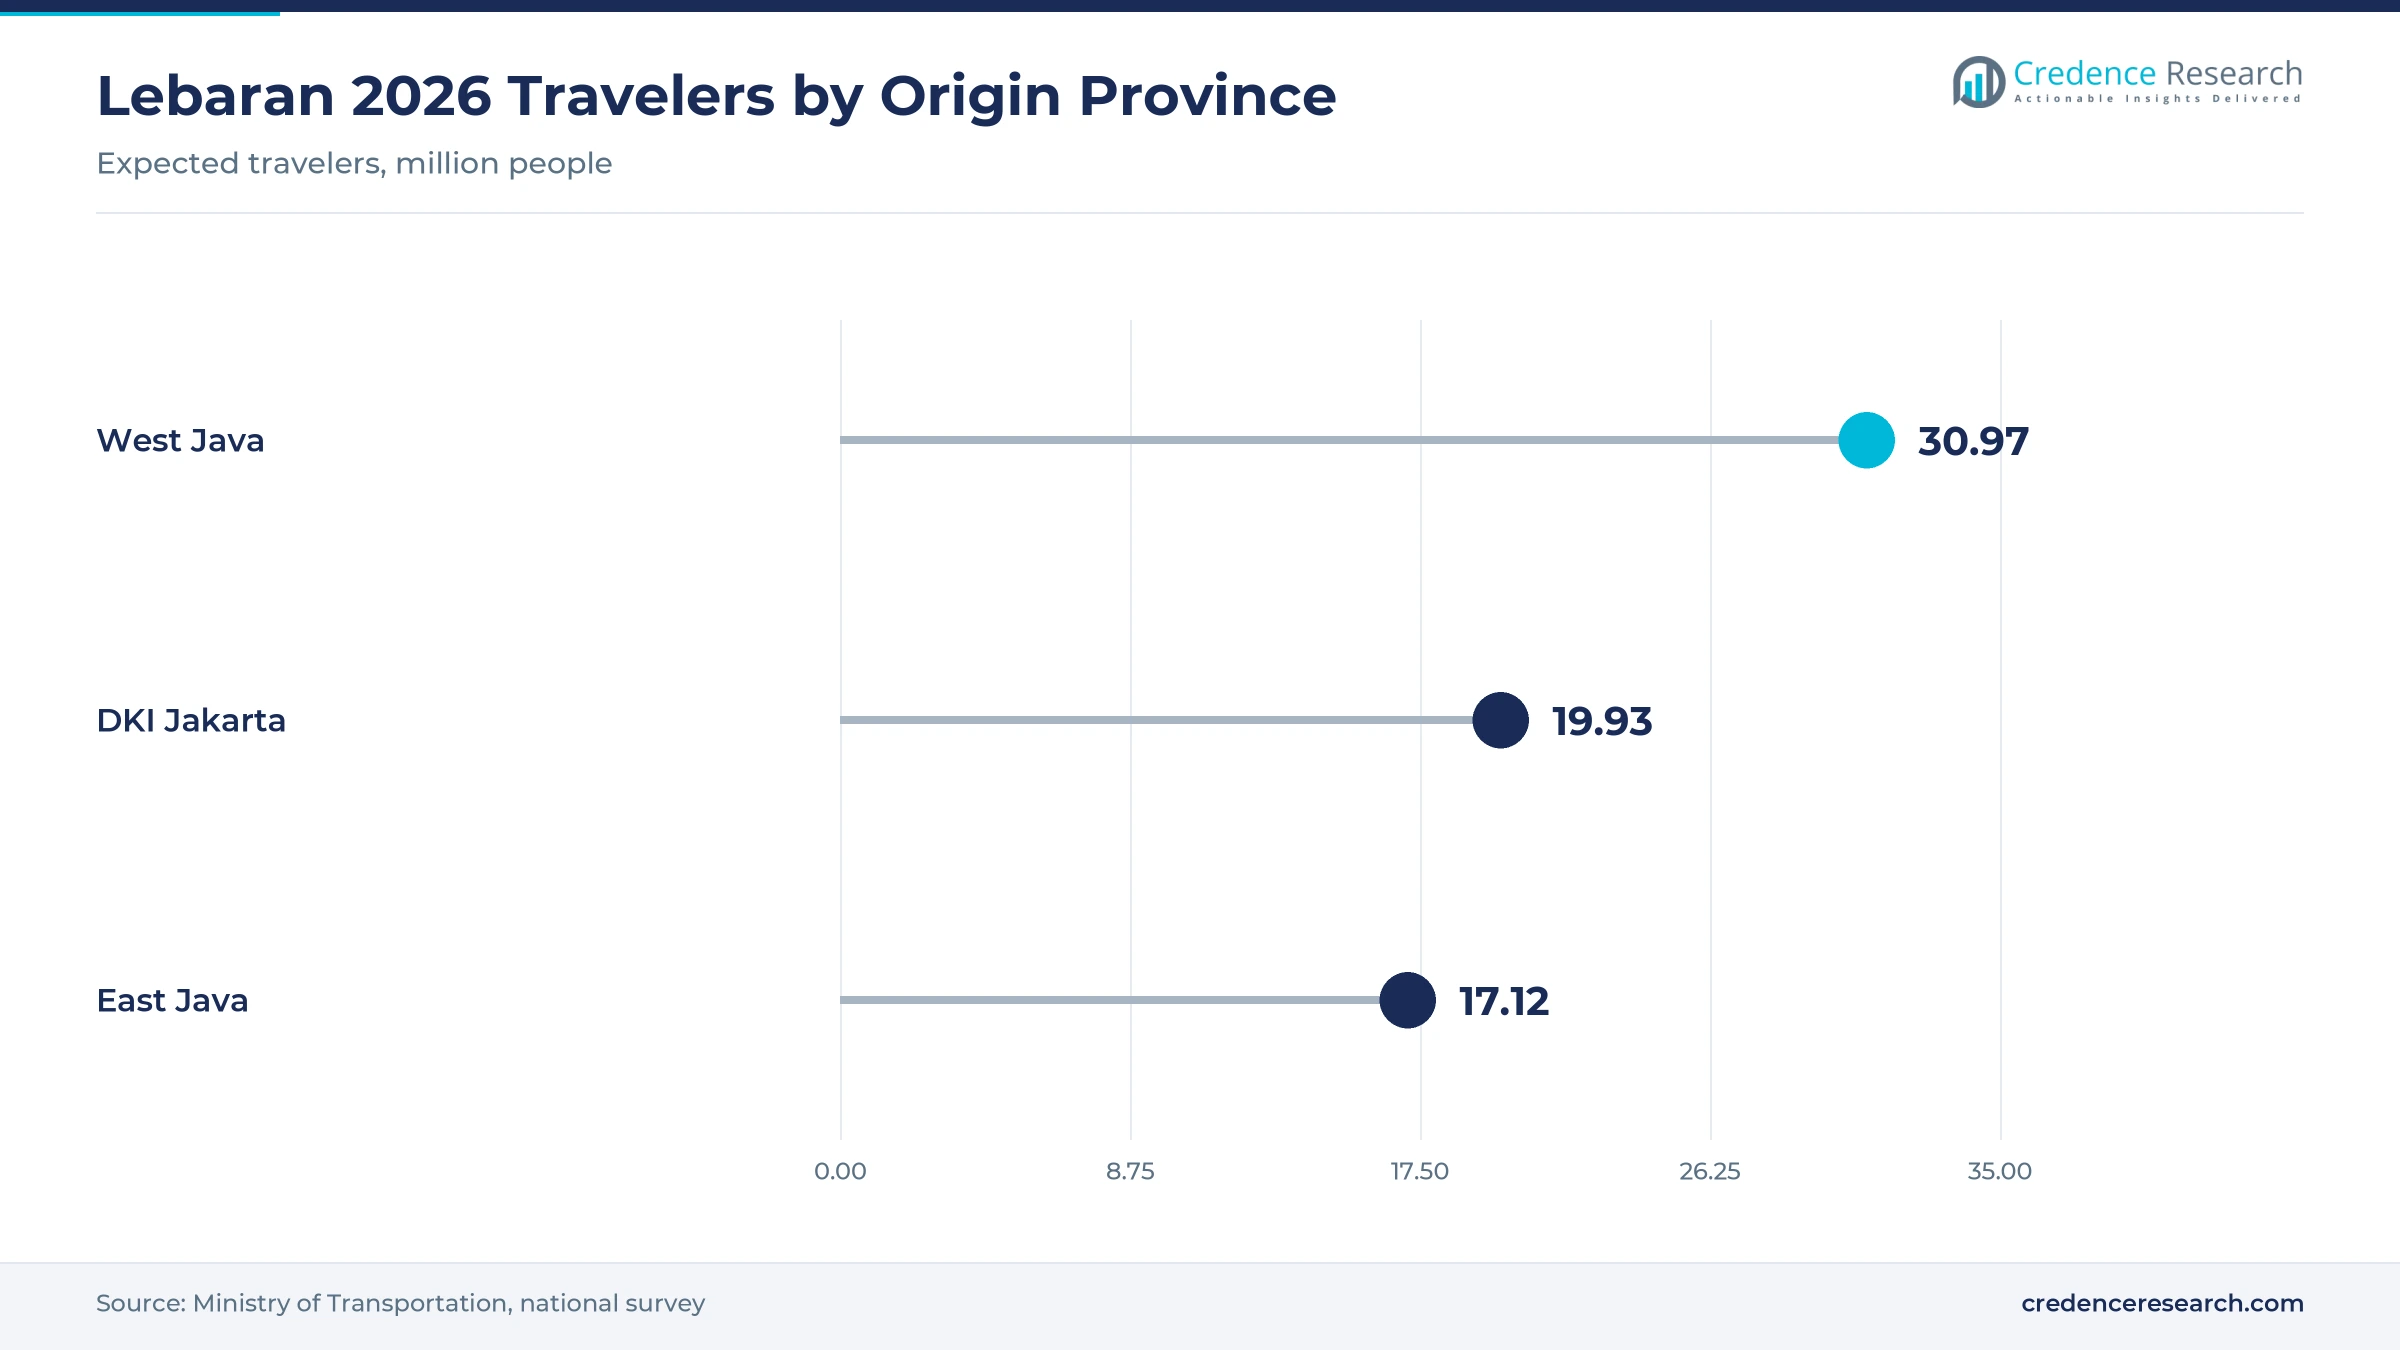
Java held 57.0% of 2025 value and grows at 15.51% a year, because Jakarta, Surabaya, Bandung and Semarang host most corporate head offices and main airports. West Java, Jakarta and East Java were the three largest origins of Lebaran 2026 travelers, with 30.97 million, 19.93 million and 17.12 million people. In turn, corporate contracts and holiday rentals keep fleets busy, although growth slows as the base matures and companies already outsource most vehicles. Airport transfers at Soekarno-Hatta and Juanda also add steady short-term demand throughout the year.
How does Sumatra combine plantation and tourism demand?
Sumatra held 22.0% of 2025 value and grows at 15.91% a year, because plantation, mining and energy firms lease vehicles for staff in Medan, Pekanbaru and Palembang. The Trans-Sumatra toll road also shortens intercity trips, which supports self-drive rentals between provinces. Lake Toba and Bukittinggi tourism adds leisure hiring, while long distances between cities favor multi-purpose and sport utility vehicles with drivers. Holiday travel to and from Java also adds seasonal demand at Sumatran airports and ferry ports.
What drives demand in Sulawesi and Eastern Indonesia?
Sulawesi and Eastern Indonesia held 9.5% of 2025 value and grows at 16.21% a year, because nickel processing parks and mining sites need staff and service vehicles. Makassar acts as the main hub for corporate fleets in the east. However, limited road networks and fewer branded operators keep rentals concentrated in city centers and industrial estates, where operators serve project contracts. Formal firms that open branches near industrial parks can capture long-term demand from processing and construction companies.
How does Kalimantan support corporate fleets?
Kalimantan held 8.5% of 2025 value and grows at 16.41% a year, because coal, palm oil and new capital projects require four-wheel-drive and pickup vehicles. Balikpapan and Samarinda host many contractors that lease vehicles for site work. As a result, light commercial vehicles and sport utility vehicles make up a large part of fleets in the region.
Why are Bali and Nusa Tenggara growing fastest?
Bali and Nusa Tenggara held 3.0% of 2025 value and grows fastest at 17.01% a year, because record foreign arrivals and new destinations such as Labuan Bajo lift self-drive and chauffeur demand. Many trips are still booked through informal drivers, which leaves room for formal operators with apps and insurance.
Fleet funding, EV deals and app upgrades marked 2025
| Development | Status and market relevance |
|---|---|
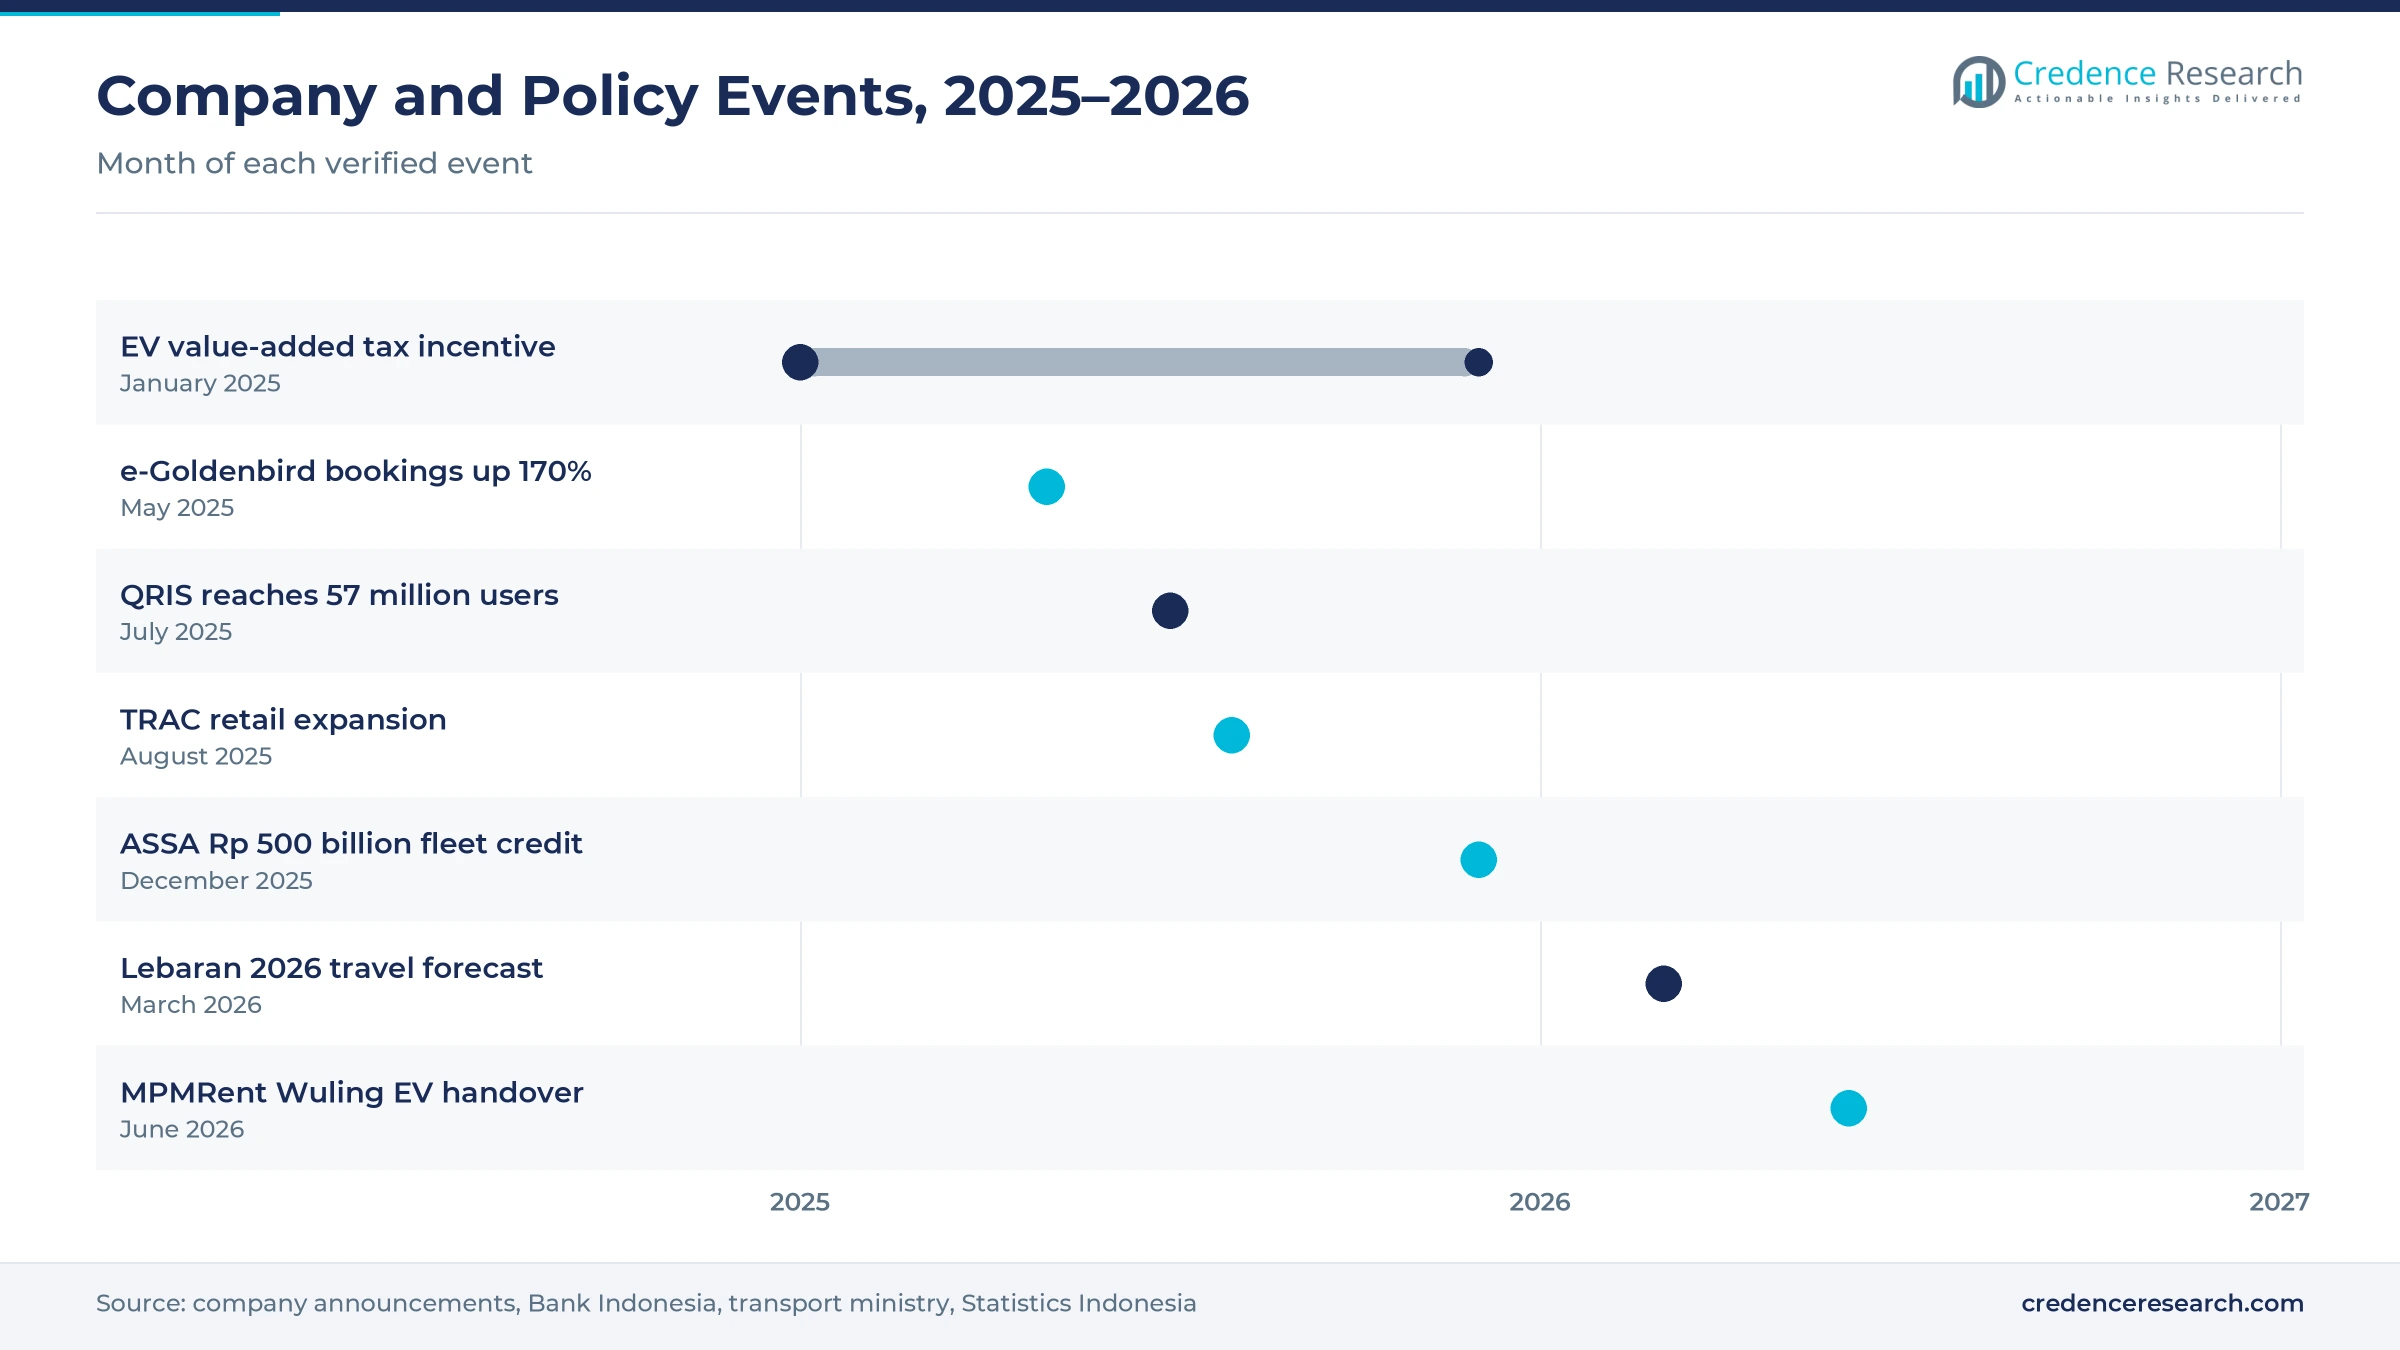
| In May 2025, Bluebird reported that bookings for its e-Goldenbird electric rental service rose 170% in the first quarter. | Shows rising leisure and corporate interest in electric rental cars |
| In August 2025, TRAC expanded into retail car rental and upgraded its TRACtoGo booking app. | Moves a corporate-focused operator toward individual travelers |
| In December 2025, Adi Sarana Armada secured a Rp 500 billion credit facility from QNB Indonesia to buy new rental vehicles. | Supports fleet renewal for corporate and logistics customers |
| In March 2026, the transport ministry expected 143.91 million people to travel during Lebaran, with 76.24 million by private car. | Signals peak holiday demand for self-drive and chauffeur rentals |
| In June 2026, MPMRent received its first 50 Wuling BinguoEV Lite electric cars for corporate customers. | Starts a strategic electric fleet partnership with Wuling Motors |
Booking apps, telematics and electric fleets spread
- Booking apps such as TRACtoGo and MyBluebird let customers book, pay and contact assistance in one place, which cuts counter costs.
- Telematics and fleet tracking show vehicle location, fuel use and service status, which helps corporate clients manage leased fleets remotely.
- Cashless payment through QRIS, cards and e-wallets speeds deposits and refunds, which reduces cash handling at airports and branches.
- Electric fleet management uses charge scheduling and route planning, which lets operators deploy electric cars on fixed corporate routes.
Need a Custom Version of This Report?
Tailor the scope, geography, or segments to your exact requirements.
- Custom geography or segment scope
- Direct access to our analyst team
Group-backed operators lead a fragmented field
Competition is led by operators backed by large automotive and transport groups, while many small local firms serve tourists and short-term renters. TRAC, part of the Astra group, offers rentals from four hours to yearly contracts with or without drivers and expanded into retail in 2025. Bluebird runs Goldenbird premium rental in 16 cities and has added electric models such as the Ioniq 5 and Denza D9. Adi Sarana Armada operates about 30,000 units and focuses on corporate and logistics contracts, while MPMRent manages more than 16,000 active units and began adding Wuling electric cars in 2026. Rivals compete on fleet age, contract pricing, driver quality, branch coverage, app features and maintenance networks. Access to bank funding and used-vehicle resale channels decides who can expand fleets fastest, which favors group-backed operators.
Companies profiled and their roles in this market
| Company | Type | Role in the market |
|---|---|---|
| TRAC Astra Rent A Car | Group-backed operator | Astra unit offering self-drive, chauffeur, bus and corporate rental with the TRACtoGo app |
| Bluebird Group | Transport group | Runs Goldenbird premium rental in 16 cities with a growing electric fleet |
| ASSA Rent | Listed rental operator | Adi Sarana Armada unit with about 30,000 units serving corporate and logistics clients |
| MPMRent | Rental operator | Manages more than 16,000 active units through 28 offices and added Wuling EVs in 2026 |
Credence Research view on fleet scale and pricing
Credence Research's view is that Indonesia's car rental demand will grow quickly because tourism, holiday travel and corporate outsourcing all point in the same direction. Group-backed operators with bank funding can renew fleets and add electric models, while apps and cashless payment widen access for individual travelers. However, informal competition, peak-season swings and charging gaps will keep margins under pressure. Operators that pair corporate contracts with strong retail apps and Bali coverage should gain share fastest through 2035.
How the Indonesia vehicle hire estimate was built
The report uses 2025 as the base year on a calendar basis, and market values come from the Credence Research model. That model combines tourism arrivals from Statistics Indonesia and World Bank data, transport ministry travel surveys, company disclosures on fleet sizes, and typical rental rates by vehicle type. Segment and regional splits are Credence Research estimates, with regional shares set by the client and growth tilts based on tourism and business trends. Sources used are government releases, company announcements, industry news and statistical databases, and no interviews or surveys were used.
Corporate contracts and leisure trips carry growth
Car rental value is expected to reach USD 3.74 billion by 2035, a 15.79% CAGR during 2026–2035, as tourism, holiday travel and fleet outsourcing expand together. Growth should stay strongest through 2029 while foreign arrivals pass earlier peaks and app booking spreads to smaller cities. After that, electric fleets, subscription plans and corporate renewals will carry growth as leisure rates mature in Java. Faster charging rollout would lift this outlook, while weaker tourism or tighter credit would lower it.
Frequently Asked Questions
How big is the Indonesia car rental market?
Which vehicle type leads car rental in Indonesia?
Which region leads the Indonesia car rental market?
Which customer type rents the most vehicles?
What drives car rental demand in Indonesia?
How fast are electric cars entering rental fleets?
Who are the leading car rental companies in Indonesia?
What are the main challenges for car rental operators?
Table of Content
Chapter 1 Market Segmentation
- 1.1 Segmentation Framework
- 1.1.1 Product and Service Classification
- 1.1.2 Application and End-Use Classification
- 1.1.3 Technology and Solution Classification
- 1.1.4 Customer and Distribution Channel Classification
- 1.1.5 Geographic Segmentation
- 1.1.6 Market Segment Definitions and Boundaries
- 1.2 By Vehicle Type
- 1.2.1 Economy and Compact Cars
- 1.2.2 Multi-Purpose Vehicles
- 1.2.3 Sport Utility Vehicles
- 1.2.4 Premium and Luxury Cars
- 1.2.5 Vans and Light Commercial Vehicles
- 1.3 By Customer Type
- 1.3.1 Individual Leisure Travelers
- 1.3.2 Corporate Accounts
- 1.3.3 Government and Public Institutions
- 1.3.4 Travel Trade Partners
- 1.4 By Sales Channel
- 1.4.1 Direct Digital Booking
- 1.4.2 Online Travel Agencies
- 1.4.3 Airport and City Counters
- 1.4.4 Corporate Direct Sales
- 1.4.5 Dealer and Partner Referrals
- 1.5 By Powertrain
- 1.5.1 Internal Combustion Engine
- 1.5.2 Hybrid Electric
- 1.5.3 Battery Electric
Chapter 2 Introduction
- 2.1 Report Objectives and Scope
- 2.2 Product Definition and Industry Terminology
- 2.3 Market Inclusions and Exclusions
- 2.4 Research Process
- 2.4.1 Primary Research and Expert Interviews
- 2.4.2 Secondary Research and Source Review
- 2.4.3 Top-Down and Bottom-Up Estimation
- 2.4.4 Data Triangulation and Verification
- 2.5 Market Size Measurement Basis
- 2.5.1 2025: USD 854.5 million → 2035: USD 3.74 billion
- 2.6 Historical and Forecast Reference Periods
- 2.6.1 Historical Period: 2018-2025
- 2.6.2 Base Year: 2025
- 2.6.3 Forecast Period: 2025-2035
- 2.7 Research Assumptions and Limitations
Chapter 3 Executive Summary
- 3.1 Market Snapshot and Key Findings
- 3.2 Base-Year Market Size, 2025
- 3.3 Forecast Market Size, 2035
- 3.4 Revenue and Volume Growth Outlook
- 3.5 Key Demand and Supply Indicators
- 3.6 Leading Market Segments
- 3.7 Fastest-Growing Market Opportunities
- 3.8 Regional Performance Highlights
- 3.9 Technology and Industry Transformation
- 3.10 Competitive Landscape Summary
- 3.11 Analyst View and Strategic Implications
Chapter 4 Indonesia Car Rental Market Trends and Developments
- 4.1 Historical Industry Development, 2018-2025
- 4.2 Recent Market Trends and Developments
- 4.3 Demand and Customer Behavior Trends
- 4.4 Technology and Product Innovation
- 4.5 Artificial Intelligence, Automation and Digitalization
- 4.6 Local Manufacturing and Supply Chain Realignment
- 4.7 Industry Partnerships, Mergers and Acquisitions
- 4.8 Sustainability and Circular Economy Developments
- 4.9 Government and Private Sector Investment Trends
- 4.10 Emerging Business Models and Commercialization
- 4.11 Industry Developments and Announcements
Chapter 5 Indonesia Car Rental Market Production, Supply and Demand Analysis
- 5.1 Demand Trend and Consumption Analysis, 2018-2025
- 5.2 Demand Forecast, 2025-2035
- 5.3 Production and Output Trend, 2018-2025
- 5.4 Production and Output Forecast, 2025-2035
- 5.5 Installed Capacity and Capacity Utilization
- 5.6 Company-Wise Production Plants and Statistics
- 5.6.1 Installed Production Capacity
- 5.6.2 Actual Production
- 5.6.3 Planned Capacity and Expansion Targets
- 5.7 Supply Chain Structure and Procurement Trends
- 5.8 Supply-Demand Gap and Bottlenecks
- 5.9 Import Dependence and Sourcing Structure
- 5.10 Contract Manufacturing and Outsourcing
- 5.11 Regional Supply and Demand Concentration
Chapter 6 Indonesia Car Rental Market Pricing Analysis
- 6.1 Pricing Structure and Measurement
- 6.2 Historical Pricing Trends, 2018-2025
- 6.3 Pricing Outlook, 2025-2035
- 6.4 Average Selling Price and Unit Economics
- 6.5 Pricing by Product and Market Segment
- 6.6 Geographic Pricing Differences
- 6.7 Key Input, Energy, Labor and Logistics Costs
- 6.8 Contract Pricing and Purchasing Models
- 6.9 Pricing Sensitivity and Competitive Positioning
- 6.10 Price, Margin and Profitability Implications
Chapter 7 Indonesia Car Rental Market Dynamics
- 7.1 Market Growth Drivers
- 7.1.1 Demand-Side Drivers
- 7.1.2 Technology and Innovation Drivers
- 7.1.3 Infrastructure and Investment Drivers
- 7.1.4 Regulatory and Policy Drivers
- 7.2 Market Restraints
- 7.2.1 Cost and Affordability Constraints
- 7.2.2 Technology and Adoption Barriers
- 7.2.3 Supply Chain and Operational Constraints
- 7.3 Market Challenges
- 7.3.1 Competitive Pressure and Margin Erosion
- 7.3.2 Skills, Infrastructure and Implementation Gaps
- 7.4 Emerging Market Opportunities
- 7.5 Market Dynamics Impact and Time-Horizon Assessment
Chapter 8 Indonesia Car Rental Value Chain Analysis
- 8.1 Industry Value Chain Overview
- 8.2 Upstream Suppliers and Critical Inputs
- 8.3 Technology and Component Providers
- 8.4 Manufacturing or Service Delivery
- 8.5 Distribution, Channel Partners and Integrators
- 8.6 Downstream Applications and End Users
- 8.7 Value Addition and Profit Pools
- 8.8 Vertical Integration and Outsourcing
- 8.9 Supplier Concentration and Risk
- 8.10 Supply Chain Localization and Resilience
Chapter 9 Indonesia Car Rental Market Regulations and Policies
- 9.1 Relevant Laws, Standards and Compliance Frameworks
- 9.2 Product, Service, Safety and Quality Requirements
- 9.3 Government Policies, Incentives and Subsidies
- 9.4 Imports, Exports and Trade Barriers
- 9.5 Public Procurement and Local Content Requirements
- 9.6 Environmental and Sustainability Compliance
- 9.7 Upcoming Policy Changes and Market Implications
Chapter 10 Indonesia Car Rental Market Hotspots and Opportunities
- 10.1 Market Opportunity Mapping and Growth Hotspots
- 10.2 High-Growth Applications and Customer Groups
- 10.3 Underserved Markets and White-Space Opportunities
- 10.4 Emerging Technology and Product Opportunities
- 10.5 New Capacity and Investment Hotspots
- 10.6 Market Entry and Expansion Opportunities
- 10.7 Distribution and Partnership Opportunities
- 10.8 Near-Term and Long-Term Commercial Potential
- 10.9 Opportunity Attractiveness and Execution Risks
Chapter 11 Indonesia Car Rental Market Outlook, 2025-2035
- 11.1 Market Size and Analysis
- 11.1.1 Revenue (Market Measurement: 2025: USD 854.5 million → 2035: USD 3.74 billion)
- 11.1.2 Market Volume and Quantity Sold
- 11.1.3 Historical Market Size, 2018-2025
- 11.1.4 Base-Year Market Size, 2025
- 11.2 Market Forecast, 2025-2035
- 11.2.1 Revenue Forecast to 2035
- 11.2.2 Volume Forecast to 2035
- 11.2.3 CAGR and Year-on-Year Growth
- 11.2.4 Incremental Revenue Opportunity
- 11.3 Forecast Assumptions and Scenario Analysis
- 11.3.1 Base-Case Forecast
- 11.3.2 Optimistic and Conservative Scenarios
- 11.3.3 Technology, Pricing and Policy Sensitivities
- 11.4 Market Attractiveness and Growth Outlook
Chapter 12 Indonesia Car Rental Market Segmentation and Outlook
- 12.1 Segmentation Summary and Market Shares, 2025
- 12.2 Largest and Fastest-Growing Segments
- 12.3 By Vehicle Type - Market Size and Forecast, 2025-2035
- 12.3.1 Segment Definition and Scope
- 12.3.2 Historical Market Size, 2018-2025
- 12.3.3 Revenue Forecast, 2025-2035
- 12.3.4 Volume Forecast, 2025-2035
- 12.3.5 Base-Year Market Share, 2025
- 12.3.6 Segment CAGR and Growth Drivers
- 12.3.7 Subsegment Market Size and Forecast
- 12.3.7.1 Economy and Compact Cars
- 12.3.7.2 Multi-Purpose Vehicles
- 12.3.7.3 Sport Utility Vehicles
- 12.3.7.4 Premium and Luxury Cars
- 12.3.7.5 Vans and Light Commercial Vehicles
- 12.3.8 Subsegment Pricing and Adoption Trends
- 12.3.9 Leading Suppliers and Competition
- 12.3.10 Regional Demand and Opportunities
- 12.4 By Customer Type - Market Size and Forecast, 2025-2035
- 12.4.1 Segment Definition and Scope
- 12.4.2 Historical Market Size, 2018-2025
- 12.4.3 Revenue Forecast, 2025-2035
- 12.4.4 Volume Forecast, 2025-2035
- 12.4.5 Base-Year Market Share, 2025
- 12.4.6 Segment CAGR and Growth Drivers
- 12.4.7 Subsegment Market Size and Forecast
- 12.4.7.1 Individual Leisure Travelers
- 12.4.7.2 Corporate Accounts
- 12.4.7.3 Government and Public Institutions
- 12.4.7.4 Travel Trade Partners
- 12.4.8 Subsegment Pricing and Adoption Trends
- 12.4.9 Leading Suppliers and Competition
- 12.4.10 Regional Demand and Opportunities
- 12.5 By Sales Channel - Market Size and Forecast, 2025-2035
- 12.5.1 Segment Definition and Scope
- 12.5.2 Historical Market Size, 2018-2025
- 12.5.3 Revenue Forecast, 2025-2035
- 12.5.4 Volume Forecast, 2025-2035
- 12.5.5 Base-Year Market Share, 2025
- 12.5.6 Segment CAGR and Growth Drivers
- 12.5.7 Subsegment Market Size and Forecast
- 12.5.7.1 Direct Digital Booking
- 12.5.7.2 Online Travel Agencies
- 12.5.7.3 Airport and City Counters
- 12.5.7.4 Corporate Direct Sales
- 12.5.7.5 Dealer and Partner Referrals
- 12.5.8 Subsegment Pricing and Adoption Trends
- 12.5.9 Leading Suppliers and Competition
- 12.5.10 Regional Demand and Opportunities
- 12.6 By Powertrain - Market Size and Forecast, 2025-2035
- 12.6.1 Segment Definition and Scope
- 12.6.2 Historical Market Size, 2018-2025
- 12.6.3 Revenue Forecast, 2025-2035
- 12.6.4 Volume Forecast, 2025-2035
- 12.6.5 Base-Year Market Share, 2025
- 12.6.6 Segment CAGR and Growth Drivers
- 12.6.7 Subsegment Market Size and Forecast
- 12.6.7.1 Internal Combustion Engine
- 12.6.7.2 Hybrid Electric
- 12.6.7.3 Battery Electric
- 12.6.8 Subsegment Pricing and Adoption Trends
- 12.6.9 Leading Suppliers and Competition
- 12.6.10 Regional Demand and Opportunities
- 12.7 Segment Growth Comparison
- 12.8 Segment Attractiveness and Priority Matrix
Chapter 13 Indonesia Car Rental End-Use and Application Market Outlook
- 13.1 End-Use Industry and Customer Demand Structure
- 13.2 Leading Applications and Customer Groups
- 13.3 End-Use Market Size, Share and Forecast
- 13.4 Major End-Use Industry Deep Dives
- 13.4.1 Customer Requirements and Use Cases
- 13.4.2 Demand and Replacement Cycles
- 13.4.3 Technical and Regulatory Considerations
- 13.4.4 Purchasing and Procurement Models
- 13.4.5 Leading Vendors and Distribution Channels
- 13.4.6 Forecast and Commercial Opportunities
- 13.5 Emerging Applications and Cross-Segment Demand
- 13.6 End-Use Industry Investment Priorities
Chapter 14 Indonesia Car Rental Geographic Market Outlook, 2025-2035
- 14.1 Regional Market Size and Country-Level Shares, 2025
- 14.2 Country Market Size Comparison, 2025
- 14.3 Country Market Forecasts, 2025-2035
- 14.4 Subregional Industrial and Demand Clusters
- 14.5 Intra-Regional Pricing and Cost Differences
- 14.6 Cross-Border Trade and Supply Networks
- 14.7 Regional Supply and Demand Balances
- 14.8 Country Opportunity Comparison and Prioritization
Note: Every listed country is covered on the structure shown under the first country.
Chapter 15 Indonesia Car Rental Technology, Innovation and Sustainability Outlook
- 15.1 Technology Landscape and Maturity
- 15.2 Product, Process and Service Innovation
- 15.3 AI, Automation and Digital Tools in the Industry
- 15.4 Technology Adoption and Performance Benchmarking
- 15.5 Innovation Pipeline and R&D Investment
- 15.6 Patent and Intellectual Property Trends
- 15.7 Energy Efficiency and Resource Management
- 15.8 Sustainability, Recycling and Circularity
- 15.9 Technology Roadmap, 2025-2035
- 15.10 Risks of Obsolescence and Technology Substitution
Chapter 16 Indonesia Car Rental Market Key Strategic Imperatives
- 16.1 Growth and Market Entry Priorities
- 16.2 High-Return Products and Segments
- 16.3 Pricing, Profitability and Cost Optimization
- 16.4 Technology Investment and Product Differentiation
- 16.5 Supply Chain Localization and Resilience
- 16.6 Distribution and Customer Acquisition
- 16.7 Partnership, Acquisition and Capacity Strategy
- 16.8 Regional Expansion Priorities
- 16.9 Short-, Medium- and Long-Term Actions
Chapter 17 Competition Outlook
- 17.1 Industry Competition Characteristics
- 17.2 Market Structure and Concentration
- 17.3 Market Share and Competitive Positioning, 2025
- 17.4 Company-Wise Revenue and Product Benchmarking
- 17.5 Production and Service Capacity Benchmarking
- 17.6 Technology, Pricing and Differentiation
- 17.7 Regional Footprint and Distribution Strength
- 17.8 Mergers, Acquisitions and Strategic Alliances
- 17.9 New Entrants and Competitive Threats
- 17.10 Porter's Five Forces and Industry Attractiveness
- 17.11 Competitive Outlook, 2025-2035
Chapter 18 Company Profiles
- 18.1 Company Coverage and Selection Criteria
- 18.2 TRAC Astra Rent A Car
- 18.2.1 Business Description
- 18.2.2 Company Ownership and Geographic Presence
- 18.2.3 Product and Service Portfolio
- 18.2.4 Manufacturing and Operating Footprint
- 18.2.5 Production Capacity and Expansion Plans
- 18.2.6 Financial Performance and Investment
- 18.2.7 Market Share and Competitive Position
- 18.2.8 Technology and Innovation Capabilities
- 18.2.9 Strategic Alliances or Partnerships
- 18.2.10 Recent Developments
- 18.2.11 Growth Strategy and Outlook
- 18.3 Bluebird Group
- 18.4 ASSA Rent
- 18.5 MPMRent
- 18.6 Indorent
- 18.7 Avis Indonesia
- 18.8 Hertz Indonesia
- 18.9 Europcar Indonesia
- 18.10 Globe Rent A Car
- 18.11 KINTO Indonesia
- 18.12 Other Relevant Market Participants
Note: Every listed company is profiled on the structure shown under the first company. The company list is preliminary and may change based on research findings, market developments, data availability and client requirements.
Chapter 19 Disclaimer
- 19.1 Research and Forecast Disclaimer
- 19.2 Data Source and Estimation Limitations
Note: The depth of individual sections depends on data availability for this market. Volume, capacity, trade and other unit-based metrics are included where applicable.

