In-vehicle AI content per car multiplies through 2035
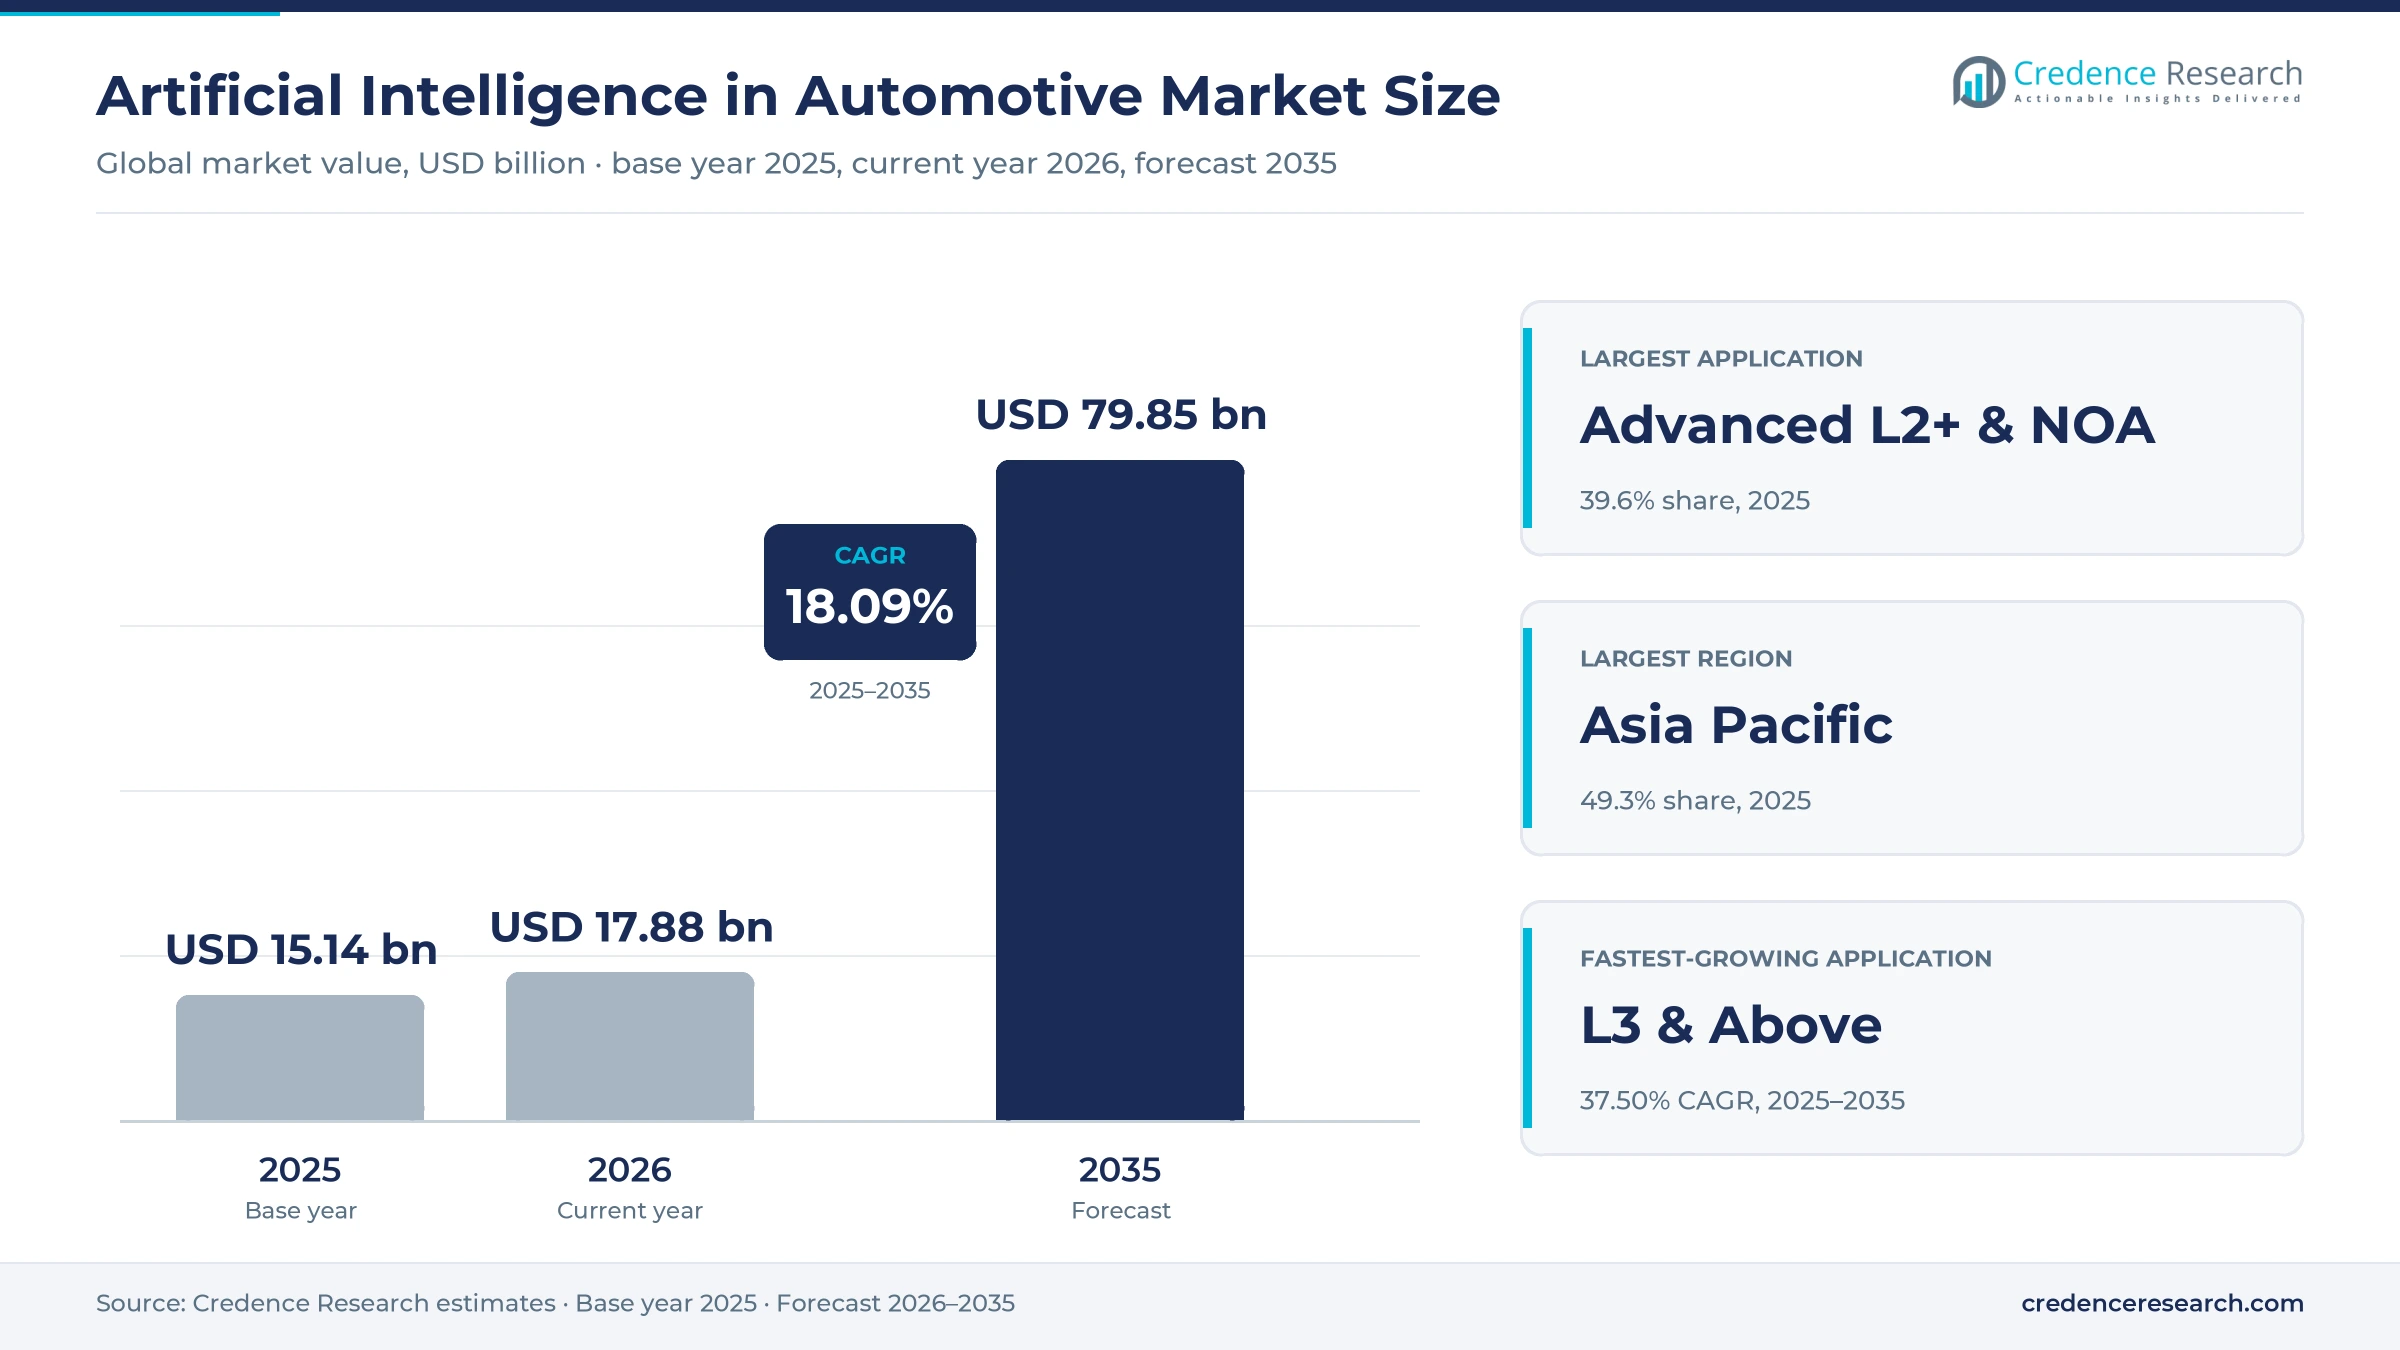
The artificial intelligence in automotive market was valued at USD 15.14 billion in 2025 and is projected to increase from USD 17.88 billion in 2026 to USD 79.85 billion by 2035, registering a CAGR of 18.09% during 2025–2035. Demand comes from safety mandates that make AI-based braking and distraction warning standard, from city navigate-on-autopilot systems moving into mass-market cars, and from automakers selling driving features as software. Asia Pacific accounted for 49.3% of 2025 value, the largest regional share, because China combines the largest vehicle output with the fastest rollout of urban NOA. The main commercial change is the shift from one camera chip per car toward central computers, licensed end-to-end driving software and paid upgrades. In December 2025, China's industry ministry granted its first Level 3 product approvals, opening a path to manufacturer-liable automated driving in designated pilot areas of Chongqing and Beijing.
Where does AI sit in the car, and what is left out?
The market counts the processors that run neural networks for driving and cabin functions, the perception, planning, monitoring and voice software that runs on them, and the services sold around those functions, including driving-feature subscriptions, over-the-air AI upgrades and data and simulation work. Automakers buy chips and software from suppliers or build them in-house, and drivers pay for some features after purchase.
The estimate excludes AI used in factories, design, sales and insurance, along with cameras, radar and lidar, infotainment silicon that runs no AI workload, robotaxi fare revenue and data-center training spending. Global vehicle output grows slowly, so value growth comes from AI content per car rising with each step up the autonomy ladder.
Artificial Intelligence in Automotive Market Insights
- The artificial intelligence in automotive market is projected to grow from USD 17.88 billion in 2026 to USD 79.85 billion by 2035, an 18.09% CAGR, as AI content per car multiplies.
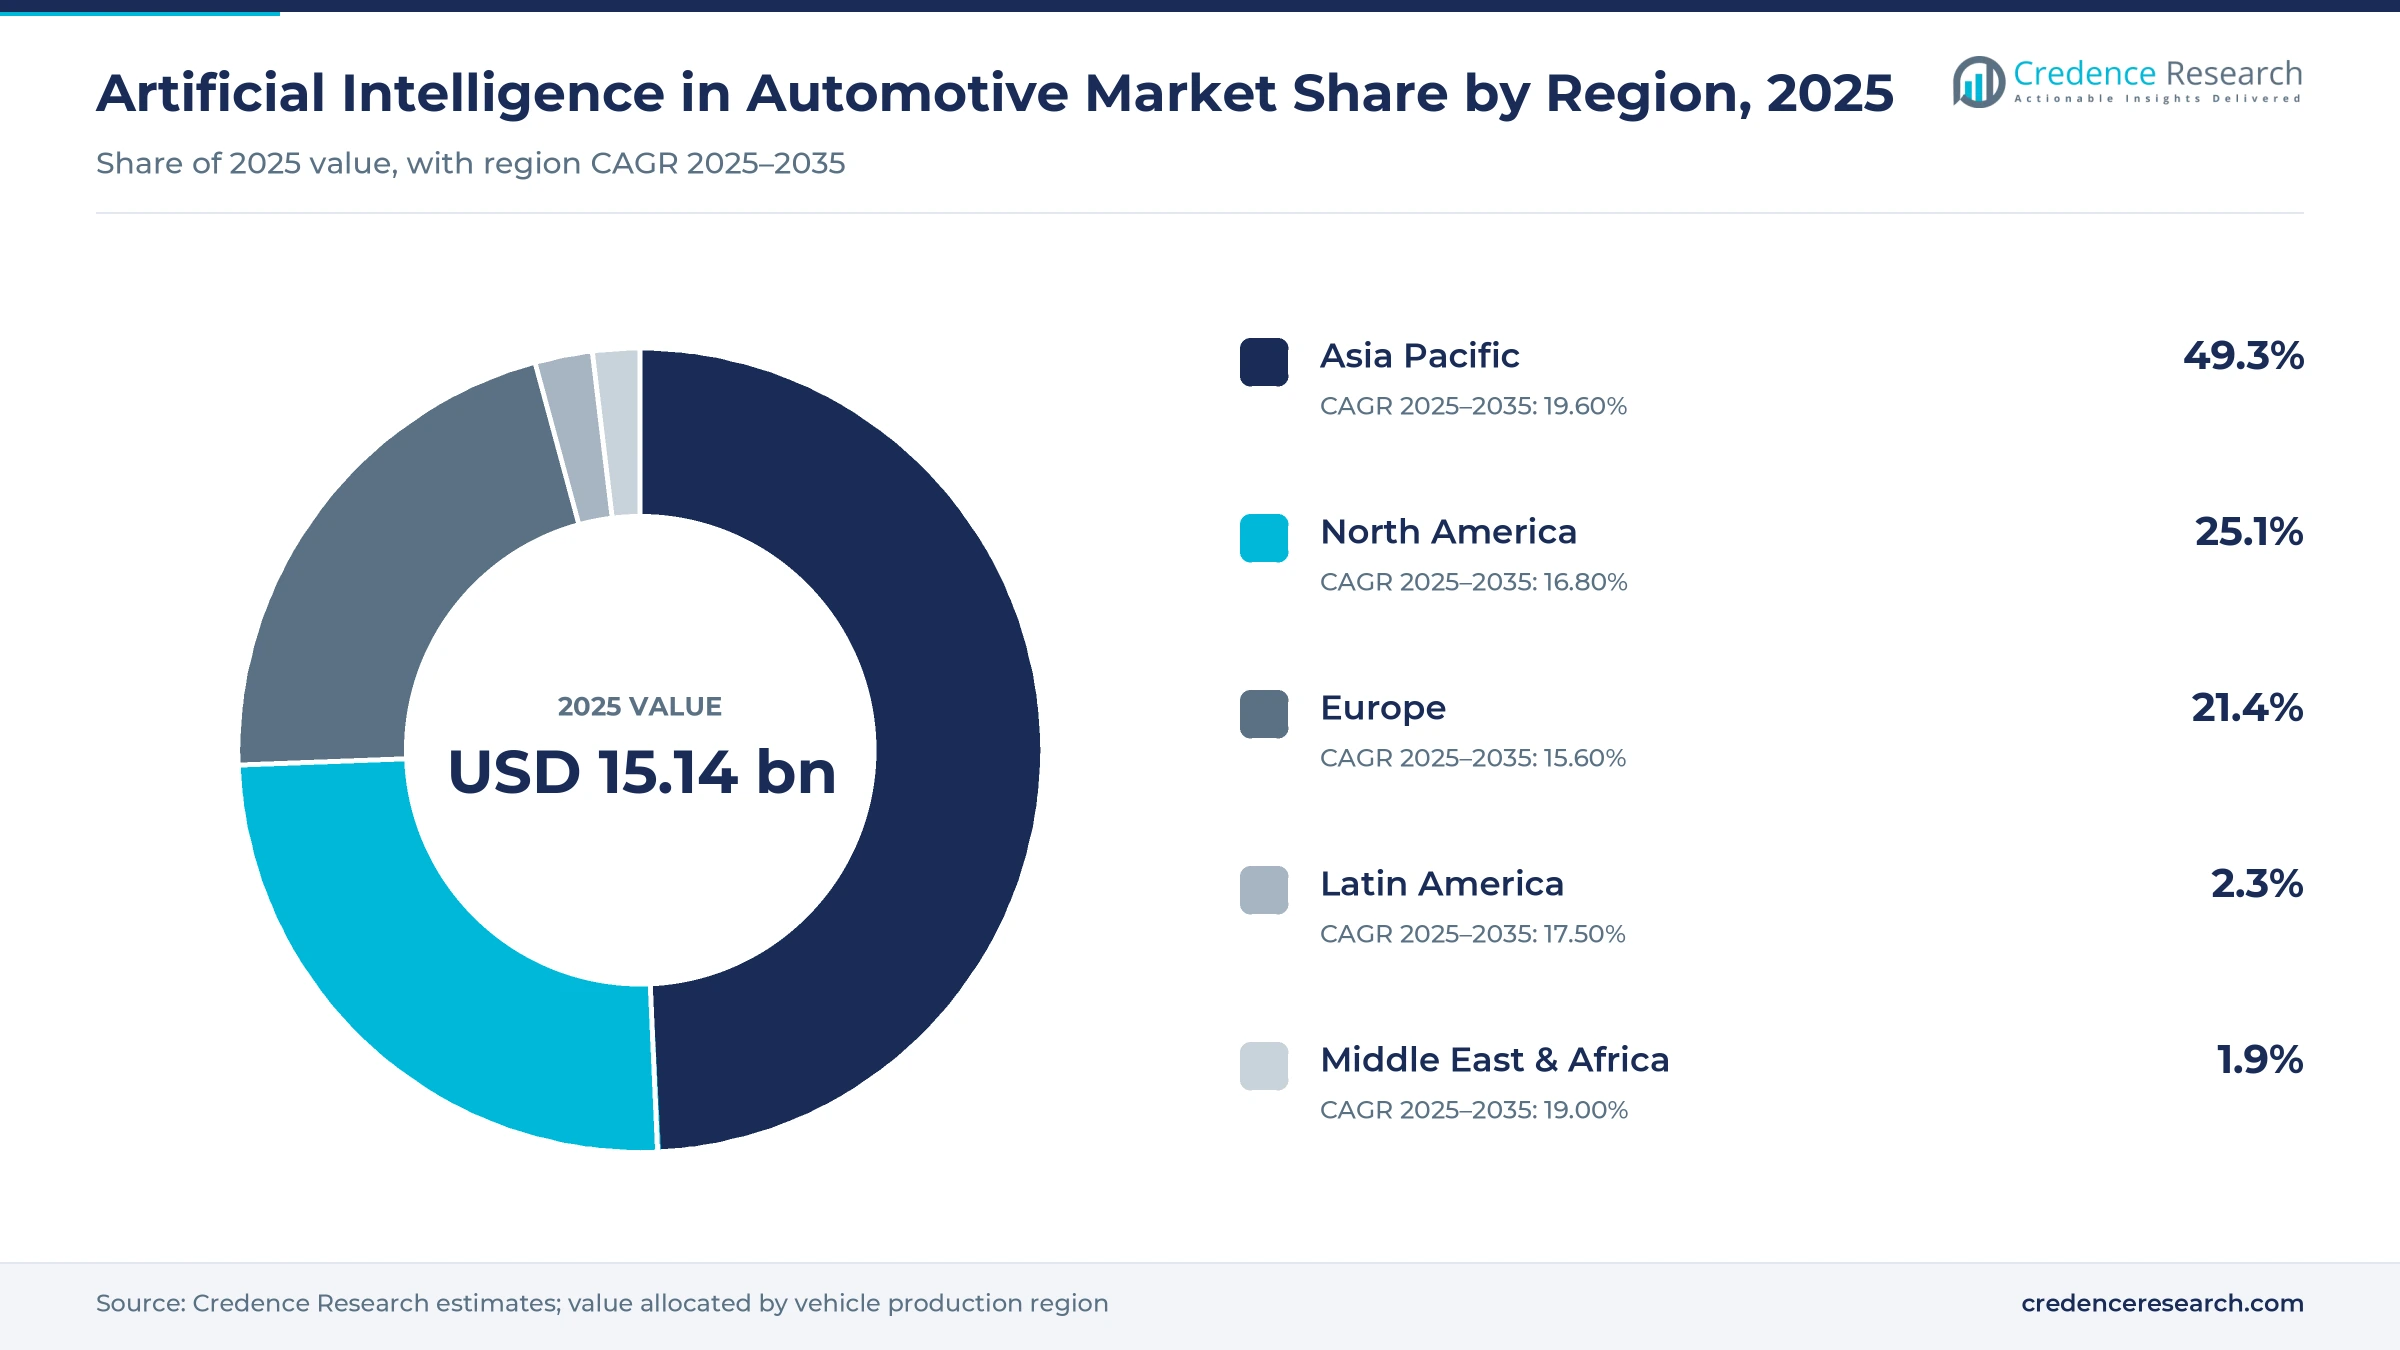
- Asia Pacific accounted for 49.3% of 2025 value, the largest regional share, because China pairs the largest vehicle output with fast urban NOA adoption.
- Advanced L2+ and navigate-on-autopilot systems accounted for 39.6% of 2025 value, the largest application, because city driving needs far more compute.
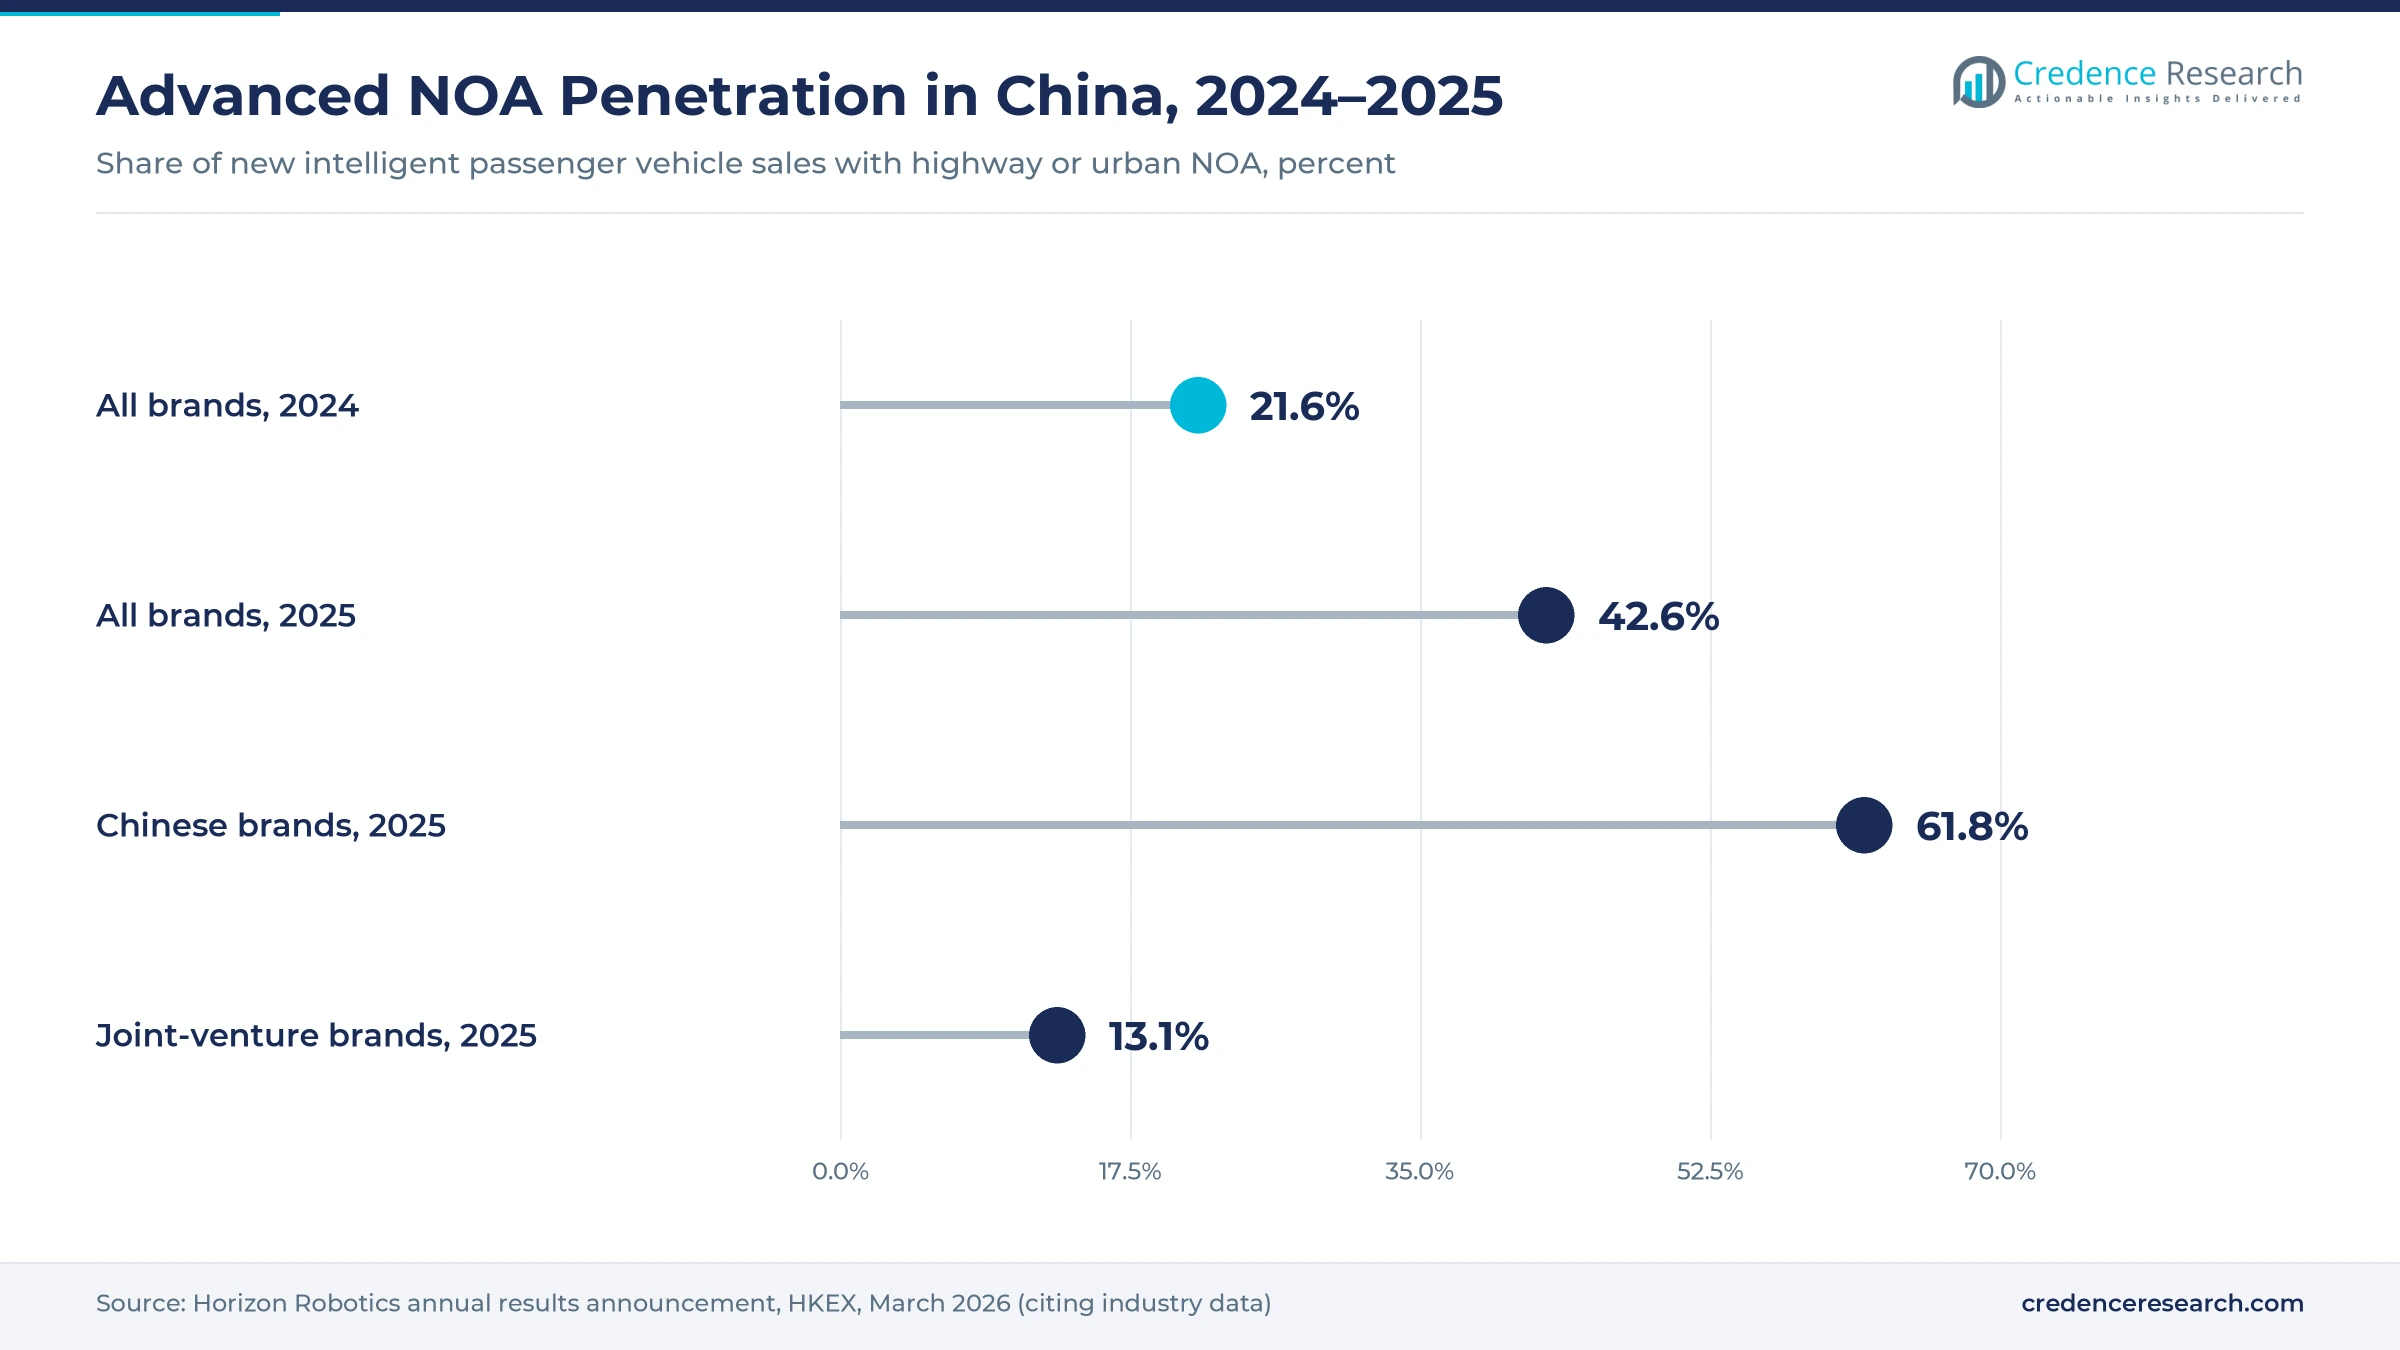
- Advanced NOA reached 42.6% of new intelligent vehicle sales in China in 2025, up from 21.6% in 2024, moving city driving into mass-market cars.
- AI services grow fastest by component at 24.50% a year from 2025 to 2035, rewarding suppliers and automakers that sell features after purchase.
Driving chips lead as paid features and Level 3 add growth
AI hardware leads the component mix while AI services grow fastest
Based on component, the market is categorized into AI hardware, AI software and AI services. AI hardware led with 53.8% of 2025 value, because every ADAS-equipped car needs at least one vision processor and L2+ cars need a central computer. AI services grow fastest at 24.50% a year, as subscriptions, paid activations and over-the-air upgrades scale with the fitted fleet rather than new-car sales alone.
L2+ city driving leads the application mix while Level 3 and above grows fastest
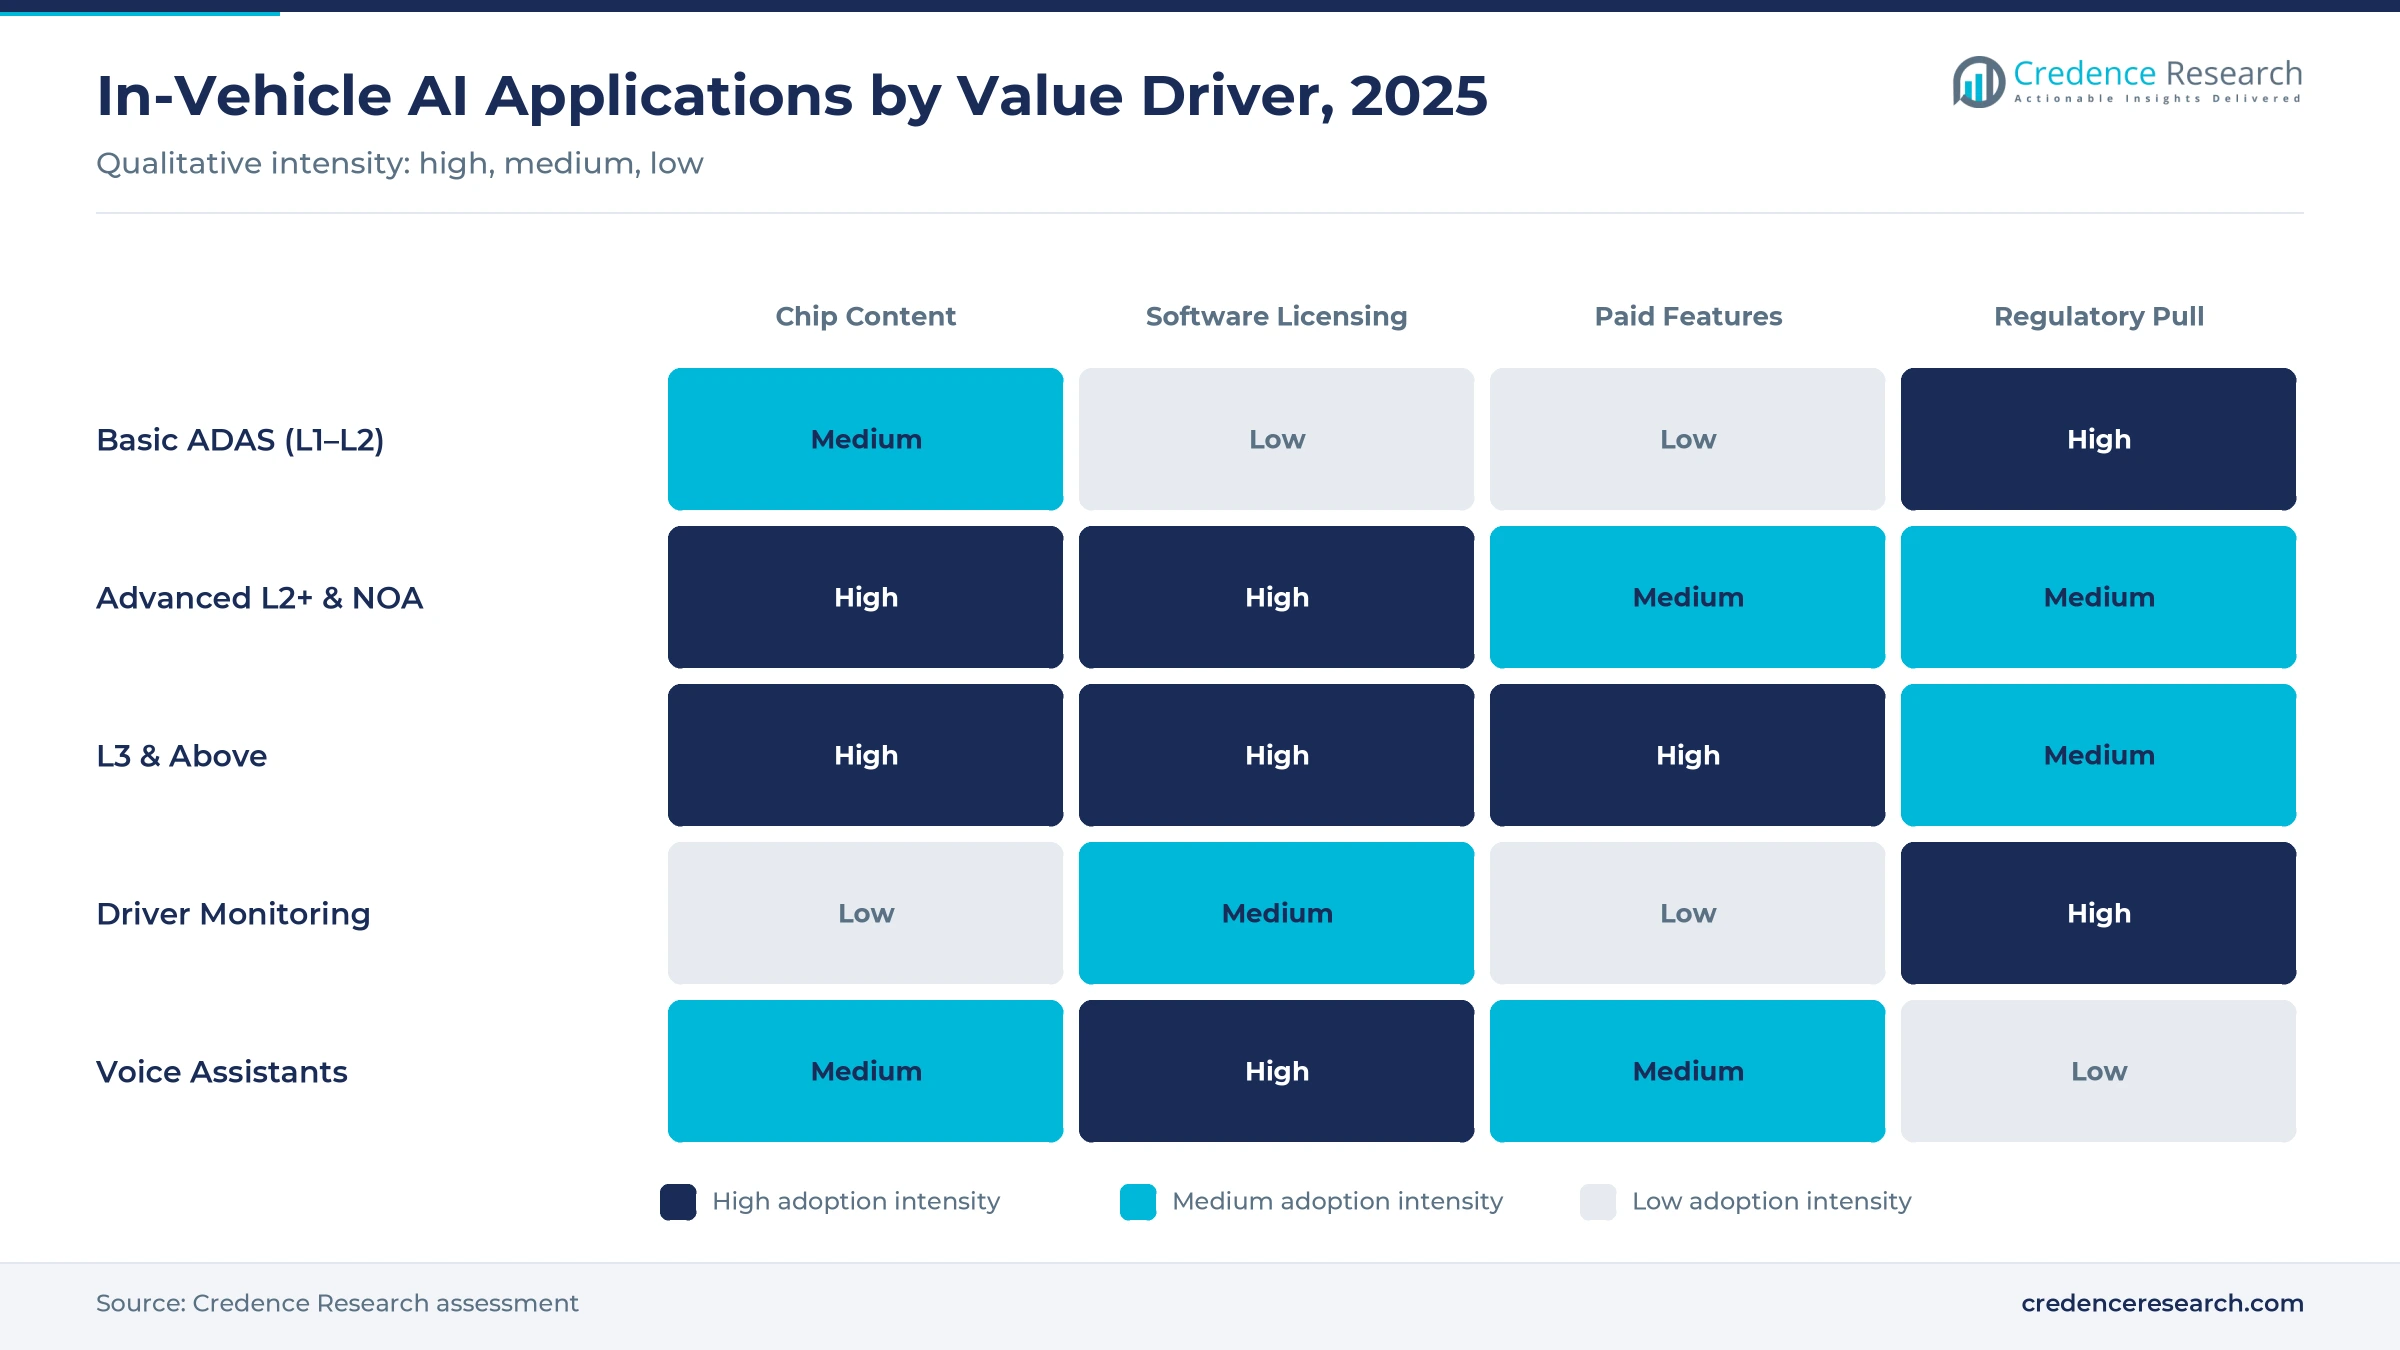
Based on application, the market is categorized into basic ADAS (L1–L2), advanced L2+ and navigate-on-autopilot, L3 and above automated driving, driver and occupant monitoring, and voice and conversational assistants. Advanced L2+ systems led with 39.6% of 2025 value, driven by high compute content and fast adoption in China. L3 and above grows fastest at 37.50% a year from a small base as first approvals arrive.
| Segment Group | Leading Sub-segment | Share, 2025 | Fastest-growing Sub-segment | CAGR, 2025–2035 |
|---|---|---|---|---|
| By Component | AI Hardware | 53.8% | AI Services | 24.50% |
| By Application | Advanced L2+ & Navigate-on-Autopilot | 39.6% | L3 & Above Automated Driving | 37.50% |
Request a Free Sample
Fill in your details and we'll send you a free sample report.
- Sample data tables & charts
- Research methodology
Mandates, city NOA and design wins lift AI content per car
Braking and distraction mandates put an AI processor in every new car
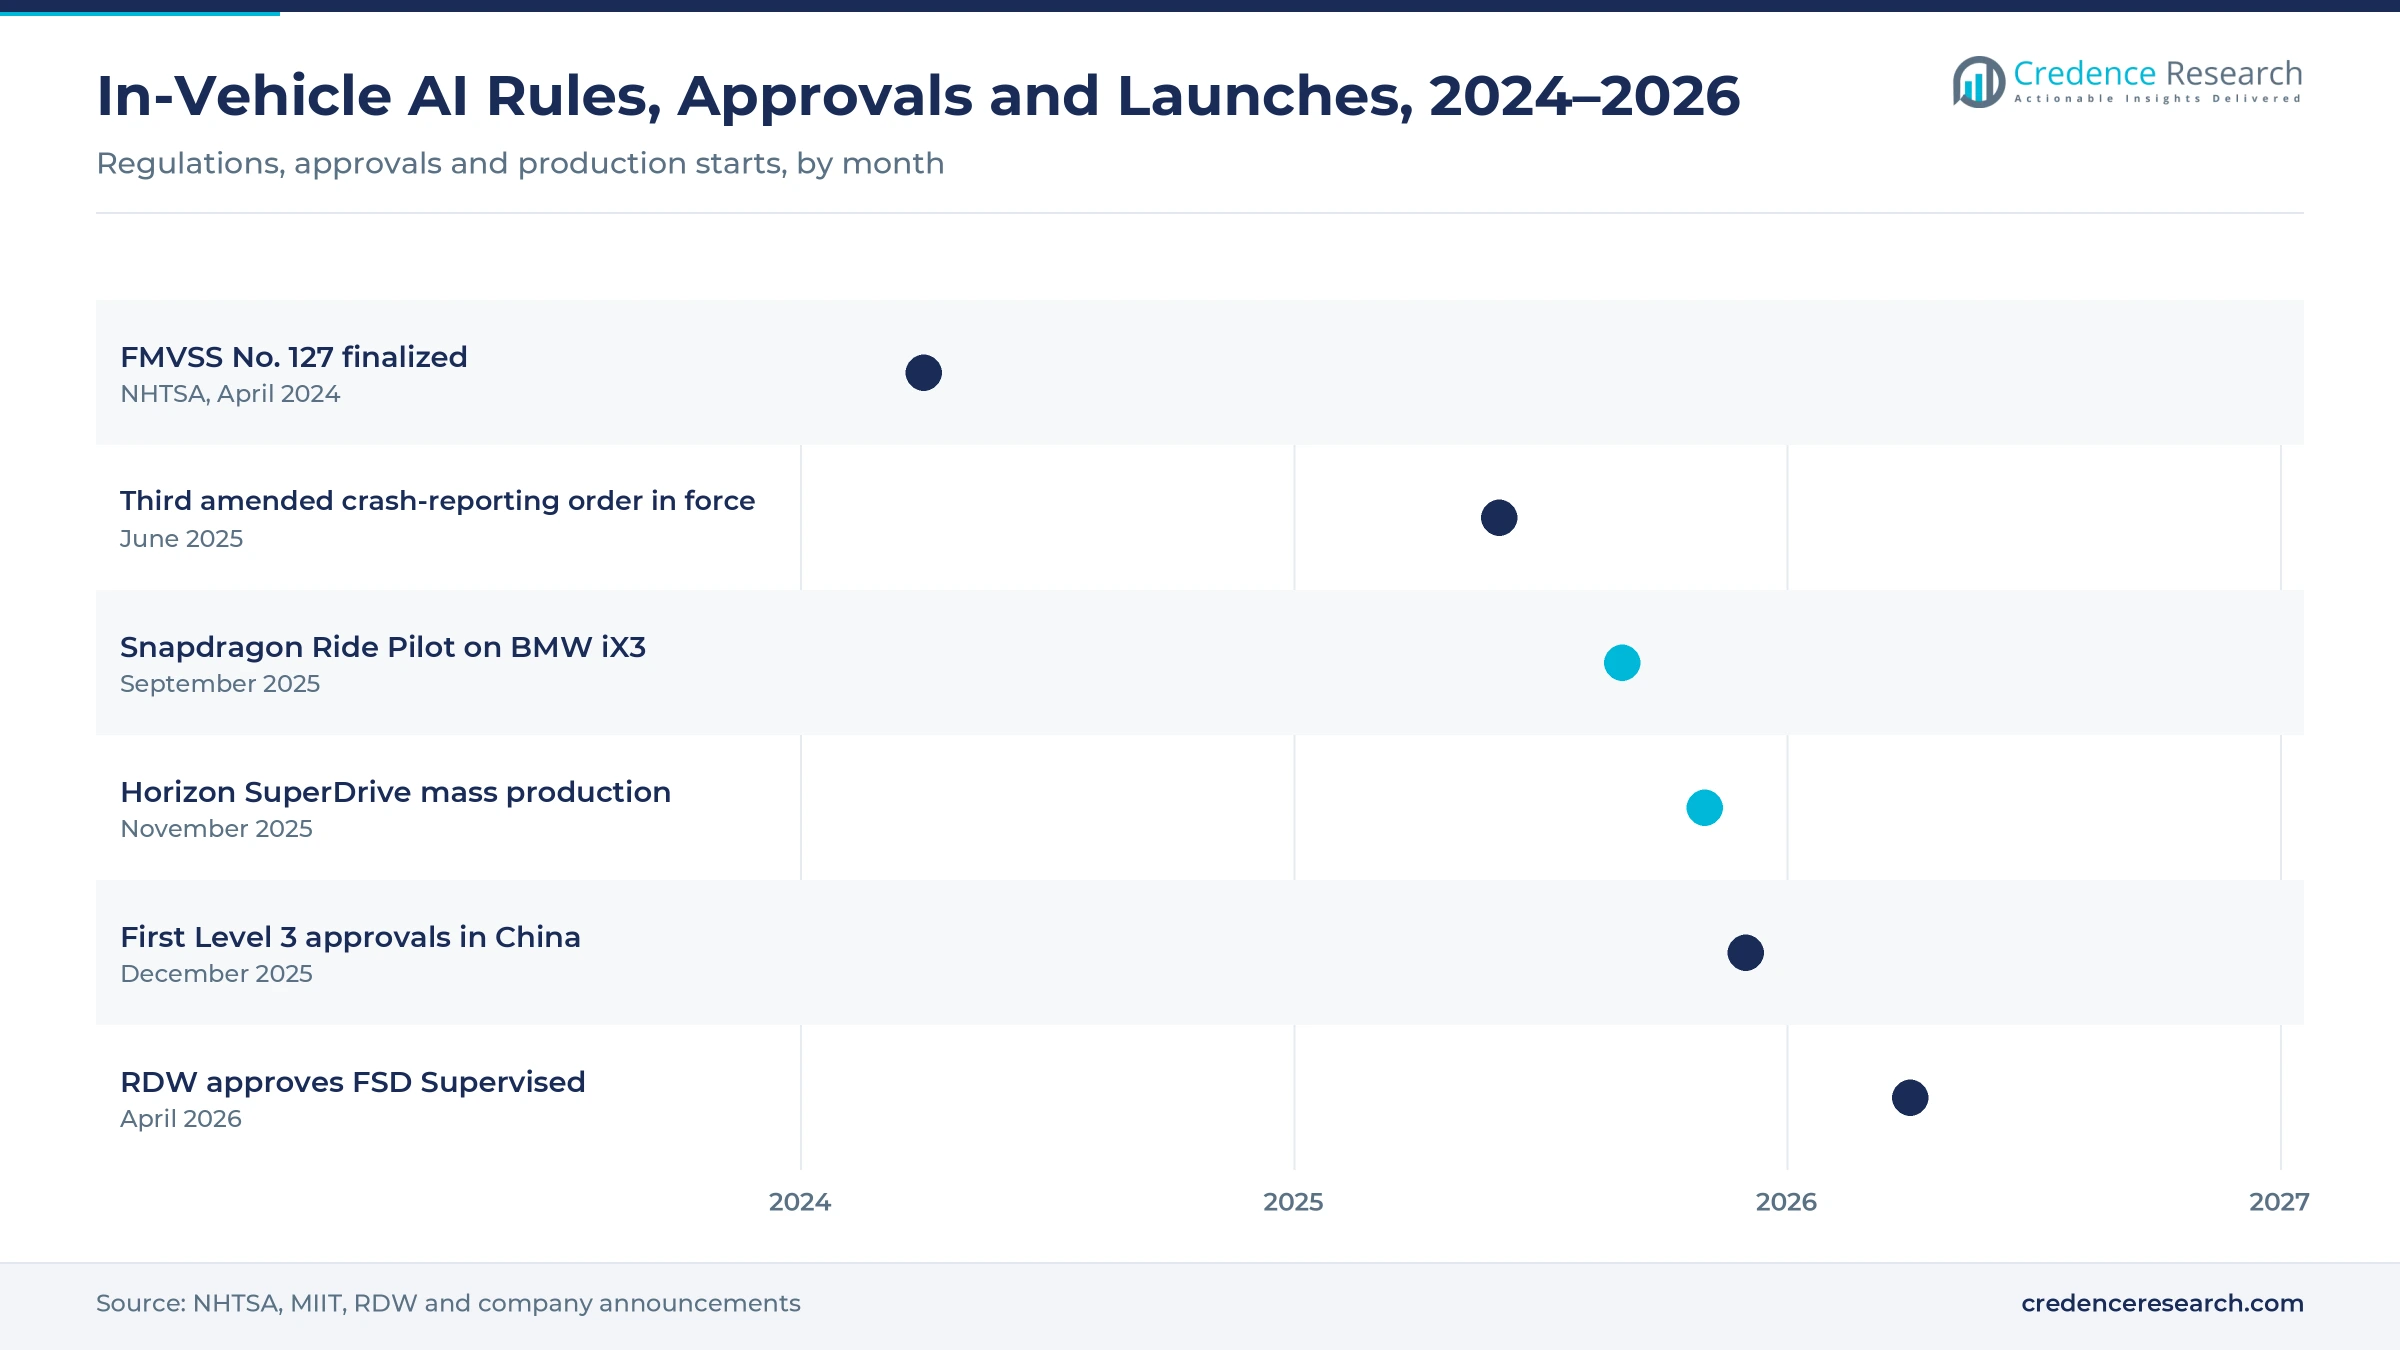
In April 2024, NHTSA finalized FMVSS No. 127, which makes automatic emergency braking with pedestrian detection standard on nearly all U.S. light vehicles by September 2029, with stops from up to 62 mph and at least 360 lives saved a year. Article 6 of the EU General Safety Regulation 2019/2144 requires distraction and drowsiness warning, which needs an in-cabin camera and gaze model. Together, these rules set a long-term floor for AI content in North America and Europe, because every new car must carry the processor and software these functions require.
Urban navigate-on-autopilot reaches mass-market cars in China
Horizon Robotics' 2025 annual results announcement cites industry data showing advanced NOA in 42.6% of new intelligent vehicle sales in China in 2025, up from 21.6% in 2024. In the sub-RMB200,000 bracket, 65% of passenger car sales, NOA penetration rose from 5% to over 50% during the year. Horizon shipped 4.01 million Journey processors, 45% of them NOA-capable, and in January 2026 a single-chip urban NOA solution entered production, cutting cost.
Design wins lock in AI content for cars launching through 2030
Supplier order books already confirm in-car AI demand several years ahead. Horizon Robotics secured more than 110 new design wins in 2025, over 20 of them for its SuperDrive urban system, and nominations for more than 40 export models from 11 automakers. In January 2026, Mobileye announced a high-volume Surround ADAS win with a major U.S. automaker on EyeQ6 High, and the Mercedes-Benz CLA runs NVIDIA DRIVE AV software. These programs fix AI content for vehicles reaching showrooms through 2030.
Automakers turn driving features into software sales
Driving-assistance subscriptions, one-off feature purchases and over-the-air upgrades turn AI into recurring income after the car is sold, which makes AI services the fastest-growing component. Tesla's FSD Supervised is the best-known paid feature, while Chinese brands often bundle city NOA at no charge to win buyers and sell higher tiers later. Licensing also grows, as automakers that cannot fund a full stack license software from Horizon, Momenta, Mobileye or NVIDIA.
End-to-end models and LLM agents redraw car software
End-to-end and reasoning models replace hand-written driving rules
Driving stacks are moving from separate perception, prediction and planning modules to single neural networks trained on fleet video. Horizon's SuperDrive, which entered mass production in November 2025, is described as China's first mass-production one-segment end-to-end system, and it delivered more than 22,000 units in just over a month. NVIDIA opened its Alpamayo 2 Super reasoning model for commercial use in August 2026. Because larger models need more in-car compute, they also support hardware demand.
Cockpit and driving compute increasingly merge on central platforms
Automakers are cutting the number of control units by running cabin and driving AI on one central platform. In July 2026, Qualcomm was named BMW Group's lead compute silicon supplier for both digital cockpit and automated driving, after Snapdragon Ride Pilot debuted on the BMW iX3 in September 2025 with validation in 60 countries. Central compute favors suppliers with both product lines and squeezes single-function chip vendors.
Large-language-model voice agents open a cabin opportunity
Voice control is becoming a conversational agent that understands several requests in one sentence and acts on vehicle settings and navigation. Geely selected Cerence xUI for overseas models, and in April 2026, BYD and Cerence announced a multilingual assistant built on Cerence's CaLLM models, starting with the ATTO 2 DM-i, according to Cerence's announcement. Suppliers that run small models on the car and larger ones in the cloud can win this cabin slot.
Level 3 systems and robotaxi compute offer a growth opportunity
L3 and above is the fastest-growing application because approvals have started to arrive. China's first Level 3 approvals in December 2025 cover a Changan model and a BAIC Arcfox model in designated areas of Chongqing and Beijing. In August 2026, NVIDIA widened its DRIVE Hyperion robotaxi ecosystem with Foxconn, VinFast, Uber and HUMAIN. Each robotaxi carries many times a private car's AI content, so fleet deals add outsized value.
Liability, crash scrutiny and chip price wars slow rollout
Manufacturer liability holds back Level 3 launches
At Level 2 the driver is responsible; at Level 3 the manufacturer takes on part of that duty within approved conditions. Many automakers delay Level 3 for that reason, and UN Regulation No. 157 sets strict conditions for automated lane keeping. The result is slow volume for the highest-value systems and long payback on development. Automakers mitigate the risk by limiting Level 3 to defined roads and speeds, adding redundant compute and logging, and launching in pilot zones first.
Crash reporting and recalls slow feature rollouts
Every serious incident involving driver assistance is now on record in the U.S. The NHTSA Standing General Order requires reports of crashes in which Level 2 ADAS was in use within 30 seconds and someone was hurt or a vulnerable road user was struck; its third amendment took effect on June 16, 2025. Investigations and recalls triggered by these reports force software changes on large fleets and delay launches. Suppliers respond with driver-monitoring checks, conservative operating limits and faster over-the-air fixes.
Approvals remain country by country
There is no single global gate for supervised city driving. The RDW approved Tesla's FSD Supervised in April 2026 with validity only in the Netherlands, and EU-wide use requires a vote of member states, as the RDW explained. China grants Level 3 access model by model and city by city. Each market adds testing, mapping and homologation cost for automakers and suppliers, which slows rollouts. Harmonized UN rules and reusable safety cases reduce that burden over time.
Chip price wars in China compress value per car
Price pressure is heavy in China, where automakers compete on standard-fit NOA and urban systems now reach cars priced around RMB150,000. Chipmakers answer with cheaper single-chip designs, which widen fitment but lower hardware value per car, so hardware grows more slowly than software and services. Export controls on advanced processors add supply risk for Chinese automakers using U.S. chips. Suppliers protect margins by bundling software, licensing their stacks to other automakers and selling higher-tier upgrades.
China's city NOA rollout keeps Asia Pacific in the lead
| Region | Share, 2025 | CAGR, 2025–2035 |
|---|---|---|
| Asia Pacific | 49.3% | 19.60% |
| North America | 25.1% | 16.80% |
| Europe | 21.4% | 15.60% |
| Latin America | 2.3% | 17.50% |
| Middle East & Africa | 1.9% | 19.00% |
Asia Pacific leads as China turns city NOA into a volume feature
Asia Pacific held 49.3% of 2025 value and is the fastest-growing region at 19.60% a year, and China drives most of that growth. Huawei, Horizon Robotics, Momenta and the in-house teams at BYD, Xpeng, Li Auto and Nio compete on standard-fit NOA, and nearly one in three passenger cars sold in China in 2025 carried an advanced NOA system. The first Level 3 approvals in December 2025 add a new tier. Japan and South Korea add premium L2+ and voice content.
North America combines chip designers, hands-free driving and a federal braking rule
North America held 25.1% of 2025 value and grows at 16.80% a year. Tesla's FSD Supervised, GM Super Cruise and Ford BlueCruise lead hands-free driving, and the region hosts the main AI chip designers, including NVIDIA, Qualcomm and Ambarella. FMVSS No. 127 sets a hard floor for AI-based braking by September 2029. Mobileye's January 2026 Surround ADAS win with a major U.S. automaker extends L2+ content into high-volume models later this decade.
Europe's Safety Regulation raises monitoring content per car
Europe held 21.4% of 2025 value and grows at 15.60% a year. The General Safety Regulation makes distraction warning, drowsiness warning and speed assistance standard, so cabin-monitoring content per car is high. Mercedes-Benz runs NVIDIA DRIVE AV software on the CLA, and BMW uses Snapdragon Ride Pilot on the iX3. EU-wide approval of supervised city driving is the next step, building on the installed driver-assistance hardware base.
Latin America and Middle East & Africa rely on imported content and early robotaxi permits
Latin America held 2.3% of 2025 value and grows at 17.50% a year, as Brazil and Mexico follow U.S. and EU safety specifications on export models and Chinese brands bring NOA-equipped cars to the region. The Middle East & Africa held 1.9% and grows at 19.00% a year, led by Gulf states with premium imports and early robotaxi permits.
Level 3 approvals and a Dutch FSD nod mark 2025–2026
| Development | Status and market relevance |
|---|---|
| In August 2026, NVIDIA widened its DRIVE Hyperion robotaxi-ready ecosystem with Foxconn, VinFast, Uber and HUMAIN and opened Alpamayo 2 Super for commercial use. | Released. Brings reasoning models and robotaxi compute to more fleets. |
| In July 2026, Qualcomm was named BMW Group's lead compute silicon supplier for digital cockpit and automated driving. | Selected. Shows cockpit and driving AI merging on one platform. |
| In April 2026, the RDW issued a type approval for Tesla's FSD Supervised, valid in the Netherlands pending an EU vote. | Approved nationally. First European approval of supervised city driving assistance. |
| In April 2026, Cerence and BYD announced an LLM-based in-car assistant on Cerence xUI, starting with the ATTO 2 DM-i. | Announced. Brings agentic voice AI to a high-volume brand. |
| In December 2025, China's MIIT granted the first Level 3 product approvals to a Changan model and a BAIC Arcfox model for pilots in Chongqing and Beijing. | Approved for pilots. Opens manufacturer-liable automated driving in China. |
Reasoning models and central compute define the next car AI
- End-to-end models use single networks trained on fleet video to replace rule-based planning, and open reasoning models such as NVIDIA Alpamayo extend them.
- Central compute lets one platform run cockpit and driving AI, cutting control units and favoring suppliers with both product lines.
- Single-chip NOA on lower-cost processors brings urban NOA to cars near RMB150,000, with suppliers targeting RMB100,000 models next.
- Driver monitoring through gaze and hand tracking becomes the condition for hands-free and supervised city driving approvals.
- Regulation such as FMVSS No. 127, the EU General Safety Regulation and Chinese Level 3 rules sets the minimum AI content per car.
Need a Custom Version of This Report?
Tailor the scope, geography, or segments to your exact requirements.
- Custom geography or segment scope
- Direct access to our analyst team
Chipmakers, stack builders and cabin AI firms compete
Value is spread across three supplier groups that increasingly overlap. AI chip suppliers sell driving and cockpit processors, often with software bundled. Mobileye has the largest installed base of ADAS vision processors, NVIDIA leads high-end central compute with DRIVE Orin and Thor, Qualcomm pairs Snapdragon Ride with its cockpit position, and Horizon Robotics is the largest independent Chinese supplier, with Ambarella and Black Sesame Technologies competing in vision and domain processors. Driving-stack developers range from Tesla's in-house FSD and Huawei's partner-brand system to Momenta, which licenses its stack, and Bosch, which integrates complete systems. Cabin specialists include Cerence in voice AI and Seeing Machines in driver monitoring. Entry barriers are high in chips and full stacks, which favors a few platforms, while software licensing stays more open. No company reports in-vehicle AI sales on a comparable basis, so no share ranking is given.
Companies profiled and their roles
| Company | Type | Role in the market |
|---|---|---|
| Mobileye | AI chip and software supplier | EyeQ vision processors, Surround ADAS and SuperVision |
| NVIDIA | AI chip and software supplier | DRIVE Orin and Thor compute, DRIVE AV software and Alpamayo models |
| Qualcomm | AI chip supplier | Snapdragon Ride driving chips and cockpit platforms; BMW lead compute supplier |
| Horizon Robotics | AI chip and software supplier | Journey processors and the SuperDrive urban driving system |
| Tesla | Automaker with in-house stack | In-house FSD computer and FSD Supervised software |
| Huawei | Driving-system supplier | Full driving system for partner brands in China |
| Momenta | Driving-stack developer | Licensed driving software for Chinese and foreign automakers |
| Bosch | Tier 1 integrator | Integrated ADAS systems combining chips, software and sensors |
| Ambarella | AI chip supplier | Vision and domain processors |
| Black Sesame Technologies | AI chip supplier | Vision and domain processors |
| Cerence | Cabin AI specialist | xUI and CaLLM voice assistants for Geely and BYD |
| Seeing Machines | Cabin AI specialist | Driver-monitoring software |
Value shifts from camera chips to licensed driving software
Credence Research's view is that value in the car is shifting from the camera chip to licensed driving software, central compute and paid features, and that China is setting the pace for the rest of the world. The largest new revenue lies in city NOA outside China, Level 3 systems and LLM voice agents. Suppliers that combine efficient chips, end-to-end software and driver monitoring are best positioned. The main risk is liability and approval delays, so the key signals to watch are EU votes on supervised driving and China's Level 3 pilots.
Fitment rates and AI content per vehicle drive the estimate
The report uses 2025 as the base year and forecasts to 2035, with CAGR calculated over 2025–2035. Market values come from Credence Research's market model, built from vehicle output, fitment rates of each AI function and AI content per vehicle; segment and regional splits are Credence Research estimates. Supporting evidence comes from regulations and type-approval notices, company filings and press releases, and industry penetration data cited in supplier filings.
City NOA goes global and Level 3 becomes a product by 2035
Through 2035, value will tilt from basic ADAS chips toward central computers, licensed end-to-end driving software and paid features. City NOA will spread from China to Europe and North America as single-chip designs cut cost, and Level 3 will move from pilot zones to more models as liability rules settle. Asia Pacific will remain the largest region, while LLM voice agents and driver monitoring become standard. The pace will depend on type approvals, crash scrutiny, liability rules and chip pricing in China.
Frequently Asked Questions
What was the size of the artificial intelligence in automotive market in 2025?
What is the forecast value and CAGR of the AI in automotive market?
Why is in-vehicle AI growing faster than car production?
Which region leads the artificial intelligence in automotive market?
Which application and component lead in-vehicle AI?
Which regulations raise AI fitment in cars?
Who are the major companies in the AI in automotive market?
What challenges could slow the AI in automotive market?
Table of Content
Chapter 1 Market Segmentation
- 1.1 Segmentation Framework
- 1.1.1 Product and Service Classification
- 1.1.2 Application and End-Use Classification
- 1.1.3 Technology and Solution Classification
- 1.1.4 Customer and Distribution Channel Classification
- 1.1.5 Geographic Segmentation
- 1.1.6 Market Segment Definitions and Boundaries
- 1.2 By Component
- 1.2.1 AI Hardware
- 1.2.2 AI Software
- 1.2.3 AI Services
- 1.3 By Application
- 1.3.1 Advanced L2+ & Navigate-on-Autopilot
- 1.3.2 Basic ADAS (L1–L2)
- 1.3.3 Voice & Conversational Assistants
- 1.3.4 Driver & Occupant Monitoring
- 1.3.5 L3 & Above Automated Driving
Chapter 2 Introduction
- 2.1 Report Objectives and Scope
- 2.2 Product Definition and Industry Terminology
- 2.3 Market Inclusions and Exclusions
- 2.4 Research Process
- 2.4.1 Primary Research and Expert Interviews
- 2.4.2 Secondary Research and Source Review
- 2.4.3 Top-Down and Bottom-Up Estimation
- 2.4.4 Data Triangulation and Verification
- 2.5 Market Size Measurement Basis
- 2.5.1 2025: USD 15.14 billion → 2035: USD 79.85 billion
- 2.6 Historical and Forecast Reference Periods
- 2.6.1 Historical Period: 2018-2025
- 2.6.2 Base Year: 2025
- 2.6.3 Forecast Period: 2025-2035
- 2.7 Research Assumptions and Limitations
Chapter 3 Executive Summary
- 3.1 Market Snapshot and Key Findings
- 3.2 Base-Year Market Size, 2025
- 3.3 Forecast Market Size, 2035
- 3.4 Revenue and Volume Growth Outlook
- 3.5 Key Demand and Supply Indicators
- 3.6 Leading Market Segments
- 3.7 Fastest-Growing Market Opportunities
- 3.8 Regional Performance Highlights
- 3.9 Technology and Industry Transformation
- 3.10 Competitive Landscape Summary
- 3.11 Analyst View and Strategic Implications
Chapter 4 Global Artificial Intelligence in Automotive Market Trends and Developments
- 4.1 Historical Industry Development, 2018-2025
- 4.2 Recent Market Trends and Developments
- 4.3 Demand and Customer Behavior Trends
- 4.4 Technology and Product Innovation
- 4.5 Artificial Intelligence, Automation and Digitalization
- 4.6 Local Manufacturing and Supply Chain Realignment
- 4.7 Industry Partnerships, Mergers and Acquisitions
- 4.8 Sustainability and Circular Economy Developments
- 4.9 Government and Private Sector Investment Trends
- 4.10 Emerging Business Models and Commercialization
- 4.11 Industry Developments and Announcements
Chapter 5 Global Artificial Intelligence in Automotive Market Production, Supply and Demand Analysis
- 5.1 Demand Trend and Consumption Analysis, 2018-2025
- 5.2 Demand Forecast, 2025-2035
- 5.3 Production and Output Trend, 2018-2025
- 5.4 Production and Output Forecast, 2025-2035
- 5.5 Installed Capacity and Capacity Utilization
- 5.6 Company-Wise Production Plants and Statistics
- 5.6.1 Installed Production Capacity
- 5.6.2 Actual Production
- 5.6.3 Planned Capacity and Expansion Targets
- 5.7 Supply Chain Structure and Procurement Trends
- 5.8 Supply-Demand Gap and Bottlenecks
- 5.9 Import Dependence and Sourcing Structure
- 5.10 Contract Manufacturing and Outsourcing
- 5.11 Regional Supply and Demand Concentration
Chapter 6 Global Artificial Intelligence in Automotive Market Pricing Analysis
- 6.1 Pricing Structure and Measurement
- 6.2 Historical Pricing Trends, 2018-2025
- 6.3 Pricing Outlook, 2025-2035
- 6.4 Average Selling Price and Unit Economics
- 6.5 Pricing by Product and Market Segment
- 6.6 Geographic Pricing Differences
- 6.7 Key Input, Energy, Labor and Logistics Costs
- 6.8 Contract Pricing and Purchasing Models
- 6.9 Pricing Sensitivity and Competitive Positioning
- 6.10 Price, Margin and Profitability Implications
Chapter 7 Global Artificial Intelligence in Automotive Market Dynamics
- 7.1 Market Growth Drivers
- 7.1.1 Demand-Side Drivers
- 7.1.2 Technology and Innovation Drivers
- 7.1.3 Infrastructure and Investment Drivers
- 7.1.4 Regulatory and Policy Drivers
- 7.2 Market Restraints
- 7.2.1 Cost and Affordability Constraints
- 7.2.2 Technology and Adoption Barriers
- 7.2.3 Supply Chain and Operational Constraints
- 7.3 Market Challenges
- 7.3.1 Competitive Pressure and Margin Erosion
- 7.3.2 Skills, Infrastructure and Implementation Gaps
- 7.4 Emerging Market Opportunities
- 7.5 Market Dynamics Impact and Time-Horizon Assessment
Chapter 8 Global Artificial Intelligence in Automotive Value Chain Analysis
- 8.1 Industry Value Chain Overview
- 8.2 Upstream Suppliers and Critical Inputs
- 8.3 Technology and Component Providers
- 8.4 Manufacturing or Service Delivery
- 8.5 Distribution, Channel Partners and Integrators
- 8.6 Downstream Applications and End Users
- 8.7 Value Addition and Profit Pools
- 8.8 Vertical Integration and Outsourcing
- 8.9 Supplier Concentration and Risk
- 8.10 Supply Chain Localization and Resilience
Chapter 9 Global Artificial Intelligence in Automotive Market Regulations and Policies
- 9.1 Relevant Laws, Standards and Compliance Frameworks
- 9.2 Product, Service, Safety and Quality Requirements
- 9.3 Government Policies, Incentives and Subsidies
- 9.4 Imports, Exports and Trade Barriers
- 9.5 Public Procurement and Local Content Requirements
- 9.6 Environmental and Sustainability Compliance
- 9.7 Upcoming Policy Changes and Market Implications
Chapter 10 Global Artificial Intelligence in Automotive Market Hotspots and Opportunities
- 10.1 Market Opportunity Mapping and Growth Hotspots
- 10.2 High-Growth Applications and Customer Groups
- 10.3 Underserved Markets and White-Space Opportunities
- 10.4 Emerging Technology and Product Opportunities
- 10.5 New Capacity and Investment Hotspots
- 10.6 Market Entry and Expansion Opportunities
- 10.7 Distribution and Partnership Opportunities
- 10.8 Near-Term and Long-Term Commercial Potential
- 10.9 Opportunity Attractiveness and Execution Risks
Chapter 11 Global Artificial Intelligence in Automotive Market Outlook, 2025-2035
- 11.1 Market Size and Analysis
- 11.1.1 Revenue (Market Measurement: 2025: USD 15.14 billion → 2035: USD 79.85 billion)
- 11.1.2 Market Volume and Quantity Sold
- 11.1.3 Historical Market Size, 2018-2025
- 11.1.4 Base-Year Market Size, 2025
- 11.2 Market Forecast, 2025-2035
- 11.2.1 Revenue Forecast to 2035
- 11.2.2 Volume Forecast to 2035
- 11.2.3 CAGR and Year-on-Year Growth
- 11.2.4 Incremental Revenue Opportunity
- 11.3 Forecast Assumptions and Scenario Analysis
- 11.3.1 Base-Case Forecast
- 11.3.2 Optimistic and Conservative Scenarios
- 11.3.3 Technology, Pricing and Policy Sensitivities
- 11.4 Market Attractiveness and Growth Outlook
Chapter 12 Global Artificial Intelligence in Automotive Market Segmentation and Outlook
- 12.1 Segmentation Summary and Market Shares, 2025
- 12.2 Largest and Fastest-Growing Segments
- 12.3 By Component - Market Size and Forecast, 2025-2035
- 12.3.1 Segment Definition and Scope
- 12.3.2 Historical Market Size, 2018-2025
- 12.3.3 Revenue Forecast, 2025-2035
- 12.3.4 Volume Forecast, 2025-2035
- 12.3.5 Base-Year Market Share, 2025
- 12.3.6 Segment CAGR and Growth Drivers
- 12.3.7 Subsegment Market Size and Forecast
- 12.3.7.1 AI Hardware
- 12.3.7.2 AI Software
- 12.3.7.3 AI Services
- 12.3.8 Subsegment Pricing and Adoption Trends
- 12.3.9 Leading Suppliers and Competition
- 12.3.10 Regional Demand and Opportunities
- 12.4 By Application - Market Size and Forecast, 2025-2035
- 12.4.1 Segment Definition and Scope
- 12.4.2 Historical Market Size, 2018-2025
- 12.4.3 Revenue Forecast, 2025-2035
- 12.4.4 Volume Forecast, 2025-2035
- 12.4.5 Base-Year Market Share, 2025
- 12.4.6 Segment CAGR and Growth Drivers
- 12.4.7 Subsegment Market Size and Forecast
- 12.4.7.1 Advanced L2+ & Navigate-on-Autopilot
- 12.4.7.2 Basic ADAS (L1–L2)
- 12.4.7.3 Voice & Conversational Assistants
- 12.4.7.4 Driver & Occupant Monitoring
- 12.4.7.5 L3 & Above Automated Driving
- 12.4.8 Subsegment Pricing and Adoption Trends
- 12.4.9 Leading Suppliers and Competition
- 12.4.10 Regional Demand and Opportunities
- 12.5 Segment Growth Comparison
- 12.6 Segment Attractiveness and Priority Matrix
Chapter 13 Global Artificial Intelligence in Automotive End-Use and Application Market Outlook
- 13.1 End-Use Industry and Customer Demand Structure
- 13.2 Leading Applications and Customer Groups
- 13.3 End-Use Market Size, Share and Forecast
- 13.4 Major End-Use Industry Deep Dives
- 13.4.1 Customer Requirements and Use Cases
- 13.4.2 Demand and Replacement Cycles
- 13.4.3 Technical and Regulatory Considerations
- 13.4.4 Purchasing and Procurement Models
- 13.4.5 Leading Vendors and Distribution Channels
- 13.4.6 Forecast and Commercial Opportunities
- 13.5 Emerging Applications and Cross-Segment Demand
- 13.6 End-Use Industry Investment Priorities
Chapter 14 Global Artificial Intelligence in Automotive Geographic Market Outlook, 2025-2035
- 14.1 Regional Market Size and Share, 2025
- 14.2 Regional Market Forecast, 2025-2035
- 14.3 Regional Pricing, Production and Demand Differences
- 14.4 North America
- 14.4.1 United States
- 14.4.2 Canada
- 14.4.3 Mexico
- 14.5 Europe
- 14.5.1 Germany
- 14.5.2 France
- 14.5.3 Italy
- 14.5.4 United Kingdom
- 14.5.5 Spain
- 14.5.6 Poland
- 14.5.7 Russia
- 14.5.8 Netherlands
- 14.5.9 Belgium
- 14.5.10 Sweden
- 14.5.11 Denmark
- 14.5.12 Norway
- 14.5.13 Rest of Europe
- 14.6 Asia Pacific
- 14.6.1 China
- 14.6.2 India
- 14.6.3 Japan
- 14.6.4 South Korea
- 14.6.5 Thailand
- 14.6.6 Indonesia
- 14.6.7 Vietnam
- 14.6.8 Malaysia
- 14.6.9 Australia
- 14.6.10 Rest of Asia Pacific
- 14.7 Latin America
- 14.7.1 Brazil
- 14.7.2 Argentina
- 14.7.3 Colombia
- 14.7.4 Chile
- 14.7.5 Rest of Latin America
- 14.8 Middle East
- 14.8.1 Saudi Arabia
- 14.8.2 United Arab Emirates
- 14.8.3 Turkey
- 14.8.4 Israel
- 14.8.5 Iran
- 14.8.6 Rest of the Middle East
- 14.9 Africa
- 14.9.1 South Africa
- 14.9.2 Egypt
- 14.9.3 Nigeria
- 14.9.4 Morocco
- 14.9.5 Rest of Africa
- 14.10 Regional Investment, Policy and Supply Chain Differences
- 14.11 Regional Competitive Landscape
- 14.12 Geographic Growth Hotspots
Chapter 15 Global Artificial Intelligence in Automotive Technology, Innovation and Sustainability Outlook
- 15.1 Technology Landscape and Maturity
- 15.2 Product, Process and Service Innovation
- 15.3 AI, Automation and Digital Tools in the Industry
- 15.4 Technology Adoption and Performance Benchmarking
- 15.5 Innovation Pipeline and R&D Investment
- 15.6 Patent and Intellectual Property Trends
- 15.7 Energy Efficiency and Resource Management
- 15.8 Sustainability, Recycling and Circularity
- 15.9 Technology Roadmap, 2025-2035
- 15.10 Risks of Obsolescence and Technology Substitution
Chapter 16 Global Artificial Intelligence in Automotive Market Key Strategic Imperatives
- 16.1 Growth and Market Entry Priorities
- 16.2 High-Return Products and Segments
- 16.3 Pricing, Profitability and Cost Optimization
- 16.4 Technology Investment and Product Differentiation
- 16.5 Supply Chain Localization and Resilience
- 16.6 Distribution and Customer Acquisition
- 16.7 Partnership, Acquisition and Capacity Strategy
- 16.8 Regional Expansion Priorities
- 16.9 Short-, Medium- and Long-Term Actions
Chapter 17 Competition Outlook
- 17.1 Industry Competition Characteristics
- 17.2 Market Structure and Concentration
- 17.3 Market Share and Competitive Positioning, 2025
- 17.4 Company-Wise Revenue and Product Benchmarking
- 17.5 Production and Service Capacity Benchmarking
- 17.6 Technology, Pricing and Differentiation
- 17.7 Regional Footprint and Distribution Strength
- 17.8 Mergers, Acquisitions and Strategic Alliances
- 17.9 New Entrants and Competitive Threats
- 17.10 Porter's Five Forces and Industry Attractiveness
- 17.11 Competitive Outlook, 2025-2035
Chapter 18 Company Profiles
- 18.1 Company Coverage and Selection Criteria
- 18.2 Mobileye
- 18.2.1 Business Description
- 18.2.2 Company Ownership and Geographic Presence
- 18.2.3 Product and Service Portfolio
- 18.2.4 Manufacturing and Operating Footprint
- 18.2.5 Production Capacity and Expansion Plans
- 18.2.6 Financial Performance and Investment
- 18.2.7 Market Share and Competitive Position
- 18.2.8 Technology and Innovation Capabilities
- 18.2.9 Strategic Alliances or Partnerships
- 18.2.10 Recent Developments
- 18.2.11 Growth Strategy and Outlook
- 18.3 NVIDIA
- 18.4 Qualcomm
- 18.5 Horizon Robotics
- 18.6 Tesla
- 18.7 Huawei
- 18.8 Momenta
- 18.9 Bosch
- 18.10 Ambarella
- 18.11 Black Sesame Technologies
- 18.12 Cerence
- 18.13 Seeing Machines
- 18.14 Other Relevant Market Participants
Note: Every listed company is profiled on the structure shown under the first company. The company list is preliminary and may change based on research findings, market developments, data availability and client requirements.
Chapter 19 Disclaimer
- 19.1 Research and Forecast Disclaimer
- 19.2 Data Source and Estimation Limitations
Note: The depth of individual sections depends on data availability for this market. Volume, capacity, trade and other unit-based metrics are included where applicable.