
Imports through Mombasa anchor landlocked cargo demand
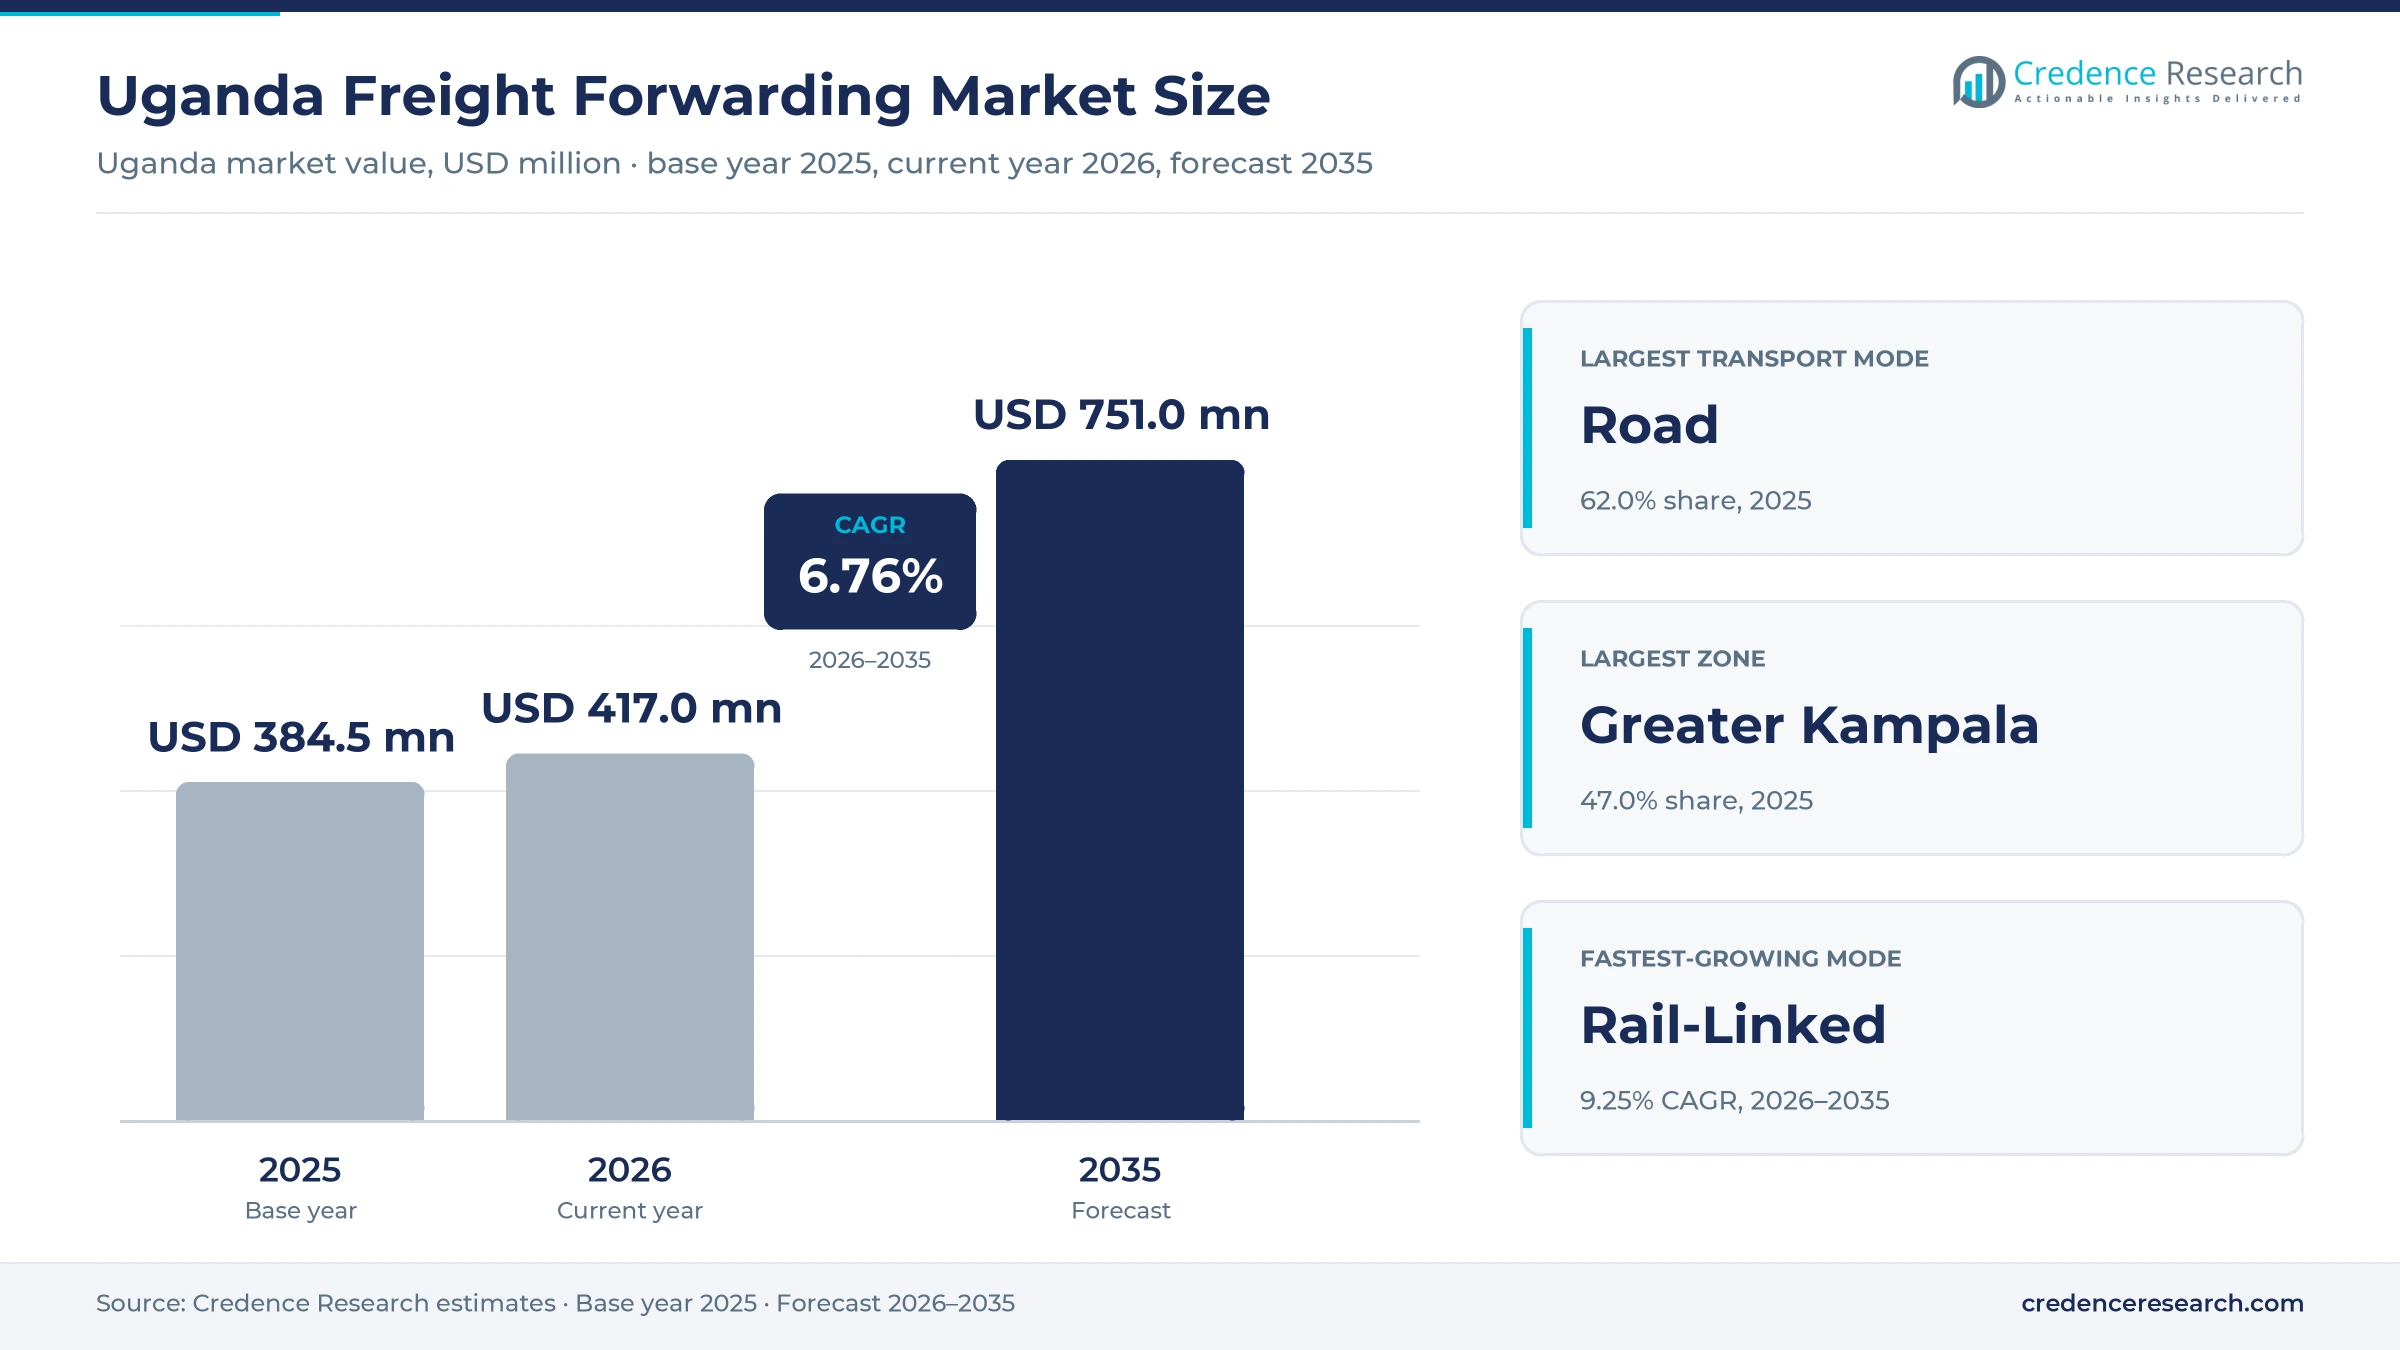
The Uganda freight forwarding market was valued at USD 384.5 million in 2025 and is projected to increase from USD 417.0 million in 2026 to USD 751.0 million by 2035, registering a CAGR of 6.76% during 2026–2035. Demand comes from importers of fuel, consumer goods, machinery and building materials, and from coffee and farm exporters who need customs clearance and through-transport between the coast and inland depots. Greater Kampala and Wakiso held the largest zone share, 47.0% in 2025, because most container depots, warehouses and head offices sit around Kampala and Namanve. The Albertine Graben is the fastest-growing zone at 8.20% a year, supported by oil field and pipeline construction cargo. Meanwhile, Mombasa handled record cargo in 2025, and new standard gauge railway projects are moving forward in Kenya, Uganda and Tanzania. As a result, demand is shifting toward forwarders that combine customs, trucking, rail and project cargo services.
Which clearing, booking and project services are counted?
The estimate counts fees earned in Uganda by freight forwarders, customs agents and logistics coordinators that arrange international and cross-border cargo moves. It covers customs brokerage and clearance, booking of sea, air, road and rail transport, consolidation, project cargo handling and related coordination for imports, exports and transit goods.
The estimate excludes the freight charges paid to shipping lines, airlines, railways and truck owners when they are passed through at cost, and it excludes port handling fees, duties and taxes. The value chain runs from shippers and consignees through forwarders and clearing agents to carriers, ports, inland depots and border posts.
Uganda Freight Forwarding Market Insights
- The market was valued at USD 384.5 million in 2025 and is projected to reach USD 751.0 million by 2035, registering a CAGR of 6.76% during 2026–2035.
- Greater Kampala and Wakiso held 47.0% of Ugandan value in 2025, because most inland container depots and importers are based there.
- Road freight forwarding led with 62.0% of 2025 value, as almost all sea cargo reaches Uganda by truck from Kenyan and Tanzanian ports.
- Mombasa handled a record 45.45 million metric tons of cargo in 2025, and Uganda-bound cargo reached 10.91 million metric tons.
- Uganda expected first oil by the end of July 2026, after drilling 198 Tilenga wells and 21 Kingfisher wells for its oil projects.
Road and import cargo lead while rail-linked moves grow
Why does international forwarding hold the largest share?
Based on service type, the market is categorized into customs brokerage and clearance, international freight forwarding, project cargo and heavy lift, consolidation and deconsolidation, and value-added logistics coordination. International Freight Forwarding led with 34.0% of 2025 value, because most shippers buy door-to-door moves from the coast. Project Cargo & Heavy Lift grows fastest at 7.59% a year, as oil, pipeline and rail projects need oversized cargo handling.
How do road, sea, air and rail moves compare?
Based on mode of transport, the market is categorized into road freight forwarding, ocean-linked multimodal forwarding, air freight forwarding and rail-linked multimodal forwarding. Road Freight Forwarding led with 62.0% of 2025 value, because trucks carry most cargo between Mombasa and Kampala. Rail-Linked Multimodal Forwarding grows fastest at 9.25% a year, as standard gauge railway links in Kenya and Uganda advance.
Which cargo flows generate the most forwarding fees?
Based on shipment flow, the market is categorized into import forwarding, export forwarding, transit and re-export forwarding, and domestic feeder and cross-border consolidation. Import Forwarding led with 58.0% of 2025 value, because Uganda buys fuel, machinery and consumer goods from overseas. Transit & Re-Export Forwarding grows fastest at 7.14% a year, as traders move goods onward to South Sudan, Congo and Rwanda.
Which industries use forwarders most?
Based on end-use industry, the market is categorized into FMCG and retail, manufacturing and industrial goods, agriculture and coffee exports, oil and gas and energy, and pharmaceuticals and healthcare. FMCG & Retail led with 30.0% of 2025 value, because consumer goods arrive in steady container flows. Oil & Gas & Energy grows fastest at 7.43% a year, as oil field and pipeline cargo rises.
| Segment Group | Leading Sub-segment | Share, 2025 | Fastest-growing Sub-segment | CAGR, 2026–2035 |
|---|---|---|---|---|
| By Service Type | International Freight Forwarding | 34.0% | Project Cargo & Heavy Lift | 7.59% |
| By Mode of Transport | Road Freight Forwarding | 62.0% | Rail-Linked Multimodal Forwarding | 9.25% |
| By Shipment Flow | Import Forwarding | 58.0% | Transit & Re-Export Forwarding | 7.14% |
| By End-Use Industry | FMCG & Retail | 30.0% | Oil & Gas & Energy | 7.43% |
Request a Free Sample
Fill in your details and we'll send you a free sample report.
- Sample data tables & charts
- Research methodology
Transit growth, imports and new rail lines lift demand
How does northern corridor transit growth lift cargo demand?
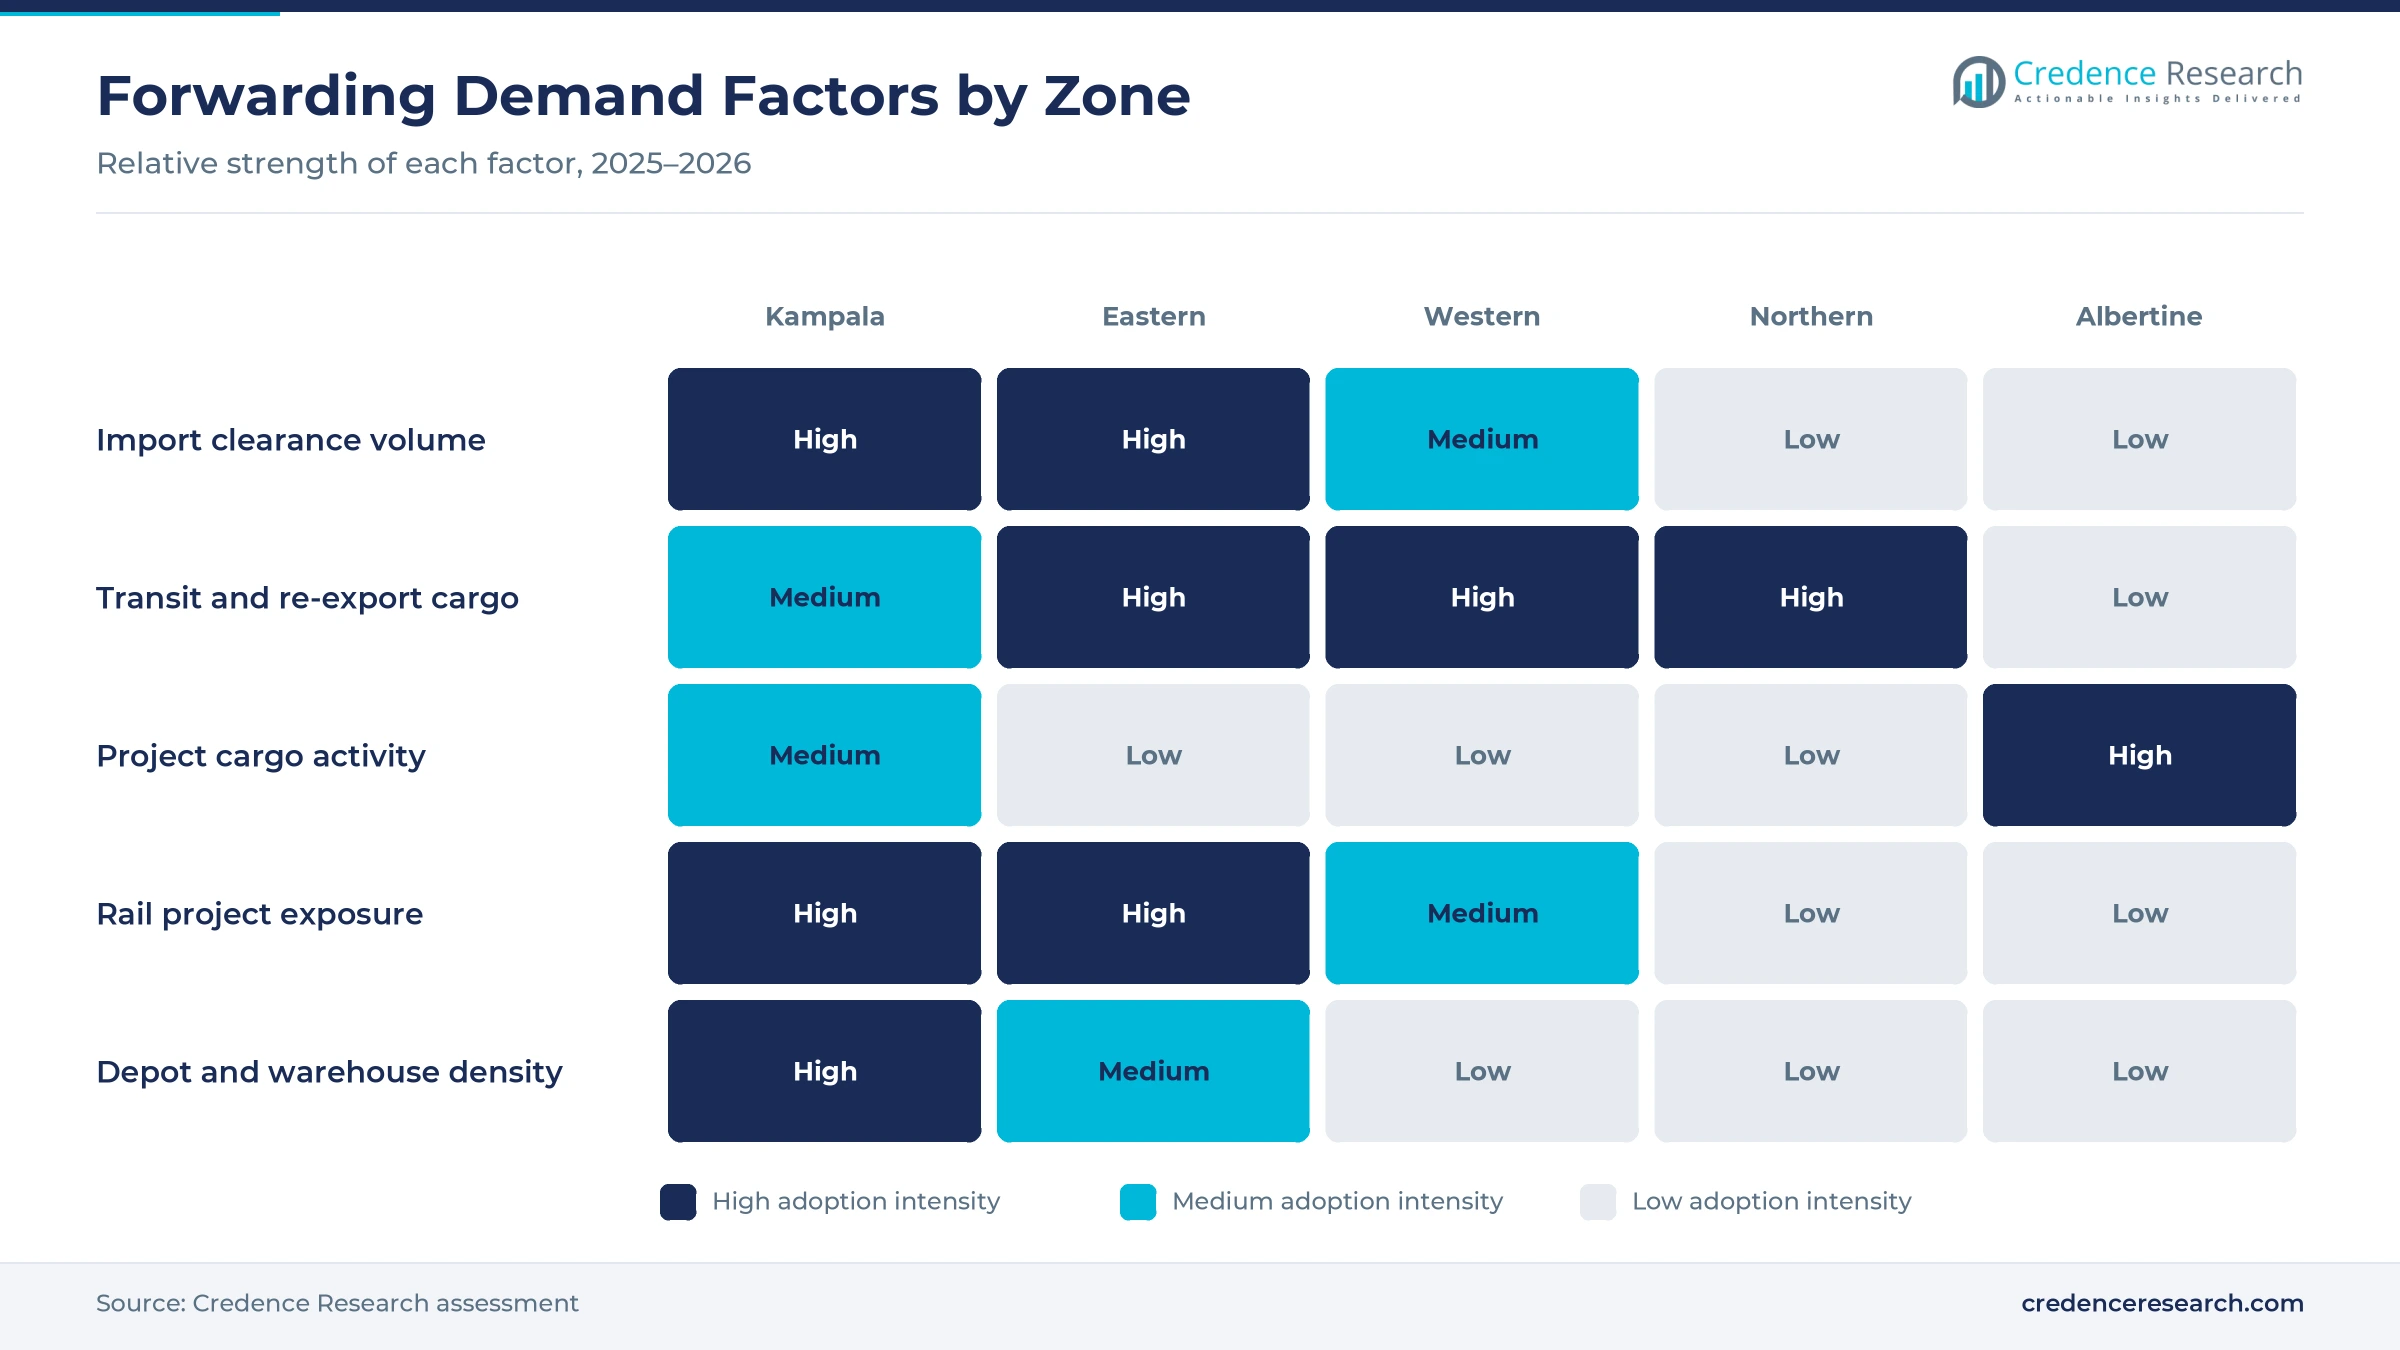
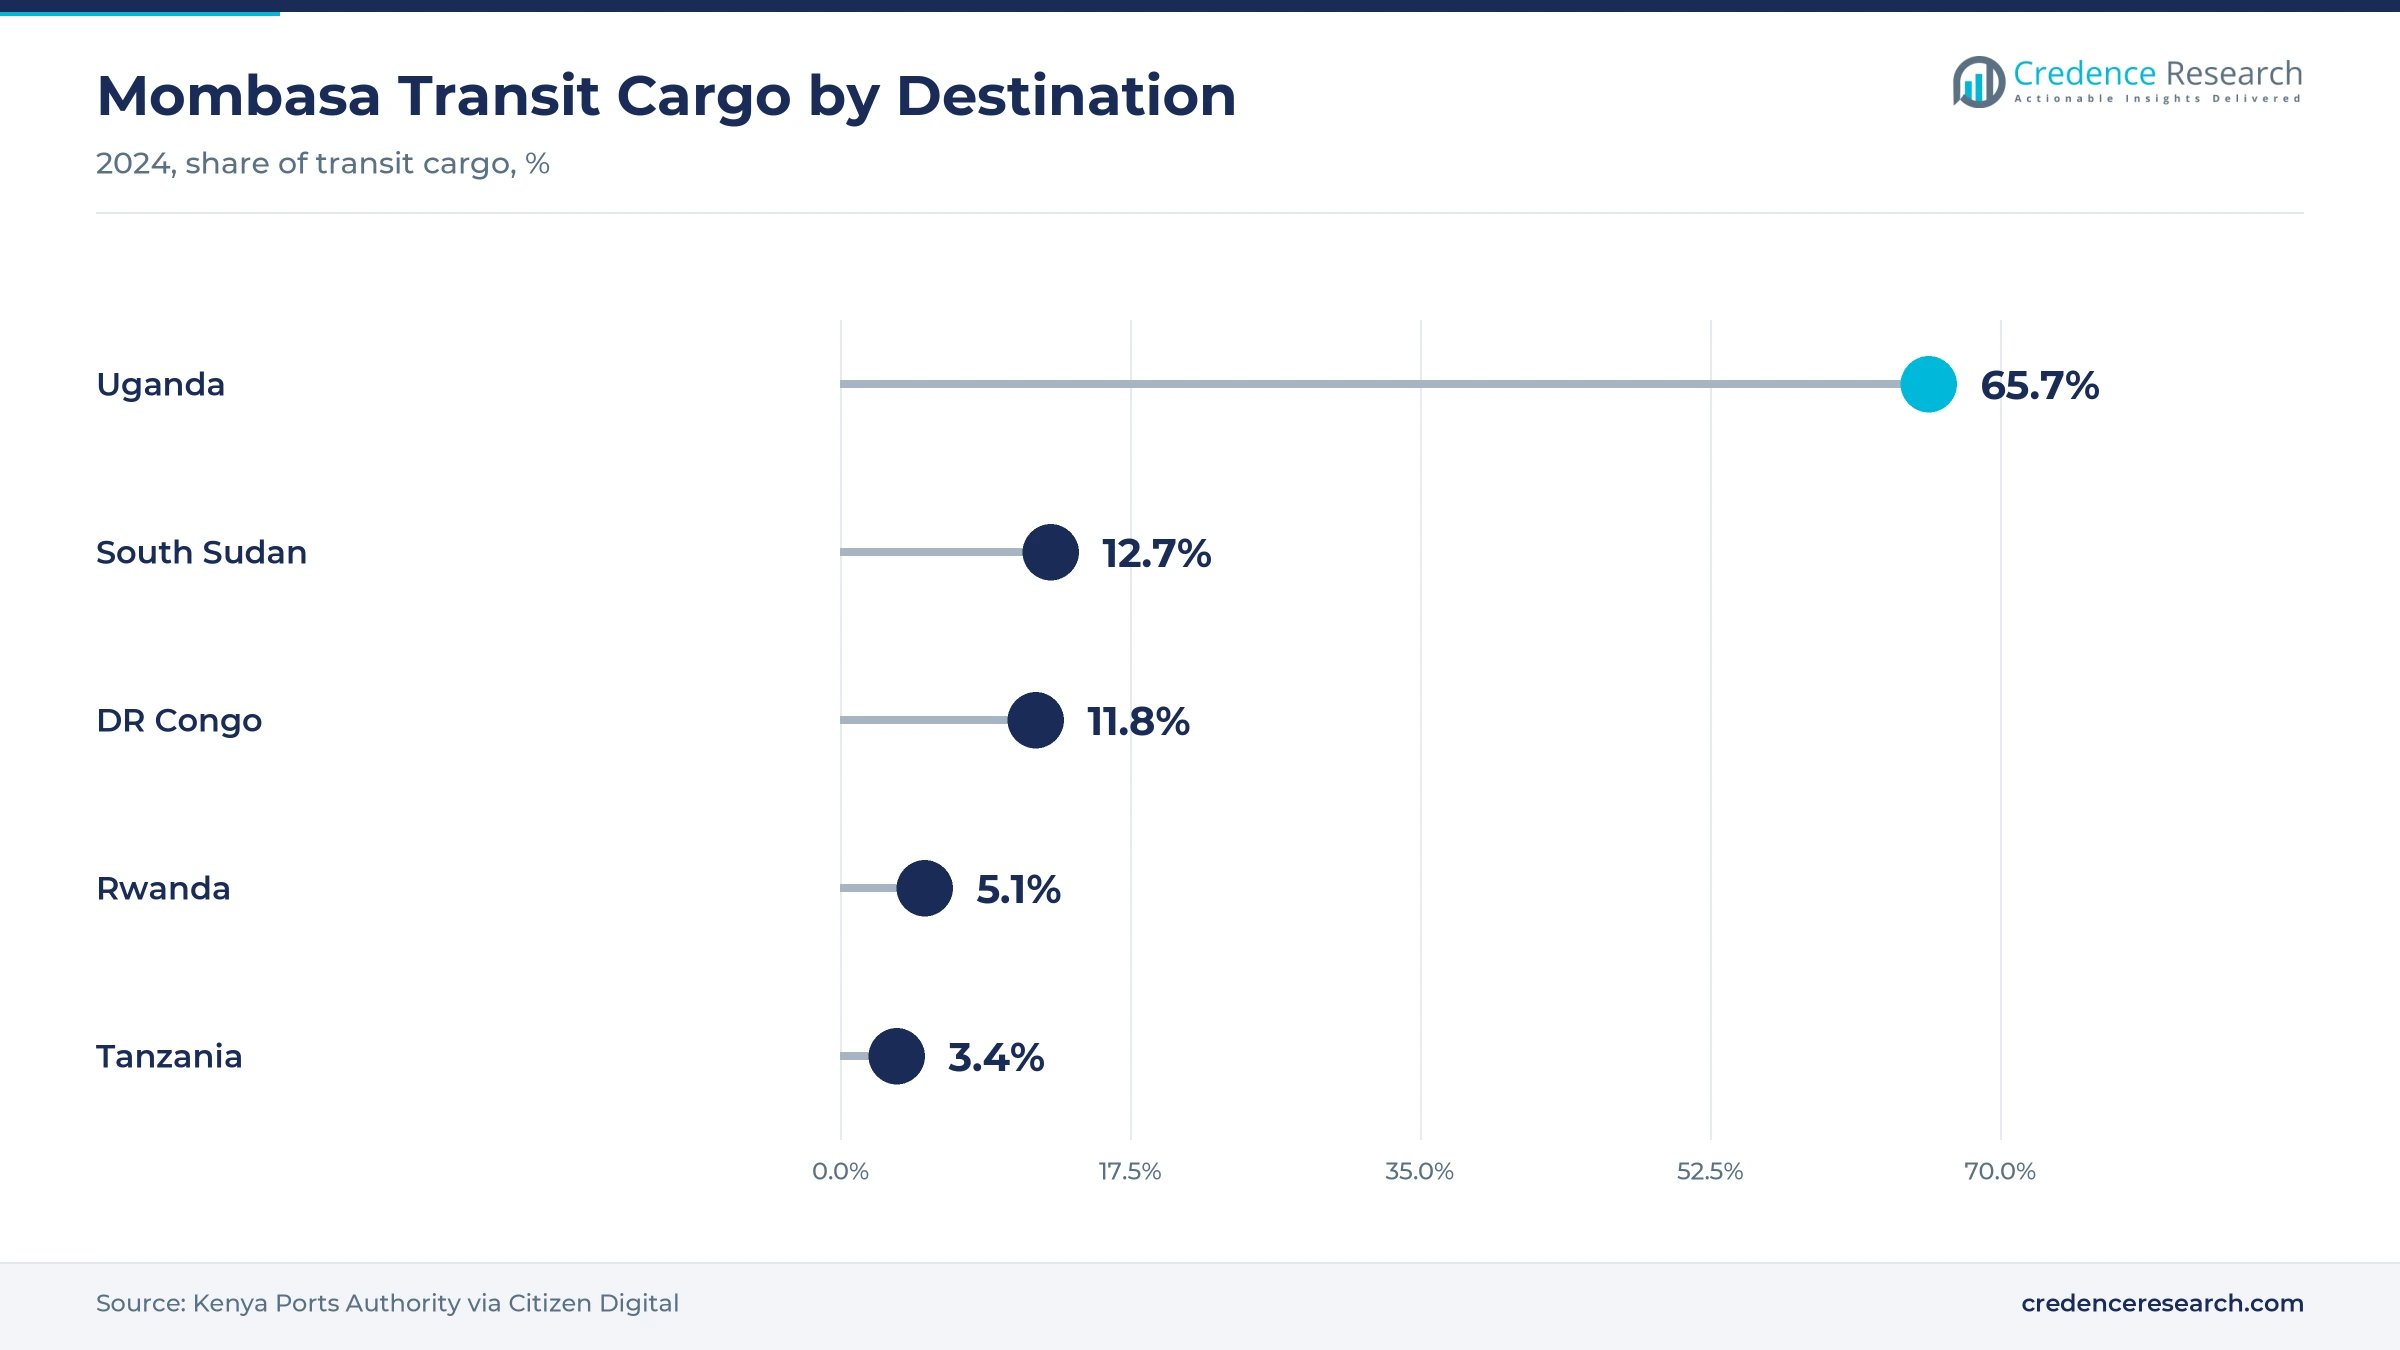
Northern Corridor transit growth is the core driver, because almost all Ugandan sea cargo moves through Mombasa and then by road to inland depots. Mombasa handled a record 45.45 million metric tons in 2025, up from 40.99 million metric tons, and transit cargo rose to 15.88 million metric tons, according to The Star. Uganda-bound cargo reached 10.91 million metric tons, and Uganda accounts for more than 65% of transit cargo at the port. Container traffic at the port also rose 5.5% to 2.11 million TEUs during the same year. As a result, road freight forwarding held a 62.0% share of 2025 value, the largest mode in the Uganda freight forwarding market.
Why does an import-led economy need more forwarding?
An import-led economy needs more forwarding, because Uganda buys most fuel, machinery, vehicles and consumer goods from overseas and must clear each shipment. Uganda's GDP reached about $62.0 billion in 2025, up from $53.9 billion in 2024, according to World Bank data. About 95% of petroleum products, roughly 2.96 billion liters a year, still arrive through Mombasa. The Uganda Revenue Authority also collected UGX 31.63 trillion in 2024/25, above its target of UGX 31.37 trillion, with customs duties on imports among its main revenue sources. Therefore, import forwarding held a 58.0% share of 2025 value, the largest shipment flow in the market.
How do rail lines and inland depots change cargo moves?
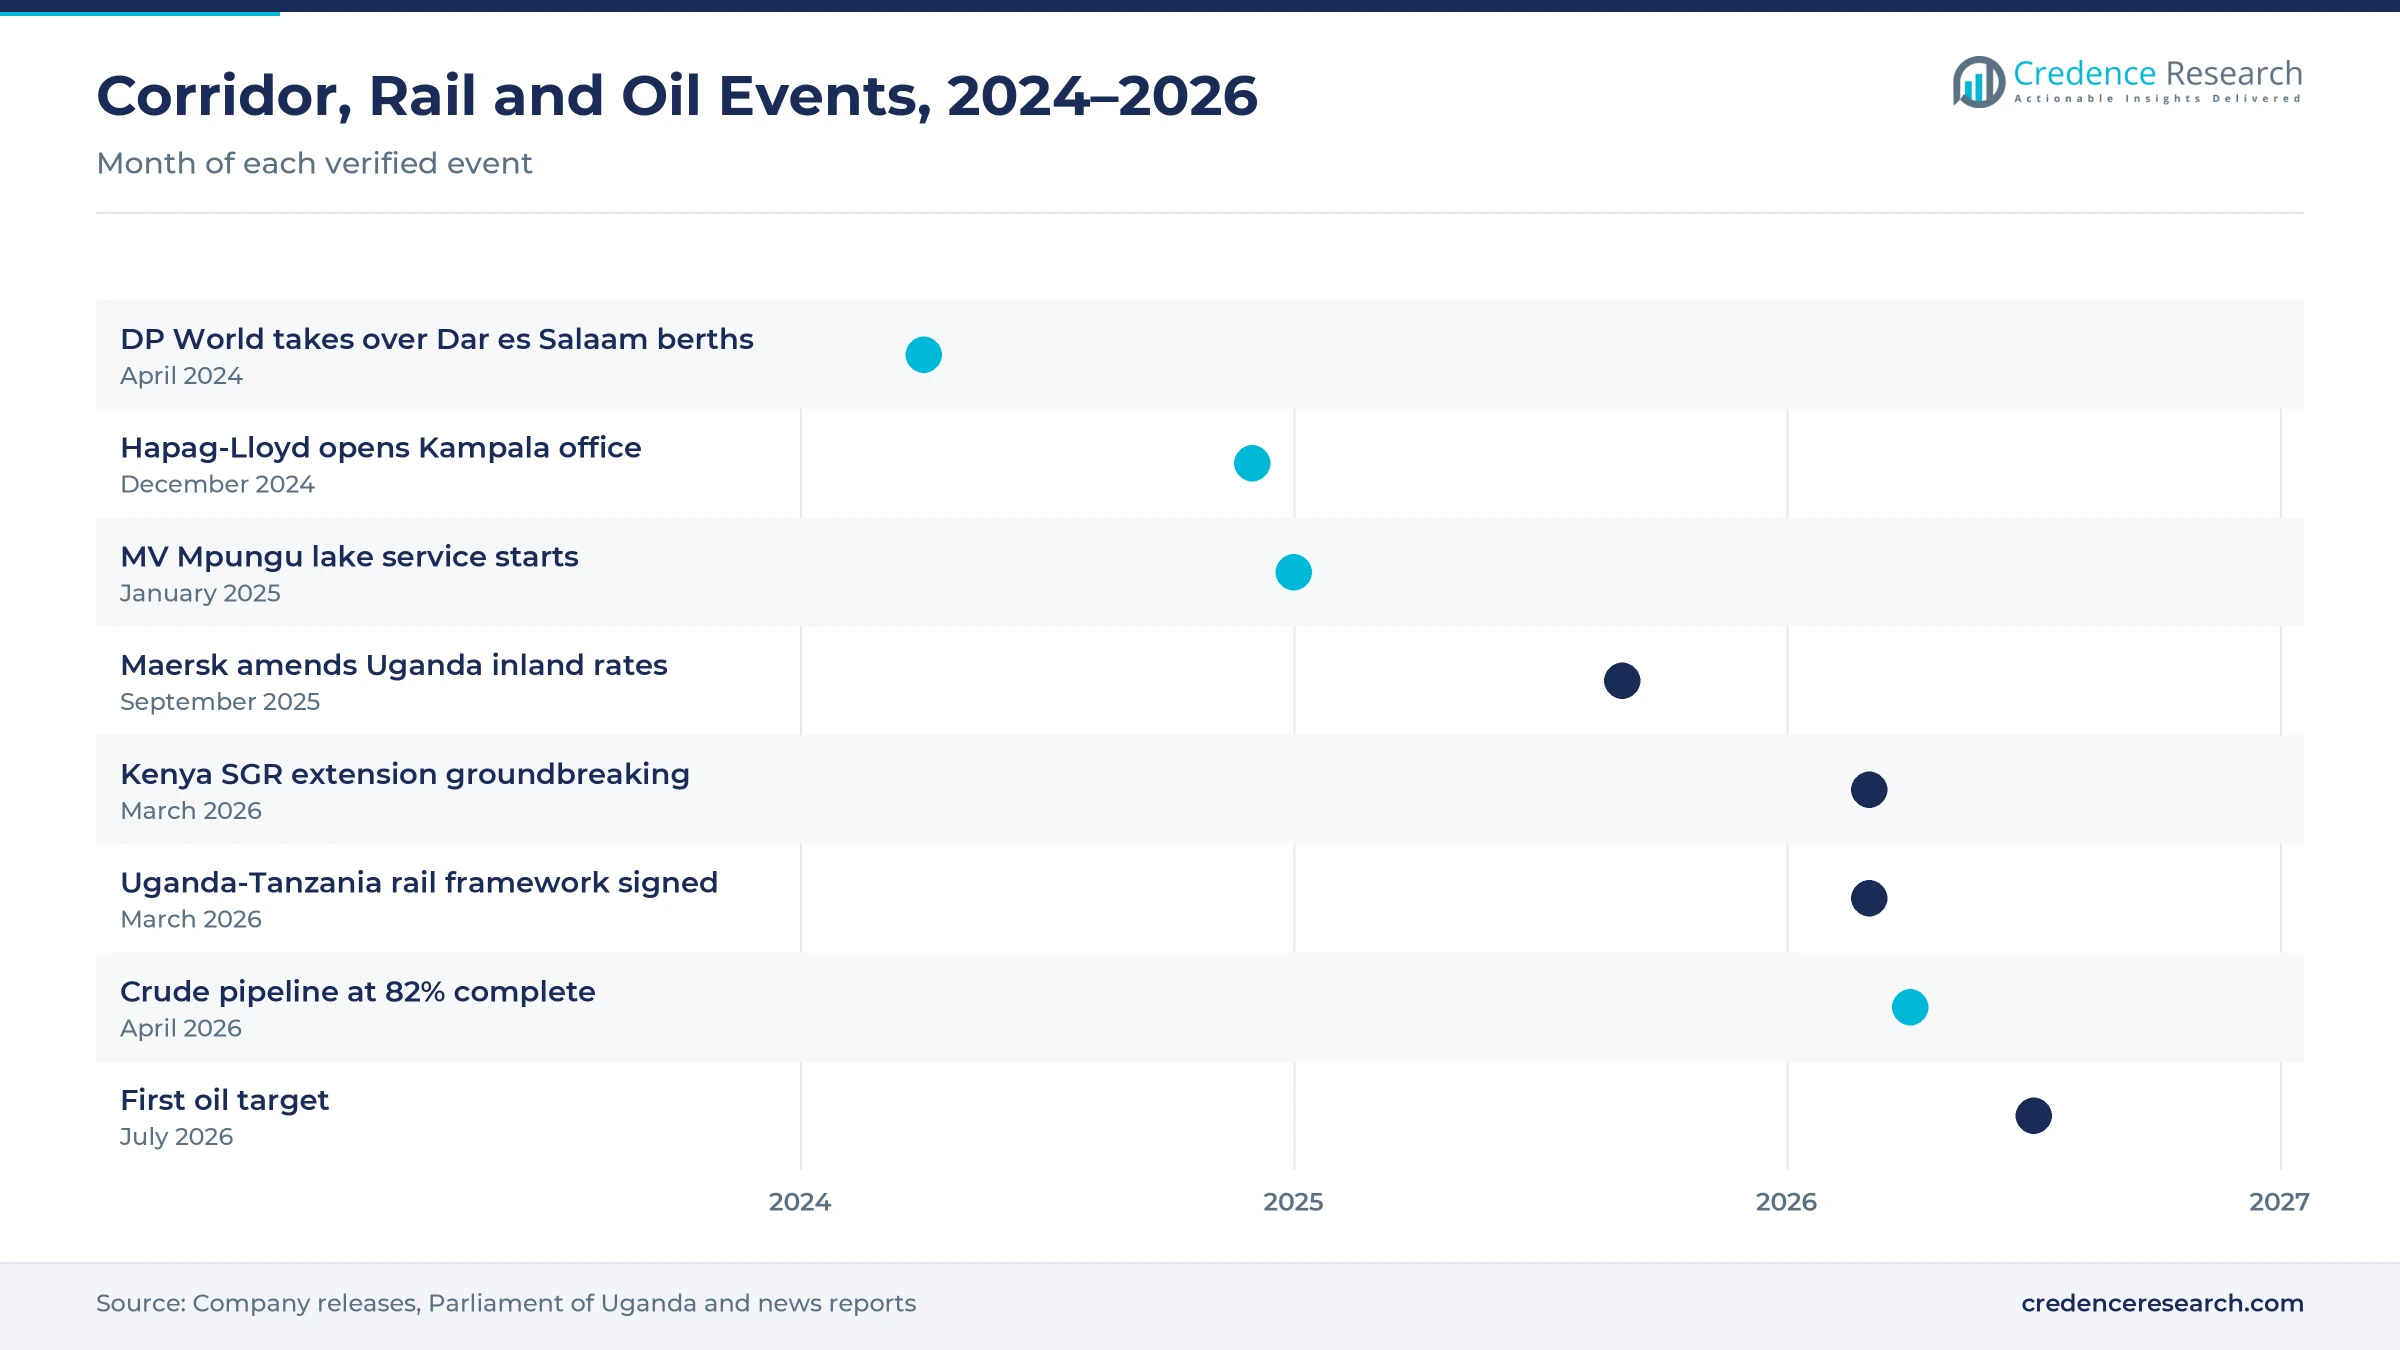
Multimodal and industrial infrastructure is changing cargo moves, because new railways and inland depots cut trucking distances and open rail-linked services. Uganda's 273 km Malaba-Kampala standard gauge railway is costed at 2.7 billion euros, with Yapi Merkezi as contractor and completion projected for 2028. Kenya broke ground on the 475 km Naivasha-Kisumu-Malaba line in March 2026. Uganda and Tanzania also signed a framework agreement on March 13, 2026, for a railway from Isaka to Mpondwe, according to the Monitor. In turn, rail-linked multimodal forwarding grows at 9.25% a year, the fastest mode in the market, as forwarders prepare rail contracts with importers.
Do oil projects create new project cargo demand?
Oil projects create new project cargo demand, because wells, processing plants and the export pipeline need heavy equipment, pipe and camp supplies. Uganda had drilled 198 wells at Tilenga against 170 needed for first oil, and 21 wells at Kingfisher against 19, according to the Parliament of Uganda in March 2026. About $3.5 billion had been spent on the export pipeline by then. The 1,443 km pipeline reached 82% completion in April 2026. Consequently, project cargo and heavy lift grows at 7.59% a year, the fastest service type, and specialist agents with permits and escorts move heavy lifting equipment to the oil fields.
Second sea routes, oil cargo and coffee reshape flows
Why is a second route through Dar es Salaam emerging?
A second route through Dar es Salaam is emerging, because Tanzania has improved port speed and opened lake and rail links. DP World has operated berths 0 to 7 at Dar es Salaam since April 2024, and monthly throughput rose from 13,779 TEUs in May 2024 to 48,793 TEUs in August 2026. Since January 2025, the MV Mpungu has carried up to 1,000 metric tons between Mwanza and Port Bell in about 18 hours. However, Tanzanian ports handled only about 47,600 metric tons of Ugandan cargo in 2025. Therefore, forwarders that offer both corridors can win shippers looking for backup routes for shipping containers and bulk cargo.
How is coffee export growth shifting outbound cargo?
Coffee export growth is shifting outbound cargo, because record harvests and prices raised the number of containers leaving Uganda. Coffee export earnings reached $2.2 billion in 2024/25, doubling from $1.14 billion a year earlier, according to Ecofin Agency. Export volumes grew 25% to 7.7 million bags, or about 462,000 metric tons. Most of this coffee moves by truck to Mombasa in containers and needs phytosanitary and customs documents. As a result, export forwarding grows faster than imports, and agents serving specialty coffee buyers add warehousing and quality checks at origin, while export forwarding fees rise with each additional container booked.
Can the oil export phase open new forwarding work?
The oil export phase can open new forwarding work after construction, because production brings steady flows of spare parts, chemicals and services. Uganda set the end of July 2026 as its target for first oil, and the pipeline tariff is set at $12.77 per barrel shipped. Close to $12.3 billion had been spent in the sector through 2025. Kabalega International Airport in Hoima was expected to be commissioned in January 2027, giving the oil region its own air link. Therefore, the Albertine Graben is the fastest-growing zone, and forwarders with air cargo and heavy road teams can build long-term contracts.
Will carrier and depot investment open integrated services?
Carrier and depot investment opens a second opportunity for local partners, because shipping lines and port groups are building their own inland networks in Uganda. AGL inaugurated a container depot in Namanve on Nov. 9, 2023, with warehouses on about 10 acres. Hapag-Lloyd opened a Kampala office on Dec. 2, 2024, calling the city a hub for 5 neighboring countries. Maersk lists 3 Kampala inland container depots, including APMT ICD and Spedag ICD, for its truck services. As a result, value-added logistics coordination gains share as integrated door-to-door offers replace separate clearing, trucking and storage contracts held by importers and exporters.
Long road times, costs and project delays test agents
How do long road transit times raise costs?
Long road transit times raise costs, because trucks between Mombasa and Kampala averaged about 109 hours in 2023. Delays at weighbridges, borders and depots tie up containers and drivers. As a result, shippers pay more for demurrage and inventory, and small forwarders lose margin on fixed-price quotes. Electronic cargo tracking, joint border posts and faster rail links can reduce these delays over time if governments keep investing in them.
Why do port tariff changes affect forwarders?
Port tariff changes affect forwarders, because many quotes bundle sea freight, port charges and inland haulage. Maersk amended its inland haulage rates for Uganda locations from Sept. 15, 2025, citing changes in the Kenya Ports Authority tariff. Such changes can wipe out the margin on contracts signed earlier. Therefore, forwarders add surcharge clauses and review rates more often with importers and exporters.
Do rail project delays hold back multimodal services?
Rail project delays hold back multimodal services, because forwarders cannot plan rail contracts until lines are finished. Uganda had secured land for about 150 km of the Malaba-Kampala route by August 2025, and talks with earlier lenders had collapsed. The Islamic Development Bank later approved 650.75 million euros toward the line. In turn, road remains the main mode for most cargo during the rest of the decade.
How does competition from informal agents affect margins?
Competition from informal and small clearing agents affects margins, because many shippers choose the lowest fee for simple customs entries. Price pressure is strongest in Kampala, where many agents compete for the same importers. As a result, larger forwarders focus on contract logistics, project cargo and compliance services, while smaller firms often merge, specialize in one trade lane or work as subcontractors for global networks.
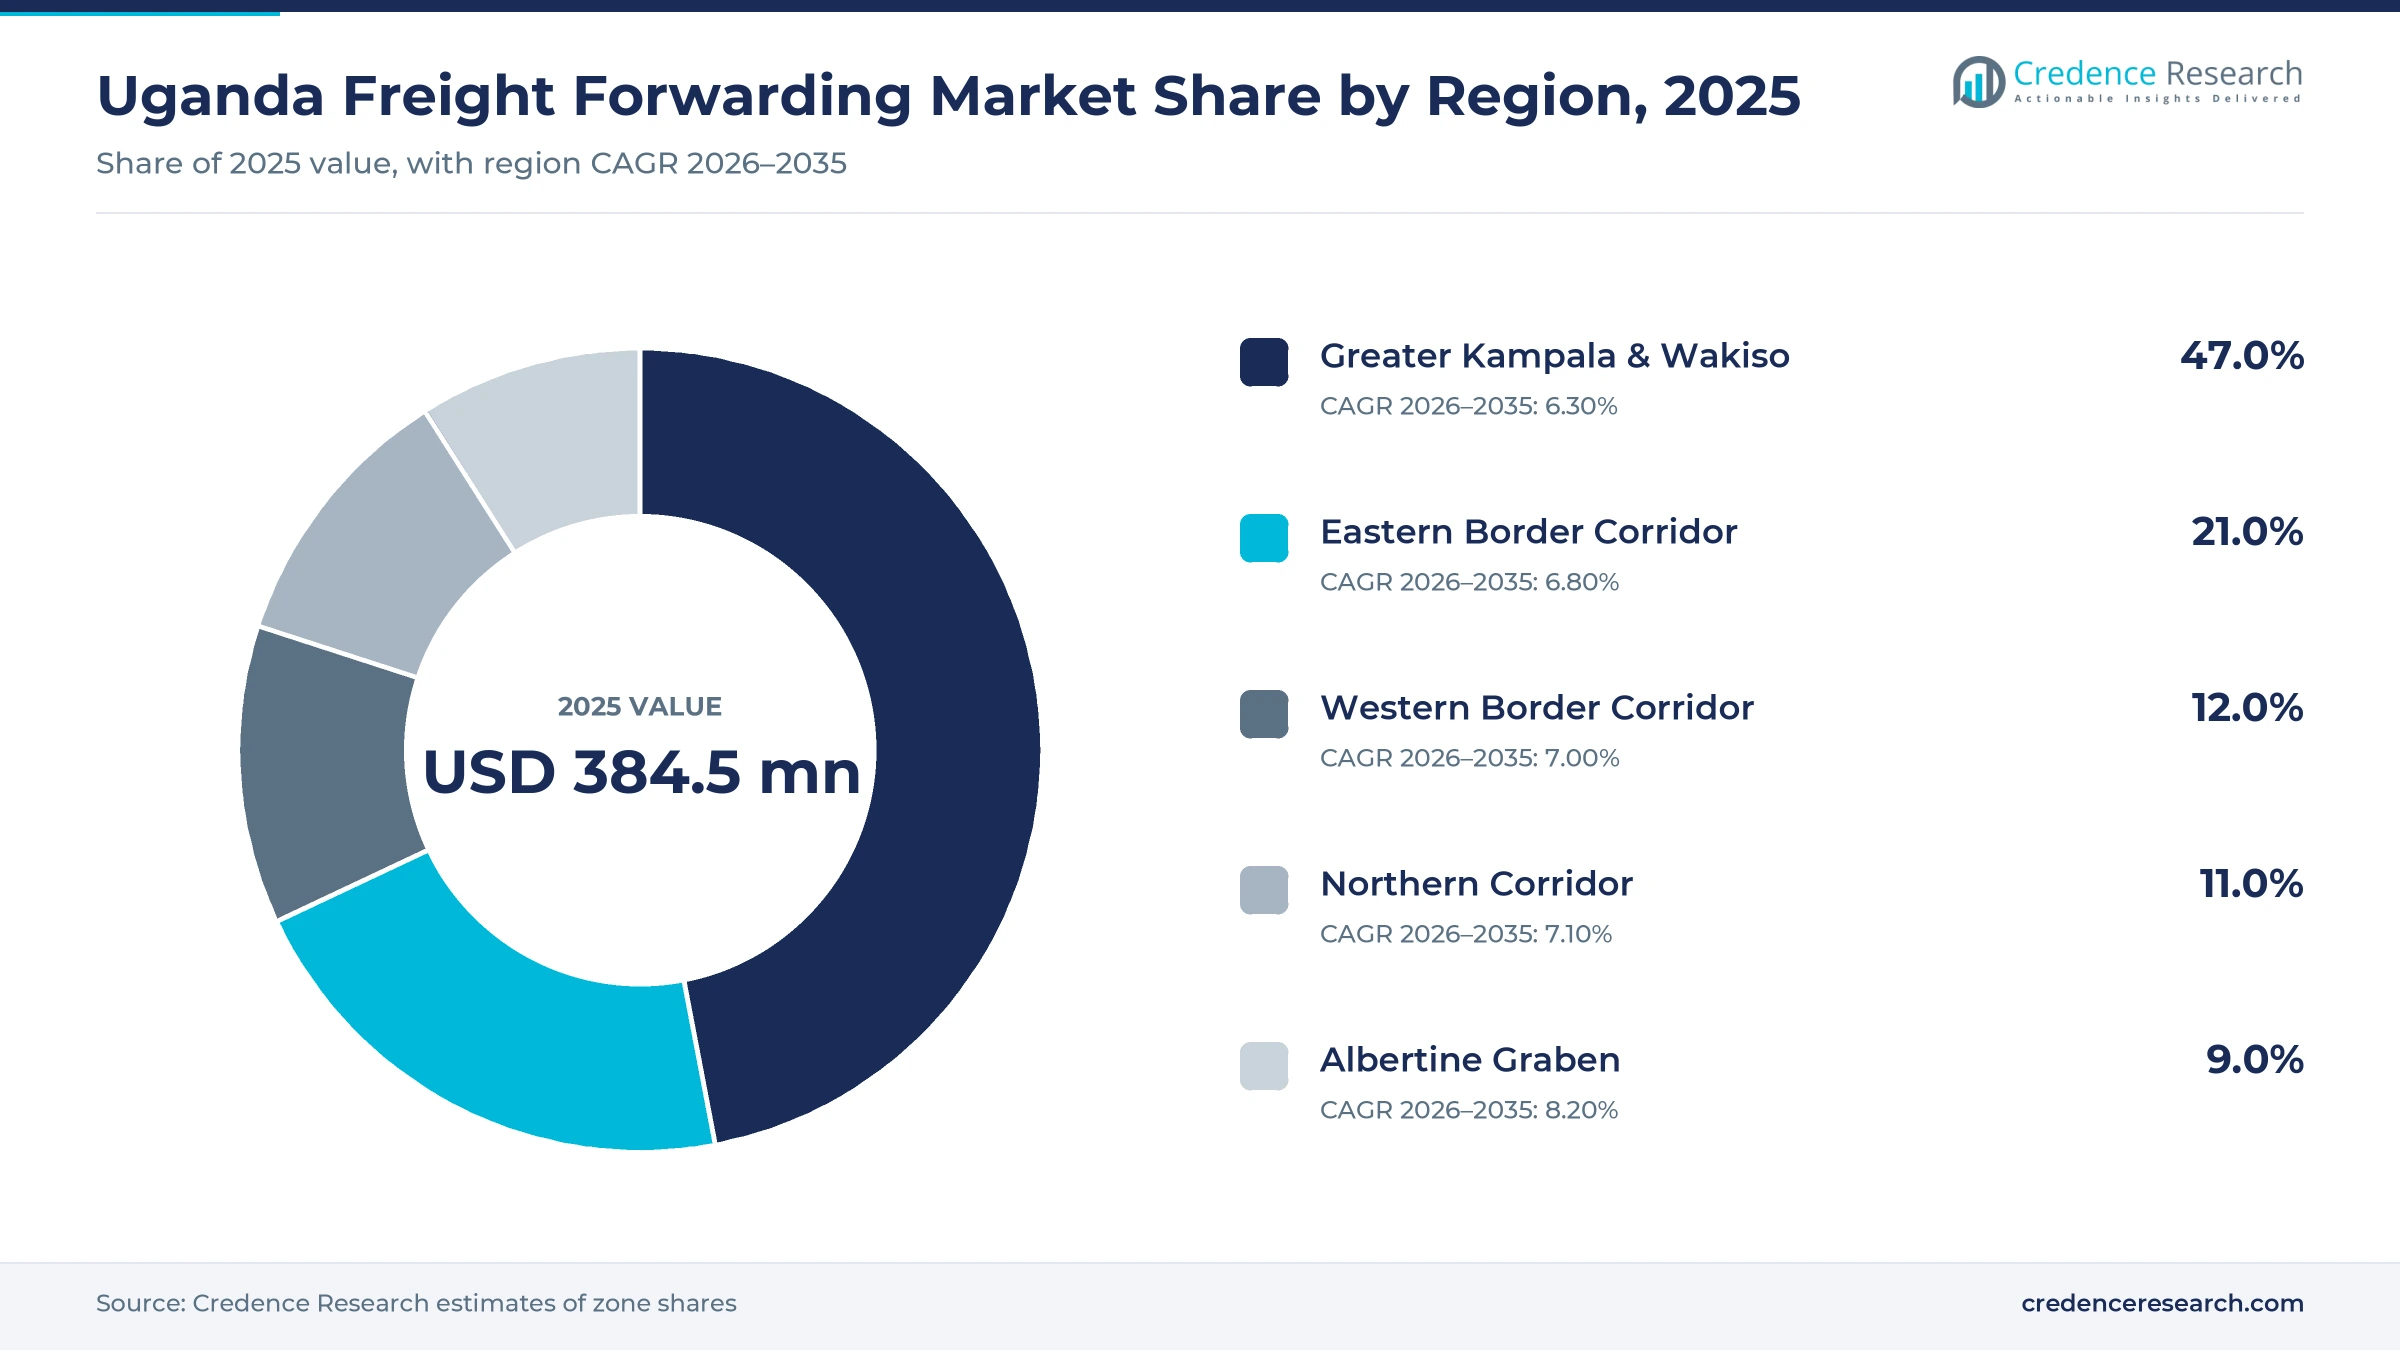
Greater Kampala leads while the Albertine Graben grows
| Region | Value, 2025 (USD million) | Share, 2025 | CAGR, 2026–2035 |
|---|---|---|---|
| Greater Kampala & Wakiso | 180.7 | 47.0% | 6.30% |
| Eastern Border Corridor | 80.7 | 21.0% | 6.80% |
| Western Border Corridor | 46.1 | 12.0% | 7.00% |
| Northern Corridor | 42.3 | 11.0% | 7.10% |
| Albertine Graben | 34.6 | 9.0% | 8.20% |
Why does Greater Kampala and Wakiso lead demand?
Greater Kampala and Wakiso held a 47.0% share of 2025 zone value and grows at 6.30% a year. Most inland container depots, bonded warehouses and importer head offices are in Kampala, Namanve and nearby industrial parks. AGL opened its Namanve depot in 2023, and Maersk serves 3 Kampala depots. Entebbe airport also handles most air cargo, so the zone dominates clearance work for consumer goods, medicines and machinery bought by Kampala distributors.
How does the Eastern Border Corridor serve trade?
The Eastern Border Corridor held a 21.0% share of 2025 zone value and grows at 6.80% a year. Malaba and Busia are the main road crossings from Kenya, and Tororo and Jinja host industry and fuel depots. The planned Malaba-Kampala standard gauge railway also starts in this border zone. Therefore, clearing agents at the border handle a large share of transit and import entries before trucks continue to Kampala, and fuel tankers clear here for depots across the country.
What drives demand in the Western border corridor?
The Western Border Corridor held a 12.0% share of 2025 zone value and grows at 7.00% a year. Crossings toward Congo and Rwanda carry re-export cargo, fuel and consumer goods. The planned Isaka-Mpondwe railway would end at the Congo border in this zone. As a result, forwarders here focus on transit documents, bonded trucking and cross-border consolidation for traders, as well as clearance for goods bought in Kampala and trucked onward to Goma and Kigali.
How does the northern corridor zone link South Sudan?
The Northern Corridor zone accounted for 11.0% of 2025 zone value and grows at 7.10% a year. Roads through Gulu toward South Sudan carry food, fuel and building materials. South Sudan took 12.7% of Mombasa transit cargo in 2024, and much of it crosses northern Uganda.
Why is the Albertine Graben growing fastest?
The Albertine Graben held a 9.0% share of 2025 zone value and grows at 8.20% a year, the fastest zone. The Tilenga and Kingfisher oil projects and the export pipeline need heavy equipment, pipe and camp supplies. Kabalega airport in Hoima will add an air link for the oil region.
Port, rail, oil and carrier moves from 2024 to 2026
| Development | Status and market relevance |
|---|---|
| In April 2024, DP World began operating berths 0 to 7 at Dar es Salaam under a 30-year concession, later cutting vessel turnaround sharply. | Gives Ugandan shippers a faster alternative port |
| In December 2024, Hapag-Lloyd opened an office in Kampala to serve customers in Uganda and neighboring countries. | Adds a global carrier presence in the Ugandan market |
| In January 2025, the MV Mpungu began carrying up to 1,000 metric tons between Mwanza and Port Bell on Lake Victoria. | Cuts the Tanzania to Kampala crossing to about 18 hours |
| In March 2026, Uganda and Tanzania signed a framework agreement for a standard gauge railway from Isaka to Mpondwe. | Opens a planned rail link from the Central Corridor to western Uganda |
| In April 2026, the 1,443 km East African Crude Oil Pipeline reached 82% overall completion. | Supports project cargo demand ahead of oil exports |
Electronic customs, tracking and inland depots ahead
- Electronic customs systems let agents lodge declarations and pay duties online, which cuts clearance time at borders and inland depots.
- Electronic cargo tracking follows transit trucks from Mombasa to destination, which reduces diversion risk and supports faster bond release.
- Inland container depots in Kampala and Namanve let shippers clear cargo near customers, which shortens truck trips and storage time.
- Online rate and booking tools from carriers give importers inland prices and surcharges in advance, which raises pressure on forwarder margins.
Need a Custom Version of This Report?
Tailor the scope, geography, or segments to your exact requirements.
- Custom geography or segment scope
- Direct access to our analyst team
Global carriers compete with local clearing agents
Competition combines global carriers and logistics groups with many local clearing and forwarding agents. Africa Global Logistics runs a container depot in Namanve, Wakiso district, that it inaugurated in November 2023 with warehouses on about 10 acres. Maersk offers truck services from Kampala inland container depots, and Hapag-Lloyd opened a Kampala office in 2024. DP World now runs the main container terminal at Dar es Salaam, which affects routing choices for Ugandan cargo. DHL Global Forwarding, Kuehne+Nagel, CEVA Logistics, Unifreight, Threeways Shipping, Upstream Logistics, Freight In Time and Trident Freight were not verified in this run, so they are not profiled here. Forwarders compete on corridor transit times, customs expertise, project cargo capability and price.
Companies profiled and their roles in this market
| Company | Type | Role in the market |
|---|---|---|
| Africa Global Logistics (AGL) Uganda | Integrated logistics group | Namanve container depot with warehouses on about 10 acres |
| Maersk Logistics Uganda | Carrier-backed logistics provider | Truck services from Kampala inland container depots |
| Hapag-Lloyd | Container shipping line | Kampala office opened in December 2024 as a regional hub |
| DP World | Port operator | Operates berths 0 to 7 at Dar es Salaam since April 2024 |
Credence Research view on growth and risk
Credence Research's view is that Ugandan freight forwarding demand will grow faster than the wider economy, because imports, transit trade and oil projects all add cargo. Road forwarding will remain the base of the market, while rail-linked and project cargo services gain share as new lines and oil fields open. However, long road times, tariff changes and rail delays remain risks, so growth will favor forwarders with corridor depth, customs skills and heavy cargo teams.
Model inputs behind the cargo fee estimate
The report uses 2025 as the base year on a calendar basis, with values in USD million at current prices. Market values come from the Credence Research model, which links import and export volumes, transit cargo and average forwarding fees by service. Zone shares, segment splits and growth rates are Credence Research estimates. Sources used are World Bank data, port and government statements reported in news media, Parliament of Uganda releases and company announcements, and no interviews or surveys were used.
Rail links and oil exports shape 2035 cargo demand
Uganda freight forwarding revenue is expected to reach USD 751.0 million by 2035, a 6.76% CAGR during 2026–2035, as cargo through Mombasa and Dar es Salaam keeps rising. Growth should be strongest in the late 2020s as oil projects move equipment and the Kenyan and Ugandan railways advance. After that, oil exports, rail-linked services and transit trade to neighboring countries should keep demand rising. Rail delays or weaker imports could slow some years, while faster corridors would lower costs for shippers.
Frequently Asked Questions
How big is the Uganda freight forwarding market?
Which zone leads freight forwarding demand in Uganda?
Which transport mode holds the largest share?
How important is the port of Mombasa for Ugandan cargo?
Which zone grows fastest through 2035?
How do new railways affect freight forwarding?
Which companies compete in this market?
What are the main risks for forwarders?
Table of Content
Chapter 1 Market Segmentation
- 1.1 Segmentation Framework
- 1.1.1 Product and Service Classification
- 1.1.2 Application and End-Use Classification
- 1.1.3 Technology and Solution Classification
- 1.1.4 Customer and Distribution Channel Classification
- 1.1.5 Geographic Segmentation
- 1.1.6 Market Segment Definitions and Boundaries
- 1.2 By Service Type
- 1.2.1 International Freight Forwarding
- 1.2.2 Customs Brokerage & Clearance
- 1.2.3 Project Cargo & Heavy Lift
- 1.2.4 Consolidation & Deconsolidation
- 1.2.5 Value-Added Logistics Coordination
- 1.3 By Mode of Transport
- 1.3.1 Road Freight Forwarding
- 1.3.2 Ocean-Linked Multimodal Forwarding
- 1.3.3 Air Freight Forwarding
- 1.3.4 Rail-Linked Multimodal Forwarding
- 1.4 By Shipment Flow
- 1.4.1 Import Forwarding
- 1.4.2 Export Forwarding
- 1.4.3 Transit & Re-Export Forwarding
- 1.4.4 Domestic Feeder & Cross-Border Consolidation
- 1.5 By End-Use Industry
- 1.5.1 FMCG & Retail
- 1.5.2 Manufacturing & Industrial Goods
- 1.5.3 Oil & Gas & Energy
- 1.5.4 Agriculture & Coffee Exports
- 1.5.5 Pharmaceuticals & Healthcare
Chapter 2 Introduction
- 2.1 Report Objectives and Scope
- 2.2 Product Definition and Industry Terminology
- 2.3 Market Inclusions and Exclusions
- 2.4 Research Process
- 2.4.1 Primary Research and Expert Interviews
- 2.4.2 Secondary Research and Source Review
- 2.4.3 Top-Down and Bottom-Up Estimation
- 2.4.4 Data Triangulation and Verification
- 2.5 Market Size Measurement Basis
- 2.5.1 2025: USD 384.5 million → 2035: USD 751.0 million
- 2.6 Historical and Forecast Reference Periods
- 2.6.1 Historical Period: 2018-2025
- 2.6.2 Base Year: 2025
- 2.6.3 Forecast Period: 2025-2035
- 2.7 Research Assumptions and Limitations
Chapter 3 Executive Summary
- 3.1 Market Snapshot and Key Findings
- 3.2 Base-Year Market Size, 2025
- 3.3 Forecast Market Size, 2035
- 3.4 Revenue and Volume Growth Outlook
- 3.5 Key Demand and Supply Indicators
- 3.6 Leading Market Segments
- 3.7 Fastest-Growing Market Opportunities
- 3.8 Regional Performance Highlights
- 3.9 Technology and Industry Transformation
- 3.10 Competitive Landscape Summary
- 3.11 Analyst View and Strategic Implications
Chapter 4 Uganda Freight Forwarding Market Trends and Developments
- 4.1 Historical Industry Development, 2018-2025
- 4.2 Recent Market Trends and Developments
- 4.3 Demand and Customer Behavior Trends
- 4.4 Technology and Product Innovation
- 4.5 Artificial Intelligence, Automation and Digitalization
- 4.6 Local Manufacturing and Supply Chain Realignment
- 4.7 Industry Partnerships, Mergers and Acquisitions
- 4.8 Sustainability and Circular Economy Developments
- 4.9 Government and Private Sector Investment Trends
- 4.10 Emerging Business Models and Commercialization
- 4.11 Industry Developments and Announcements
Chapter 5 Uganda Freight Forwarding Market Production, Supply and Demand Analysis
- 5.1 Demand Trend and Consumption Analysis, 2018-2025
- 5.2 Demand Forecast, 2025-2035
- 5.3 Production and Output Trend, 2018-2025
- 5.4 Production and Output Forecast, 2025-2035
- 5.5 Installed Capacity and Capacity Utilization
- 5.6 Company-Wise Production Plants and Statistics
- 5.6.1 Installed Production Capacity
- 5.6.2 Actual Production
- 5.6.3 Planned Capacity and Expansion Targets
- 5.7 Supply Chain Structure and Procurement Trends
- 5.8 Supply-Demand Gap and Bottlenecks
- 5.9 Import Dependence and Sourcing Structure
- 5.10 Contract Manufacturing and Outsourcing
- 5.11 Regional Supply and Demand Concentration
Chapter 6 Uganda Freight Forwarding Market Pricing Analysis
- 6.1 Pricing Structure and Measurement
- 6.2 Historical Pricing Trends, 2018-2025
- 6.3 Pricing Outlook, 2025-2035
- 6.4 Average Selling Price and Unit Economics
- 6.5 Pricing by Product and Market Segment
- 6.6 Geographic Pricing Differences
- 6.7 Key Input, Energy, Labor and Logistics Costs
- 6.8 Contract Pricing and Purchasing Models
- 6.9 Pricing Sensitivity and Competitive Positioning
- 6.10 Price, Margin and Profitability Implications
Chapter 7 Uganda Freight Forwarding Market Dynamics
- 7.1 Market Growth Drivers
- 7.1.1 Demand-Side Drivers
- 7.1.2 Technology and Innovation Drivers
- 7.1.3 Infrastructure and Investment Drivers
- 7.1.4 Regulatory and Policy Drivers
- 7.2 Market Restraints
- 7.2.1 Cost and Affordability Constraints
- 7.2.2 Technology and Adoption Barriers
- 7.2.3 Supply Chain and Operational Constraints
- 7.3 Market Challenges
- 7.3.1 Competitive Pressure and Margin Erosion
- 7.3.2 Skills, Infrastructure and Implementation Gaps
- 7.4 Emerging Market Opportunities
- 7.5 Market Dynamics Impact and Time-Horizon Assessment
Chapter 8 Uganda Freight Forwarding Value Chain Analysis
- 8.1 Industry Value Chain Overview
- 8.2 Upstream Suppliers and Critical Inputs
- 8.3 Technology and Component Providers
- 8.4 Manufacturing or Service Delivery
- 8.5 Distribution, Channel Partners and Integrators
- 8.6 Downstream Applications and End Users
- 8.7 Value Addition and Profit Pools
- 8.8 Vertical Integration and Outsourcing
- 8.9 Supplier Concentration and Risk
- 8.10 Supply Chain Localization and Resilience
Chapter 9 Uganda Freight Forwarding Market Regulations and Policies
- 9.1 Relevant Laws, Standards and Compliance Frameworks
- 9.2 Product, Service, Safety and Quality Requirements
- 9.3 Government Policies, Incentives and Subsidies
- 9.4 Imports, Exports and Trade Barriers
- 9.5 Public Procurement and Local Content Requirements
- 9.6 Environmental and Sustainability Compliance
- 9.7 Upcoming Policy Changes and Market Implications
Chapter 10 Uganda Freight Forwarding Market Hotspots and Opportunities
- 10.1 Market Opportunity Mapping and Growth Hotspots
- 10.2 High-Growth Applications and Customer Groups
- 10.3 Underserved Markets and White-Space Opportunities
- 10.4 Emerging Technology and Product Opportunities
- 10.5 New Capacity and Investment Hotspots
- 10.6 Market Entry and Expansion Opportunities
- 10.7 Distribution and Partnership Opportunities
- 10.8 Near-Term and Long-Term Commercial Potential
- 10.9 Opportunity Attractiveness and Execution Risks
Chapter 11 Uganda Freight Forwarding Market Outlook, 2025-2035
- 11.1 Market Size and Analysis
- 11.1.1 Revenue (Market Measurement: 2025: USD 384.5 million → 2035: USD 751.0 million)
- 11.1.2 Market Volume and Quantity Sold
- 11.1.3 Historical Market Size, 2018-2025
- 11.1.4 Base-Year Market Size, 2025
- 11.2 Market Forecast, 2025-2035
- 11.2.1 Revenue Forecast to 2035
- 11.2.2 Volume Forecast to 2035
- 11.2.3 CAGR and Year-on-Year Growth
- 11.2.4 Incremental Revenue Opportunity
- 11.3 Forecast Assumptions and Scenario Analysis
- 11.3.1 Base-Case Forecast
- 11.3.2 Optimistic and Conservative Scenarios
- 11.3.3 Technology, Pricing and Policy Sensitivities
- 11.4 Market Attractiveness and Growth Outlook
Chapter 12 Uganda Freight Forwarding Market Segmentation and Outlook
- 12.1 Segmentation Summary and Market Shares, 2025
- 12.2 Largest and Fastest-Growing Segments
- 12.3 By Service Type - Market Size and Forecast, 2025-2035
- 12.3.1 Segment Definition and Scope
- 12.3.2 Historical Market Size, 2018-2025
- 12.3.3 Revenue Forecast, 2025-2035
- 12.3.4 Volume Forecast, 2025-2035
- 12.3.5 Base-Year Market Share, 2025
- 12.3.6 Segment CAGR and Growth Drivers
- 12.3.7 Subsegment Market Size and Forecast
- 12.3.7.1 International Freight Forwarding
- 12.3.7.2 Customs Brokerage & Clearance
- 12.3.7.3 Project Cargo & Heavy Lift
- 12.3.7.4 Consolidation & Deconsolidation
- 12.3.7.5 Value-Added Logistics Coordination
- 12.3.8 Subsegment Pricing and Adoption Trends
- 12.3.9 Leading Suppliers and Competition
- 12.3.10 Regional Demand and Opportunities
- 12.4 By Mode of Transport - Market Size and Forecast, 2025-2035
- 12.4.1 Segment Definition and Scope
- 12.4.2 Historical Market Size, 2018-2025
- 12.4.3 Revenue Forecast, 2025-2035
- 12.4.4 Volume Forecast, 2025-2035
- 12.4.5 Base-Year Market Share, 2025
- 12.4.6 Segment CAGR and Growth Drivers
- 12.4.7 Subsegment Market Size and Forecast
- 12.4.7.1 Road Freight Forwarding
- 12.4.7.2 Ocean-Linked Multimodal Forwarding
- 12.4.7.3 Air Freight Forwarding
- 12.4.7.4 Rail-Linked Multimodal Forwarding
- 12.4.8 Subsegment Pricing and Adoption Trends
- 12.4.9 Leading Suppliers and Competition
- 12.4.10 Regional Demand and Opportunities
- 12.5 By Shipment Flow - Market Size and Forecast, 2025-2035
- 12.5.1 Segment Definition and Scope
- 12.5.2 Historical Market Size, 2018-2025
- 12.5.3 Revenue Forecast, 2025-2035
- 12.5.4 Volume Forecast, 2025-2035
- 12.5.5 Base-Year Market Share, 2025
- 12.5.6 Segment CAGR and Growth Drivers
- 12.5.7 Subsegment Market Size and Forecast
- 12.5.7.1 Import Forwarding
- 12.5.7.2 Export Forwarding
- 12.5.7.3 Transit & Re-Export Forwarding
- 12.5.7.4 Domestic Feeder & Cross-Border Consolidation
- 12.5.8 Subsegment Pricing and Adoption Trends
- 12.5.9 Leading Suppliers and Competition
- 12.5.10 Regional Demand and Opportunities
- 12.6 By End-Use Industry - Market Size and Forecast, 2025-2035
- 12.6.1 Segment Definition and Scope
- 12.6.2 Historical Market Size, 2018-2025
- 12.6.3 Revenue Forecast, 2025-2035
- 12.6.4 Volume Forecast, 2025-2035
- 12.6.5 Base-Year Market Share, 2025
- 12.6.6 Segment CAGR and Growth Drivers
- 12.6.7 Subsegment Market Size and Forecast
- 12.6.7.1 FMCG & Retail
- 12.6.7.2 Manufacturing & Industrial Goods
- 12.6.7.3 Oil & Gas & Energy
- 12.6.7.4 Agriculture & Coffee Exports
- 12.6.7.5 Pharmaceuticals & Healthcare
- 12.6.8 Subsegment Pricing and Adoption Trends
- 12.6.9 Leading Suppliers and Competition
- 12.6.10 Regional Demand and Opportunities
- 12.7 Segment Growth Comparison
- 12.8 Segment Attractiveness and Priority Matrix
Chapter 13 Uganda Freight Forwarding End-Use and Application Market Outlook
- 13.1 End-Use Industry and Customer Demand Structure
- 13.2 Leading Applications and Customer Groups
- 13.3 End-Use Market Size, Share and Forecast
- 13.4 Major End-Use Industry Deep Dives
- 13.4.1 Customer Requirements and Use Cases
- 13.4.2 Demand and Replacement Cycles
- 13.4.3 Technical and Regulatory Considerations
- 13.4.4 Purchasing and Procurement Models
- 13.4.5 Leading Vendors and Distribution Channels
- 13.4.6 Forecast and Commercial Opportunities
- 13.5 Emerging Applications and Cross-Segment Demand
- 13.6 End-Use Industry Investment Priorities
Chapter 14 Uganda Freight Forwarding Geographic Market Outlook, 2025-2035
- 14.1 Regional Market Size and Country-Level Shares, 2025
- 14.2 Country Market Size Comparison, 2025
- 14.3 Country Market Forecasts, 2025-2035
- 14.4 Subregional Industrial and Demand Clusters
- 14.5 Intra-Regional Pricing and Cost Differences
- 14.6 Cross-Border Trade and Supply Networks
- 14.7 Regional Supply and Demand Balances
- 14.8 Country Opportunity Comparison and Prioritization
Note: Every listed country is covered on the structure shown under the first country.
Chapter 15 Uganda Freight Forwarding Technology, Innovation and Sustainability Outlook
- 15.1 Technology Landscape and Maturity
- 15.2 Product, Process and Service Innovation
- 15.3 AI, Automation and Digital Tools in the Industry
- 15.4 Technology Adoption and Performance Benchmarking
- 15.5 Innovation Pipeline and R&D Investment
- 15.6 Patent and Intellectual Property Trends
- 15.7 Energy Efficiency and Resource Management
- 15.8 Sustainability, Recycling and Circularity
- 15.9 Technology Roadmap, 2025-2035
- 15.10 Risks of Obsolescence and Technology Substitution
Chapter 16 Uganda Freight Forwarding Market Key Strategic Imperatives
- 16.1 Growth and Market Entry Priorities
- 16.2 High-Return Products and Segments
- 16.3 Pricing, Profitability and Cost Optimization
- 16.4 Technology Investment and Product Differentiation
- 16.5 Supply Chain Localization and Resilience
- 16.6 Distribution and Customer Acquisition
- 16.7 Partnership, Acquisition and Capacity Strategy
- 16.8 Regional Expansion Priorities
- 16.9 Short-, Medium- and Long-Term Actions
Chapter 17 Competition Outlook
- 17.1 Industry Competition Characteristics
- 17.2 Market Structure and Concentration
- 17.3 Market Share and Competitive Positioning, 2025
- 17.4 Company-Wise Revenue and Product Benchmarking
- 17.5 Production and Service Capacity Benchmarking
- 17.6 Technology, Pricing and Differentiation
- 17.7 Regional Footprint and Distribution Strength
- 17.8 Mergers, Acquisitions and Strategic Alliances
- 17.9 New Entrants and Competitive Threats
- 17.10 Porter's Five Forces and Industry Attractiveness
- 17.11 Competitive Outlook, 2025-2035
Chapter 18 Company Profiles
- 18.1 Company Coverage and Selection Criteria
- 18.2 Africa Global Logistics (AGL) Uganda
- 18.2.1 Business Description
- 18.2.2 Company Ownership and Geographic Presence
- 18.2.3 Product and Service Portfolio
- 18.2.4 Manufacturing and Operating Footprint
- 18.2.5 Production Capacity and Expansion Plans
- 18.2.6 Financial Performance and Investment
- 18.2.7 Market Share and Competitive Position
- 18.2.8 Technology and Innovation Capabilities
- 18.2.9 Strategic Alliances or Partnerships
- 18.2.10 Recent Developments
- 18.2.11 Growth Strategy and Outlook
- 18.3 DHL Global Forwarding Uganda
- 18.4 Kuehne+Nagel Uganda
- 18.5 CEVA Logistics Uganda
- 18.6 Maersk Logistics Uganda
- 18.7 Unifreight Group
- 18.8 Threeways Shipping Services
- 18.9 Upstream Logistics (Mitchell Cotts Uganda)
- 18.10 Freight In Time Uganda
- 18.11 Trident Freight Limited
- 18.12 Other Relevant Market Participants
Note: Every listed company is profiled on the structure shown under the first company. The company list is preliminary and may change based on research findings, market developments, data availability and client requirements.
Chapter 19 Disclaimer
- 19.1 Research and Forecast Disclaimer
- 19.2 Data Source and Estimation Limitations
Note: The depth of individual sections depends on data availability for this market. Volume, capacity, trade and other unit-based metrics are included where applicable.

