
Non-opioid options reshape analgesic prescribing
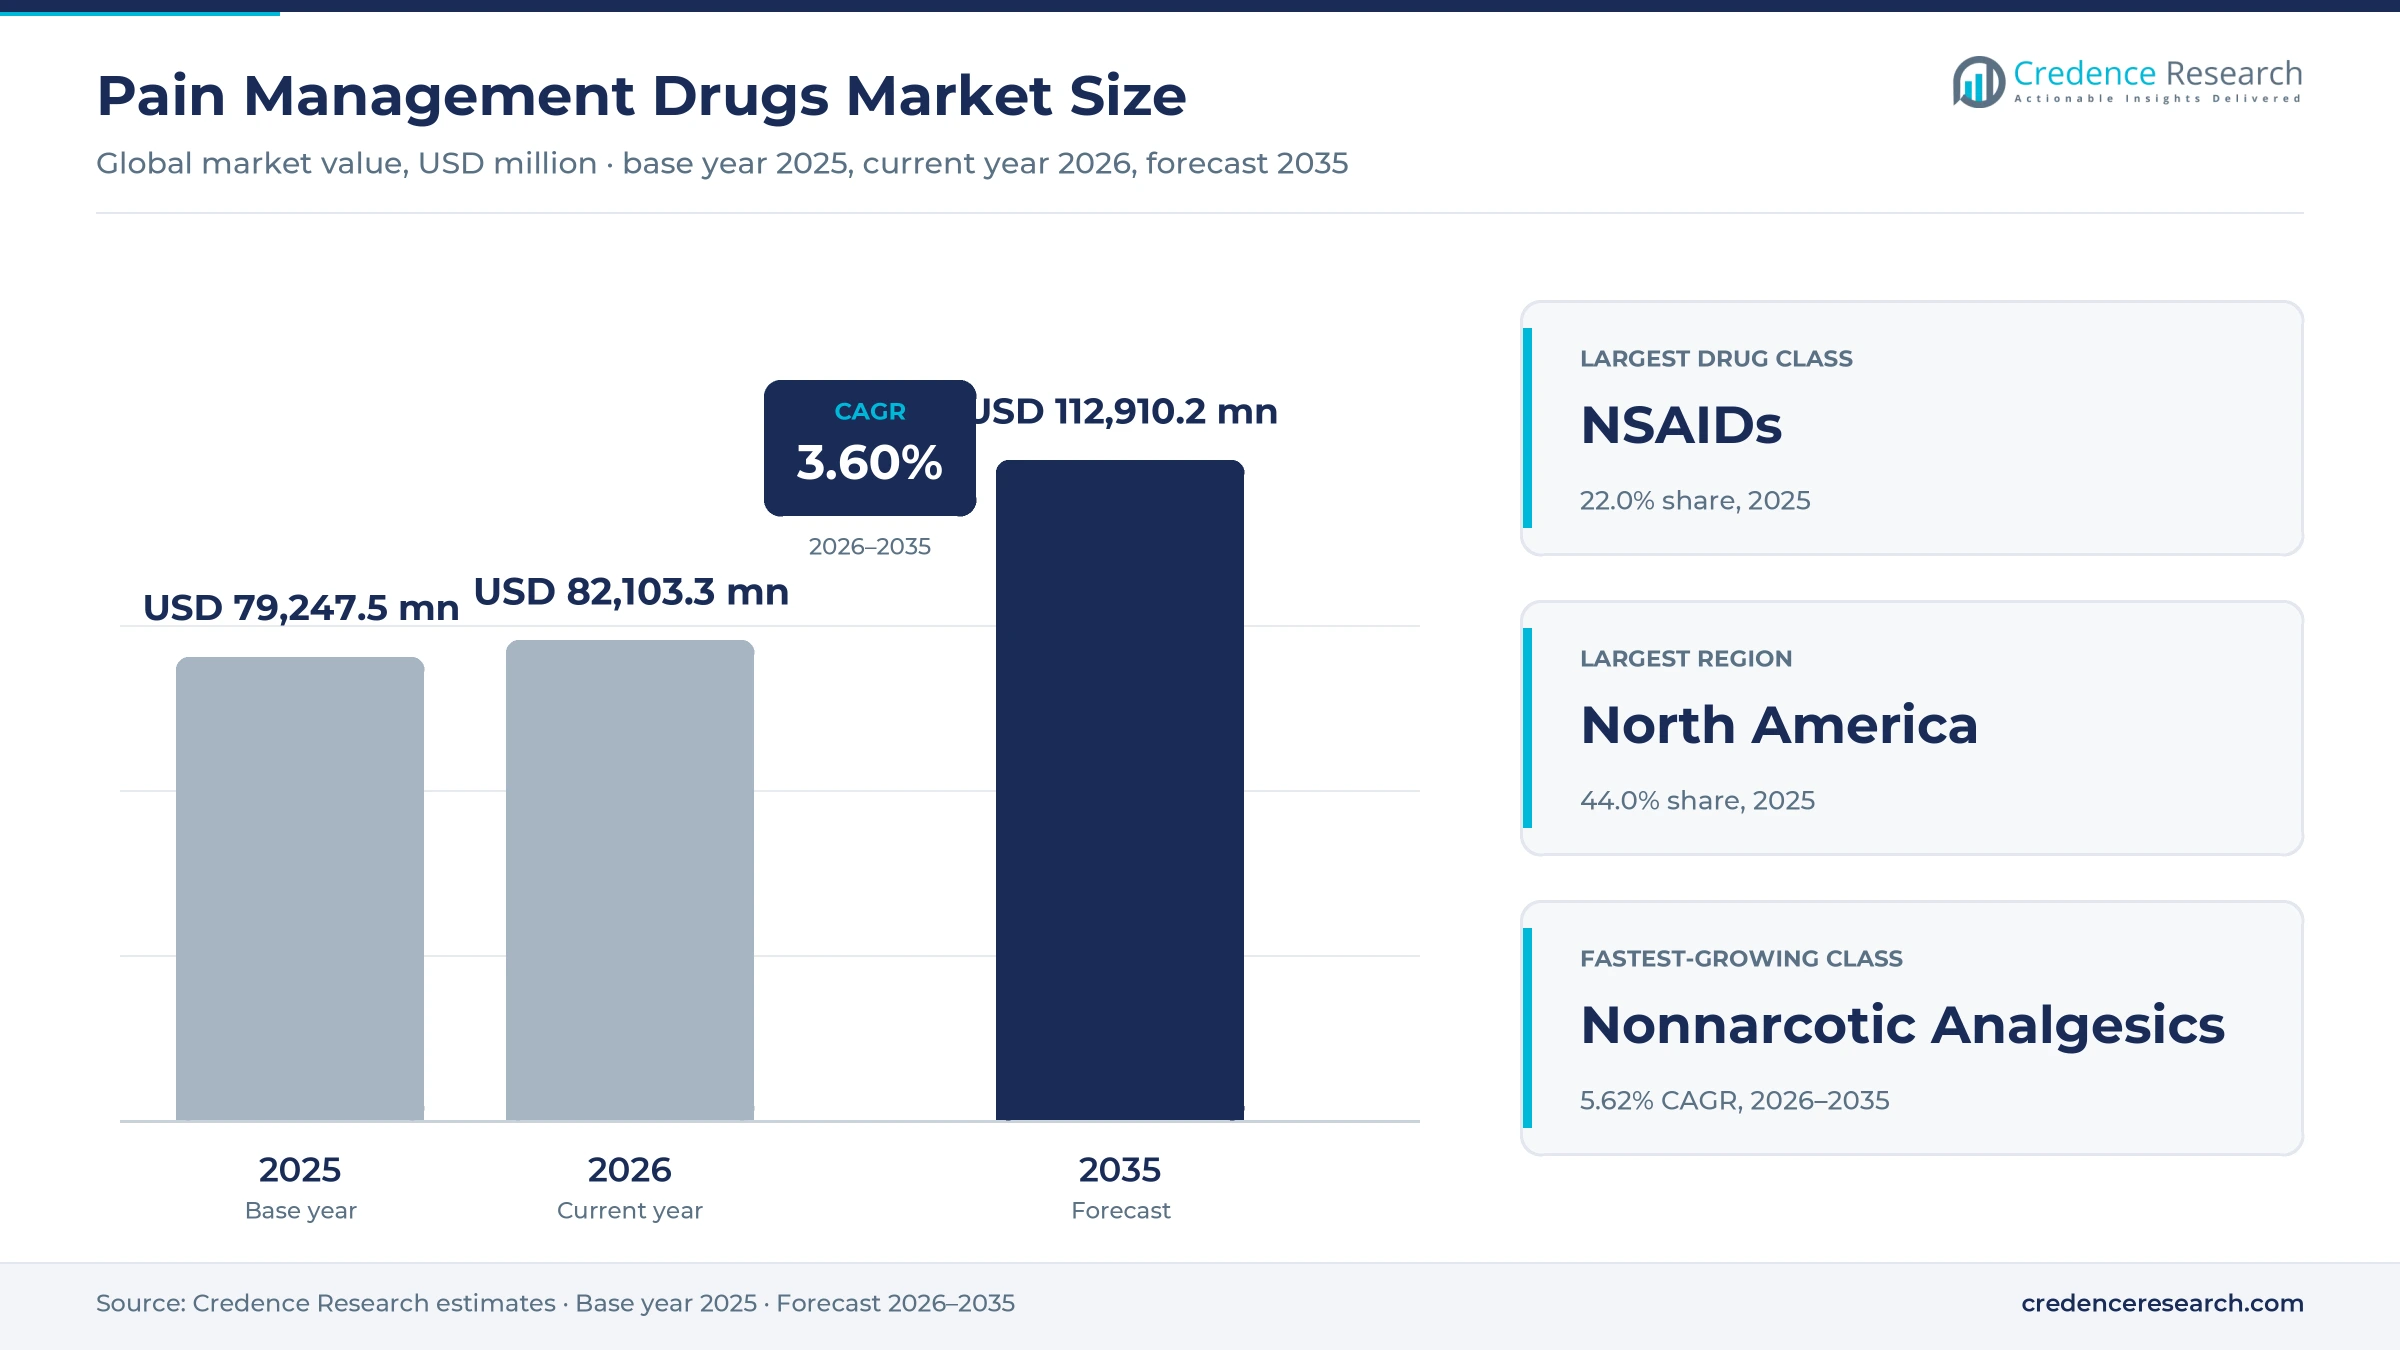
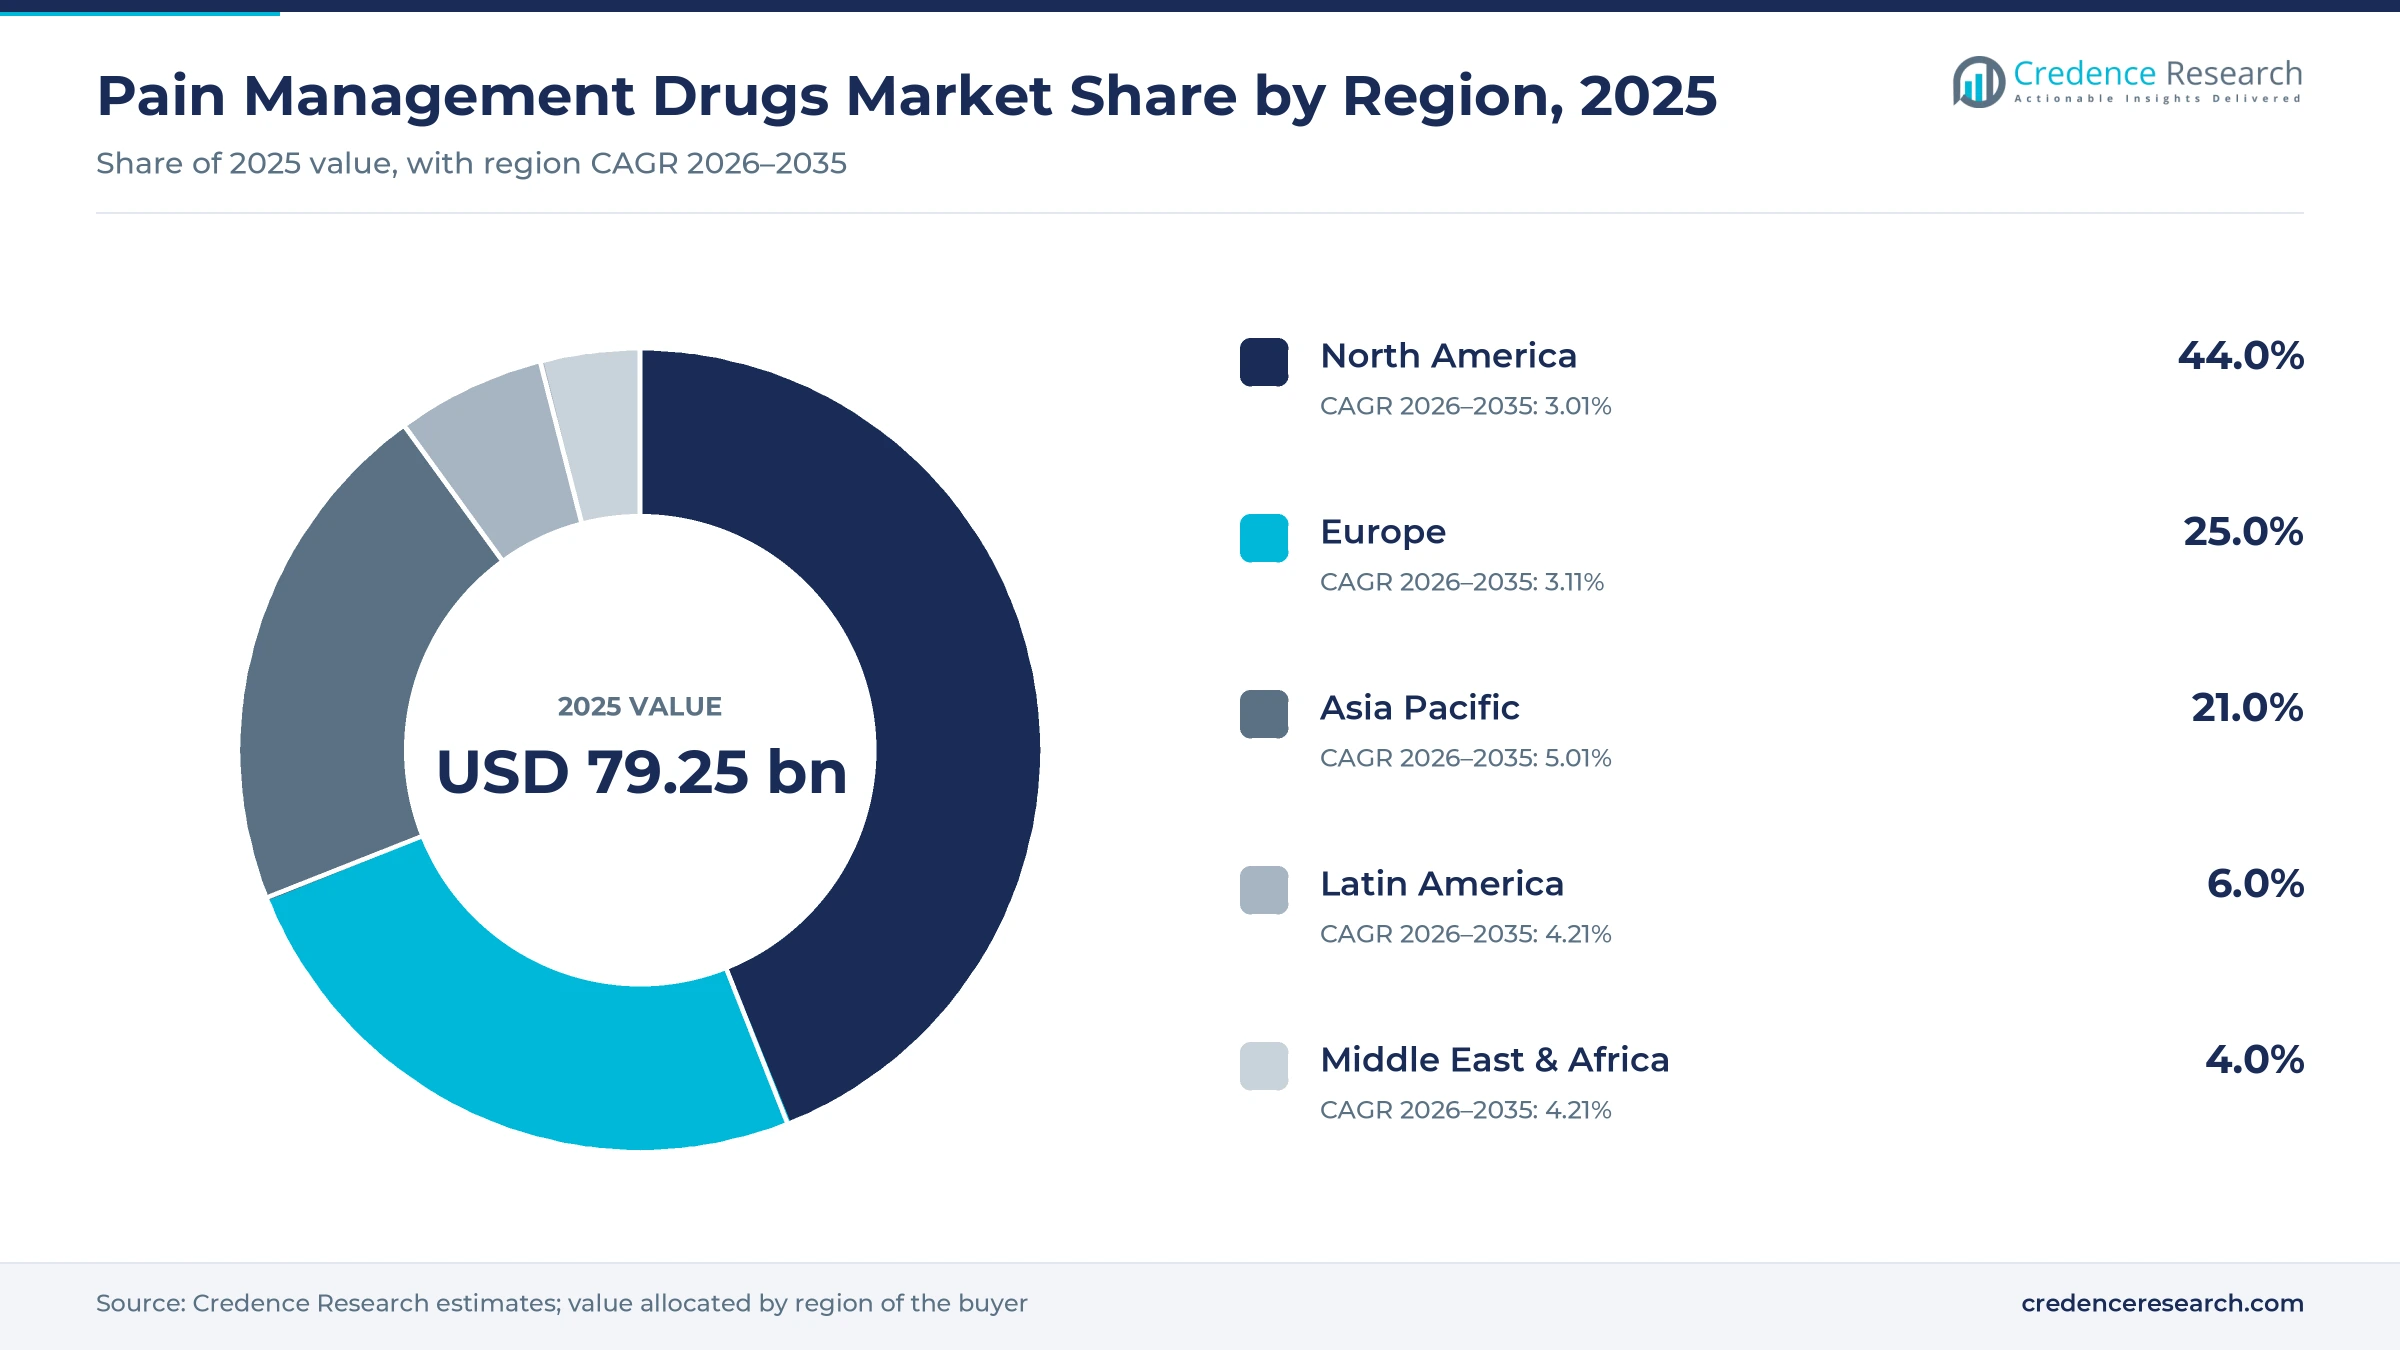
The global pain management drugs market was valued at USD 79.25 billion in 2025 and is projected to increase from USD 82.10 billion in 2026 to USD 112.91 billion by 2035, registering a CAGR of 3.60% during 2026–2035. Demand comes from aging populations, a heavy load of arthritis and back conditions, steady surgical volumes and a policy push toward medicines that lower reliance on opioids. North America held the largest regional share, 44.0% in 2025, because insured patients in the United States use branded analgesics, nerve pain medicines and hospital anesthetics at high prices. Asia Pacific is the fastest-growing region at 5.01% a year, as China, India and Southeast Asia widen surgical capacity and insurance coverage. The treatment picture changed in January 2025, when U.S. regulators approved the first medicine in a new class of non-opioid analgesics. As a result, doctors gained an oral option for moderate to severe acute pain that avoids addiction risks.
Which analgesic medicines and uses does this analysis cover?
The analysis counts prescription and branded over-the-counter medicines used to relieve acute and chronic pain, including NSAIDs, anesthetics, anticonvulsants, anti-migraine agents, antidepressants, opioids and nonnarcotic analgesics. Values reflect manufacturer selling prices after typical discounts, and patients obtain most products through hospital, retail and online pharmacies.
Medical devices, nerve stimulators, physical therapy and surgical procedures sit outside this scope. The value chain runs from originator and generic manufacturers through wholesalers and pharmacy benefit managers to hospital, retail and online pharmacies, which dispense medicines prescribed by surgeons, anesthesiologists, rheumatologists, neurologists and primary care doctors.
Pain Management Drugs Market Insights
- The pain management drugs market grows from USD 79.25 billion in 2025 to USD 112.91 billion by 2035, a 3.60% CAGR as non-opioid options gain share from older generic therapies.
- North America held 44.0% of global analgesic value in 2025, supported by high branded prices and broad insurance coverage in the United States.
- NSAIDs led drug classes with 22.0% of 2025 value, while nonnarcotic analgesics grow fastest at 5.62% a year through 2035.
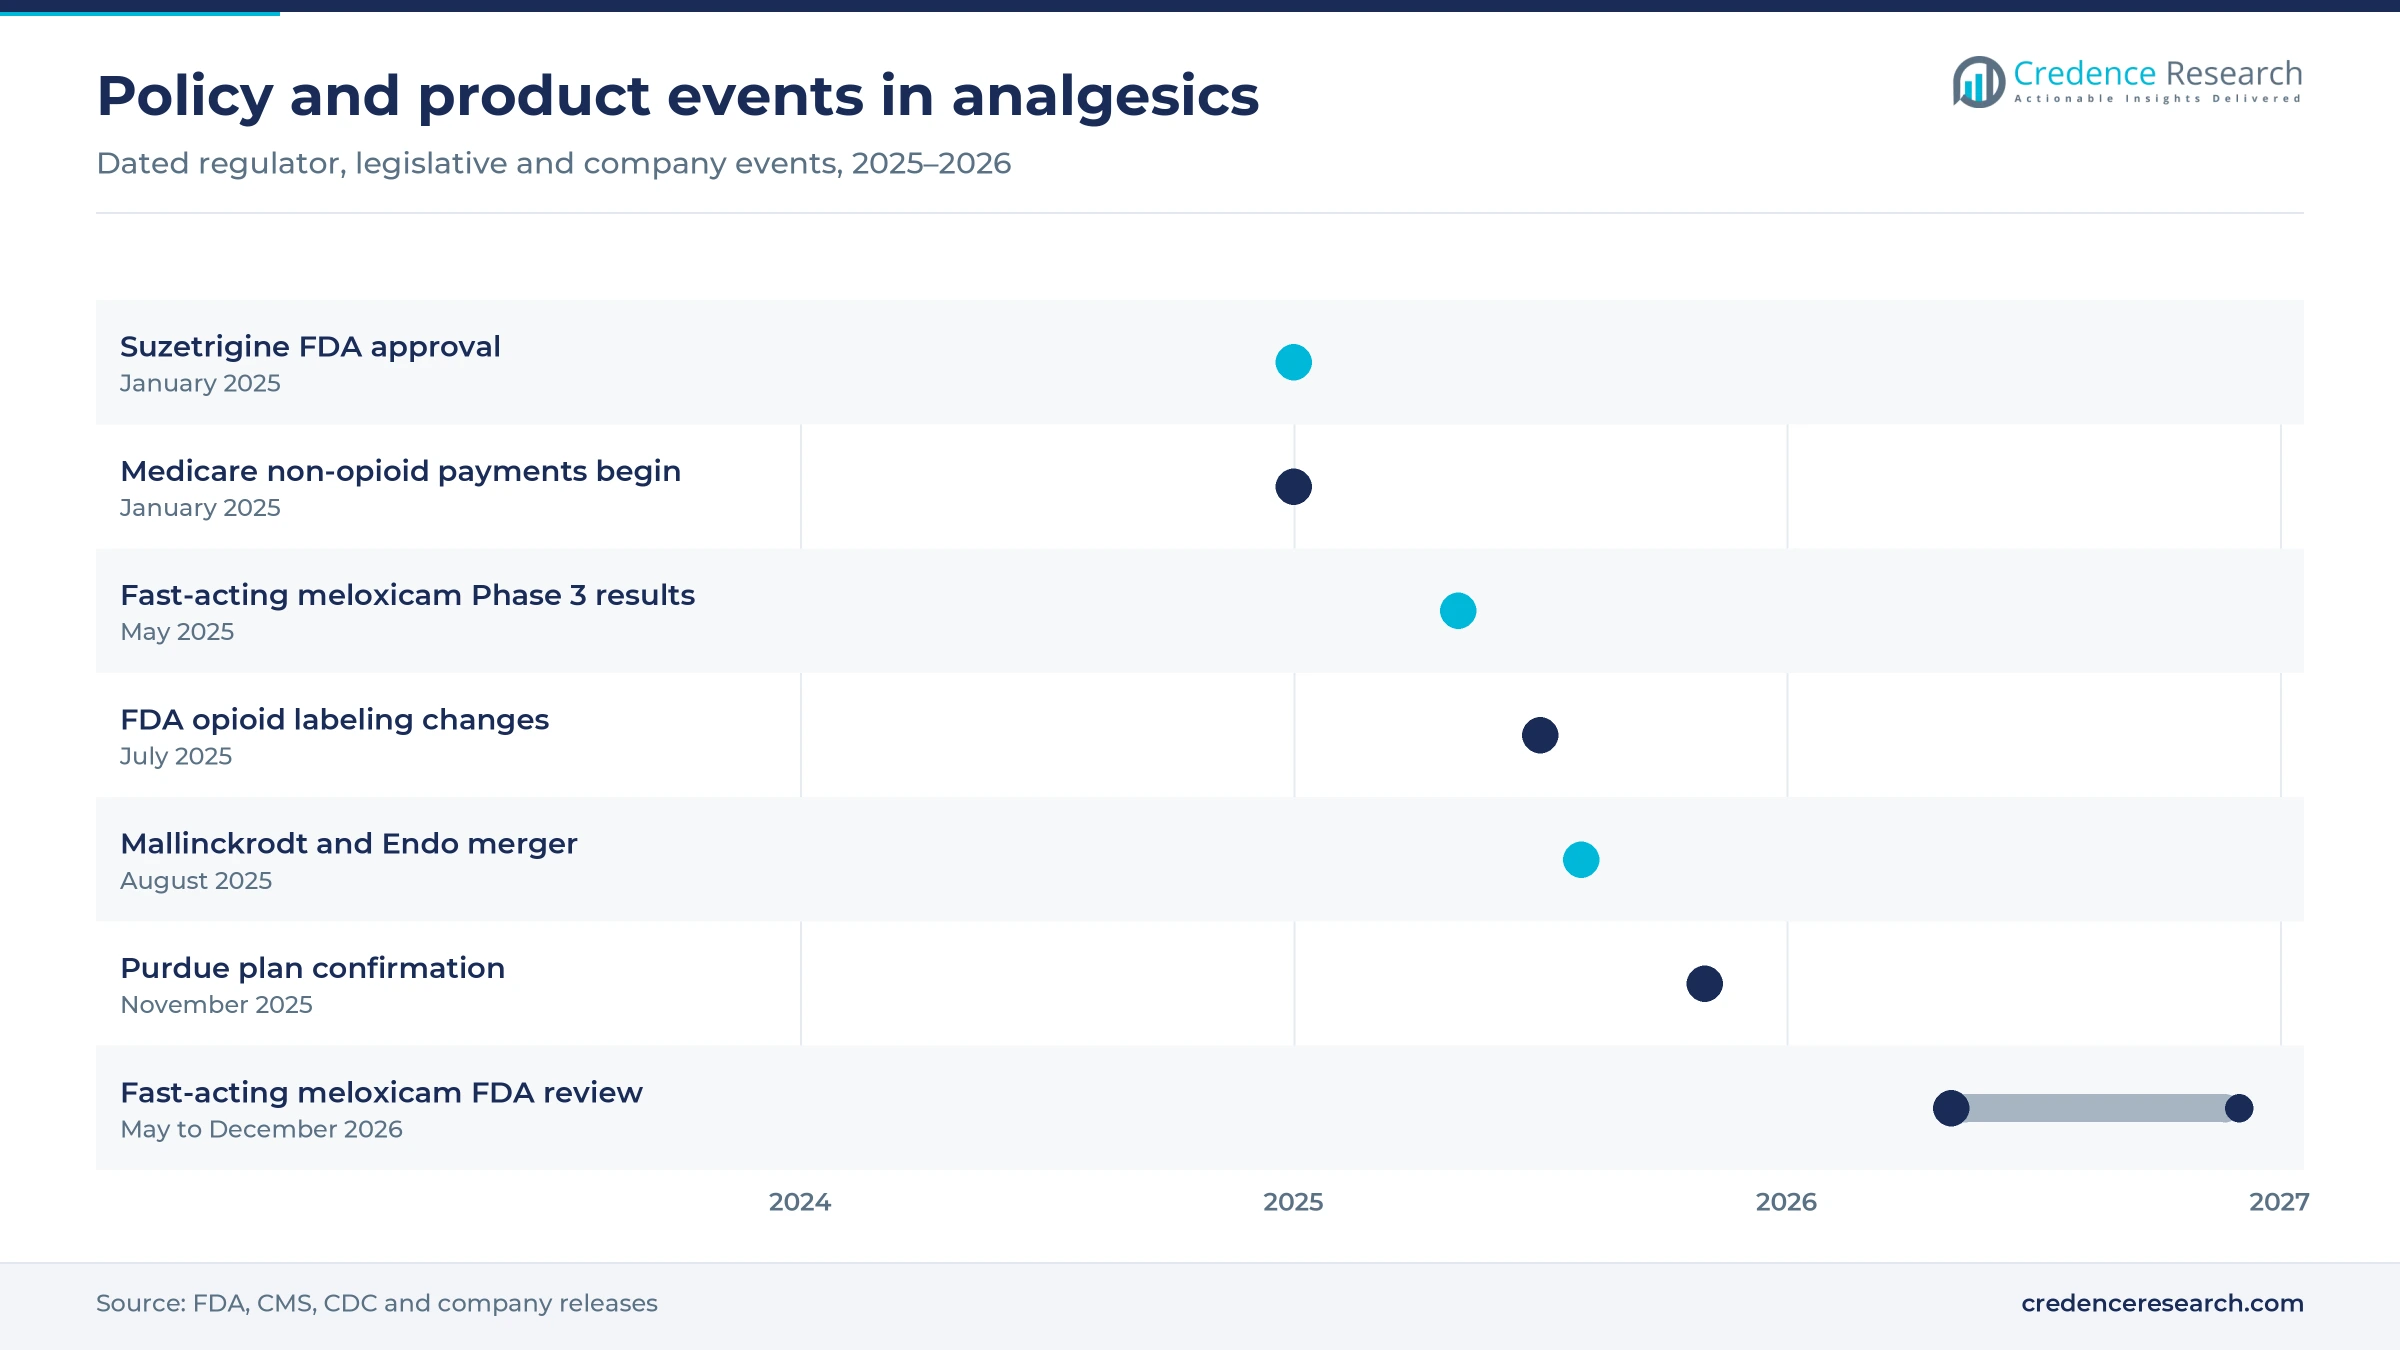
- In January 2025, the FDA approved suzetrigine from Vertex Pharmaceuticals, the first medicine in a new class of non-opioid analgesics.
- In May 2026, the FDA accepted a Viatris application for fast-acting meloxicam, with a decision goal date of Dec. 27, 2026.
NSAIDs lead while nonnarcotic analgesics gain pace
Why do NSAIDs still hold the largest share?
Based on drug class, the market is categorized into NSAIDs, anesthetics, anticonvulsants, anti-migraine agents, antidepressants, opioids and nonnarcotic analgesics. NSAIDs led with a 22.0% share of 2025 value, because doctors use them first for arthritis, sprains and dental or surgical pain. Nonnarcotic Analgesics grow fastest at 5.62% a year, as new sodium channel blockers and fast-acting formulations reach acute care. Opioids keep large volumes but face tighter prescribing rules in most countries.
Which conditions account for most analgesic spending?
Based on indication, the market is categorized into arthritic pain, neuropathic pain, cancer pain, chronic back pain, postoperative pain, migraine, fibromyalgia, muscle sprain or strain and others, including bone fracture and acute appendicitis. Arthritic Pain led with a 20.0% share of 2025 value, because osteoarthritis and rheumatoid conditions require long-term therapy. Migraine grows fastest at 4.86% a year, as branded preventive therapies widen use among working-age adults.
Why are online pharmacies gaining share?
Based on distribution channel, the market is categorized into hospital pharmacies, retail pharmacies and online pharmacies. Retail Pharmacies led with a 52.0% share of 2025 value, because most patients refill chronic and over-the-counter analgesics close to home. Online Pharmacies grow fastest at 5.60% a year, as telehealth prescribing and home delivery make monthly refills easier. Hospital pharmacies keep a large share of anesthetics and injectable analgesics used during surgery.
| Segment Group | Leading Sub-segment | Share, 2025 | Fastest-growing Sub-segment | CAGR, 2026–2035 |
|---|---|---|---|---|
| By Drug Class | NSAIDs | 22.0% | Nonnarcotic Analgesics | 5.62% |
| By Indication | Arthritic Pain | 20.0% | Migraine | 4.86% |
| By Distribution Channel | Retail Pharmacies | 52.0% | Online Pharmacies | 5.60% |
Request a Free Sample
Fill in your details and we'll send you a free sample report.
- Sample data tables & charts
- Research methodology
Aging adults and musculoskeletal burden lift demand
How does the scale of chronic pain sustain demand?
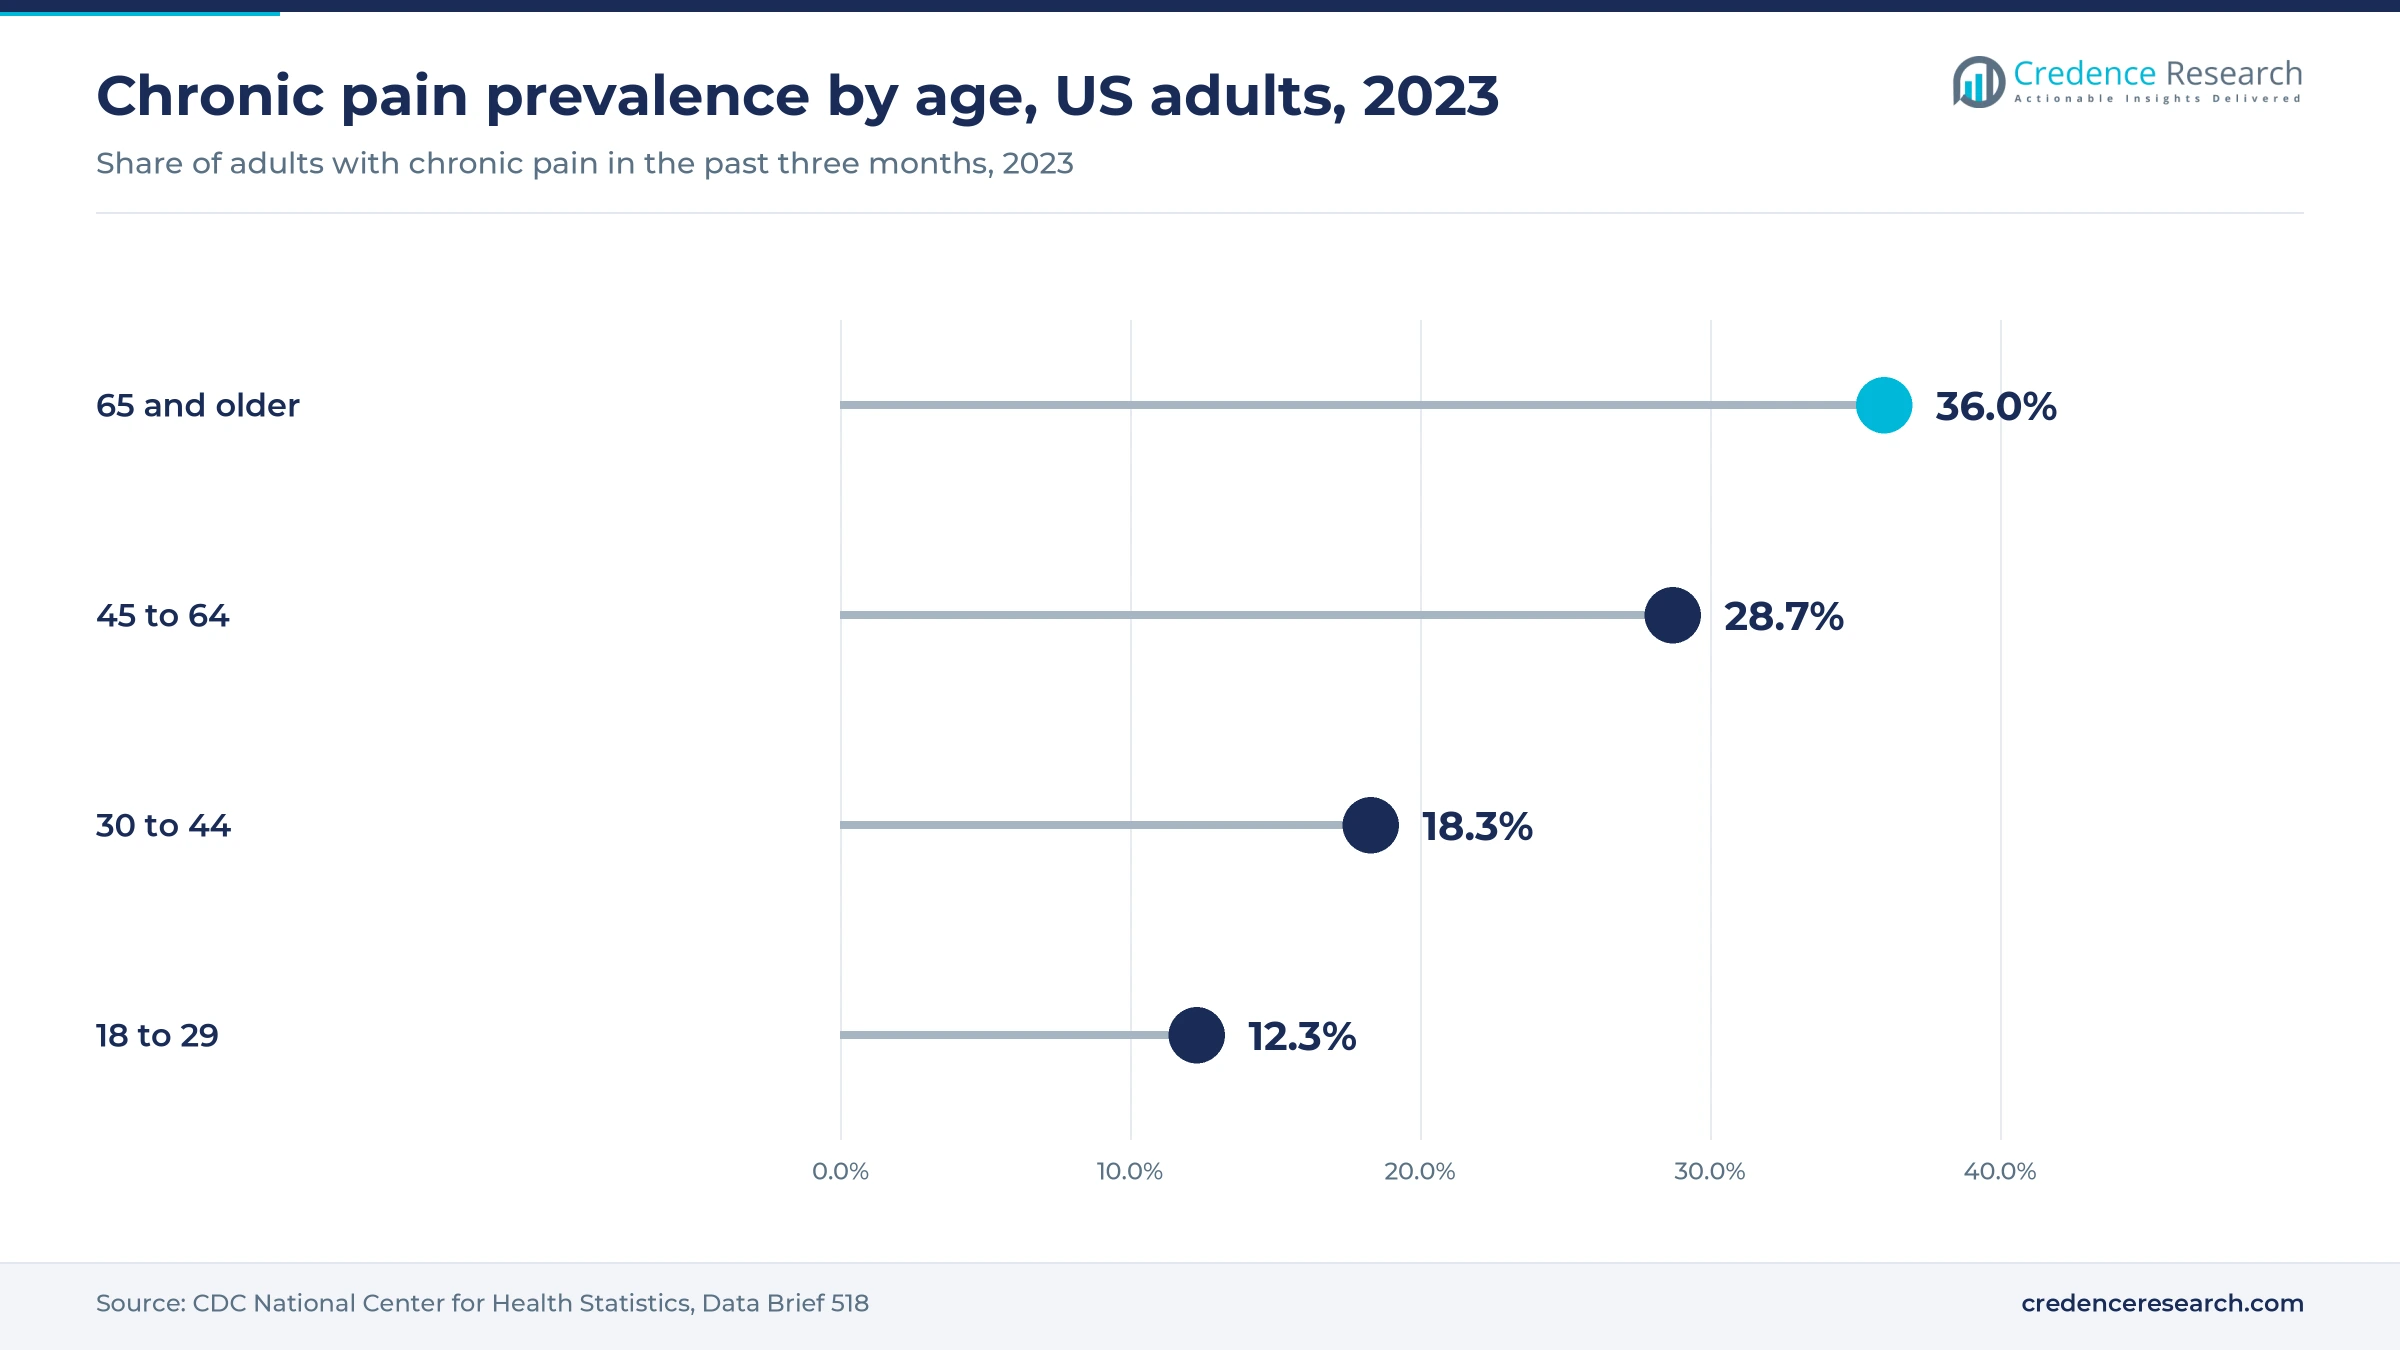
The scale of chronic pain sustains demand, because a large share of adults need regular treatment for lasting symptoms. The U.S. National Center for Health Statistics reported in November 2024 that 24.3% of adults had chronic pain in 2023, and 8.5% had high-impact chronic pain that limited daily life. The same survey found chronic pain in 36.0% of adults aged 65 and older, compared with 12.3% of adults aged 18 to 29. Rates were also higher in nonmetropolitan areas, at 31.4%, than in large central cities, at 20.5%. Women also reported chronic pain more often than men, at 25.4% compared with 23.2%. As a result, aging populations and rural care gaps keep analgesic use high across many health systems.
Why does the musculoskeletal burden keep spending high?
The musculoskeletal burden keeps spending high, because back and joint conditions are the leading causes of disability worldwide. The World Health Organization estimates that low back pain affected 619 million people in 2020, and it expects cases to reach 843 million by 2050. The agency also reports that about 528 million people lived with osteoarthritis in 2019, an increase of 113% since 1990. The knee is the most affected joint, with a prevalence of 365 million. About 73% of people living with osteoarthritis are older than 55 years, and 60% are women. In turn, arthritic pain and chronic back pain together hold a large part of indication spending through 2035.
How do new non-opioid approvals widen treatment choices?
New non-opioid approvals widen treatment choices, because doctors want effective options that avoid addiction and overdose risks. On Jan. 30, 2025, the FDA approved suzetrigine from Vertex Pharmaceuticals for moderate to severe acute pain in adults. The agency described it as the first medicine approved in a new class of non-opioid analgesics. Suzetrigine blocks the NaV1.8 sodium channel in peripheral nerves, which reduces pain signals before they reach the brain. Vertex is also testing the medicine in nerve pain, which could widen its use beyond short-term care. As a result, nonnarcotic analgesics grow at 5.62% a year, the fastest rate among drug classes in this analysis.
Why does payment reform support opioid alternatives?
Payment reform supports opioid alternatives, because hospitals and surgery centers now receive added payment for using them. The NOPAIN Act requires Medicare to pay separately for qualifying non-opioid treatments for post-surgical pain, and those payments began on Jan. 1, 2025. The rule covers hospital outpatient departments and ambulatory surgery centers, where many joint, hernia and dental procedures take place. Hospital pharmacies held a large share of 2025 value because surgical anesthetics and injectable analgesics pass through them. Postoperative pain also grows faster than arthritic and back pain in this analysis. In turn, local anesthetics and nonnarcotic medicines gain formulary space in surgical care.
New sodium channel blockers shift acute care choices
How are opioid safety labels shifting prescribing?
Opioid safety labels are shifting prescribing, because regulators now stress that risks rise with dose and continue over time. On July 31, 2025, the FDA required labeling changes that removed wording suggesting long-term use is safe. The new labels say extended-release opioid products should be used only when other treatments have failed. They also warn against stopping opioids suddenly and add gabapentin and pregabalin to the listed interactions. The CDC estimated that opioid-involved overdose deaths fell from 55,296 in 2024 to 44,564 in 2025. As a result, opioids grow more slowly than other drug classes through 2035, at a pace well below the overall market.
Why are sodium channel blockers rising in the pipeline?
Sodium channel blockers are rising in the pipeline, because they target pain nerves without acting on the brain. Vertex began a Phase 3 trial of suzetrigine for pain linked to diabetic peripheral neuropathy in October 2024, with about 1,100 participants planned. This follows the acute pain approval in January 2025, which proved the NaV1.8 approach in a large patient group. Neuropathic pain held a sizable share of 2025 indication value, and it grows faster than the overall market. Current nerve pain medicines such as gabapentin and pregabalin often cause dizziness and sedation. In turn, success in nerve pain would extend the class from short-term use into chronic therapy for millions of patients.
Can fast-acting formulations open demand in acute care?
Fast-acting formulations open a clear opportunity, because surgeons want oral medicines that work quickly and reduce opioid use. In May 2025, Viatris reported that 72.6% of hernia repair patients on its fast-acting meloxicam were opioid-free, versus 58.6% on placebo. The bunionectomy study showed 56.9% opioid-free patients, compared with 33.1% on placebo. In May 2026, the FDA accepted the Viatris application and set a decision goal date of Dec. 27, 2026. Viatris filed under the 505(b)(2) pathway, which relies partly on existing meloxicam safety data. As a result, reformulated NSAIDs can win share in postoperative pain at branded prices.
Where can online channels add value for manufacturers?
Online channels give manufacturers room to add value, because many patients with chronic pain refill the same medicines every month. Telehealth visits let doctors renew prescriptions for nerve pain, migraine and arthritis without clinic trips. Online pharmacies grow at 5.60% a year, the fastest rate among channels in this analysis. In 2023, chronic pain affected 31.4% of nonmetropolitan adults, compared with 20.5% of adults in large central cities, according to the CDC. High-impact chronic pain also reached 11.5% of nonmetropolitan adults in the same survey. These rural patients often live far from pharmacies and gain the most from home delivery. In turn, brands that support digital refills and patient programs can keep users on therapy longer.
Opioid safety rules and generic pricing limit value
How do opioid restrictions limit value in chronic care?
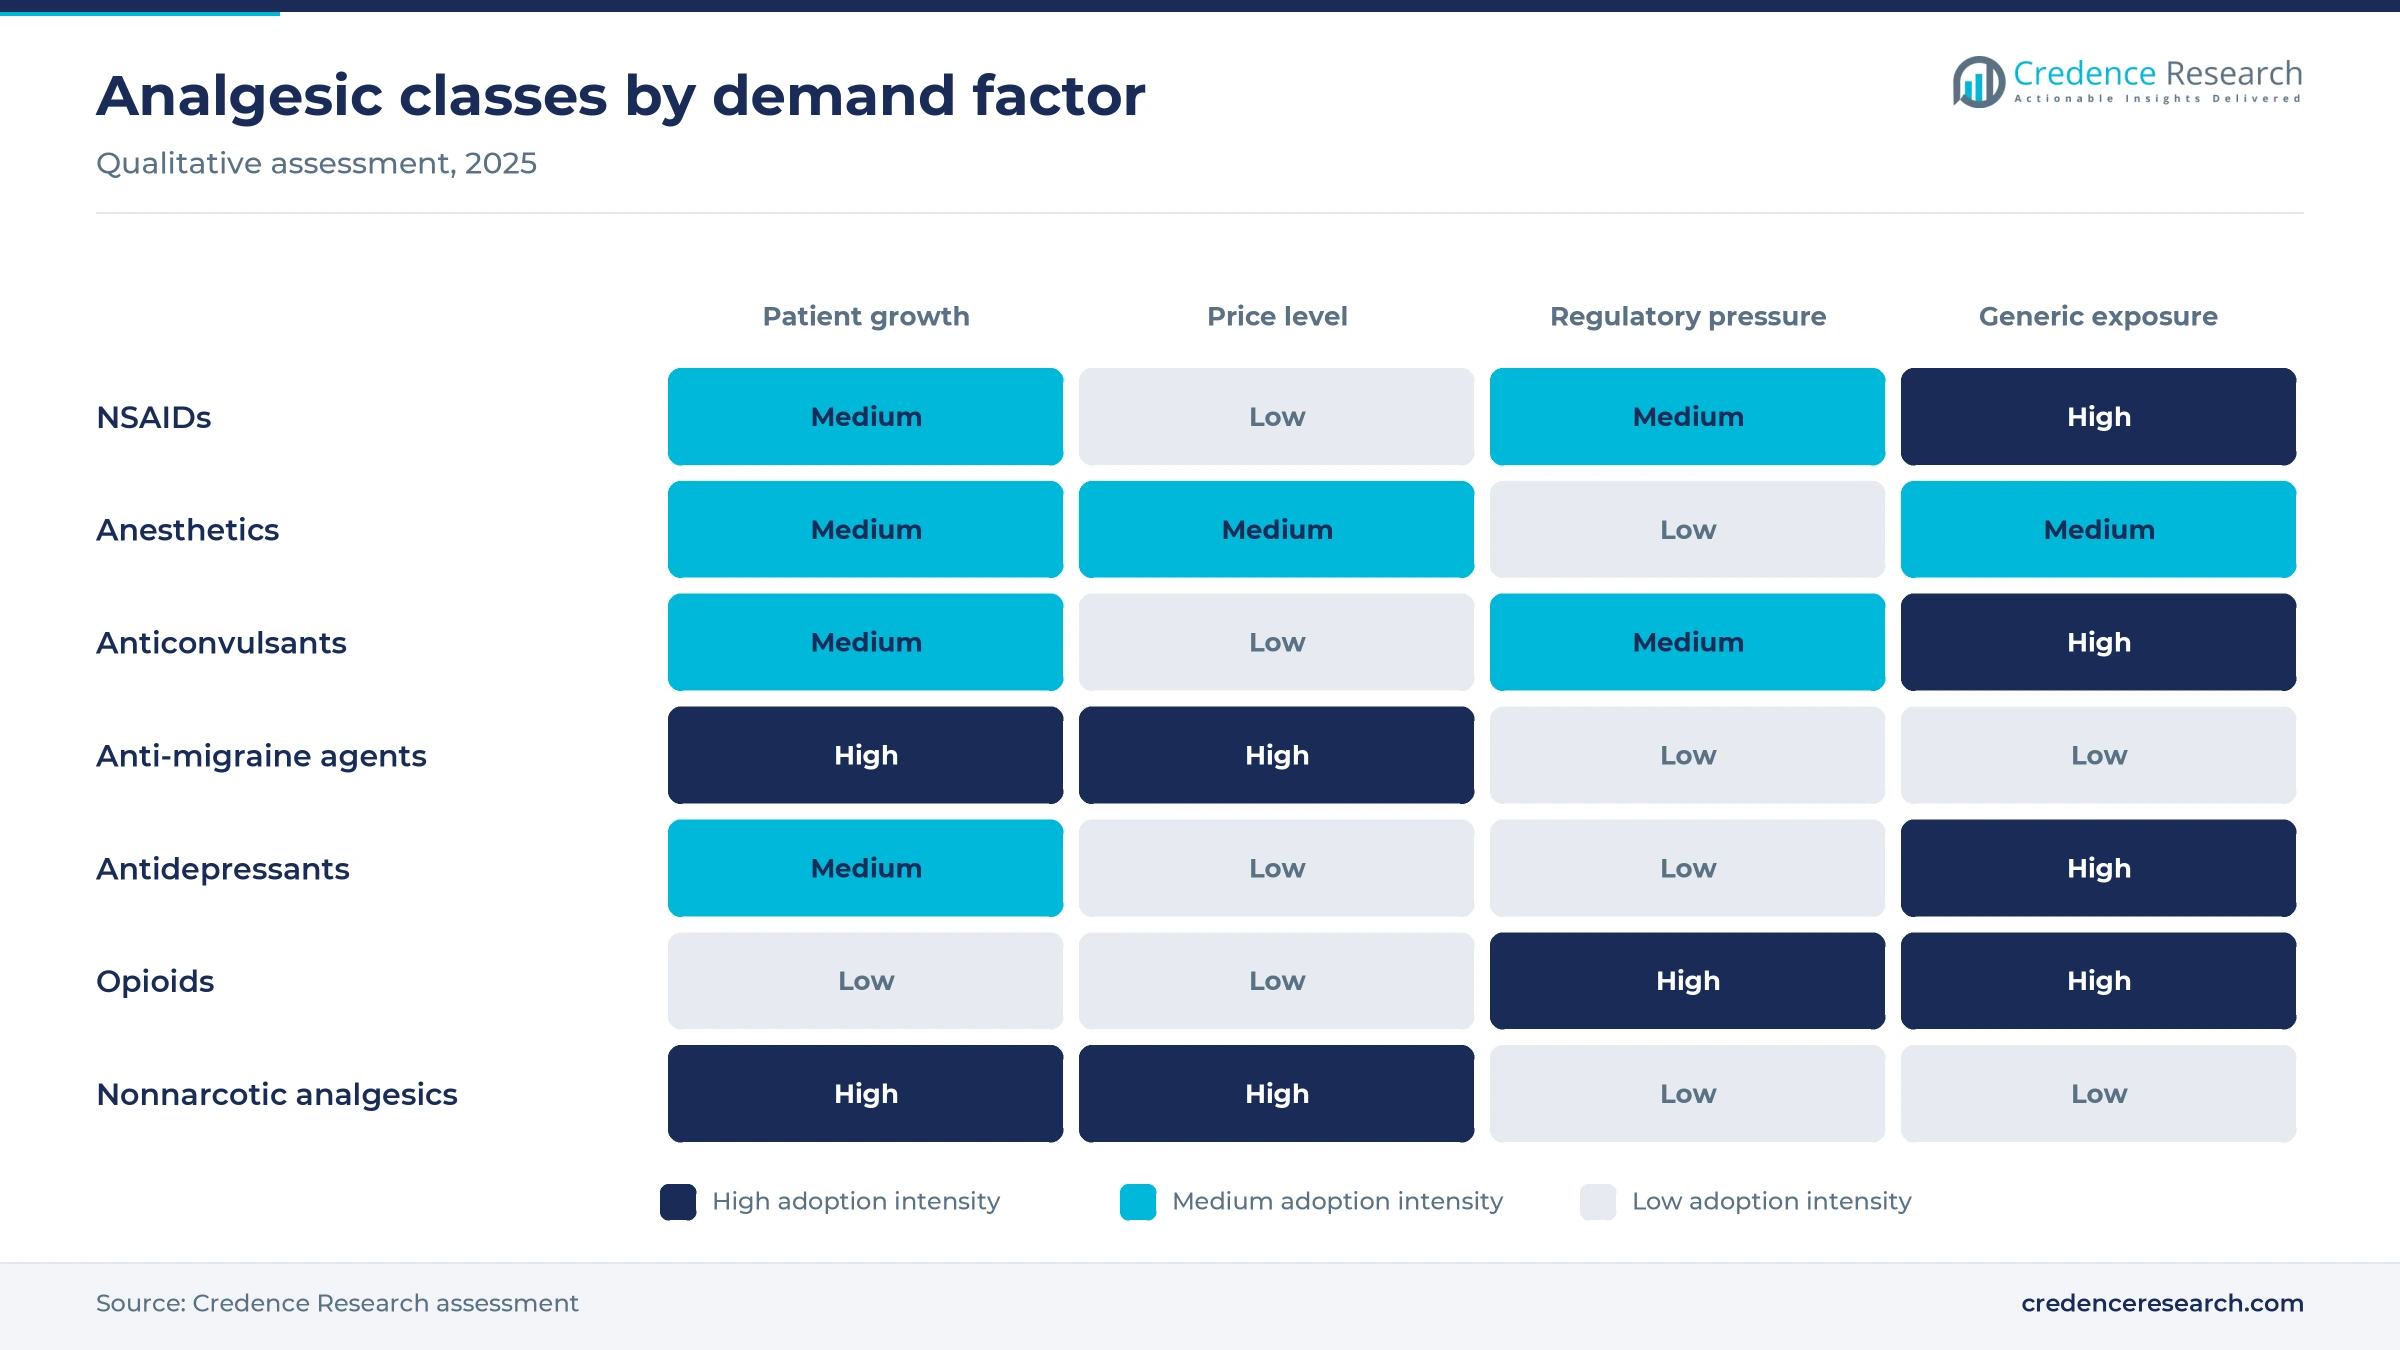
Opioid restrictions limit value in chronic care, because prescribers face dose limits, monitoring rules and legal scrutiny. Many doctors now avoid starting long-term opioid therapy, even for patients with severe pain. The 2025 labeling changes add further cautions on extended-release products. Patients who need strong relief may face gaps while safer alternatives are still limited. As a result, opioid value declines in some countries before new classes fully replace it, and some patients remain undertreated.
Why does generic competition hold down prices?
Generic competition holds down prices, because ibuprofen, naproxen, gabapentin, pregabalin and most opioids now sell as low-cost generics. Payers use these medicines as first-line options and require patients to try them before branded products. Generic producers in India and other countries supply large volumes to pharmacies worldwide. In turn, new branded medicines must show clear benefits in safety or onset to justify higher prices and gain formulary access with large payers.
How do safety concerns restrict some medicine classes?
Safety concerns restrict some medicine classes, because NSAIDs carry gastrointestinal, kidney and cardiovascular warnings. Older adults with heart or kidney disease therefore need careful dose choices or alternative therapies. Anticonvulsants and antidepressants used for nerve pain can cause dizziness and sedation, which raises fall risks in older adults. As a result, doctors must review each patient carefully, which slows uptake of some medicines among older patients and those taking several other prescriptions.
Why does litigation weigh on opioid manufacturers?
Litigation weighs on opioid manufacturers, because settlements and bankruptcy cases have reshaped the industry. In November 2025, Purdue Pharma said the bankruptcy court would confirm a plan with about $7.4 billion in cash for creditors. Purdue assets move to Knoa Pharma, a new company focused on opioid use disorder treatments and overdose reversal medicines. Endo also merged with Mallinckrodt in August 2025 after earlier restructuring. In turn, marketing of branded opioids remains limited across the industry.
North America leads as Asia Pacific gains pace
| Region | Value, 2025 (USD billion) | Share, 2025 | CAGR, 2026–2035 |
|---|---|---|---|
| North America | 34.87 | 44.0% | 3.01% |
| Europe | 19.81 | 25.0% | 3.11% |
| Asia Pacific | 16.64 | 21.0% | 5.01% |
| Latin America | 4.75 | 6.0% | 4.21% |
| Middle East & Africa | 3.17 | 4.0% | 4.21% |
Why does North America hold the largest regional share?
North America held a 44.0% share of 2025 value and grows at 3.01% a year through 2035. The United States drives this position, because commercial and government insurers cover branded analgesics, nerve pain medicines and surgical anesthetics. The FDA approval of suzetrigine in January 2025 and Medicare non-opioid payments from the same month support new branded use. However, opioid restrictions and generic pricing keep growth below the global average.
How fast is Asia Pacific adding patients?
Asia Pacific held a 21.0% share of 2025 value and is the fastest-growing region at 5.01% a year. China, India and Southeast Asian countries are adding hospital beds, surgical capacity and insurance coverage, which raises analgesic use. Aging populations in Japan, South Korea and China add patients with arthritis and back conditions. Local generic producers keep prices low, so volume growth drives most regional value.
What shapes demand across Europe?
Europe held a 25.0% share of 2025 value and grows at 3.11% a year through 2035. Germany, France, the United Kingdom, Italy and Spain account for most spending, because national health systems reimburse analgesics under set price rules. European doctors already prescribe fewer opioids per patient than doctors in the United States. However, tight pricing and generic use keep growth close to the global average.
Where is Latin America adding demand?
Latin America held a 6.0% share of 2025 value and grows at 4.21% a year through 2035. Brazil and Mexico lead regional spending, because private insurers and large hospital groups adopt branded medicines in major cities. Public systems still depend mainly on generic NSAIDs and simple analgesics.
What limits growth in the Middle East and Africa?
The Middle East and Africa held a 4.0% share of 2025 value and grows at 4.21% a year through 2035. Gulf states fund branded hospital care, while much of Africa relies on low-cost generics. Strict controls on opioids in many countries also limit access to strong analgesics for cancer and surgical patients.
FDA approvals, filings and restructurings since 2025
| Development | Status and market relevance |
|---|---|
| In January 2025, the FDA approved suzetrigine from Vertex Pharmaceuticals for moderate to severe acute pain in adults. | Approved; first medicine in a new class of non-opioid analgesics |
| In May 2025, Viatris Inc. reported positive results from two Phase 3 studies of fast-acting meloxicam after surgery. | Completed; both studies met primary and secondary endpoints |
| In August 2025, Mallinckrodt and Endo completed their merger, with generics placed in the Par Health business. | Completed; combines branded and generic portfolios |
| In November 2025, Purdue Pharma L.P. announced that the bankruptcy court would confirm its plan of reorganization. | Confirmed; assets move to Knoa Pharma |
| In May 2026, the FDA accepted the Viatris application for fast-acting meloxicam for acute pain. | Under review; decision goal date of Dec. 27, 2026 |
Selective channel blockers lead analgesic innovation
- Selective sodium channel blockers act on NaV1.8 channels in peripheral nerves, which reduces pain signals without addiction risks linked to opioids.
- Fast-acting oral formulations dissolve and absorb faster than standard tablets, which brings quicker relief after surgery.
- Extended-release local anesthetics keep the surgical site numb for longer, which reduces the need for opioids after discharge.
- Abuse-deterrent opioid designs resist crushing and injection, which lowers misuse risk when strong analgesics remain necessary.
- Combination tablets pair two analgesics with different actions in one dose, which targets several pain pathways at once.
Need a Custom Version of This Report?
Tailor the scope, geography, or segments to your exact requirements.
- Custom geography or segment scope
- Direct access to our analyst team
Originators and generic makers compete on access
Competition is led by originators with broad analgesic portfolios and generic makers with large volumes. Pfizer Inc., Novartis AG, GSK plc, Merck & Co. Inc. and Johnson & Johnson Services Inc. bring established brands, hospital relationships and global distribution. Viatris Inc. combines established branded medicines with generics and is seeking approval for fast-acting meloxicam. Abbott Laboratories and Cipla Ltd compete strongly in branded generics across India, Africa and other emerging markets. Purdue Pharma L.P. and Endo Health Solutions Inc. have reshaped their businesses after opioid litigation, with Purdue assets moving to Knoa Pharma and Endo merging with Mallinckrodt in August 2025. New entrants such as Vertex Pharmaceuticals add competition from non-opioid classes. As a result, competition centers on safety data, payer access and price rather than brand recognition alone.
Companies profiled and their roles in this market
| Company | Type | Role in the market |
|---|---|---|
| Pfizer Inc. | Originator | Analgesic and anti-inflammatory portfolio |
| Novartis AG | Originator and generics | Anti-inflammatory and neuroscience medicines |
| Viatris Inc. | Branded and generics | Established analgesics and fast-acting meloxicam candidate |
| GSK plc | Originator | Established analgesic and anti-migraine brands |
| Merck & Co. Inc. | Originator | Hospital and perioperative medicines |
| Johnson & Johnson Services Inc. | Originator | Neuroscience and hospital medicines |
| Abbott Laboratories | Branded generics | Analgesics in emerging markets |
| Cipla Ltd | Generics | Low-cost analgesics for India and export markets |
| Purdue Pharma L.P. | Originator | Opioid analgesics; assets moving to Knoa Pharma |
| Endo Health Solutions Inc. | Branded and generics | Part of Mallinckrodt after August 2025 merger |
Opioid alternatives set the growth pace to 2035
Credence Research's view is that opioid alternatives will set the pace of growth through 2035, because regulators, payers and surgeons all favor medicines that avoid addiction risks. The overall market grows at 3.60% a year, supported by aging populations, a heavy musculoskeletal burden and new non-opioid approvals. Nonnarcotic analgesics and anti-migraine agents grow faster than older classes as branded launches gain payer support. Companies that combine strong safety data, fast onset and broad payer access will capture the most new patients.
How Credence Research sized analgesic spending
The report uses 2025 as the base year and 2026 to 2035 as the forecast period. Market values come from the Credence Research model, which builds spending by drug class, indication, distribution channel and region. Regional and segment splits are Credence Research estimates informed by CDC survey data, World Health Organization fact sheets, regulator decisions, U.S. legislative records and company press releases. No primary interviews or surveys were used in preparing this edition of the report.
Analgesic spending outlook to 2035
By 2035, the pain management drugs market is projected to reach USD 112.91 billion, with growth led by nonnarcotic analgesics, anti-migraine agents and new fast-acting formulations. NSAIDs keep the largest class share, while opioids lose ground as safety rules tighten. North America keeps the highest spending per patient, while Asia Pacific adds the most new patients as surgical capacity grows. Online pharmacies will take a larger share of refills as telehealth spreads. As a result, advantage will depend on safety, onset speed and payer access.
Frequently Asked Questions
How big is the global pain management drugs market?
Which drug class leads analgesic spending?
Which region leads demand for pain medicines?
Which indication holds the largest share?
How do online pharmacies affect analgesic sales?
What recent approvals affect pain medicines?
Who are the leading companies in pain medicines?
What restrains growth in pain medicines?
Table of Content
Chapter 1 Market Segmentation
- 1.1 Segmentation Framework
- 1.1.1 Product and Service Classification
- 1.1.2 Application and End-Use Classification
- 1.1.3 Technology and Solution Classification
- 1.1.4 Customer and Distribution Channel Classification
- 1.1.5 Geographic Segmentation
- 1.1.6 Market Segment Definitions and Boundaries
- 1.2 By Drug Class
- 1.2.1 NSAIDs
- 1.2.2 Anesthetics
- 1.2.3 Anticonvulsants
- 1.2.4 Anti-migraine Agents
- 1.2.5 Antidepressants
- 1.2.6 Opioids
- 1.2.7 Nonnarcotic Analgesics
- 1.3 By Indication
- 1.3.1 Arthritic Pain
- 1.3.2 Neuropathic Pain
- 1.3.3 Cancer Pain
- 1.3.4 Chronic Back Pain
- 1.3.5 Postoperative Pain
- 1.3.6 Migraine
- 1.3.7 Fibromyalgia
- 1.3.8 Muscle Sprain/Strain
- 1.3.9 Others
Chapter 2 Introduction
- 2.1 Report Objectives and Scope
- 2.2 Product Definition and Industry Terminology
- 2.3 Market Inclusions and Exclusions
- 2.4 Research Process
- 2.4.1 Primary Research and Expert Interviews
- 2.4.2 Secondary Research and Source Review
- 2.4.3 Top-Down and Bottom-Up Estimation
- 2.4.4 Data Triangulation and Verification
- 2.5 Market Size Measurement Basis
- 2.5.1 2025: USD 79.25 billion → 2035: USD 112.91 billion
- 2.6 Historical and Forecast Reference Periods
- 2.6.1 Historical Period: 2018-2025
- 2.6.2 Base Year: 2025
- 2.6.3 Forecast Period: 2025-2035
- 2.7 Research Assumptions and Limitations
Chapter 3 Executive Summary
- 3.1 Market Snapshot and Key Findings
- 3.2 Base-Year Market Size, 2025
- 3.3 Forecast Market Size, 2035
- 3.4 Revenue and Volume Growth Outlook
- 3.5 Key Demand and Supply Indicators
- 3.6 Leading Market Segments
- 3.7 Fastest-Growing Market Opportunities
- 3.8 Regional Performance Highlights
- 3.9 Technology and Industry Transformation
- 3.10 Competitive Landscape Summary
- 3.11 Analyst View and Strategic Implications
Chapter 4 Global Pain Management Drugs Market Trends and Developments
- 4.1 Historical Industry Development, 2018-2025
- 4.2 Recent Market Trends and Developments
- 4.3 Demand and Customer Behavior Trends
- 4.4 Technology and Product Innovation
- 4.5 Artificial Intelligence, Automation and Digitalization
- 4.6 Local Manufacturing and Supply Chain Realignment
- 4.7 Industry Partnerships, Mergers and Acquisitions
- 4.8 Sustainability and Circular Economy Developments
- 4.9 Government and Private Sector Investment Trends
- 4.10 Emerging Business Models and Commercialization
- 4.11 Industry Developments and Announcements
Chapter 5 Global Pain Management Drugs Market Production, Supply and Demand Analysis
- 5.1 Demand Trend and Consumption Analysis, 2018-2025
- 5.2 Demand Forecast, 2025-2035
- 5.3 Production and Output Trend, 2018-2025
- 5.4 Production and Output Forecast, 2025-2035
- 5.5 Installed Capacity and Capacity Utilization
- 5.6 Company-Wise Production Plants and Statistics
- 5.6.1 Installed Production Capacity
- 5.6.2 Actual Production
- 5.6.3 Planned Capacity and Expansion Targets
- 5.7 Supply Chain Structure and Procurement Trends
- 5.8 Supply-Demand Gap and Bottlenecks
- 5.9 Import Dependence and Sourcing Structure
- 5.10 Contract Manufacturing and Outsourcing
- 5.11 Regional Supply and Demand Concentration
Chapter 6 Global Pain Management Drugs Market Pricing Analysis
- 6.1 Pricing Structure and Measurement
- 6.2 Historical Pricing Trends, 2018-2025
- 6.3 Pricing Outlook, 2025-2035
- 6.4 Average Selling Price and Unit Economics
- 6.5 Pricing by Product and Market Segment
- 6.6 Geographic Pricing Differences
- 6.7 Key Input, Energy, Labor and Logistics Costs
- 6.8 Contract Pricing and Purchasing Models
- 6.9 Pricing Sensitivity and Competitive Positioning
- 6.10 Price, Margin and Profitability Implications
Chapter 7 Global Pain Management Drugs Market Dynamics
- 7.1 Market Growth Drivers
- 7.1.1 Demand-Side Drivers
- 7.1.2 Technology and Innovation Drivers
- 7.1.3 Infrastructure and Investment Drivers
- 7.1.4 Regulatory and Policy Drivers
- 7.2 Market Restraints
- 7.2.1 Cost and Affordability Constraints
- 7.2.2 Technology and Adoption Barriers
- 7.2.3 Supply Chain and Operational Constraints
- 7.3 Market Challenges
- 7.3.1 Competitive Pressure and Margin Erosion
- 7.3.2 Skills, Infrastructure and Implementation Gaps
- 7.4 Emerging Market Opportunities
- 7.5 Market Dynamics Impact and Time-Horizon Assessment
Chapter 8 Global Pain Management Drugs Value Chain Analysis
- 8.1 Industry Value Chain Overview
- 8.2 Upstream Suppliers and Critical Inputs
- 8.3 Technology and Component Providers
- 8.4 Manufacturing or Service Delivery
- 8.5 Distribution, Channel Partners and Integrators
- 8.6 Downstream Applications and End Users
- 8.7 Value Addition and Profit Pools
- 8.8 Vertical Integration and Outsourcing
- 8.9 Supplier Concentration and Risk
- 8.10 Supply Chain Localization and Resilience
Chapter 9 Global Pain Management Drugs Market Regulations and Policies
- 9.1 Relevant Laws, Standards and Compliance Frameworks
- 9.2 Product, Service, Safety and Quality Requirements
- 9.3 Government Policies, Incentives and Subsidies
- 9.4 Imports, Exports and Trade Barriers
- 9.5 Public Procurement and Local Content Requirements
- 9.6 Environmental and Sustainability Compliance
- 9.7 Upcoming Policy Changes and Market Implications
Chapter 10 Global Pain Management Drugs Market Hotspots and Opportunities
- 10.1 Market Opportunity Mapping and Growth Hotspots
- 10.2 High-Growth Applications and Customer Groups
- 10.3 Underserved Markets and White-Space Opportunities
- 10.4 Emerging Technology and Product Opportunities
- 10.5 New Capacity and Investment Hotspots
- 10.6 Market Entry and Expansion Opportunities
- 10.7 Distribution and Partnership Opportunities
- 10.8 Near-Term and Long-Term Commercial Potential
- 10.9 Opportunity Attractiveness and Execution Risks
Chapter 11 Global Pain Management Drugs Market Outlook, 2025-2035
- 11.1 Market Size and Analysis
- 11.1.1 Revenue (Market Measurement: 2025: USD 79.25 billion → 2035: USD 112.91 billion)
- 11.1.2 Market Volume and Quantity Sold
- 11.1.3 Historical Market Size, 2018-2025
- 11.1.4 Base-Year Market Size, 2025
- 11.2 Market Forecast, 2025-2035
- 11.2.1 Revenue Forecast to 2035
- 11.2.2 Volume Forecast to 2035
- 11.2.3 CAGR and Year-on-Year Growth
- 11.2.4 Incremental Revenue Opportunity
- 11.3 Forecast Assumptions and Scenario Analysis
- 11.3.1 Base-Case Forecast
- 11.3.2 Optimistic and Conservative Scenarios
- 11.3.3 Technology, Pricing and Policy Sensitivities
- 11.4 Market Attractiveness and Growth Outlook
Chapter 12 Global Pain Management Drugs Market Segmentation and Outlook
- 12.1 Segmentation Summary and Market Shares, 2025
- 12.2 Largest and Fastest-Growing Segments
- 12.3 By Drug Class - Market Size and Forecast, 2025-2035
- 12.3.1 Segment Definition and Scope
- 12.3.2 Historical Market Size, 2018-2025
- 12.3.3 Revenue Forecast, 2025-2035
- 12.3.4 Volume Forecast, 2025-2035
- 12.3.5 Base-Year Market Share, 2025
- 12.3.6 Segment CAGR and Growth Drivers
- 12.3.7 Subsegment Market Size and Forecast
- 12.3.7.1 NSAIDs
- 12.3.7.2 Anesthetics
- 12.3.7.3 Anticonvulsants
- 12.3.7.4 Anti-migraine Agents
- 12.3.7.5 Antidepressants
- 12.3.7.6 Opioids
- 12.3.7.7 Nonnarcotic Analgesics
- 12.3.8 Subsegment Pricing and Adoption Trends
- 12.3.9 Leading Suppliers and Competition
- 12.3.10 Regional Demand and Opportunities
- 12.4 By Indication - Market Size and Forecast, 2025-2035
- 12.4.1 Segment Definition and Scope
- 12.4.2 Historical Market Size, 2018-2025
- 12.4.3 Revenue Forecast, 2025-2035
- 12.4.4 Volume Forecast, 2025-2035
- 12.4.5 Base-Year Market Share, 2025
- 12.4.6 Segment CAGR and Growth Drivers
- 12.4.7 Subsegment Market Size and Forecast
- 12.4.7.1 Arthritic Pain
- 12.4.7.2 Neuropathic Pain
- 12.4.7.3 Cancer Pain
- 12.4.7.4 Chronic Back Pain
- 12.4.7.5 Postoperative Pain
- 12.4.7.6 Migraine
- 12.4.7.7 Fibromyalgia
- 12.4.7.8 Muscle Sprain/Strain
- 12.4.7.9 Others
- 12.4.8 Subsegment Pricing and Adoption Trends
- 12.4.9 Leading Suppliers and Competition
- 12.4.10 Regional Demand and Opportunities
- 12.5 Segment Growth Comparison
- 12.6 Segment Attractiveness and Priority Matrix
Chapter 13 Global Pain Management Drugs Geographic Market Outlook, 2025-2035
- 13.1 Regional Market Size and Share, 2025
- 13.2 Regional Market Forecast, 2025-2035
- 13.3 Regional Pricing, Production and Demand Differences
- 13.4 North America
- 13.4.1 United States
- 13.4.2 Canada
- 13.4.3 Mexico
- 13.5 Europe
- 13.5.1 Germany
- 13.5.2 France
- 13.5.3 Italy
- 13.5.4 United Kingdom
- 13.5.5 Spain
- 13.5.6 Poland
- 13.5.7 Russia
- 13.5.8 Netherlands
- 13.5.9 Belgium
- 13.5.10 Sweden
- 13.5.11 Denmark
- 13.5.12 Norway
- 13.5.13 Rest of Europe
- 13.6 Asia Pacific
- 13.6.1 China
- 13.6.2 India
- 13.6.3 Japan
- 13.6.4 South Korea
- 13.6.5 Thailand
- 13.6.6 Indonesia
- 13.6.7 Vietnam
- 13.6.8 Malaysia
- 13.6.9 Australia
- 13.6.10 Rest of Asia Pacific
- 13.7 Latin America
- 13.7.1 Brazil
- 13.7.2 Argentina
- 13.7.3 Colombia
- 13.7.4 Chile
- 13.7.5 Rest of Latin America
- 13.8 Middle East
- 13.8.1 Saudi Arabia
- 13.8.2 United Arab Emirates
- 13.8.3 Turkey
- 13.8.4 Israel
- 13.8.5 Iran
- 13.8.6 Rest of the Middle East
- 13.9 Africa
- 13.9.1 South Africa
- 13.9.2 Egypt
- 13.9.3 Nigeria
- 13.9.4 Morocco
- 13.9.5 Rest of Africa
- 13.10 Regional Investment, Policy and Supply Chain Differences
- 13.11 Regional Competitive Landscape
- 13.12 Geographic Growth Hotspots
Chapter 14 Global Pain Management Drugs Technology, Innovation and Sustainability Outlook
- 14.1 Technology Landscape and Maturity
- 14.2 Product, Process and Service Innovation
- 14.3 AI, Automation and Digital Tools in the Industry
- 14.4 Technology Adoption and Performance Benchmarking
- 14.5 Innovation Pipeline and R&D Investment
- 14.6 Patent and Intellectual Property Trends
- 14.7 Energy Efficiency and Resource Management
- 14.8 Sustainability, Recycling and Circularity
- 14.9 Technology Roadmap, 2025-2035
- 14.10 Risks of Obsolescence and Technology Substitution
Chapter 15 Global Pain Management Drugs Market Key Strategic Imperatives
- 15.1 Growth and Market Entry Priorities
- 15.2 High-Return Products and Segments
- 15.3 Pricing, Profitability and Cost Optimization
- 15.4 Technology Investment and Product Differentiation
- 15.5 Supply Chain Localization and Resilience
- 15.6 Distribution and Customer Acquisition
- 15.7 Partnership, Acquisition and Capacity Strategy
- 15.8 Regional Expansion Priorities
- 15.9 Short-, Medium- and Long-Term Actions
Chapter 16 Competition Outlook
- 16.1 Industry Competition Characteristics
- 16.2 Market Structure and Concentration
- 16.3 Market Share and Competitive Positioning, 2025
- 16.4 Company-Wise Revenue and Product Benchmarking
- 16.5 Production and Service Capacity Benchmarking
- 16.6 Technology, Pricing and Differentiation
- 16.7 Regional Footprint and Distribution Strength
- 16.8 Mergers, Acquisitions and Strategic Alliances
- 16.9 New Entrants and Competitive Threats
- 16.10 Porter's Five Forces and Industry Attractiveness
- 16.11 Competitive Outlook, 2025-2035
Chapter 17 Company Profiles
- 17.1 Company Coverage and Selection Criteria
- 17.2 Novartis AG
- 17.2.1 Business Description
- 17.2.2 Company Ownership and Geographic Presence
- 17.2.3 Product and Service Portfolio
- 17.2.4 Manufacturing and Operating Footprint
- 17.2.5 Production Capacity and Expansion Plans
- 17.2.6 Financial Performance and Investment
- 17.2.7 Market Share and Competitive Position
- 17.2.8 Technology and Innovation Capabilities
- 17.2.9 Strategic Alliances or Partnerships
- 17.2.10 Recent Developments
- 17.2.11 Growth Strategy and Outlook
- 17.3 Johnson & Johnson Services Inc.
- 17.4 Viatris Inc.
- 17.5 GSK plc
- 17.6 Pfizer Inc.
- 17.7 Merck & Co. Inc.
- 17.8 Abbott Laboratories
- 17.9 Cipla Ltd
- 17.10 Purdue Pharma L.P.
- 17.11 Endo Health Solutions Inc.
- 17.12 Other Relevant Market Participants
Note: Every listed company is profiled on the structure shown under the first company. The company list is preliminary and may change based on research findings, market developments, data availability and client requirements.
Chapter 18 Disclaimer
- 18.1 Research and Forecast Disclaimer
- 18.2 Data Source and Estimation Limitations
Note: The depth of individual sections depends on data availability for this market. Volume, capacity, trade and other unit-based metrics are included where applicable.

