
Market Overview
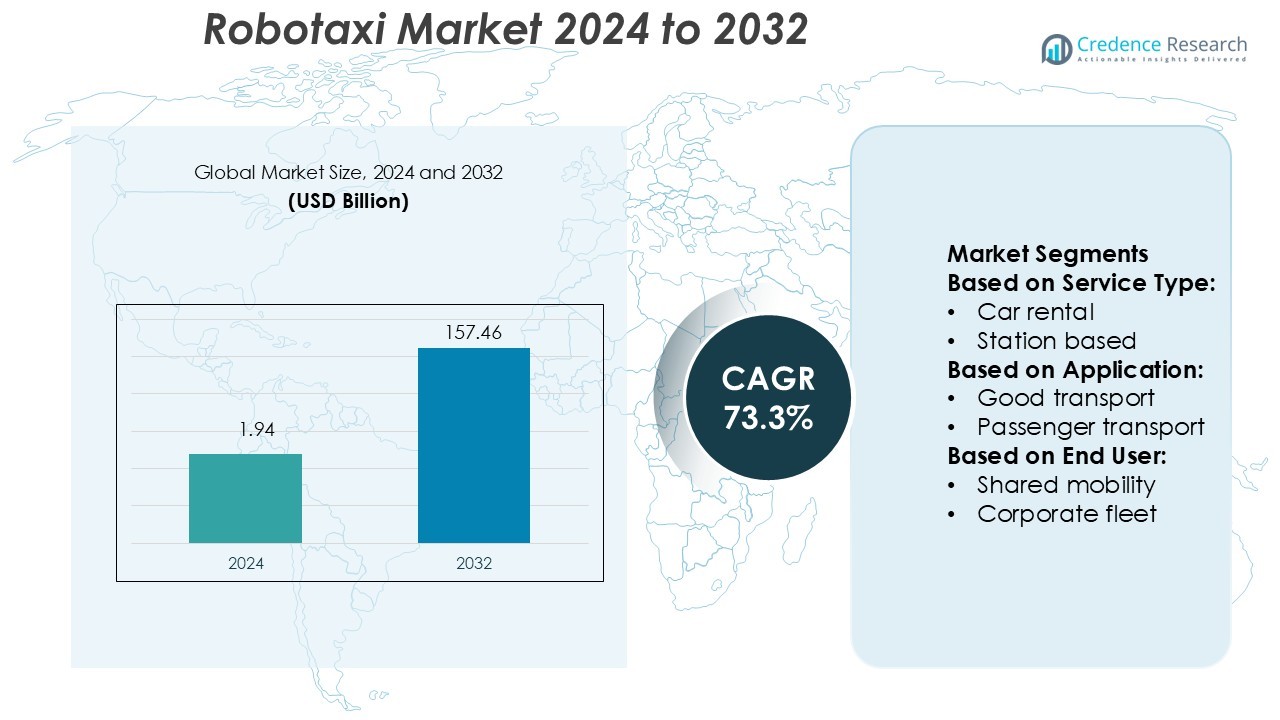
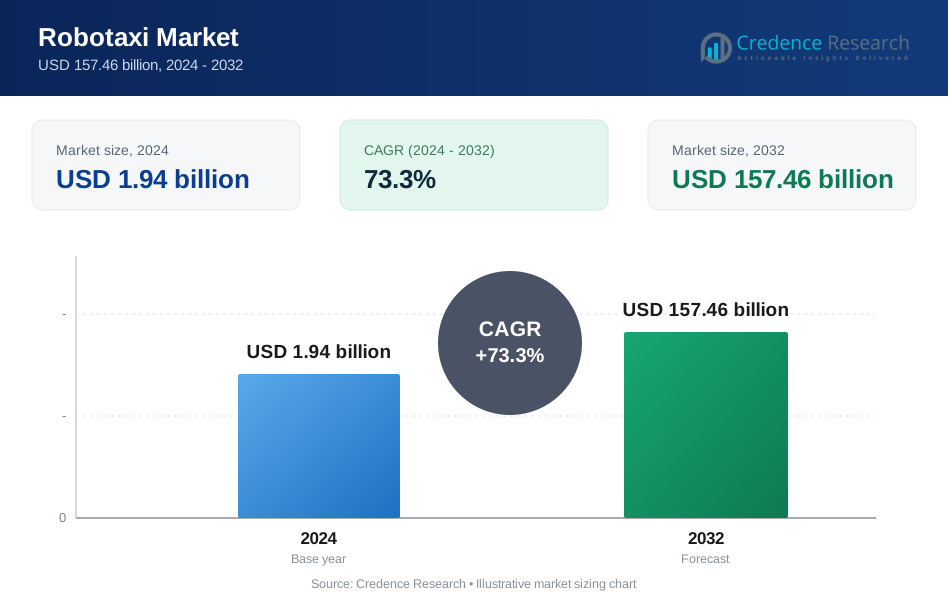
Robotaxi Market size was valued USD 1.94 billion in 2024 and is anticipated to reach USD 157.46 billion by 2032, at a CAGR of 73.3% during the forecast period.
| REPORT ATTRIBUTE | DETAILS |
|---|---|
| Historical Period | 2020-2023 |
| Base Year | 2024 |
| Forecast Period | 2025-2032 |
| Robotaxi Market Size 2024 | USD 1.94 Billion |
| Road Safety Market, CAGR | 73.3% |
| Road Safety Market Size 2032 | USD 157.46 Billion |
The robotaxi market is characterized by strong competition among leading companies, including Aptiv, Lyft, Inc., Zoox, Inc., Waymo LLC, Baidu, Inc., Uber Technologies Inc., Cruise LLC, Didi Chuxing Technology Co., Ltd., EasyMile, and Tesla Inc. These players are accelerating commercialization through strategic partnerships, advanced AI integration, and large-scale pilot programs. Waymo and Cruise lead urban deployments, while Baidu and Didi are expanding across Asia with strong government backing. Tesla focuses on integrating autonomous driving systems into its fleet. North America leads the global market with a 37% share, driven by mature infrastructure, regulatory support, and early adoption of autonomous mobility solutions.
Market Insights
- The robotaxi market size was valued at USD 1.94 billion in 2024 and is projected to reach USD 157.46 billion by 2032, at a CAGR of 73.3% during the forecast period.
- Strong regulatory support, urban mobility demand, and rapid advancements in AI and sensor technology are driving market expansion globally.
- Key players are focusing on strategic partnerships, pilot programs, and autonomous driving innovation to gain a competitive edge and expand fleet operations.
- High deployment costs and regulatory complexities remain major restraints, slowing large-scale adoption in some regions.
- North America leads with a 37% regional share, followed by Europe at 29% and Asia Pacific at 24%, while car rental dominates the service type segment with the largest market share.
 Market Segmentation Analysis:
By Service Type
Car rental leads the service type segment with a significant market share. This dominance is driven by flexible pricing, ease of access, and growing demand for short-distance autonomous rides. Robotaxi fleets in car rental models offer on-demand mobility without ownership costs, attracting urban commuters. Station-based services are expanding at a steady pace through fixed pickup and drop-off locations, supporting structured traffic flow and fleet optimization. The integration of advanced navigation, AI-driven dispatching, and route optimization strengthens service reliability, making car rental models the preferred option in high-density cities.
- For instance, Dhruva Space launched two Thybolt nanosatellites in November 2022, each weighing less than 750 grams. The mission was a technology demonstration for a store-and-forward communications payload for amateur radio operators.
By Application
Passenger transport holds the largest share in the application segment, supported by the rapid expansion of urban mobility networks. The demand for convenient, cost-efficient, and driverless commuting solutions fuels the adoption of robotaxis for daily transportation. Rising congestion levels and parking challenges in metropolitan areas further increase reliance on autonomous ride-hailing. Goods transport is gaining momentum as companies adopt robotaxi technology for last-mile deliveries. Automated fleets help reduce operational costs and enhance delivery efficiency, driving growth in logistics applications.
- For instance, Boeing’s contribution to the GOES‑15 weather satellite included a launch mass of 3,238 kg and a power system delivering about 2.3 kW at beginning-of-life.
By End User
Shared mobility dominates the end-user segment, accounting for the majority share due to its cost-effectiveness and high utilization rates. Urban residents increasingly prefer shared autonomous rides for daily travel, reducing private car ownership and parking demands. The shared model enables fleet operators to maximize vehicle uptime, improving profitability. Corporate fleet adoption is rising steadily, supported by enterprises integrating robotaxis into employee mobility programs. These fleets enhance operational efficiency and lower emissions, aligning with corporate sustainability goals and regulatory incentives.
Key Growth Drivers
Rising Demand for Autonomous Mobility Solutions
The growing preference for driverless vehicles is a major growth driver. Robotaxis reduce dependency on private vehicles, lower ownership costs, and improve transport efficiency. Urban areas face increasing congestion, creating demand for flexible and sustainable mobility services. Autonomous vehicles equipped with advanced sensors and AI systems offer safer and more reliable transport. Governments are supporting pilot programs and commercial operations, accelerating adoption. Companies are expanding fleets to meet rising commuter demand, positioning robotaxis as a core part of future mobility networks.
- For instance, EnduroSat’s Gen3 satellite platform, unveiled in 2025, features a payload capacity of up to 70 kg for certain models (such as the FRAME SmallSat), peak power of up to 3.5 kW, and data throughput of 2 Gbps, enabling rapid transmission of high-resolution environmental data.
Government Support and Regulatory Initiatives
Supportive policies and structured regulations are fueling market expansion. Governments across major economies are offering incentives for autonomous mobility deployment. Pilot programs, smart infrastructure investments, and emission reduction targets encourage fleet operators to adopt robotaxis. Regulations are creating frameworks for safety, operational guidelines, and liability standards, building trust among users. Strategic partnerships between public agencies and private mobility firms are strengthening infrastructure readiness. These coordinated efforts are driving market adoption and accelerating large-scale robotaxi deployment in urban transportation systems.
- For instance, Airbus Pléiades Neo constellation currently consists of two active satellites (launched in 2021) that deliver 30 cm native resolution imagery. Two additional satellites (Neo 5 and 6) were lost in a launch failure in December 2022, which prevented the full four-satellite constellation from being deployed.
Advancements in Autonomous Vehicle Technology
Rapid advancements in AI, LiDAR, sensors, and vehicle connectivity are boosting market growth. Improved perception systems enhance route accuracy, collision avoidance, and safety standards. Autonomous vehicles are now capable of operating in complex urban traffic environments with minimal human intervention. Companies are integrating over-the-air updates, enhancing fleet performance and adaptability. These innovations reduce operating costs and enable scalable fleet management. Enhanced software reliability and real-time data processing are increasing consumer confidence and supporting large-scale commercial robotaxi operations globally.
Key Trends & Opportunities
Expansion of Shared Mobility Ecosystems
Shared mobility models are emerging as a key opportunity for robotaxi deployment. The shared model allows cost-effective travel, high fleet utilization, and lower per-ride emissions. Urban populations prefer shared rides over private ownership, creating strong market potential. Companies are integrating robotaxis into existing mobility platforms, enabling seamless booking and payment systems. Subscription-based models and dynamic pricing further enhance user engagement. This trend aligns with cities’ sustainability goals and encourages operators to scale fleets efficiently in high-demand corridors.
- For instance, INVAP's SAOCOM-1A and SAOCOM-1B satellites, launched in 2018 and 2020, each carry an L-band synthetic aperture radar with a 6.7 kW peak transmit power. Each satellite has a dry mass of around 1,600 kg and an overall launch mass of around 3,050 kg.
Integration with Smart Infrastructure
The integration of robotaxis with connected infrastructure presents a strong growth opportunity. Smart traffic signals, V2X communication, and intelligent transport systems enhance operational efficiency. These integrations reduce travel time, improve energy consumption, and optimize route planning. Cities investing in smart mobility corridors are enabling smoother navigation for autonomous vehicles. This trend supports safer and faster commercialization of robotaxi services. Collaboration between public agencies and technology firms ensures scalable infrastructure deployment that accelerates mass adoption.
- For instance, Blue Canyon Technologies offers the X-SAT Venus Class microsatellite platform, which supports a payload mass of up to 90 kg, though some variants of the platform may have lower payload capacities.
Rising Investment in Fleet Expansion
Fleet operators are increasingly investing in large-scale robotaxi deployments. Strategic partnerships and funding rounds enable technology upgrades and geographic expansion. Companies are focusing on autonomous electric vehicles to cut fuel costs and reduce emissions. Pilot programs in major cities demonstrate the operational feasibility of robotaxis, attracting more investors. This investment surge supports manufacturing growth, infrastructure development, and technological innovation.
Key Challenges
High Deployment and Maintenance Costs
Robotaxi operations require significant investment in advanced sensors, AI systems, and fleet infrastructure. The initial deployment cost is high, especially for scaling fleets in multiple cities. Maintenance and software upgrade expenses further increase operational costs. These factors limit smaller operators from entering the market and delay mass deployment. High costs also impact profitability timelines, requiring sustained investment from public and private stakeholders.
Safety, Liability, and Regulatory Uncertainty
Unclear regulatory frameworks and liability concerns pose major challenges. Autonomous vehicles must comply with evolving safety standards, which vary across regions. Accidents or malfunctions raise liability and insurance complexities. Building public trust remains critical, as consumers expect high safety assurance. Delays in policy standardization can slow commercial rollouts and affect investor confidence, making clear regulations essential for large-scale deployment.
Regional Analysis
North America
North America leads the global robotaxi market with a 37% share, driven by strong technological capabilities and early adoption of autonomous mobility. The U.S. dominates regional deployment through extensive pilot programs in major cities. High investment from technology firms and automakers accelerates commercialization. Well-developed road infrastructure and favorable regulatory environments support large-scale operations. Partnerships between ride-hailing companies and OEMs further strengthen market growth. Rising urbanization and strong consumer acceptance of autonomous transport make North America a key hub for robotaxi innovation and fleet expansion.
Europe
Europe holds a 29% market share, supported by strong government backing for sustainable and autonomous mobility. Countries like Germany, France, and the U.K. are investing heavily in smart city projects and pilot programs. Strict emission reduction policies accelerate the adoption of electric robotaxis. Advanced transport infrastructure and harmonized regulations enable smooth integration into urban mobility systems. Strategic collaborations between automotive manufacturers and technology providers drive regional growth. Consumer demand for efficient and eco-friendly transport solutions continues to boost adoption across major European cities.
Asia Pacific
Asia Pacific accounts for 24% of the robotaxi market, emerging as one of the fastest-growing regions. China and Japan lead with rapid fleet expansion and strong R&D investments. Growing urban populations and traffic congestion increase demand for autonomous mobility solutions. Governments support robotaxi trials and infrastructure development to reduce emissions and improve urban mobility. Technology firms and automakers collaborate to deploy cost-effective solutions tailored to local needs. Strong adoption in high-density cities positions Asia Pacific as a key market for future expansion.
Latin America
Latin America holds a 6% share of the global market, with early adoption led by Brazil and Mexico. The region is focusing on integrating autonomous solutions to address urban congestion and public transport gaps. Investments in pilot programs and partnerships with technology companies are expanding robotaxi availability. Infrastructure limitations and regulatory gaps slow large-scale deployment but create room for future growth. Government initiatives promoting smart mobility and electrification are expected to accelerate adoption in the coming years.
Middle East & Africa
The Middle East & Africa region captures a 4% share, with growth driven by smart city initiatives in the UAE and Saudi Arabia. High investments in advanced infrastructure and autonomous mobility programs strengthen market readiness. Governments actively support the deployment of autonomous fleets to enhance urban transport efficiency. Pilot projects in major cities like Dubai are positioning the region as a strategic testing ground. While adoption remains in early stages, supportive policies and infrastructure development are creating strong long-term growth potential.
Market Segmentations:
By Service Type:
- Car rental
- Station based
By Application:
- Good transport
- Passenger transport
By End User:
- Shared mobility
- Corporate fleet
By Geography
- North America
- U.S.
- Canada
- Mexico
- Europe
- Germany
- France
- U.K.
- Italy
- Spain
- Rest of Europe
- Asia Pacific
- China
- Japan
- India
- South Korea
- South-east Asia
- Rest of Asia Pacific
- Latin America
- Brazil
- Argentina
- Rest of Latin America
- Middle East & Africa
- GCC Countries
- South Africa
- Rest of the Middle East and Africa
Competitive Landscape
The competitive landscape of the robotaxi market features key players including Aptiv, Lyft, Inc., Zoox, Inc., Waymo LLC, Baidu, Inc., Uber Technologies Inc., Cruise LLC, Didi Chuxing Technology Co., Ltd., EasyMile, and Tesla Inc. The robotaxi market is highly competitive, shaped by rapid technological progress and strategic partnerships. Companies are focusing on scaling autonomous fleets, improving vehicle safety, and integrating AI-driven systems to enhance operational efficiency. Investments in advanced sensor technologies, real-time data processing, and vehicle-to-infrastructure connectivity are accelerating commercial deployments. Pilot programs across major cities are validating service reliability and user acceptance. Ride-hailing platforms are integrating autonomous fleets to reduce operating costs and expand mobility access. Continuous innovation, supportive regulations, and infrastructure development are intensifying market competition and setting the stage for large-scale adoption.
Key Player Analysis
- Aptiv
- Lyft, Inc.
- Zoox, Inc.
- Waymo LLC
- Baidu, Inc.
- Uber Technologies Inc.
- Cruise LLC
- Didi Chuxing Technology Co., Ltd.
- EasyMile
- Tesla Inc.
Recent Developments
- In June 2025, Tesla, Inc. announced it would begin testing its long-anticipated robotaxi service in Austin, Texas, by the end of June. The initial rollout will include around 10 self-driving vehicles operating in select areas of the city. Over the following months, the company plans to scale the fleet up to approximately 1,000 vehicles.
- In September 2024, Foster City-based Zoox announced that they are entering the Bay Area robotaxi market with uniquely designed autonomous vehicles, featuring inward-facing seats and dual-side doors, aiming to differentiate itself from traditional robotaxi models.
- In June 2024, Waymo expanded its Waymo One robotaxi service beyond pilot stages across San Francisco, allowing anyone to hail self-driving rides via its app. Waymo's fleet is all-electric and uses renewable energy, serving over 300,000 riders.
- In November 2023, Hyundai Motor Group and Motional announced the manufacture of the all-electric IONIQ 5 robotaxi at the new Hyundai Motor Group Innovation Center Singapore, with initial models set for U.S. deployment in 2024.
Report Coverage
The research report offers an in-depth analysis based on Service Type, Application, End-User and Geography. It details leading market players, providing an overview of their business, product offerings, investments, revenue streams, and key applications. Additionally, the report includes insights into the competitive environment, SWOT analysis, current market trends, as well as the primary drivers and constraints. Furthermore, it discusses various factors that have driven market expansion in recent years. The report also explores market dynamics, regulatory scenarios, and technological advancements that are shaping the industry. It assesses the impact of external factors and global economic changes on market growth. Lastly, it provides strategic recommendations for new entrants and established companies to navigate the complexities of the market.
Future Outlook
- Autonomous fleet deployment will expand rapidly across major urban centers.
- Integration with smart city infrastructure will enhance operational efficiency.
- Electric robotaxis will gain traction to support zero-emission mobility goals.
- AI-driven route optimization will reduce travel time and costs.
- Shared mobility models will dominate high-demand corridors.
- Regulatory frameworks will become more standardized across key markets.
- Advancements in sensor technologies will improve safety and reliability.
- Strategic partnerships will accelerate fleet expansion and service coverage.
- Consumer trust in autonomous transport will continue to grow steadily.
- Robotaxis will play a central role in shaping future urban mobility systems.
Request a Free Sample
Fill in your details and we'll send you a free sample report.
- Sample data tables & charts
- Research methodology
Need a Custom Version of This Report?
Tailor the scope, geography, or segments to your exact requirements.
- Custom geography or segment scope
- Direct access to our analyst team
Frequently Asked Questions
What is the current market size for the Robotaxi Market, and what is its projected size in 2032?
At what Compound Annual Growth Rate is the Robotaxi Market projected to grow between 2025 and 2032?
Which Robotaxi Market segment held the largest share in 2024?
What are the primary factors fueling the growth of the Robotaxi Market?
Who are the leading companies in the Robotaxi Market?
Which region commanded the largest share of the Robotaxi Market in 2024?
Table of Content
Chapter 1. Report Introduction
- 1.1 Report Description & Purpose
- 1.1.1 Report Title & Market Definition
- 1.1.2 Unique Selling Propositions (USP) & Key Differentiators
- 1.1.3 Value Proposition for Stakeholders
- 1.2 Research Objectives
- 1.2.1 Market Sizing Objectives (Volume & Revenue)
- 1.2.2 Segmentation Objectives
- 1.2.3 Competitive Intelligence Objectives
- 1.2.4 Forecast & Scenario Objectives
- 1.3 Report Scope
- 1.3.1 Robotaxi Scope – Types & Subtypes Covered
- 1.3.2 Geographic Scope – Regions & Countries Covered
- 1.3.3 Historical Period, Base Year & Forecast Period (2024; forecast to 2032)
- 1.3.4 Inclusions & Exclusions
- 1.4 HS Code & Classification Framework
- 1.5 Currency, Units & Pricing Basis
- 1.6 Target Stakeholders
- 1.7 Limitations & Assumptions
Chapter 2. Executive Summary
- 2.1 Global Robotaxi Market Snapshot
- 2.1.1 Market Size – Historical (2024) & Forecast (2024-2032) (2024: USD 1.94 billion → 2032: USD 157.46 billion)
- 2.1.2 Volume & Revenue – Global Totals
- 2.1.3 Key Market Highlights – Top Five Facts
- 2.2 Robotaxi Market Segmentation Snapshot
- 2.2.1 Market Split by Region – 2024 vs. 2032
- 2.3 Competitive Snapshot
- 2.3.1 Top 10 Players by Revenue Share – 2024
- 2.3.2 Top 10 Players by Volume Share – 2024
- 2.3.3 Recent Strategic Developments (18-Month Summary)
- 2.4 Key Investment Highlights & Strategic Conclusions
Chapter 3. Robotaxi Market Dynamics & Industry Analysis
- 3.1 Market Overview & Context
- 3.1.1 Robotaxi Market Position in the Broader Automotive Value Chain
- 3.1.2 OEM vs. Replacement Market Dynamics
- 3.1.3 Market Maturity & Development Stage by Region
- 3.2 Robotaxi Market Drivers
- 3.3 Robotaxi Market Restraints & Challenges
- 3.4 Robotaxi Market Opportunities
- 3.5 Porter's Five Forces Analysis
- 3.5.1 Threat of New Entrants
- 3.5.2 Bargaining Power of Suppliers
- 3.5.3 Bargaining Power of Buyers
- 3.5.4 Threat of Substitutes
- 3.5.5 Competitive Rivalry – Intensity Assessment
- 3.6 Robotaxi Value Chain Analysis
- 3.6.1 Upstream – Raw Material/Input Suppliers
- 3.6.1.1 Raw Material/Input 1
- 3.6.1.2 Raw Material/Input 2
- 3.6.1.3 Raw Material/Input 3
- 3.6.2 Midstream – Production/Manufacturing/Service Delivery
- 3.6.2.1 Production/Process Overview
- 3.6.2.2 Key Facility Locations & Capacity by Manufacturer
- 3.6.3 Downstream – Distribution & End Consumer
- 3.6.3.1 Primary Channel – B2B/OEM
- 3.6.3.2 Secondary Channels – Dealer, Retail, Online, Direct
- 3.6.4 Value Chain Profitability Analysis
- 3.6.1 Upstream – Raw Material/Input Suppliers
- 3.7 PESTEL Analysis
- 3.7.1 Political Factors
- 3.7.2 Economic Factors
- 3.7.3 Social Factors
- 3.7.4 Technological Factors
- 3.7.5 Environmental Factors
- 3.7.6 Legal Factors
- 3.8 Robotaxi Supply Chain Analysis
- 3.8.1 Raw Material/Input Supply Risk Assessment
- 3.8.2 Manufacturing Concentration Risk (Geographic Exposure)
- 3.8.3 Trade Disruption Impact Analysis
- 3.9 Regulatory & Policy Landscape
Note: The regulatory and policy landscape section covers regulations based on their applicability to the market, Robotaxi category, geography, and scope of the study. Only regulatory frameworks with a material impact on operations, compliance, trade, sustainability, or market access are analyzed in detail.
Chapter 4. Key Investment Pockets & Opportunity Analysis
- 4.1 Robotaxi Market Attractiveness Analysis
- 4.1.1 By Region – Investment Attractiveness Matrix (Volume × CAGR)
- 4.2 Absolute Revenue Growth Opportunity
- 4.2.1 By Region – Absolute USD Growth Through 2032
- 4.3 Incremental Volume Opportunity
- 4.3.1 By Region – Incremental Volume Through 2032
- 4.3.2 Segment – Incremental Volume
- 4.4 Emerging Submarket Opportunity Deep Dive (Subject to Applicability)
- 4.5 Emerging Market Opportunity Scorecards
- 4.5.1 United States
- 4.5.2 Europe
- 4.5.3 Asia
- 4.5.4 Middle East & Africa
Note: Emerging Market Opportunity Scorecards will be included based on relevance and strategic importance. Regions listed are indicative and may vary depending on data availability and market dynamics.
Chapter 5. Robotaxi Import-Export Analysis & Trade Flows
- 5.1 Global Trade Overview
- 5.1.1 Global Export Value by Country (2024)
- 5.1.2 Global Export Volume by Country (2024)
- 5.1.3 Global Import Value by Country (2024)
- 5.1.4 Global Import Volume by Country (2024)
- 5.1.5 Net Trade Balance by Country (2024)
- 5.2 Export Analysis – Segment
- 5.2.1 Type 1 (HS Code)
- 5.2.2 Type 2 (HS Code)
- 5.2.3 Type 3 (HS Code)
- 5.2.4 Type 4 (HS Code)
- 5.2.5 Type 5 (HS Code)
- 5.3 Import Analysis – Segment
- 5.3.1 Type 1 (HS Code)
- 5.3.2 Type 2 (HS Code)
- 5.3.3 Type 3 (HS Code)
- 5.3.4 Type 4 (HS Code)
- 5.3.5 Type 5 (HS Code)
- 5.4 Average Unit Trade Prices
- 5.4.1 Average Export Price – Segment & Country
- 5.4.2 Average Import Price – Segment & Source Country
- 5.4.3 Price Trends (2024)
- 5.5 Key Trade Route Analysis
- 5.5.1 Trade Route 1
- 5.5.2 Trade Route 2
- 5.5.3 Trade Route 3
- 5.5.4 Trade Route 4
- 5.5.5 Trade Route 5
- 5.6 Trade Policy Impact Assessment
- 5.6.1 US Anti-Dumping & Section 301 Tariffs
- 5.6.2 EU Customs Union Impact
- 5.6.3 Major Free Trade Agreements
- 5.6.4 USMCA Rules of Origin
Note: Trade policy analysis will be included only where relevant to the Robotaxi market.
Chapter 6. Competitive Landscape & Company Benchmarking
- 6.1 Robotaxi Market Concentration & Structure
- 6.1.1 Herfindahl-Hirschman Index (HHI) – vs. 2024
- 6.1.2 Tier 1, Tier 2 & Tier 3 Market Structure
- 6.1.3 Global, Regional & Local Player Dynamics
- 6.2 Robotaxi Market Share Analysis – 2024
- 6.2.1 Global Revenue Share by Company
- 6.2.2 Global Volume Share by Company
- 6.2.3 Regional Revenue Share
- 6.2.4 Market Share Evolution ( vs. 2024)
- 6.2.5 OEM Segment Share by Company
- 6.2.6 Replacement Segment Share by Company
- 6.3 Production/Delivery Capacity & Facility Analysis
- 6.3.1 Global Installed Capacity
- 6.3.2 Capacity Utilization Rates
- 6.3.3 Production/Output Volume
- 6.3.4 Facility Locations & Capacity Map
- 6.3.5 Planned Capacity Additions
- 6.4 Robotaxi Competitive Benchmarking Matrix
- 6.4.1 Revenue, Volume, CAGR & Profitability Comparison
- 6.4.2 Channel Revenue Mix
- 6.4.3 Geographic Revenue Exposure
- 6.4.4 R&D Intensity
- 6.4.5 Sustainability Maturity
- 6.5 Strategic Developments in Robotaxi (Last 24 Months)
- 6.5.1 Mergers, Acquisitions & Divestments
- 6.5.2 New Robotaxi Launches
- 6.5.3 Facility Expansions
- 6.5.4 Strategic Alliances, Joint Ventures & Partnerships
- 6.5.5 Distribution Expansion & Market Entry
- 6.5.6 Sustainability & ESG Initiatives
- 6.6 Competitive Strategy Mapping
- 6.6.1 Leader, Challenger, Follower & Niche Classification
- 6.6.2 Pricing Strategy Comparison
- 6.6.3 Channel Strategy Matrix
Note: Strategic developments are included based on their materiality and the availability of reliable information.
Chapter 7. Global Robotaxi Market – By Distribution Channel
- 7.1 Segment Overview
- 7.1.1 Volume & Revenue Split by Channel (2024 & 2032)
- 7.1.2 Channel Mix Evolution (2024-2032)
Chapter 8. Regional Market Analysis – Global Overview
- 8.1 Global Regional Overview
- 8.1.1 Regional Volume Share
- 8.1.2 Regional Revenue Share
- 8.1.3 Regional Volume by Region
- 8.1.4 Regional Revenue by Region
- 8.1.5 Regional Forecast Through 2032
- 8.2 Cross-Regional Segment Analysis
- 8.2.1 By Distribution Channel
- 8.2.2 By Brand/Price Tier
Chapter 9. North America Robotaxi Market
- 9.1 United States
- 9.2 Canada
- 9.3 Mexico
Chapter 10. Europe Robotaxi Market
- 10.1 Germany
- 10.2 France
- 10.3 Italy
- 10.4 United Kingdom
- 10.5 Spain
- 10.6 Poland
- 10.7 Russia
- 10.8 Netherlands
- 10.9 Belgium
- 10.10 Sweden
- 10.11 Denmark
- 10.12 Norway
- 10.13 Rest of Europe
Chapter 11. Asia Pacific Robotaxi Market
- 11.1 China
- 11.2 India
- 11.3 Japan
- 11.4 South Korea
- 11.5 Thailand
- 11.6 Indonesia
- 11.7 Vietnam
- 11.8 Malaysia
- 11.9 Australia
- 11.10 Rest of Asia Pacific
Chapter 12. Latin America Robotaxi Market
- 12.1 Brazil
- 12.2 Argentina
- 12.3 Colombia
- 12.4 Chile
- 12.5 Rest of Latin America
Chapter 13. Middle East Robotaxi Market
- 13.1 Saudi Arabia
- 13.2 United Arab Emirates
- 13.3 Turkey
- 13.4 Israel
- 13.5 Iran
- 13.6 Rest of the Middle East
Chapter 14. Africa Robotaxi Market
- 14.1 South Africa
- 14.2 Egypt
- 14.3 Nigeria
- 14.4 Morocco
- 14.5 Rest of Africa
Chapter 15. Robotaxi Company Profiles
- 15.1 [Company 01]
- 15.1.1 Company Overview
- 15.1.2 Key Management Personnel
- 15.1.3 Products & Services Portfolio
- 15.1.4 Financial Performance
- 15.1.5 Key Market Focus & Geographic Presence
- 15.1.6 Recent Developments & Strategic Initiatives
Note: The company profile list is preliminary and may change based on research findings, market developments, data availability, and client requirements.
Chapter 16. Appendices
- Appendix A – List of Abbreviations & Acronyms
- Appendix B – Industry Classification Code Reference – Full Series
- Appendix C – Production & Capacity Data Tables
- Appendix D – End-Use & Demand Base Tables
- Appendix E – Consumption & Replacement Rate Assumptions
- Appendix F – ASP Reference Tables
- Appendix G – Manufacturing & Facility Database
- Appendix H – Import-Export Data Tables
- Appendix I – Regulatory Summary Tables
- Appendix J – Primary Research Participant List (Anonymized)
- Appendix K – Primary Research Questionnaire Framework
- Appendix L – Data Sources & Bibliography
- Appendix M – Market Size Divergence & Source Comparison
Chapter 17. Research Methodology
- 17.1 Research Framework & Philosophy
- 17.2 Secondary Research – Sources, Hierarchy & Data Extraction
- 17.3 Data Modeling – Bottom-Up & Top-Down Market Sizing
- 17.4 Primary Research – Stakeholder Framework, LOI & Sample Sizes
- 17.5 Forecast Methodology – Regression, Scenario & Sensitivity Analysis
- 17.6 Quality Control – Four-Layer Validation Framework
- 17.7 Limitations & Standard Assumptions
- 17.8 Disclaimer
