
Fast sites and fleet contracts shape operator income
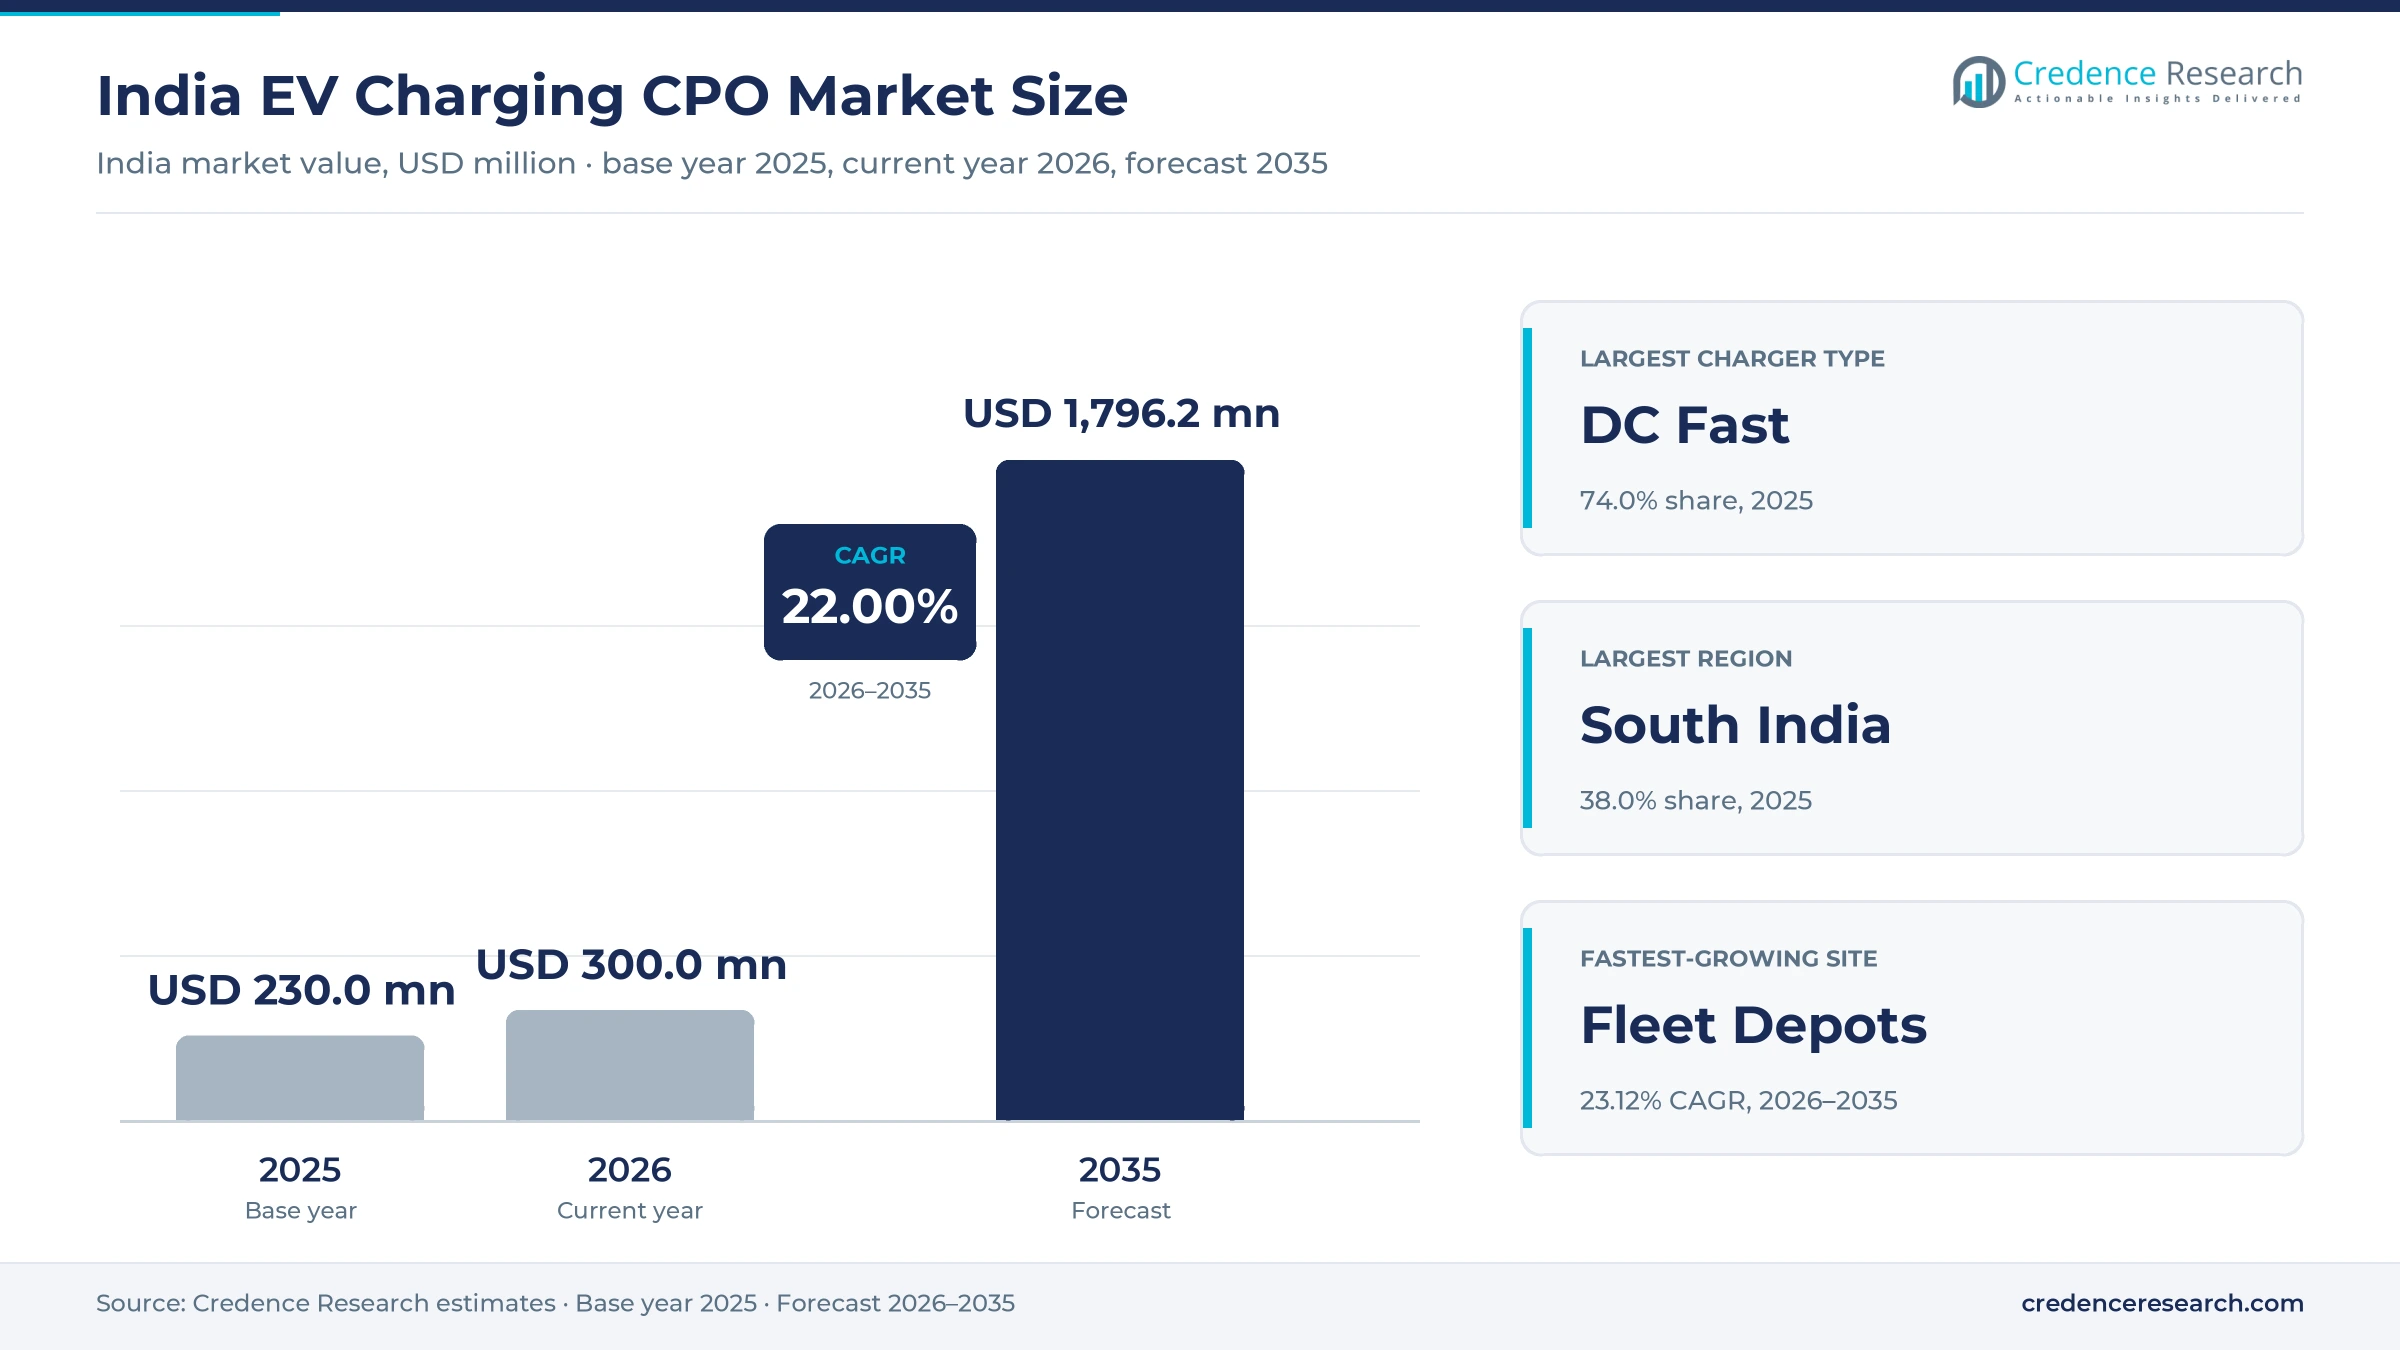
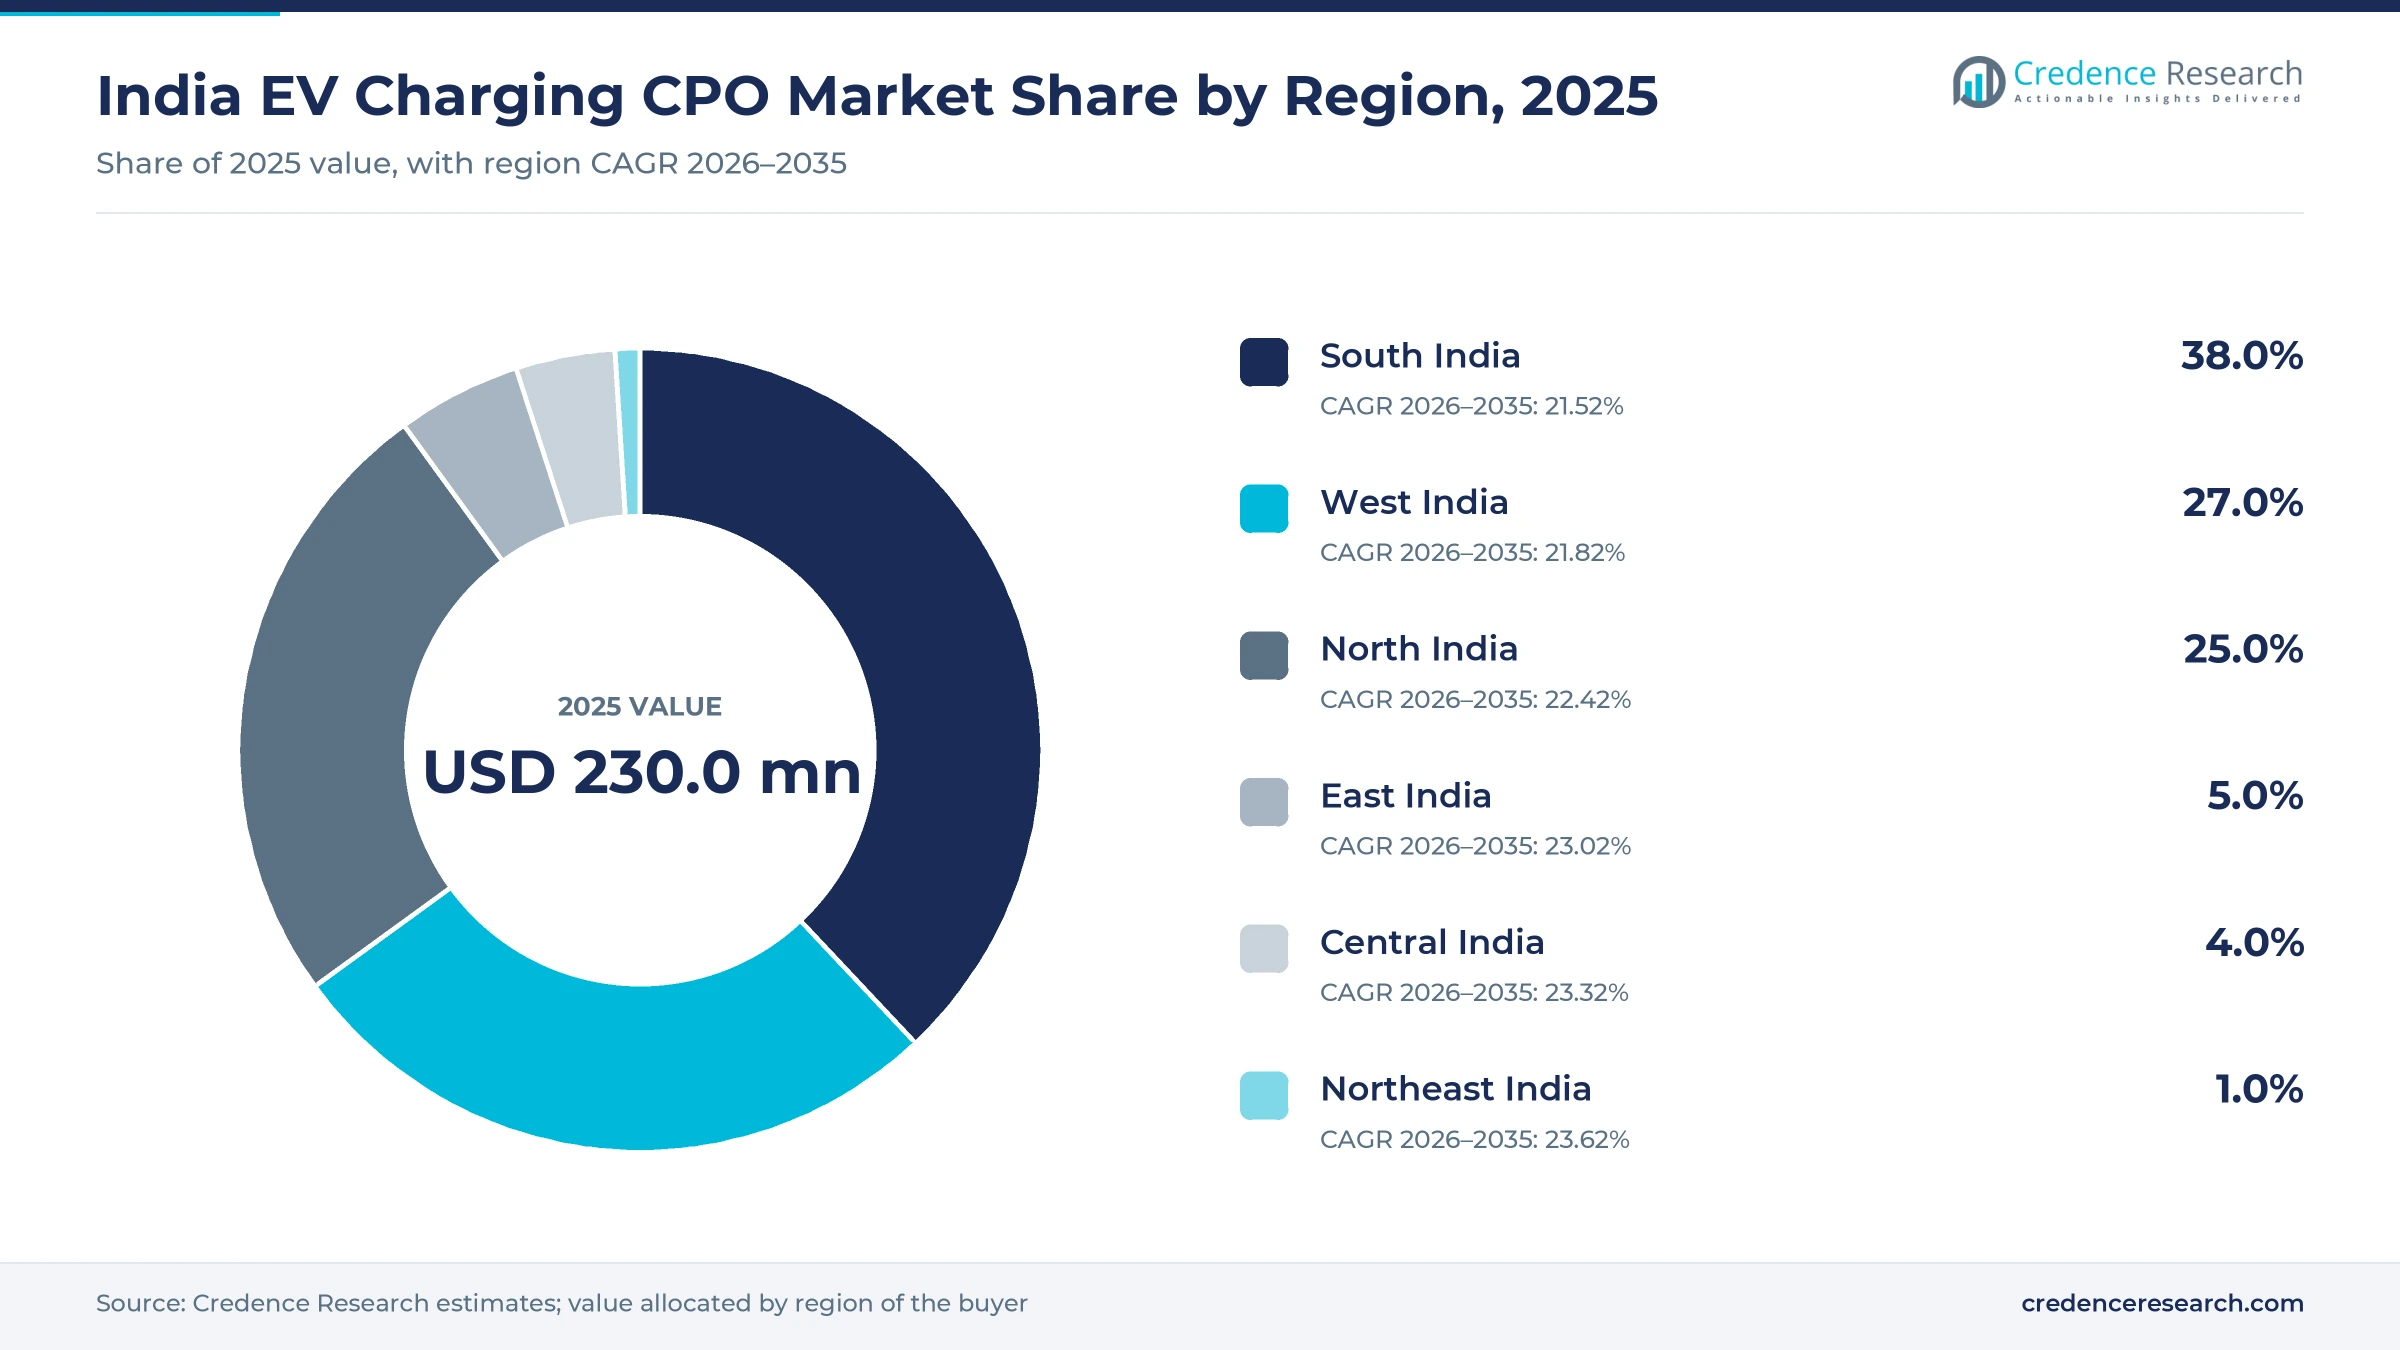
The India EV charging CPO market was valued at USD 230.0 million in 2025 and is projected to increase from USD 300.0 million in 2026 to USD 1.80 billion by 2035, registering a CAGR of 22.00% during 2026–2035. Charge-point operators earn this value mainly through per-kWh fees from highway, mall and fleet-depot sites, with subscriptions adding a smaller stream. Electric-vehicle sales reached about 2.55 million in fiscal 2025-26, according to the India Energy Storage Alliance, and that fleet is pushing operators toward DC fast sites along intercity and logistics routes. South India held the largest regional share, 38.0% in 2025, because Karnataka and Tamil Nadu combine dense car fleets with busy corridors out of Bengaluru. Northeast India is the fastest-growing region at 23.62% a year from a very small base. The Unified Bharat e-Charge platform, announced on May 12, 2026, by the Ministry of Heavy Industries with BHEL and NPCI, is also set to cut the number of apps that drivers need.
What does operator income in this market include?
The market counts what charge-point operators bill for energy and access at the sites they run, including public highway and mall locations and depots serving contracted fleets. Drivers usually pay by the unit through an app, while fleets buy energy under multi-year contracts. Membership plans add a recurring fee on top of that billing.
The estimate excludes charger hardware sales, home charger installation and battery swapping income, because those belong to equipment and swap businesses rather than operators. The value chain runs from the distribution utility and site owner through the charger maker to the operator, which handles uptime, payments and customer support.
India EV Charging CPO Market Insights
- Operator income rises from USD 230.0 million in 2025 to USD 1.80 billion by 2035 at a 22.00% CAGR, as billed energy grows faster than the number of stations in the network.
- South India held 38.0% of 2025 value, supported by Karnataka, which the Saur Energy count placed first among states in December 2025 with 6,096 public stations.
- DC Fast sites held 74.0% of 2025 value, because operators such as Tata Power bill far more energy per hour at fast chargers than at AC points.
- The Unified Bharat e-Charge platform, announced on May 12, 2026, aims to replace a situation in which drivers use 17 to 20 apps, according to the TATA.ev charging report.
- Capital is moving to asset-light models, as ChargeZone plans over 1,000 franchise stations by the end of fiscal 2027 and Statiq expands its franchise-owned, company-operated format.
DC fast, highway sites and energy fees anchor value
Why DC fast charging earns most operator income
Based on charger, the market is categorized into AC and DC fast. DC Fast led with 74.0% of 2025 value because a fast session bills far more energy per hour, and Tata Power reported 259.64 million units delivered in fiscal 2026 alongside 1,160-plus highway fast-charging points. AC keeps a role at offices and mall parking, shown by the six 11 kW Tesla destination chargers opened at Nexus Select CityWalk in Delhi in July 2026. DC Fast grows fastest at 22.50% a year as power ratings climb, with Jio-bp now running chargers rated up to 480 kW, according to GreenTechLead in November 2026.
Why highways lead while fleet depots grow fastest
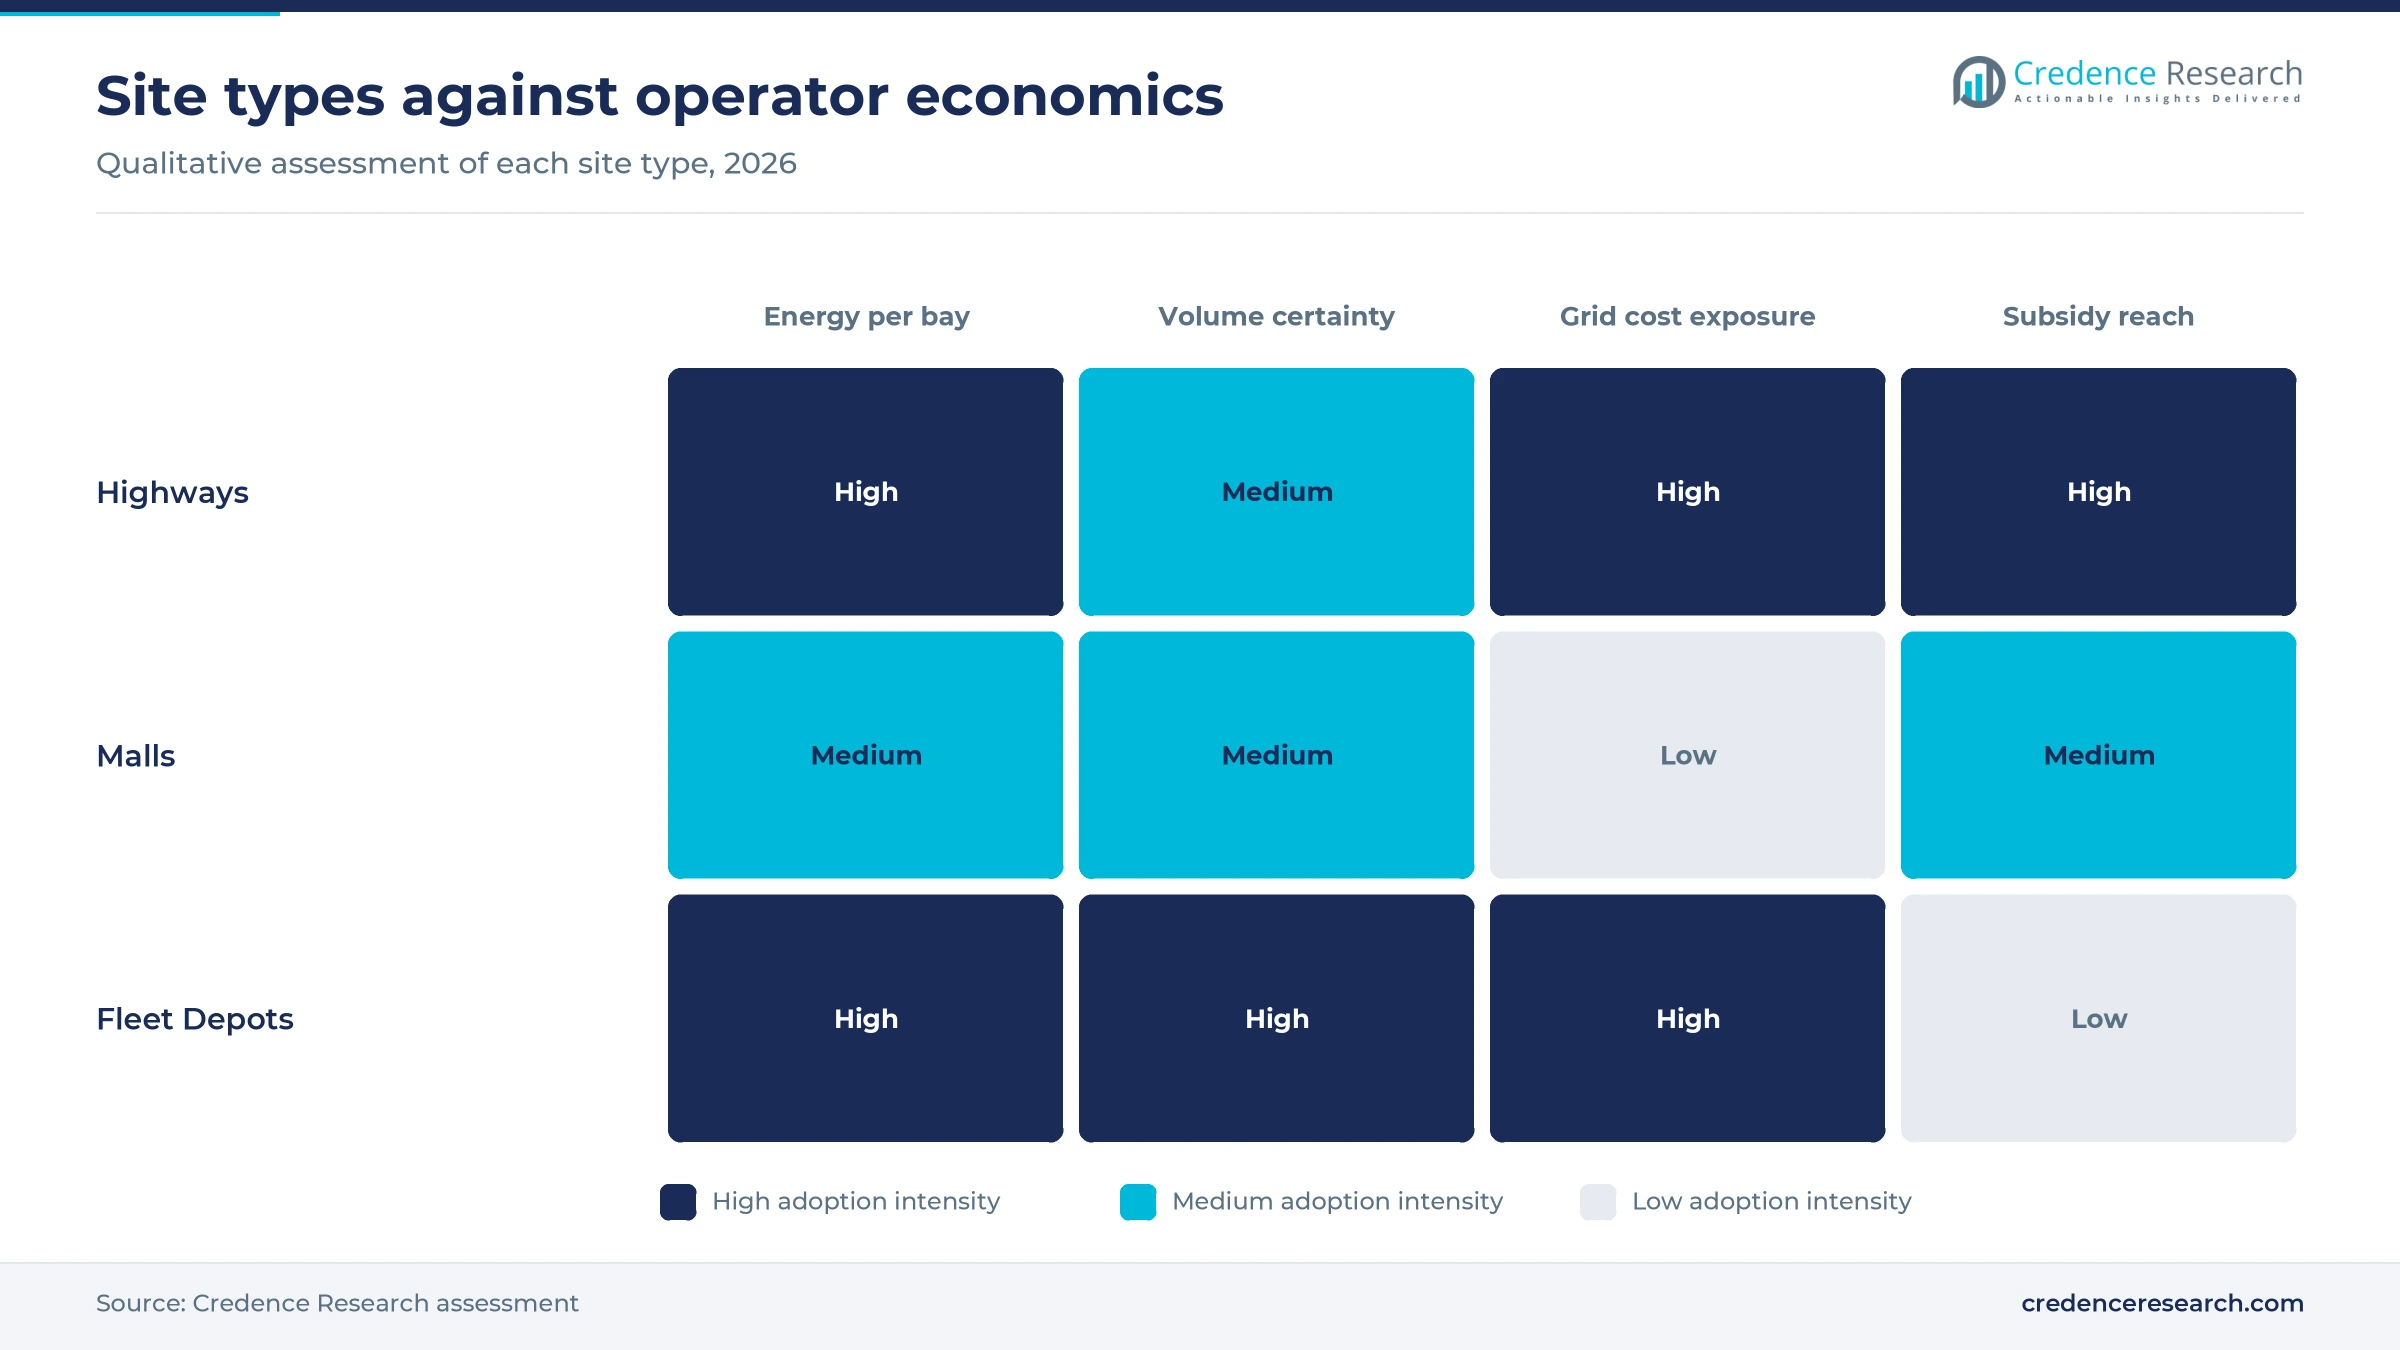
Based on site, the market is categorized into highways, malls and fleet depots. Highways led with 44.0% of 2025 value because long trips need fast public energy, and The Tribune reported 4,557 public stations on highways and expressways in August 2025. Malls sell dwell-time charging, with Statiq planning hubs at 17 Nexus Malls locations, according to ETN News. Fleet Depots grows fastest at 23.12% a year as transport operators contract dedicated capacity, shown by the May 2026 Jio-bp agreement with UPSRTC to build charging across six clusters for more than 100 electric buses in Uttar Pradesh and Delhi.
Why per-unit billing outweighs membership income
Based on revenue, the market is categorized into per-kWh fees and subscriptions. Per-kWh Fees led with 93.0% of 2025 value because most drivers still pay by the unit, and Business Standard reported public tariffs of about Rs 20 to Rs 30 a unit at Bolt.Earth in November 2025. Fleet energy contracts are billed the same way, so they add to this stream rather than forming a separate one. Subscriptions grows fastest at 24.95% a year as operators test loyalty pricing, shown by Statiq Miles, launched on Nov. 12, 2025, at Rs 149 a month with 10% off each charging session, according to Statiq.
| Segment Group | Leading Sub-segment | Share, 2025 | Fastest-growing Sub-segment | CAGR, 2026–2035 |
|---|---|---|---|---|
| By Charger | DC Fast | 74.0% | DC Fast | 22.50% |
| By Site | Highways | 44.0% | Fleet Depots | 23.12% |
| By Revenue | Per-kWh Fees | 93.0% | Subscriptions | 24.95% |
Request a Free Sample
Fill in your details and we'll send you a free sample report.
- Sample data tables & charts
- Research methodology
Bigger fleets and new sites lift billed energy
Larger electric fleets lift public charging volumes
Each added electric vehicle widens the pool of paying sessions, although many smaller vehicles still charge at home or at a depot. The India Energy Storage Alliance counted 2.55 million EV sales in fiscal 2025-26, up 25% and equal to 8.3% of registrations, according to EV Infrastructure News. Monthly sales then reached 307,752 units in July 2026, up 63.2% from a year earlier, according to IEEFA. Electric two-wheelers made up 60.1% of calendar 2025 volume, while electric cars, the heaviest users of public fast chargers, rose 75% to 165,000 in 2025, according to the IEA. In the Credence Research model this adds about 9.24 percentage points to annual growth to 2035.
Operators add highway and urban charging locations
New sites expand the energy an operator can sell, and the largest networks are now adding them through outside capital. ChargeZone plans over 1,000 supercharging stations by the end of fiscal 2027, each rated from 500 kW to 1.5 MW, according to Autocar Pro on March 31, 2026. Statiq raised about USD 18 million on Feb. 19, 2026, partly to add DC fast chargers along key highways. Public funding reaches the same sites, since Karnataka won approval for 1,243 stations with an outlay of Rs 123.26 crore in May 2026, according to NBMCW. In the Credence Research model this adds about 5.94 percentage points to annual growth to 2035.
Payment interoperability and utilization lift returns
Easier payment raises the share of drivers who can use any charger, and that lifts the hours each charger bills. The TATA.ev India Charging Report 2025 found customers using an average of 17 to 20 apps to find and pay for charging. The Unified Bharat e-Charge platform, announced on May 12, 2026, runs on the Beckn Protocol and aims to remove that friction, according to CarHP. Utilization is already moving, because FICCI put public charging below 2% in December 2024, while GreenTechLead reported ChargeZone at about 14% in November 2026. Tata Power also reported 25% growth in charger utilization for fiscal 2026. In the Credence Research model this adds about 3.74 percentage points to annual growth to 2035.
Subsidized grid work lowers the cost of new sites
Grid connection is a heavy fixed cost for a new station, so subsidy on that item directly shortens an operator's payback. The PM E-DRIVE guidelines of Sept. 29, 2025, set aside Rs 2,000 crore for about 72,300 stations, according to Free Press Journal, and cover 80% of upstream work at malls and highway sites. Government and public-sector sites can also receive 70% of equipment cost under those guidelines. Proposals worth Rs 503.86 crore for 4,874 chargers had won approval by May 2026, according to NBMCW. The IEA expects public charging points to rise from 88,000 at the end of 2025 to more than 520,000 by the end of 2035 under its current policy scenario.
Franchise models and ultra-fast hubs reshape networks
Shift toward franchise-owned, operator-run stations
Operators are moving station ownership to local investors while keeping the software, operations and customer relationship. ChargeZone uses a dealer-owned, company-operated format in which investors can start from Rs 1 crore, according to Autocar Pro. Statiq launched its first franchise-owned, company-operated station with SS Group in Gurgaon in January 2026 and plans to expand the format. State Bank of India supports this model through EV Mitra loans of Rs 10 lakh to Rs 10 crore, repayable over up to seven years, according to the same Autocar Pro report. As a result, operators can add sites faster than their own balance sheets would allow, though their share of billing on each site falls.
Rise of ultra-fast hubs above 120 kilowatts
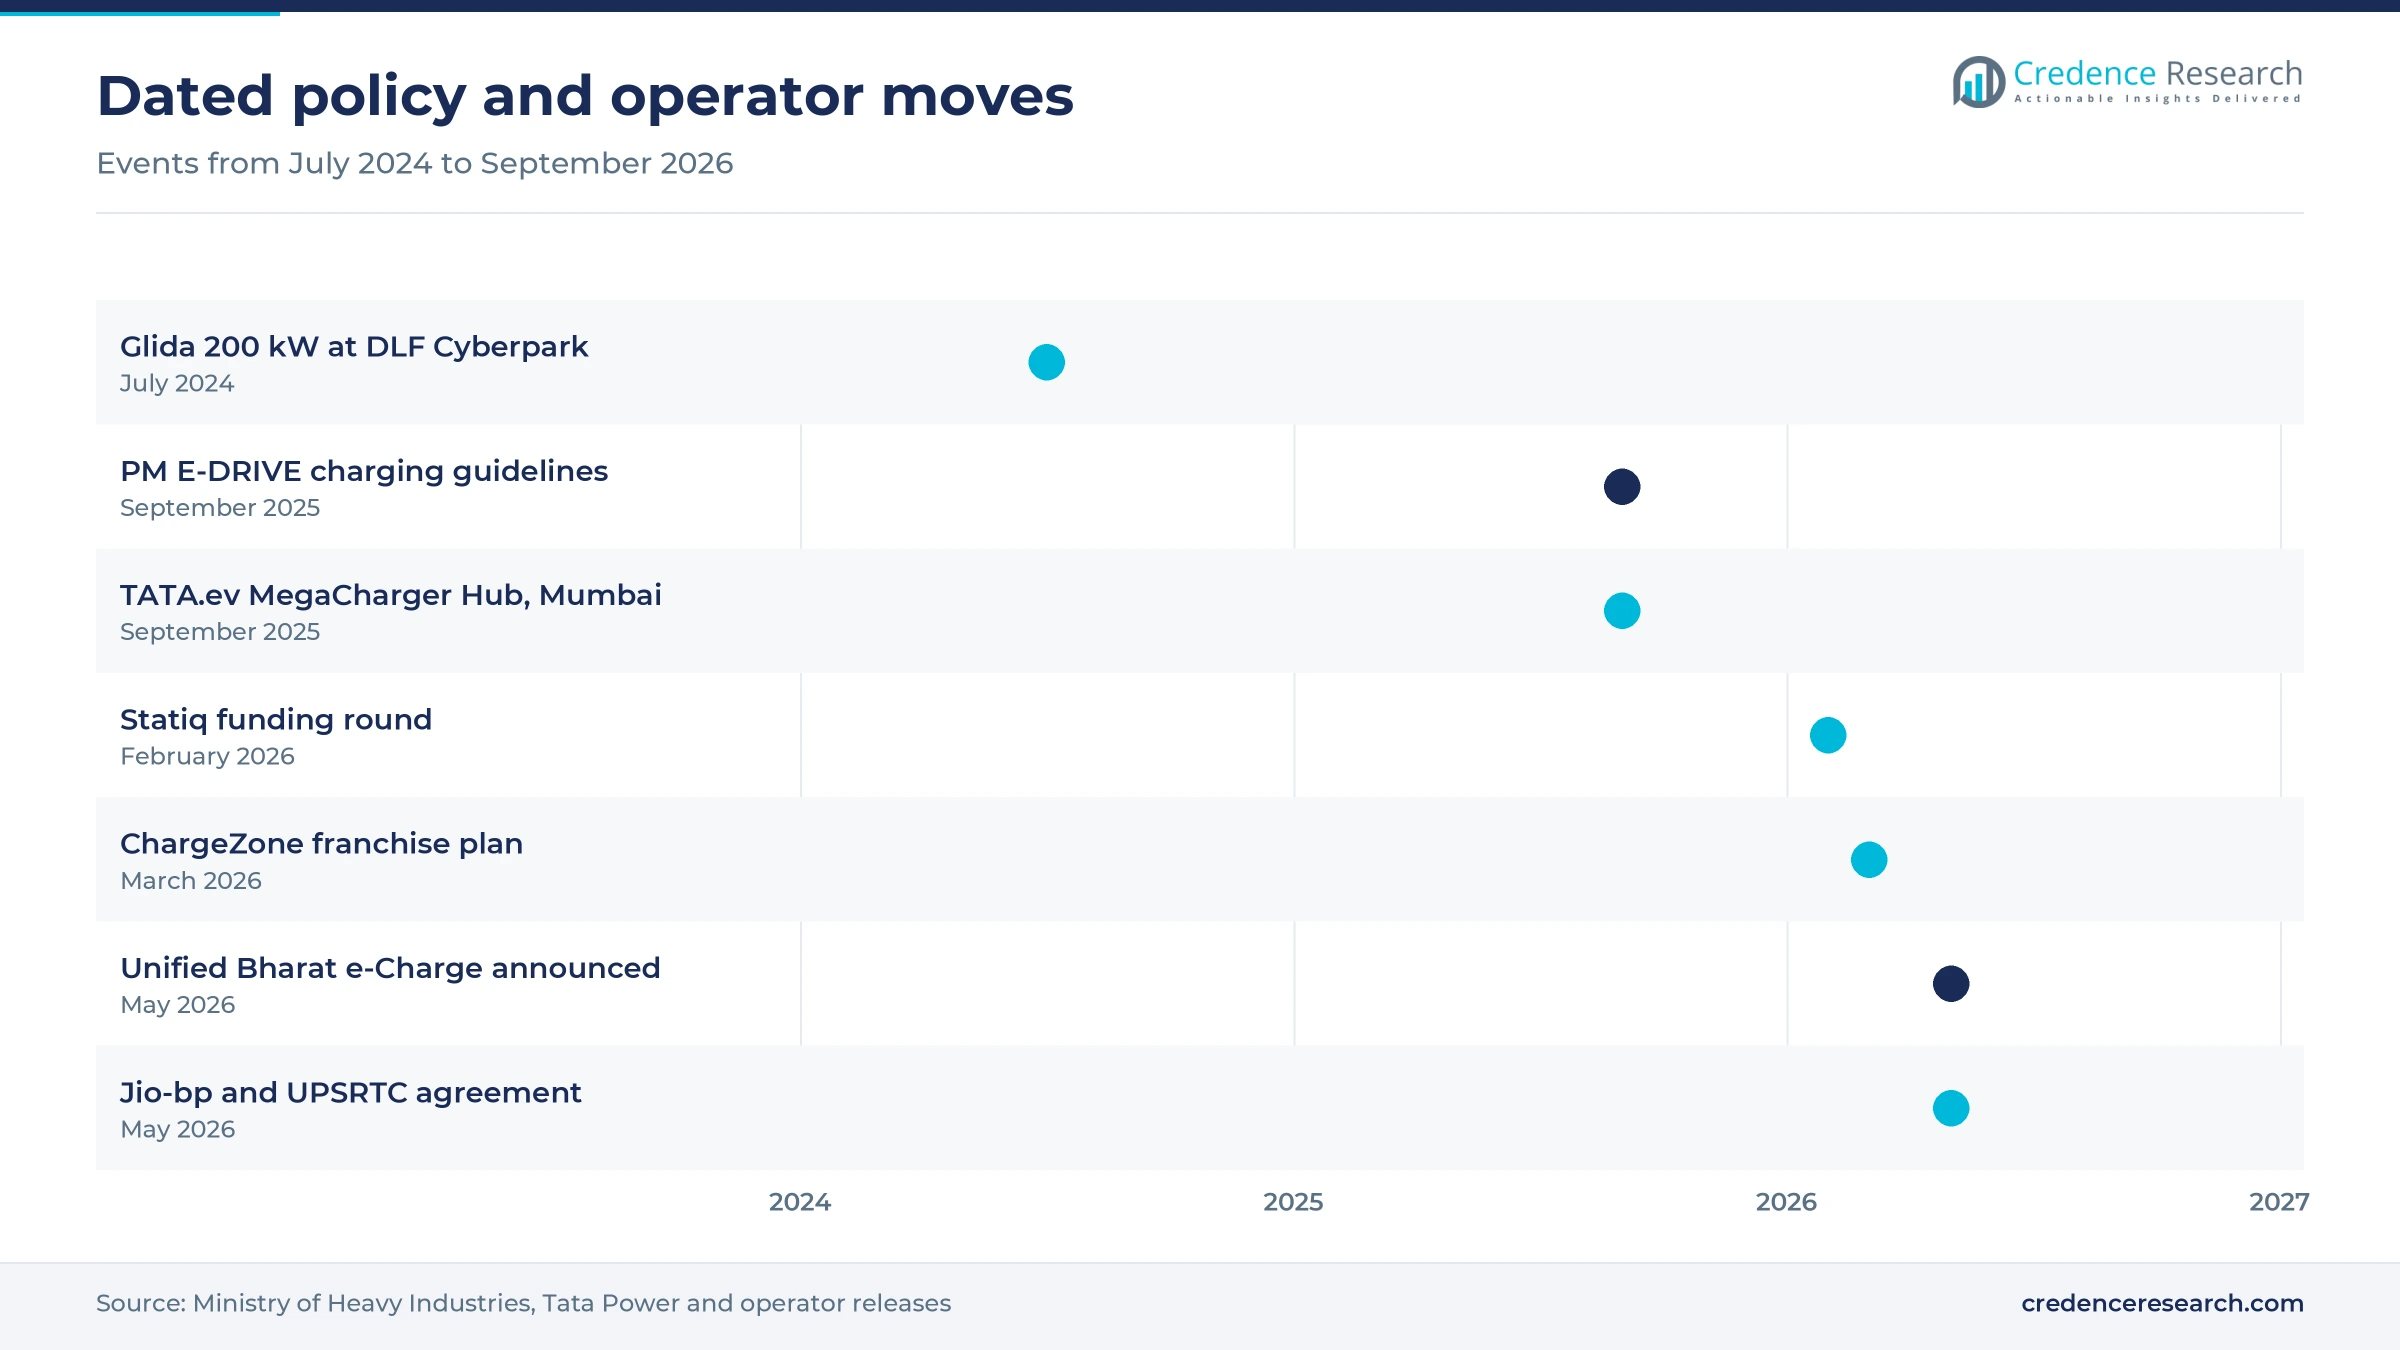
Site power is rising because larger car batteries and commercial vehicles need shorter stops to justify the price of a public session. The TATA.ev MegaCharger Hub near Terminal 2 of Mumbai airport opened on Sept. 9, 2025, with eight DC chargers of up to 120 kW and 16 bays, according to Tata Power. Glida installed a 200 kW Kempower charger with six satellite points at DLF Cyberpark in Gurugram on July 2, 2024, according to EVreporter. Jio-bp now offers chargers rated up to 480 kW, and ChargeZone offers DC units up to 360 kW, according to GreenTechLead. This shift raises revenue per bay, because a hub can serve more vehicles an hour from the same parking space.
Opening in electric bus and truck corridor contracts
Contracted fleet energy offers the steadiest opening for operators, because a depot or corridor customer commits to volume before a site is built. ChargeZone signed long-term energy contracts with intercity electric bus and truck fleets in September 2026 and plans to expand capacity from 120 MW to 300 MW, according to GreenTechLead. The Principal Scientific Adviser's May 2025 report named ten priority corridors for electric trucks, according to NBMCW. Public capacity remains thin, since the IEA counted only three electric truck stations operating in 2025, two of them at ports. Tata Power already runs more than 1,200 e-bus charging points, which shows the model is commercially workable at scale.
Opportunity in automaker-linked roaming and loyalty
Automaker partnerships give operators an opening to win repeat drivers without paying to acquire each one through their own apps. Hyundai Motor India linked its myHyundai app to the Jio-bp pulse network in August 2026, giving its ecosystem access to over 37,000 charging points, according to Renewable Watch. TATA.ev reported a 37% rise in utilization at chargers it verified, and it offers preferential tariffs for its owners at Mega Chargers, according to Autocar Pro in August 2025. It also plans 500 such chargers by 2027 with partners including ChargeZone, Statiq and Zeon. Operators that join these programs gain steadier traffic, which supports both per-kWh billing and membership sign-ups.
Low use, grid costs and downtime test operator returns
Low utilization stretches payback on fast chargers
Utilization remains the central weakness for operators without fleet contracts. FICCI said in December 2024 that public use stood below 2%, against the 8% to 10% needed by 2030 for profitability. One network chief executive told Business Standard in November 2025 that a four-wheeler DC installation costs Rs 10 lakh to Rs 15 lakh, with an eight- to 12-year payback. Smaller networks are most exposed to this gap, so many now concentrate new capital on busy corridors and contracted depots.
Grid upgrades can take half of station cost
Grid work is the largest single cost risk at a new high-power site. IEEFA reported in September 2026 that upstream grid work can easily account for 50% of a public station's total cost, and it noted delays in connections. Operators in smaller cities feel this most, because local capacity is often limited and costs spread over fewer sessions. On-site battery energy storage offers one possible route to lower peak demand on the local feeder.
Charger downtime erodes trust in public networks
Reliability problems cost operators repeat customers on every network that lets chargers fail. About 12,100 of the 25,000 public chargers counted in February 2024 were not working, according to the TATA.ev report, and 38% of its customers named unreliable chargers as a major barrier. An IEEFA study from 2024 found nearly 84% of sampled chargers across South, Central, West and East Delhi not functional. Leading networks answer with uptime targets, including 96% reported by Jio-bp and 99.9% targeted by Statiq, though independent verification of those figures remains limited.
Slow subsidy release and a fall in new stations
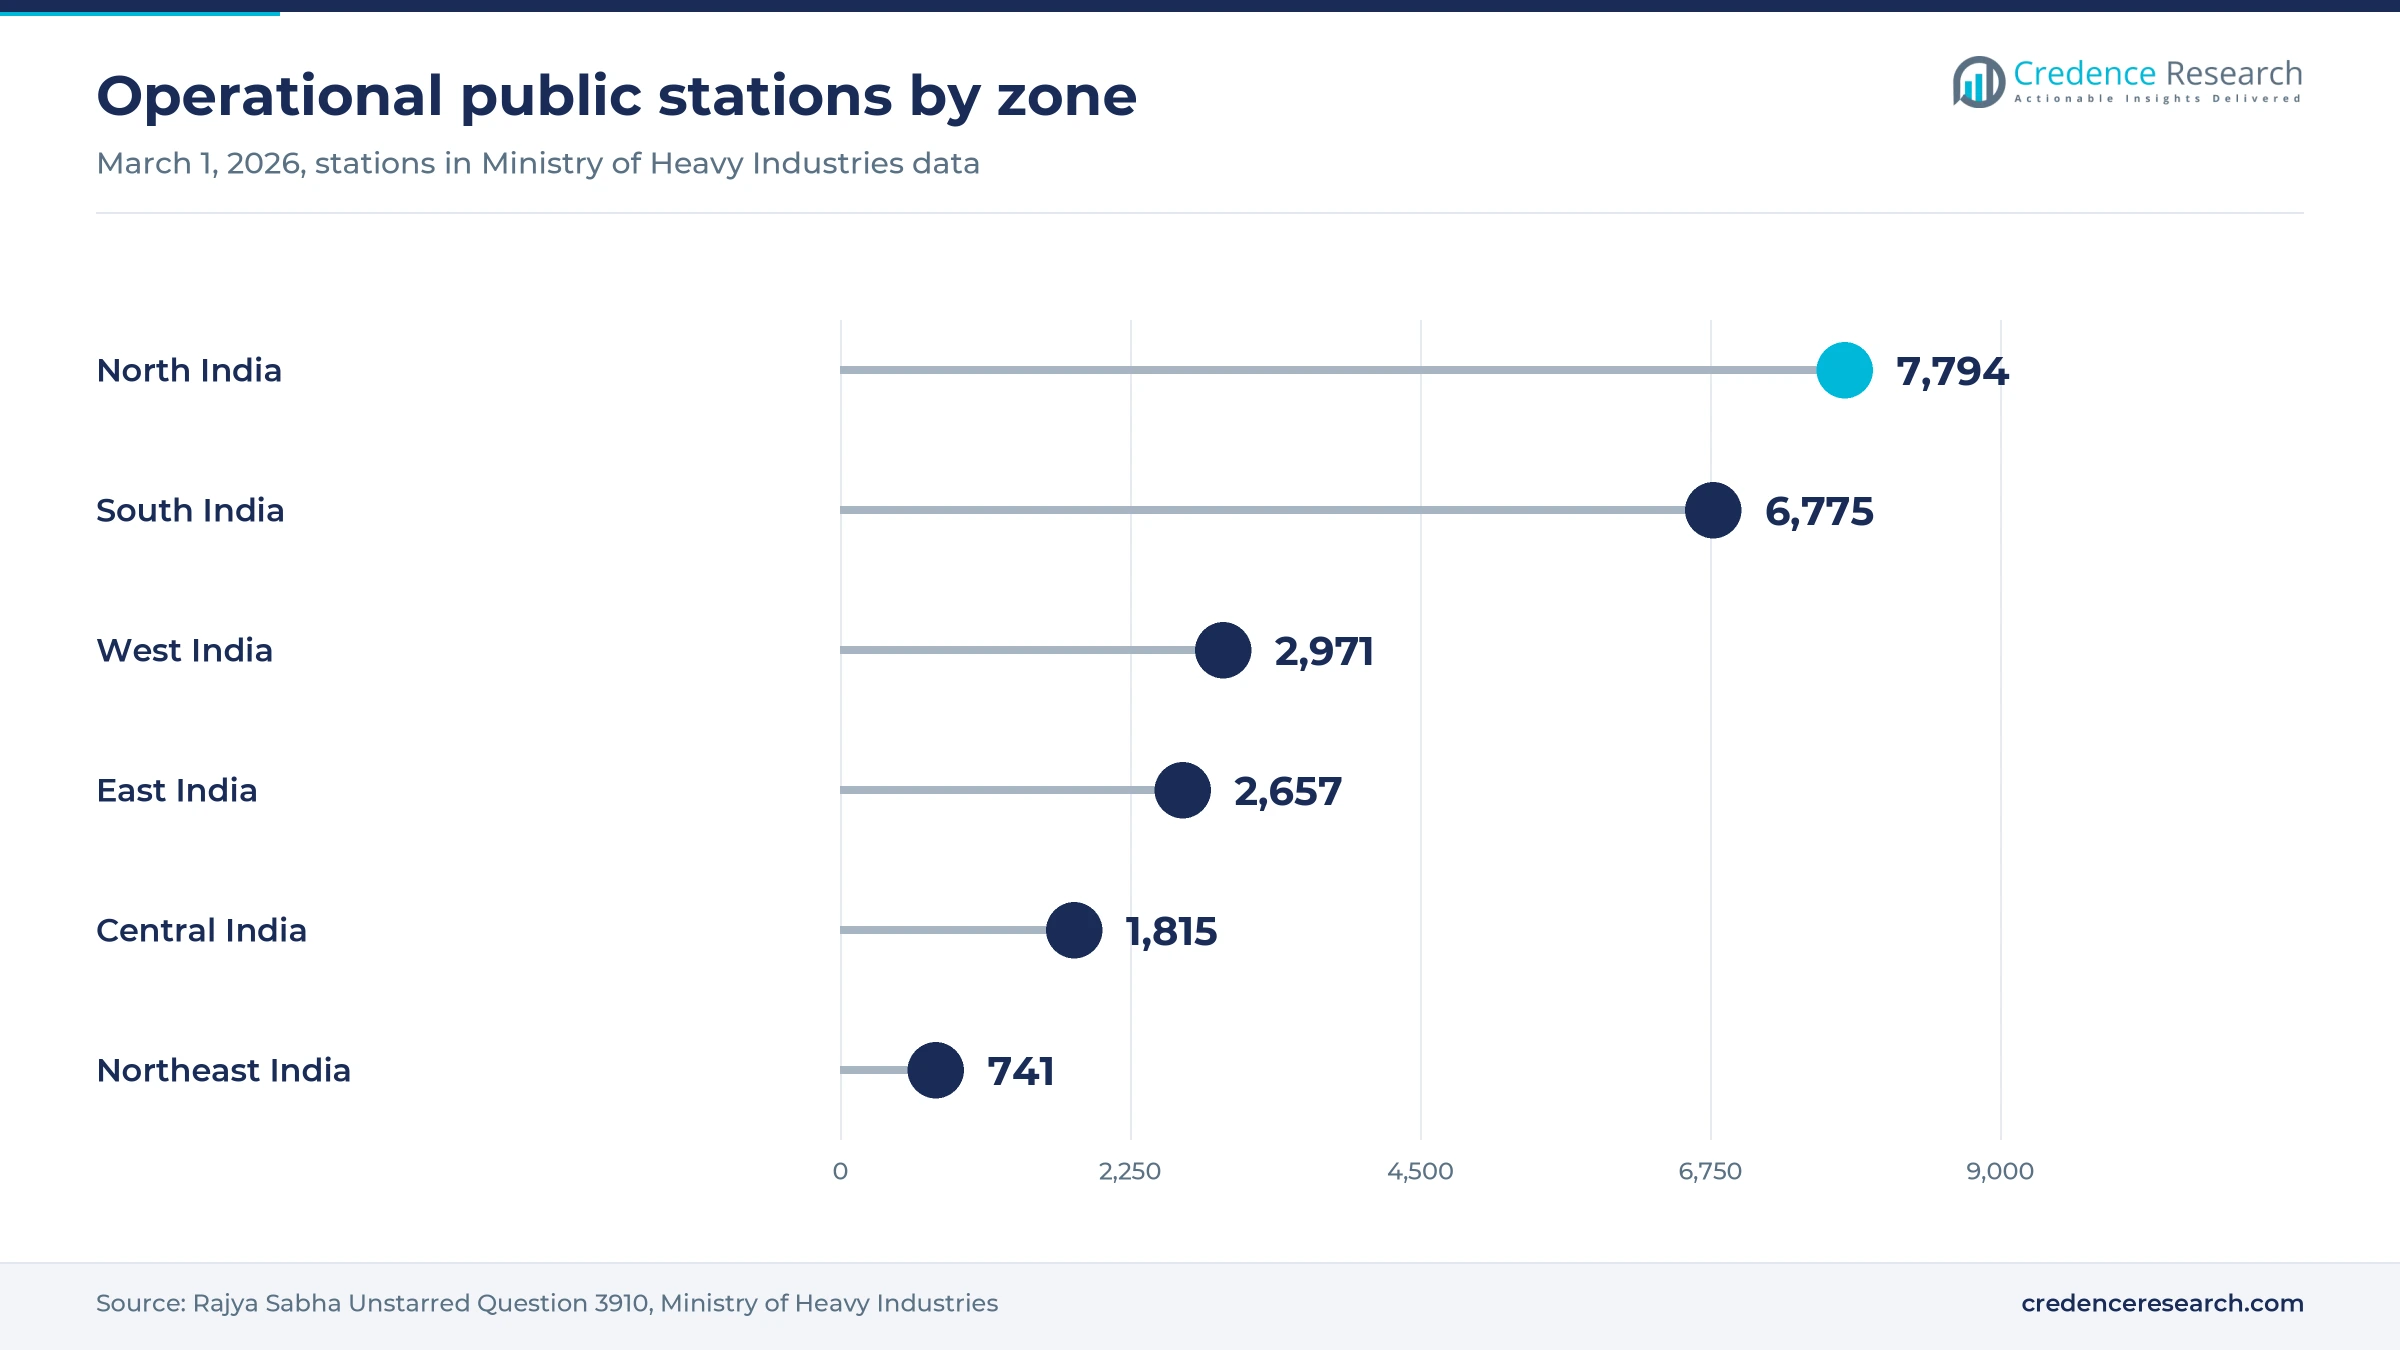
Funding has moved more slowly than the policy headlines suggest. The Ministry of Heavy Industries told the Rajya Sabha on March 27, 2026, that no PM E-DRIVE funds had been released for public stations by March 24, 2026. Its data showed 11,246 stations added in fiscal 2024-25 and only 1,547 from April 2025 through March 1, 2026. Operators relying on subsidized sites therefore face timing risk, which favors those with private funding or contracted fleet income.
South and West India lead as smaller zones grow faster
| Region | Value, 2025 (USD million) | Share, 2025 | CAGR, 2026–2035 |
|---|---|---|---|
| South India | 87.4 | 38.0% | 21.52% |
| West India | 62.1 | 27.0% | 21.82% |
| North India | 57.5 | 25.0% | 22.42% |
| East India | 11.5 | 5.0% | 23.02% |
| Central India | 9.2 | 4.0% | 23.32% |
| Northeast India | 2.3 | 1.0% | 23.62% |
South India leads on Bengaluru corridors and dense fleets
South India held 38.0% share of 2025 value and grows at 21.52% a year. Karnataka ranked first nationally with 6,096 public stations, according to Saur Energy in December 2025, and Tamil Nadu followed with 1,780 stations, 926 of them fast. Oil companies also added 236 stations on four South India corridors, including 109 on the Bengaluru-Pune highway, according to NBMCW. This corridor traffic explains why the zone earns more than its count of operational stations would suggest.
West India builds on Maharashtra fast chargers and Mumbai
West India held 27.0% share of 2025 value and grows at 21.82% a year. The state of Maharashtra counted 4,166 public stations and over 1,200 fast chargers, the most of any state, according to Saur Energy. Mumbai adds a dense premium base, with Tata Power reporting more than 1,000 charge points there on green energy and its airport hub opening in September 2025. Gujarat adds 1,118 operational stations, according to the Ministry of Heavy Industries, and the Delhi-Mumbai corridor passes through the zone.
North India gains from Uttar Pradesh and Delhi fleets
North India held 25.0% share of 2025 value and grows at 22.42% a year. Uttar Pradesh reported 2,893 operational stations on March 1, 2026, the highest figure in the Ministry of Heavy Industries data, while Rajasthan reported 1,740. The Jio-bp agreement with UPSRTC adds contracted bus charging across Uttar Pradesh and Delhi. Delhi also draws premium destination sites, shown by the Tesla chargers at Nexus Select CityWalk, which supports higher billing per station than the state totals imply.
East India starts from West Bengal and Bihar networks
East India held 5.0% share of 2025 value and grows at 23.02% a year. West Bengal reported 1,039 operational stations on March 1, 2026, ahead of Bihar with 676, Odisha with 618 and Jharkhand with 324, according to the Ministry of Heavy Industries. These four states hold about 12% of the stations in that data but a smaller share of value, since electric car density is lower and more sessions run at low power. Further growth in this zone depends on denser car fleets and better highway links.
Central India grows from Madhya Pradesh depots and highways
Central India held 4.0% share of 2025 value and grows at 23.32% a year. The state of Madhya Pradesh reported 1,291 operational stations on March 1, 2026, and Chhattisgarh reported 524, according to the Ministry of Heavy Industries. Depot work is starting too, as Highway Infrastructure Limited won a Rs 1.09 crore charging contract for the Dewas Naka depot in Indore, according to TrucksBuses in October 2025. This fleet demand gives operators steadier volume than the zone's thin car base provides today.
Northeast India remains small but grows from Assam
Northeast India held 1.0% share of 2025 value and grows at 23.62% a year, the fastest rate from the smallest base. The state of Assam reported 461 of the 741 operational stations across the eight northeastern states on March 1, 2026, according to the Ministry of Heavy Industries. Meghalaya reported only 44 and Mizoram 15, so networks remain thin outside Guwahati and its links. Operators here depend on public funding and oil-company forecourts, because session volumes rarely justify purely private fast sites.
Policy and capital moves reset the 2025–2026 rollout
| Development | Status and market relevance |
|---|---|
| In September 2025, the Ministry of Heavy Industries issued PM E-DRIVE guidelines for about 72,300 public stations with BHEL as implementing agency. | Issued; approvals covered 4,874 chargers by May 2026. |
| In February 2026, Statiq raised about USD 18 million in equity and debt led by Tenacity Ventures, with Shell Ventures participating. | Closed; funds target highway DC chargers and uptime. |
| In March 2026, ChargeZone announced a franchise plan for over 1,000 supercharging stations by the end of fiscal 2027. | In rollout along national highway corridors. |
| In May 2026, the Ministry of Heavy Industries, BHEL and NPCI announced the Unified Bharat e-Charge platform for interoperable charging. | Integration under way; nine operators and automakers listed. |
| In May 2026, Jio-bp and UPSRTC agreed to build fast charging across six clusters for more than 100 electric buses. | Signed; rollout expected over the following months. |
Liquid cooling and open protocols change site design
- Liquid-cooled DC units allow far higher power per cable, and Jio-bp reports running a 480 kW liquid-cooled charger in India, according to Autocar Pro in February 2026.
- Satellite dispenser layouts split one power cabinet across several bays, as in the 200 kW Kempower unit with six satellite points that Glida installed at DLF Cyberpark.
- Beckn-based discovery and payment underpins Unified Bharat e-Charge, which lets compatible apps such as automaker dashboards and operator apps reach the same network of chargers.
- OCPI roaming integration helps smaller networks join shared platforms, and Kazam opened a free seven-day integration program for operators on July 14, 2026, according to CarHP.
Need a Custom Version of This Report?
Tailor the scope, geography, or segments to your exact requirements.
- Custom geography or segment scope
- Direct access to our analyst team
Five network models compete on sites and fleet deals
Competition in the India EV charging CPO market splits across five network models rather than one price race. Tata Power EZ Charge pairs a utility parent with public, fleet and e-bus points, while ChargeZone concentrates on highway superchargers and contracted intercity fleets. Statiq runs a broad AC and DC network and is expanding franchise-owned stations. Jio-bp pulse runs high-power units at more than 1,100 locations, and it signs commercial deals such as its Feb. 6, 2026, agreement with Euler Motors to reach cargo operators. Glida, formerly Fortum Charge & Drive India, focuses on selected high-power commercial sites such as DLF Cyberpark. Operators increasingly compete for scarce high-traffic land and for fleet contracts, and automaker tie-ups now steer drivers toward preferred networks. Published charger counts mix public, semi-public and fleet points, so they are a weak guide to share. Billed energy and utilization are the better measures, and few operators disclose both.
Companies profiled and their roles in this market
| Company | Type | Role in the market |
|---|---|---|
| Tata Power EZ Charge | Utility-backed network | Public, semi-public and fleet points, with more than 1,200 e-bus points reported for fiscal 2026 |
| ChargeZone | Highway and fleet operator | Franchise superchargers of 500 kW to 1.5 MW and long-term e-bus and truck energy contracts |
| Statiq | Independent network | Over 10,000 AC and DC chargers, a franchise format and the Statiq Miles membership |
| Jio-bp pulse | High-power network | High-power DC sites with UPSRTC, Euler Motors and Hyundai tie-ups |
| Glida | Commercial site operator | High-power sites in Gurugram, formerly Fortum Charge & Drive India |
Utilization, not station count, decides who earns
Credence Research's view is that station counts now say little about who will earn in the India EV charging CPO market. Official and industry figures for 2026 range from 22,753 operational stations in Ministry of Heavy Industries data to 52,718 in the IEEFA count, and neither shows billed energy. The operators most likely to reach steady returns are those pairing public fast sites with contracted fleet volume, because that combination lifts utilization before retail traffic matures. Buyers and investors should test any network on kWh per charger, uptime and the share of energy under contract.
How the operator revenue estimate was built
The report uses 2025 as the base year and forecasts to 2035. Market values come from the Credence Research model, which was cross-checked against operator energy data and public tariffs. Segment and regional splits are Credence Research estimates, informed by government station data, operator disclosures and corridor information. Sources used were parliamentary replies, IEA and IEEFA publications, company releases and trade press. No interviews or surveys were conducted in preparing this report.
Fleet depots and highways carry growth to 2035
India EV charging CPO income should reach USD 1.80 billion by 2035, with growth of 22.00% a year resting on more energy billed per site rather than on station numbers alone. Fleet depots and highway hubs should take a larger share of value as electric bus and truck programs scale, and as PM E-DRIVE support, extended to 2028 according to the IEA, reaches approved sites. The main swing factors are the pace of subsidy release, grid connection costs and uptake of Unified Bharat e-Charge. Operators with contracted volume and reliable hardware are best placed through this period.
Frequently Asked Questions
How big is the India EV charging CPO market?
Which charger type leads operator income in India?
Which site type grows fastest?
Which region holds the largest share?
How do charge-point operators in India earn money?
What does Unified Bharat e-Charge change for operators?
What is the biggest challenge for operators?
Which companies are active in this market?
Table of Content
Chapter 1 Market Segmentation
- 1.1 Segmentation Framework
- 1.1.1 Product and Service Classification
- 1.1.2 Application and End-Use Classification
- 1.1.3 Technology and Solution Classification
- 1.1.4 Customer and Distribution Channel Classification
- 1.1.5 Geographic Segmentation
- 1.1.6 Market Segment Definitions and Boundaries
- 1.2 By Charger
- 1.2.1 DC Fast
- 1.2.2 AC
- 1.3 By Site
- 1.3.1 Highways
- 1.3.2 Fleet Depots
- 1.3.3 Malls
- 1.4 By Revenue
- 1.4.1 Per-kWh Fees
- 1.4.2 Subscriptions
Chapter 2 Introduction
- 2.1 Report Objectives and Scope
- 2.2 Product Definition and Industry Terminology
- 2.3 Market Inclusions and Exclusions
- 2.4 Research Process
- 2.4.1 Primary Research and Expert Interviews
- 2.4.2 Secondary Research and Source Review
- 2.4.3 Top-Down and Bottom-Up Estimation
- 2.4.4 Data Triangulation and Verification
- 2.5 Market Size Measurement Basis
- 2.5.1 2025: USD 230.0 million → 2035: USD 1.80 billion
- 2.6 Historical and Forecast Reference Periods
- 2.6.1 Historical Period: 2018-2025
- 2.6.2 Base Year: 2025
- 2.6.3 Forecast Period: 2025-2035
- 2.7 Research Assumptions and Limitations
Chapter 3 Executive Summary
- 3.1 Market Snapshot and Key Findings
- 3.2 Base-Year Market Size, 2025
- 3.3 Forecast Market Size, 2035
- 3.4 Revenue and Volume Growth Outlook
- 3.5 Key Demand and Supply Indicators
- 3.6 Leading Market Segments
- 3.7 Fastest-Growing Market Opportunities
- 3.8 Regional Performance Highlights
- 3.9 Technology and Industry Transformation
- 3.10 Competitive Landscape Summary
- 3.11 Analyst View and Strategic Implications
Chapter 4 India EV Charging CPO Market Trends and Developments
- 4.1 Historical Industry Development, 2018-2025
- 4.2 Recent Market Trends and Developments
- 4.3 Demand and Customer Behavior Trends
- 4.4 Technology and Product Innovation
- 4.5 Artificial Intelligence, Automation and Digitalization
- 4.6 Local Manufacturing and Supply Chain Realignment
- 4.7 Industry Partnerships, Mergers and Acquisitions
- 4.8 Sustainability and Circular Economy Developments
- 4.9 Government and Private Sector Investment Trends
- 4.10 Emerging Business Models and Commercialization
- 4.11 Industry Developments and Announcements
Chapter 5 India EV Charging CPO Market Production, Supply and Demand Analysis
- 5.1 Demand Trend and Consumption Analysis, 2018-2025
- 5.2 Demand Forecast, 2025-2035
- 5.3 Production and Output Trend, 2018-2025
- 5.4 Production and Output Forecast, 2025-2035
- 5.5 Installed Capacity and Capacity Utilization
- 5.6 Company-Wise Production Plants and Statistics
- 5.6.1 Installed Production Capacity
- 5.6.2 Actual Production
- 5.6.3 Planned Capacity and Expansion Targets
- 5.7 Supply Chain Structure and Procurement Trends
- 5.8 Supply-Demand Gap and Bottlenecks
- 5.9 Import Dependence and Sourcing Structure
- 5.10 Contract Manufacturing and Outsourcing
- 5.11 Regional Supply and Demand Concentration
Chapter 6 India EV Charging CPO Market Pricing Analysis
- 6.1 Pricing Structure and Measurement
- 6.2 Historical Pricing Trends, 2018-2025
- 6.3 Pricing Outlook, 2025-2035
- 6.4 Average Selling Price and Unit Economics
- 6.5 Pricing by Product and Market Segment
- 6.6 Geographic Pricing Differences
- 6.7 Key Input, Energy, Labor and Logistics Costs
- 6.8 Contract Pricing and Purchasing Models
- 6.9 Pricing Sensitivity and Competitive Positioning
- 6.10 Price, Margin and Profitability Implications
Chapter 7 India EV Charging CPO Market Dynamics
- 7.1 Market Growth Drivers
- 7.1.1 Demand-Side Drivers
- 7.1.2 Technology and Innovation Drivers
- 7.1.3 Infrastructure and Investment Drivers
- 7.1.4 Regulatory and Policy Drivers
- 7.2 Market Restraints
- 7.2.1 Cost and Affordability Constraints
- 7.2.2 Technology and Adoption Barriers
- 7.2.3 Supply Chain and Operational Constraints
- 7.3 Market Challenges
- 7.3.1 Competitive Pressure and Margin Erosion
- 7.3.2 Skills, Infrastructure and Implementation Gaps
- 7.4 Emerging Market Opportunities
- 7.5 Market Dynamics Impact and Time-Horizon Assessment
Chapter 8 India EV Charging CPO Value Chain Analysis
- 8.1 Industry Value Chain Overview
- 8.2 Upstream Suppliers and Critical Inputs
- 8.3 Technology and Component Providers
- 8.4 Manufacturing or Service Delivery
- 8.5 Distribution, Channel Partners and Integrators
- 8.6 Downstream Applications and End Users
- 8.7 Value Addition and Profit Pools
- 8.8 Vertical Integration and Outsourcing
- 8.9 Supplier Concentration and Risk
- 8.10 Supply Chain Localization and Resilience
Chapter 9 India EV Charging CPO Market Regulations and Policies
- 9.1 Relevant Laws, Standards and Compliance Frameworks
- 9.2 Product, Service, Safety and Quality Requirements
- 9.3 Government Policies, Incentives and Subsidies
- 9.4 Imports, Exports and Trade Barriers
- 9.5 Public Procurement and Local Content Requirements
- 9.6 Environmental and Sustainability Compliance
- 9.7 Upcoming Policy Changes and Market Implications
Chapter 10 India EV Charging CPO Market Hotspots and Opportunities
- 10.1 Market Opportunity Mapping and Growth Hotspots
- 10.2 High-Growth Applications and Customer Groups
- 10.3 Underserved Markets and White-Space Opportunities
- 10.4 Emerging Technology and Product Opportunities
- 10.5 New Capacity and Investment Hotspots
- 10.6 Market Entry and Expansion Opportunities
- 10.7 Distribution and Partnership Opportunities
- 10.8 Near-Term and Long-Term Commercial Potential
- 10.9 Opportunity Attractiveness and Execution Risks
Chapter 11 India EV Charging CPO Market Outlook, 2025-2035
- 11.1 Market Size and Analysis
- 11.1.1 Revenue (Market Measurement: 2025: USD 230.0 million → 2035: USD 1.80 billion)
- 11.1.2 Market Volume and Quantity Sold
- 11.1.3 Historical Market Size, 2018-2025
- 11.1.4 Base-Year Market Size, 2025
- 11.2 Market Forecast, 2025-2035
- 11.2.1 Revenue Forecast to 2035
- 11.2.2 Volume Forecast to 2035
- 11.2.3 CAGR and Year-on-Year Growth
- 11.2.4 Incremental Revenue Opportunity
- 11.3 Forecast Assumptions and Scenario Analysis
- 11.3.1 Base-Case Forecast
- 11.3.2 Optimistic and Conservative Scenarios
- 11.3.3 Technology, Pricing and Policy Sensitivities
- 11.4 Market Attractiveness and Growth Outlook
Chapter 12 India EV Charging CPO Market Segmentation and Outlook
- 12.1 Segmentation Summary and Market Shares, 2025
- 12.2 Largest and Fastest-Growing Segments
- 12.3 By Charger - Market Size and Forecast, 2025-2035
- 12.3.1 Segment Definition and Scope
- 12.3.2 Historical Market Size, 2018-2025
- 12.3.3 Revenue Forecast, 2025-2035
- 12.3.4 Volume Forecast, 2025-2035
- 12.3.5 Base-Year Market Share, 2025
- 12.3.6 Segment CAGR and Growth Drivers
- 12.3.7 Subsegment Market Size and Forecast
- 12.3.7.1 DC Fast
- 12.3.7.2 AC
- 12.3.8 Subsegment Pricing and Adoption Trends
- 12.3.9 Leading Suppliers and Competition
- 12.3.10 Regional Demand and Opportunities
- 12.4 By Site - Market Size and Forecast, 2025-2035
- 12.4.1 Segment Definition and Scope
- 12.4.2 Historical Market Size, 2018-2025
- 12.4.3 Revenue Forecast, 2025-2035
- 12.4.4 Volume Forecast, 2025-2035
- 12.4.5 Base-Year Market Share, 2025
- 12.4.6 Segment CAGR and Growth Drivers
- 12.4.7 Subsegment Market Size and Forecast
- 12.4.7.1 Highways
- 12.4.7.2 Fleet Depots
- 12.4.7.3 Malls
- 12.4.8 Subsegment Pricing and Adoption Trends
- 12.4.9 Leading Suppliers and Competition
- 12.4.10 Regional Demand and Opportunities
- 12.5 By Revenue - Market Size and Forecast, 2025-2035
- 12.5.1 Segment Definition and Scope
- 12.5.2 Historical Market Size, 2018-2025
- 12.5.3 Revenue Forecast, 2025-2035
- 12.5.4 Volume Forecast, 2025-2035
- 12.5.5 Base-Year Market Share, 2025
- 12.5.6 Segment CAGR and Growth Drivers
- 12.5.7 Subsegment Market Size and Forecast
- 12.5.7.1 Per-kWh Fees
- 12.5.7.2 Subscriptions
- 12.5.8 Subsegment Pricing and Adoption Trends
- 12.5.9 Leading Suppliers and Competition
- 12.5.10 Regional Demand and Opportunities
- 12.6 Segment Growth Comparison
- 12.7 Segment Attractiveness and Priority Matrix
Chapter 13 India EV Charging CPO Geographic Market Outlook, 2025-2035
- 13.1 Domestic Market Distribution and Demand Clusters
- 13.2 State- or Province-Wise Market Size and Forecast, 2025-2035
- 13.3 City and Metropolitan Market Outlook
- 13.4 Industrial, Manufacturing and Commercial Clusters
- 13.5 Geographic Concentration of Key End Users
- 13.6 Local Pricing and Purchasing Differences
- 13.7 Domestic Production Facilities and Capacity Map
- 13.8 Local Infrastructure and Project Pipeline
- 13.9 State-Level Policy and Incentive Differences
- 13.10 Subnational Investment Hotspots and Opportunities
- 13.11 Distribution and Logistics Networks
- 13.12 Domestic Competitive Footprint
Chapter 14 India EV Charging CPO Technology, Innovation and Sustainability Outlook
- 14.1 Technology Landscape and Maturity
- 14.2 Product, Process and Service Innovation
- 14.3 AI, Automation and Digital Tools in the Industry
- 14.4 Technology Adoption and Performance Benchmarking
- 14.5 Innovation Pipeline and R&D Investment
- 14.6 Patent and Intellectual Property Trends
- 14.7 Energy Efficiency and Resource Management
- 14.8 Sustainability, Recycling and Circularity
- 14.9 Technology Roadmap, 2025-2035
- 14.10 Risks of Obsolescence and Technology Substitution
Chapter 15 India EV Charging CPO Market Key Strategic Imperatives
- 15.1 Growth and Market Entry Priorities
- 15.2 High-Return Products and Segments
- 15.3 Pricing, Profitability and Cost Optimization
- 15.4 Technology Investment and Product Differentiation
- 15.5 Supply Chain Localization and Resilience
- 15.6 Distribution and Customer Acquisition
- 15.7 Partnership, Acquisition and Capacity Strategy
- 15.8 Regional Expansion Priorities
- 15.9 Short-, Medium- and Long-Term Actions
Chapter 16 Competition Outlook
- 16.1 Industry Competition Characteristics
- 16.2 Market Structure and Concentration
- 16.3 Market Share and Competitive Positioning, 2025
- 16.4 Company-Wise Revenue and Product Benchmarking
- 16.5 Production and Service Capacity Benchmarking
- 16.6 Technology, Pricing and Differentiation
- 16.7 Regional Footprint and Distribution Strength
- 16.8 Mergers, Acquisitions and Strategic Alliances
- 16.9 New Entrants and Competitive Threats
- 16.10 Porter's Five Forces and Industry Attractiveness
- 16.11 Competitive Outlook, 2025-2035
Chapter 17 Company Profiles
- 17.1 Company Coverage and Selection Criteria
- 17.2 Tata Power EZ Charge
- 17.2.1 Business Description
- 17.2.2 Company Ownership and Geographic Presence
- 17.2.3 Product and Service Portfolio
- 17.2.4 Manufacturing and Operating Footprint
- 17.2.5 Production Capacity and Expansion Plans
- 17.2.6 Financial Performance and Investment
- 17.2.7 Market Share and Competitive Position
- 17.2.8 Technology and Innovation Capabilities
- 17.2.9 Strategic Alliances or Partnerships
- 17.2.10 Recent Developments
- 17.2.11 Growth Strategy and Outlook
- 17.3 Statiq
- 17.4 ChargeZone
- 17.5 Jio-bp pulse
- 17.6 Glida
- 17.7 Other Relevant Market Participants
Note: Every listed company is profiled on the structure shown under the first company. The company list is preliminary and may change based on research findings, market developments, data availability and client requirements.
Chapter 18 Disclaimer
- 18.1 Research and Forecast Disclaimer
- 18.2 Data Source and Estimation Limitations
Note: The depth of individual sections depends on data availability for this market. Volume, capacity, trade and other unit-based metrics are included where applicable.

