
Uptime rules turn charger upkeep into a contract business
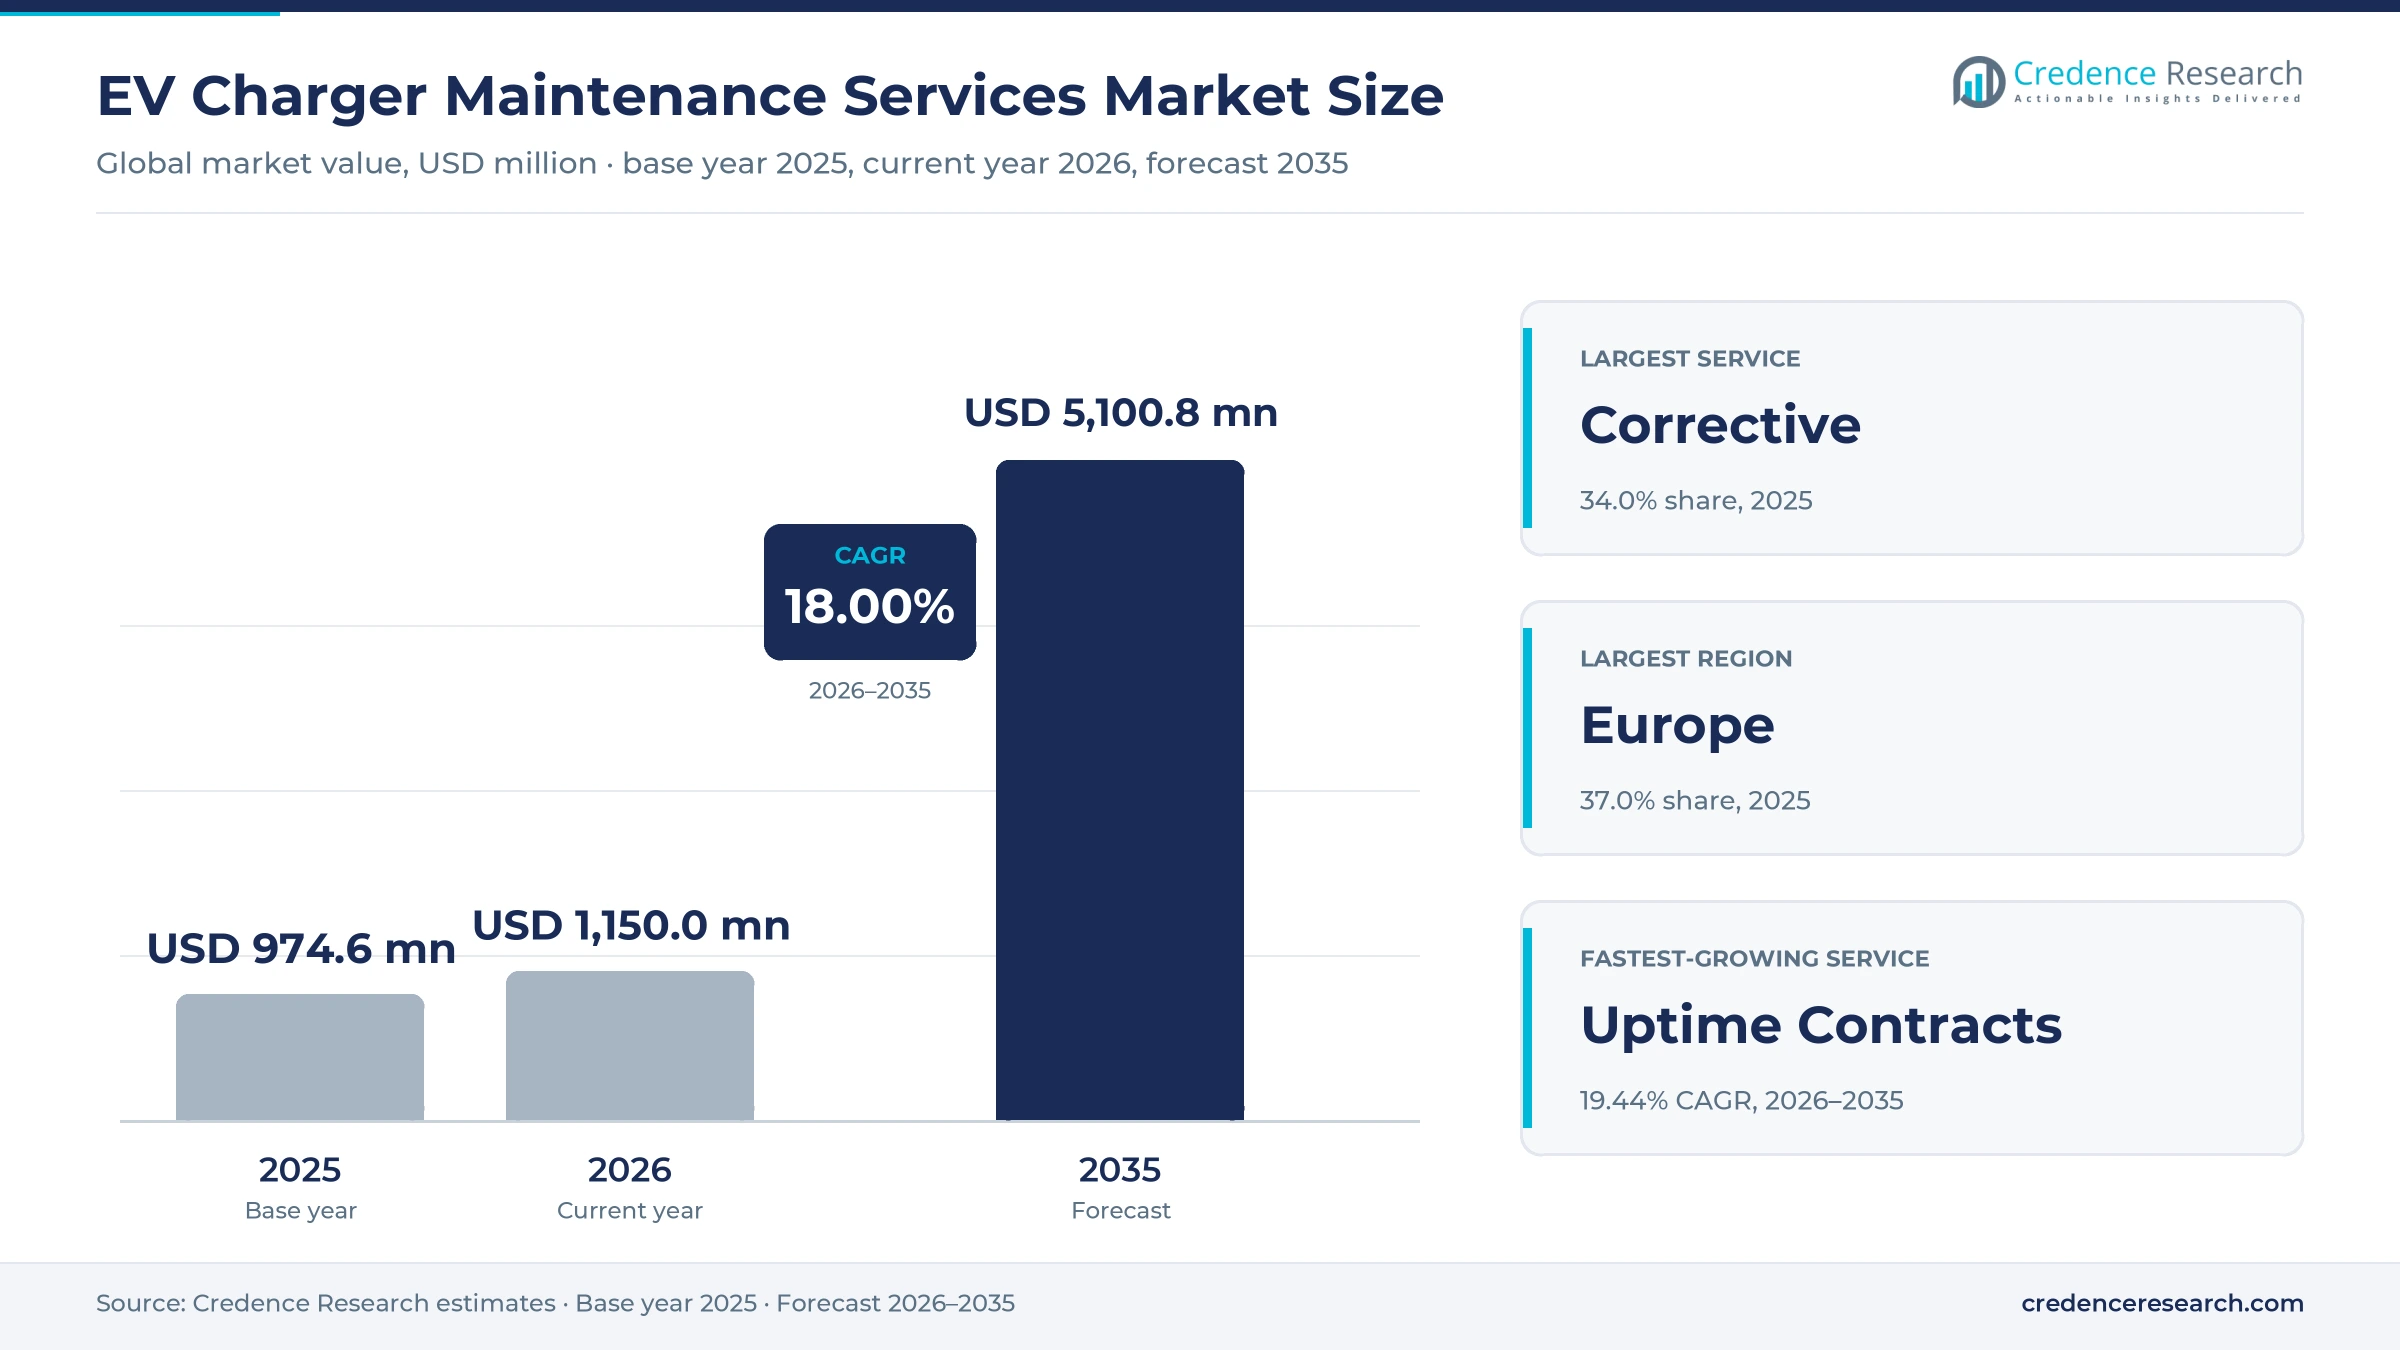
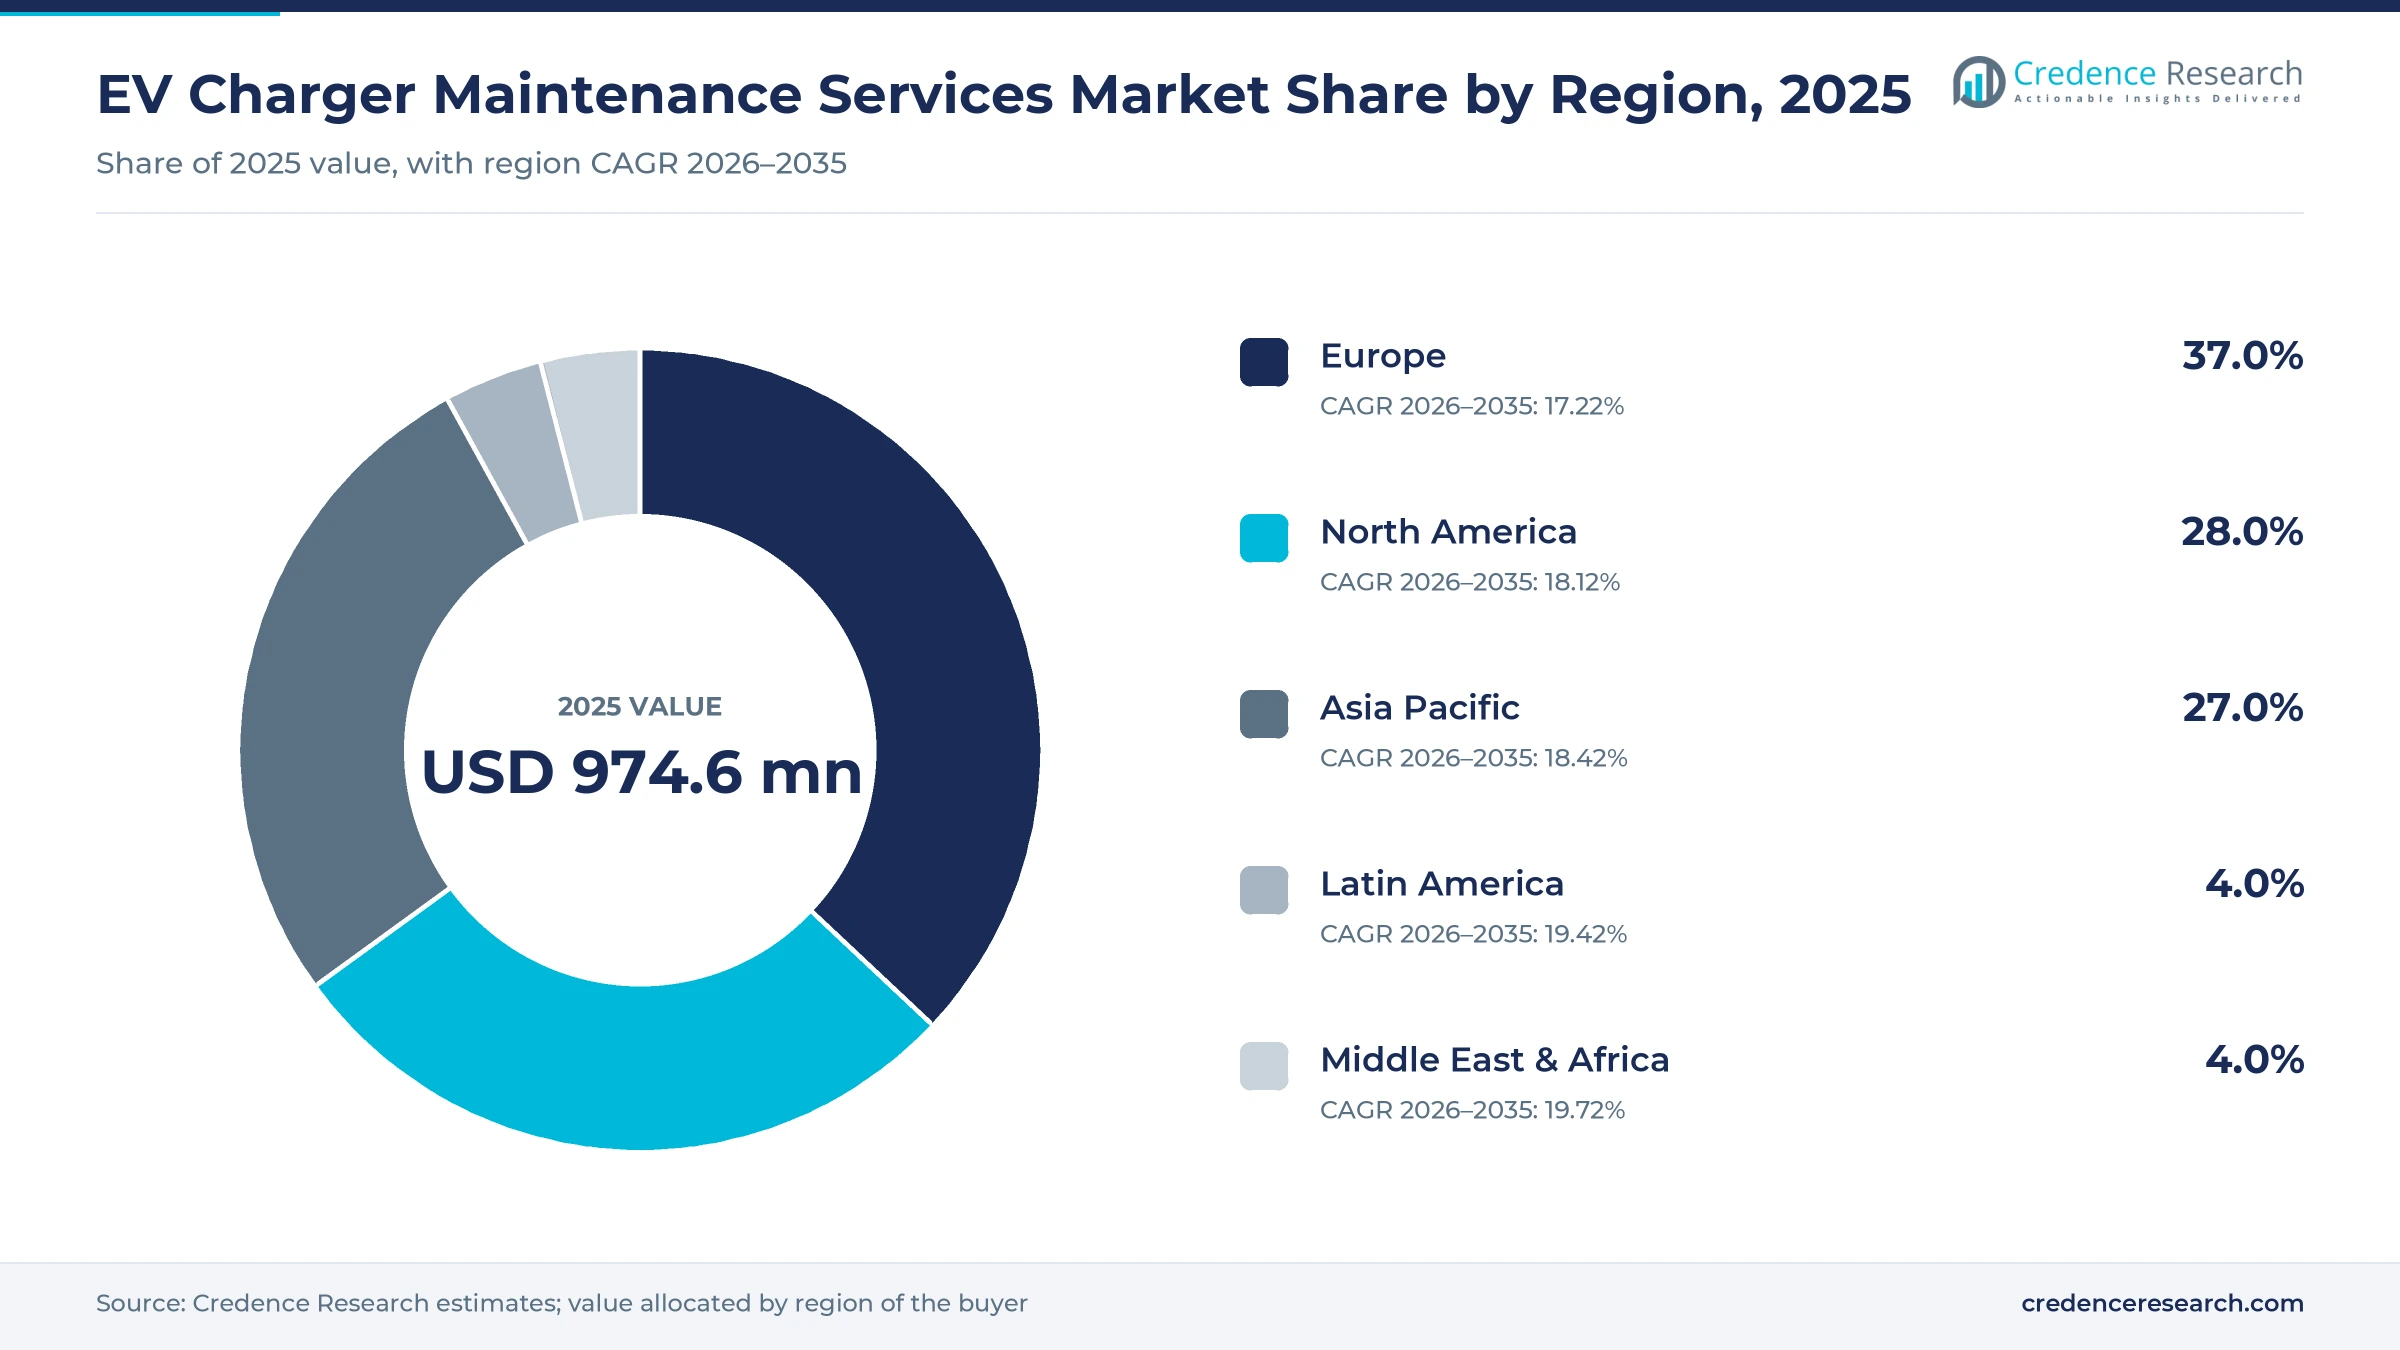
The global EV charger maintenance services market was valued at USD 974.6 million in 2025 and is projected to increase from USD 1.15 billion in 2026 to USD 5.10 billion by 2035, registering a CAGR of 18.00% during 2026–2035. Spending comes from charge point operators, fleet depot owners and retailers that pay hardware makers, networks and independent field teams to inspect, repair and monitor public and commercial chargers. Europe held the largest regional share, 37.0% in 2025, because the region combines a large public network with binding reliability and data rules. Middle East & Africa is the fastest-growing region at 19.72% a year as Saudi Arabia and the UAE build their first national fast charging networks. A major regulatory change took effect on Nov. 24, 2024, when the United Kingdom began enforcing network reliability rules for rapid chargers. Buyers are also moving from call-out repairs to multi-year contracts that guarantee uptime and add remote monitoring.
What does the EV charger maintenance services market include?
The EV charger maintenance services market covers paid work that keeps AC and DC fast chargers in service after installation. This includes scheduled preventive visits, corrective repairs after faults, multi-year uptime contracts with response-time guarantees and remote monitoring that diagnoses and resets units from a network operations center. Buyers pay per visit, per charger per year or through service-level agreements.
The scope excludes charger hardware sales, first installation and grid connection work, charging software sold without a service element and home chargers maintained by their owners. Value is counted at the provider level, including parts supplied under maintenance contracts and labor subcontracted to local field technicians.
EV Charger Maintenance Services Market Insights
- The market is valued at USD 974.6 million in 2025 and is projected to reach USD 5.10 billion by 2035, growing at an 18.00% CAGR as charger stocks age.
- Europe led with 37.0% of 2025 value, while Middle East & Africa grows fastest at 19.72% a year as Gulf states build first-generation fast charging networks.
- Corrective work held 34.0% of 2025 value, and Uptime Contracts are the fastest-growing service at 19.44% a year to 2035.
- The IEA counted more than 5 million public charging points worldwide at the end of 2024, double the 2022 level, which widens the base that needs service.
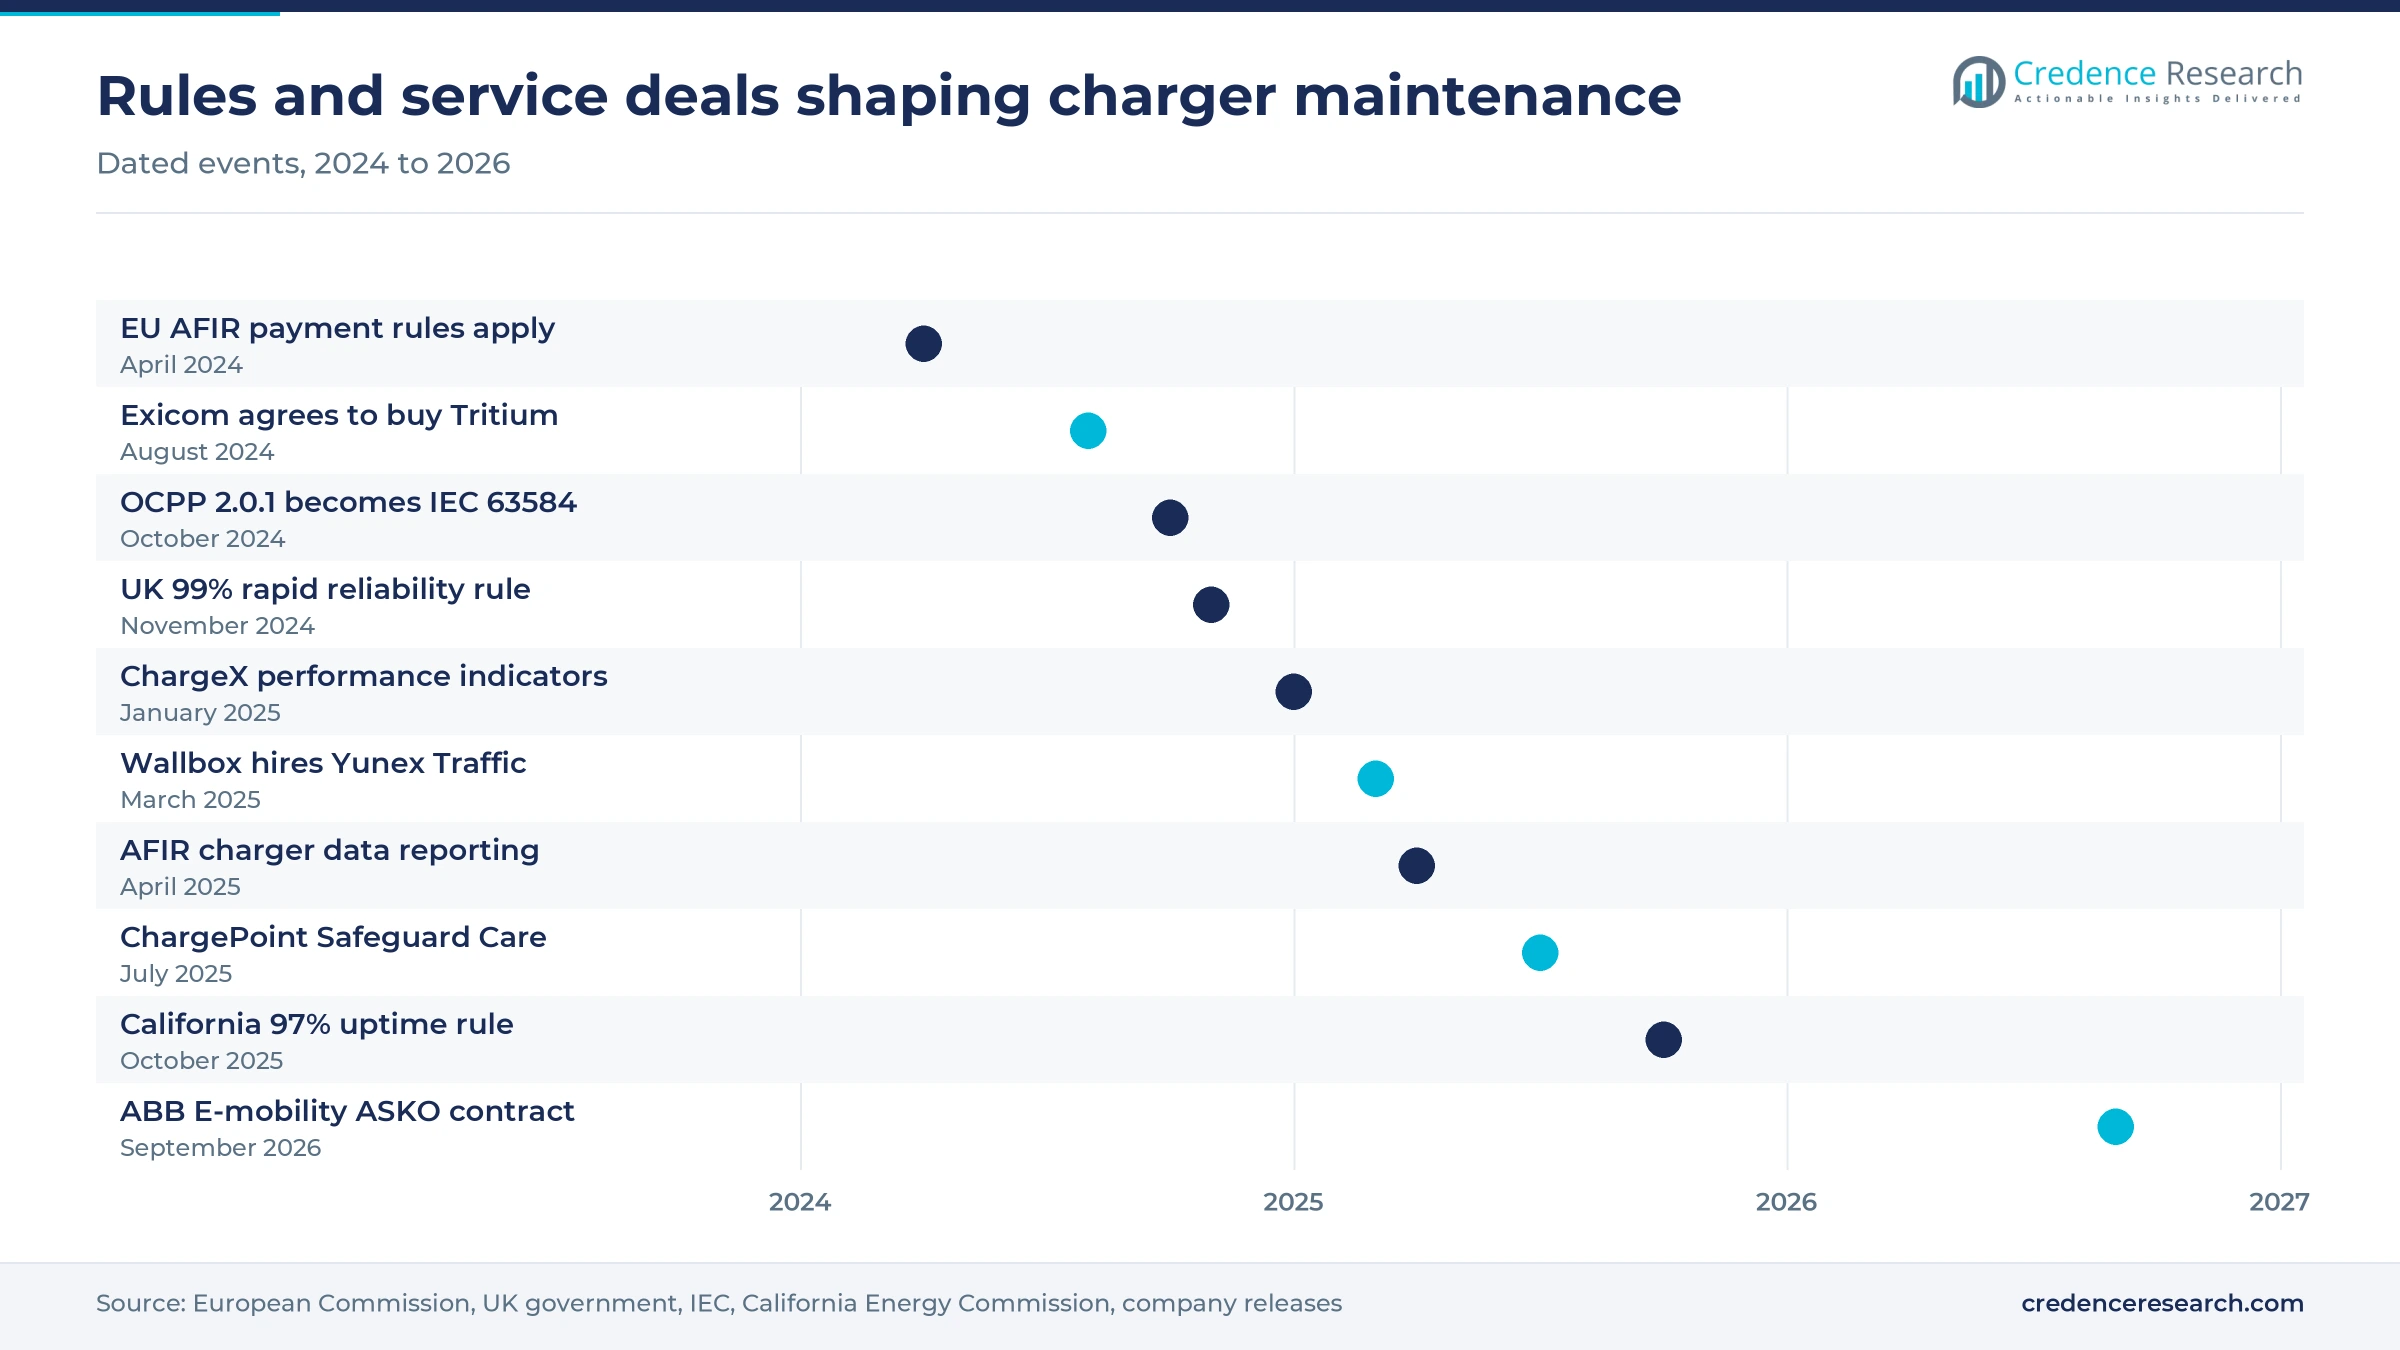
- ChargePoint launched its Safeguard Care preventive visit program in July 2025, and ABB E-mobility took over maintenance of truck chargers for ASKO in Norway in September 2026.
DC fast units and corrective work hold the largest shares
Why do DC fast chargers lead service spending?
Based on charger, the market is categorized into AC and DC fast. DC Fast units led with 61.0% of 2025 value because power electronics, cooling and liquid-cooled cables need more frequent and costlier work than AC posts. ABB E-mobility estimates that a 400 kW charger running 10 sessions a day at 40 euros each loses 400 euros for every day it is offline. DC Fast units also grow fastest at 18.49% a year as networks add high-power sites. Zapmap counted 9,893 ultra-rapid devices in the United Kingdom at the end of 2025, up 41% in one year.
Why does corrective work lead and uptime contracts grow fastest?
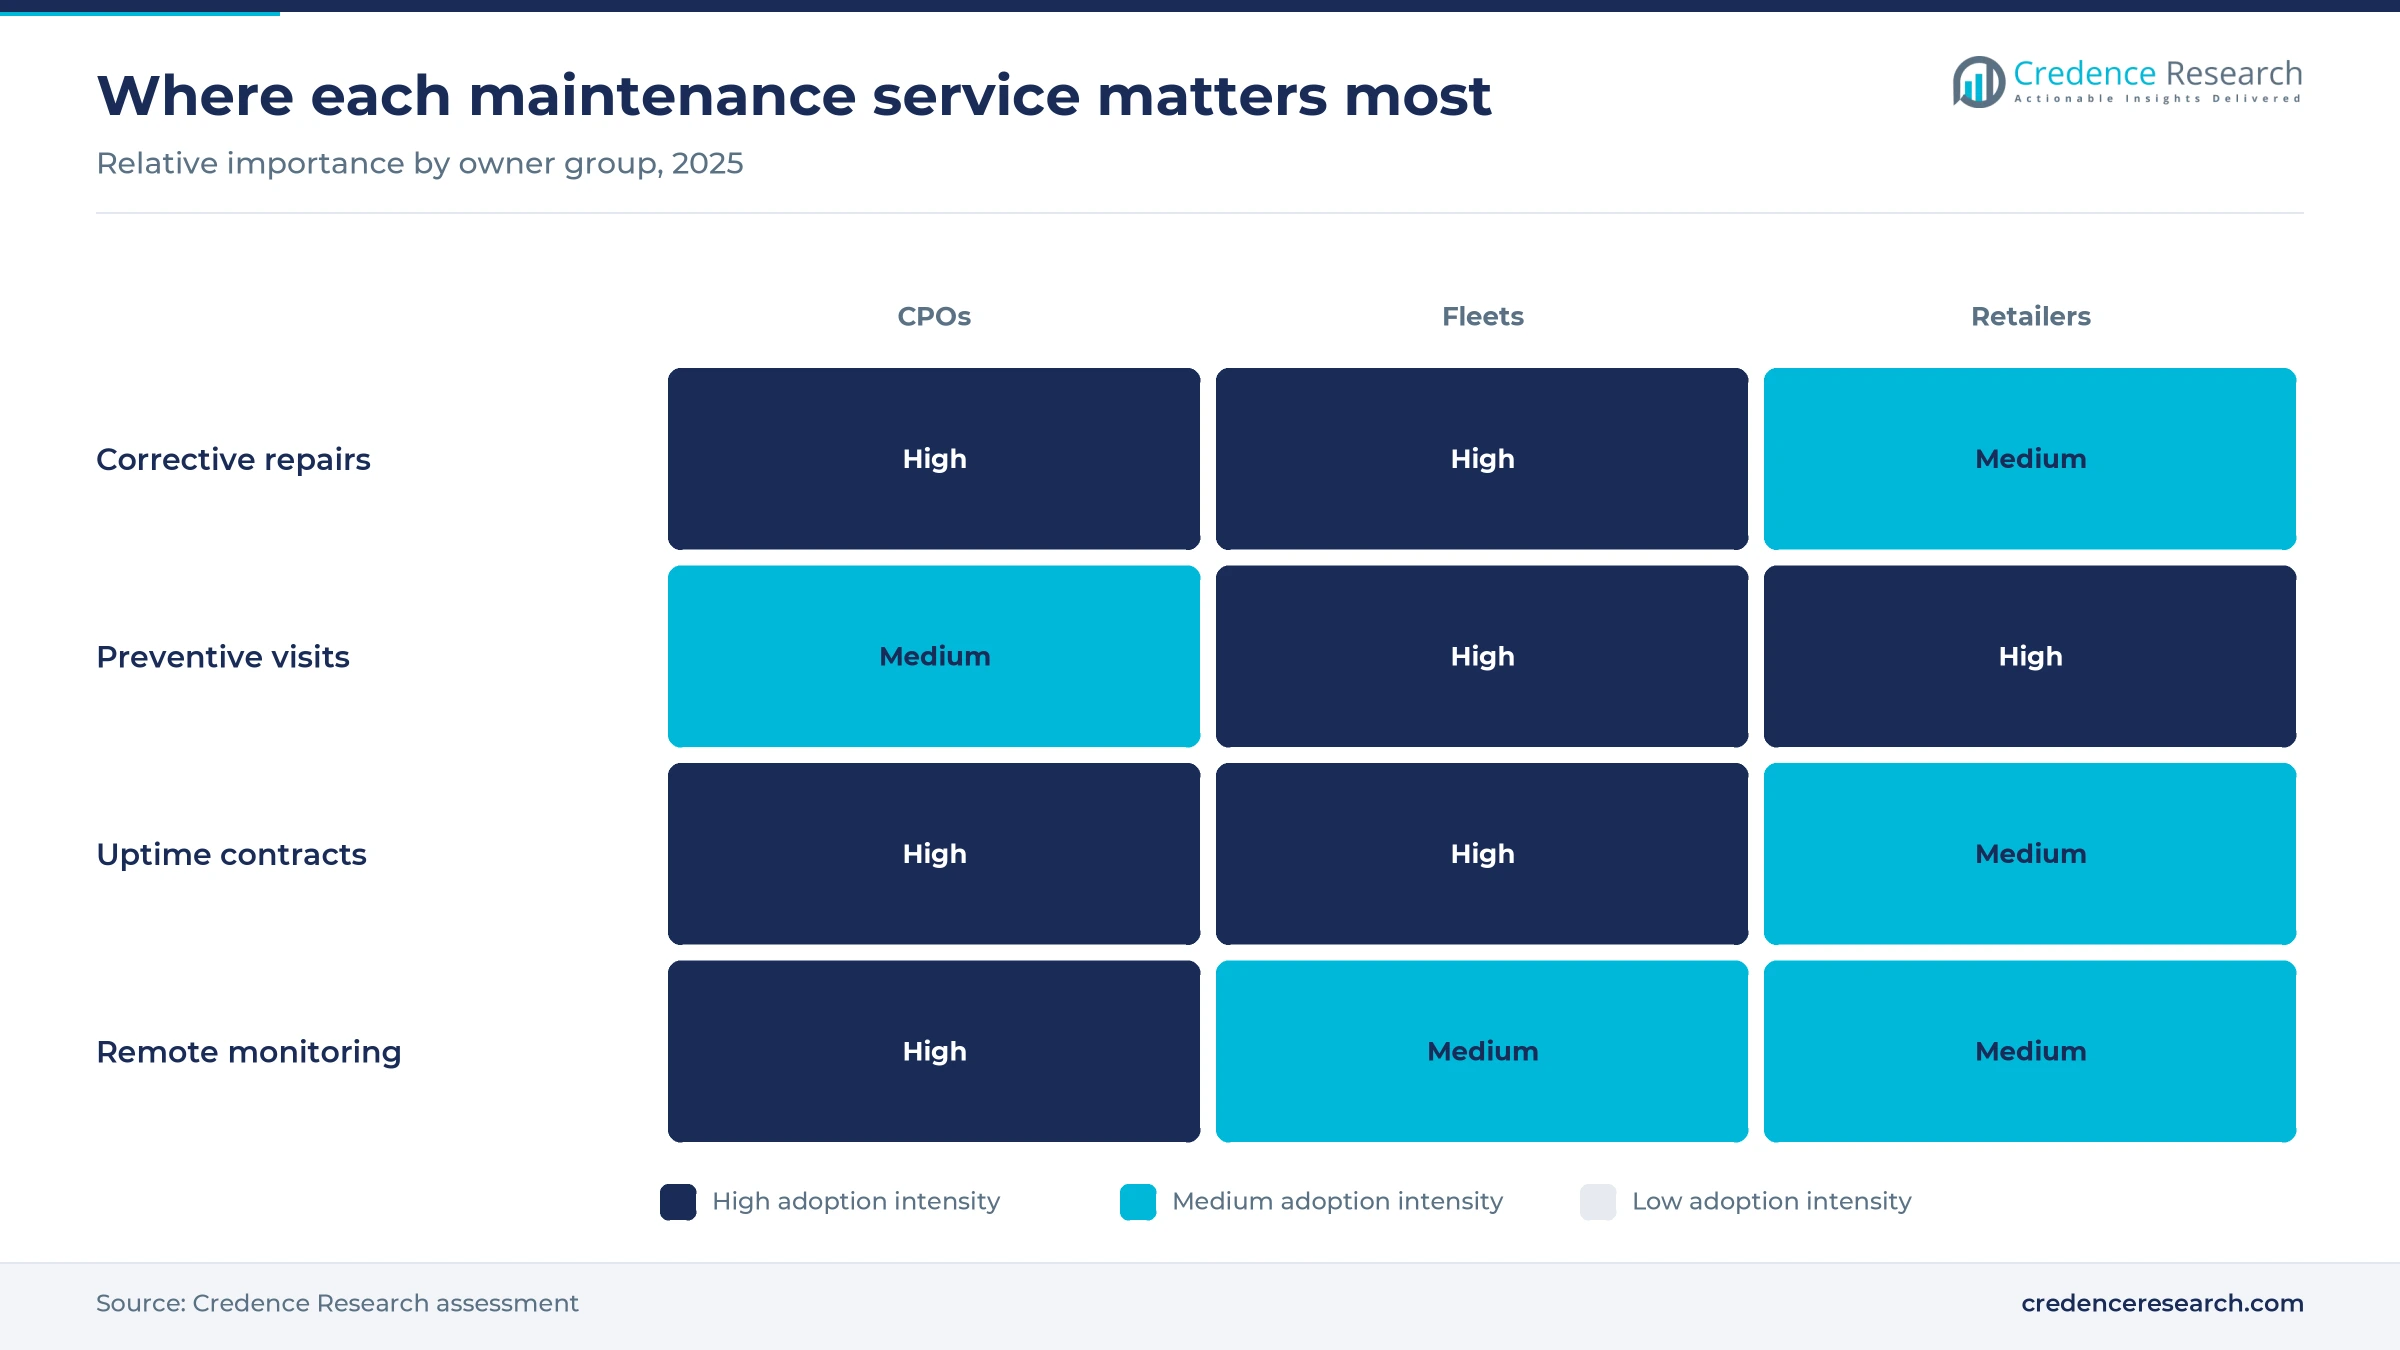
Based on service, the market is categorized into corrective, preventive, uptime contracts and remote monitoring. Corrective work led with 34.0% of 2025 value because many chargers still fail between scheduled visits. A 2025 Electric Vehicle Experience public charging study of 7,428 owners found that 14% of U.S. drivers had a failed charging visit, according to Cars.com, rising to 21% in the Pacific region. Uptime Contracts are the fastest-growing service at 19.44% a year as owners buy guaranteed availability rather than single repairs. ABB E-mobility now sells Parts, Smarts and Uptime packages, with extended parts cover of three to 10 years beyond the first 24 months.
Why do CPOs lead and fleets grow fastest?
Based on owner, the market is categorized into CPOs, fleets and retailers. CPOs led with 55.0% of 2025 value because public networks carry most fast chargers and face reliability rules. Shell alone grew its owned or branded charge points from nearly 73,000 to nearly 88,000 during 2025, according to Mobility Energy. Fleets grow fastest at 19.09% a year as depot charging moves trucks and vans onto electric power. Norwegian food wholesaler ASKO expected about 200 of its 700 trucks to be electric by the end of 2025, according to electrive.
| Segment Group | Leading Sub-segment | Share, 2025 | Fastest-growing Sub-segment | CAGR, 2026–2035 |
|---|---|---|---|---|
| By Charger | DC Fast | 61.0% | DC Fast | 18.49% |
| By Service | Corrective | 34.0% | Uptime Contracts | 19.44% |
| By Owner | CPOs | 55.0% | Fleets | 19.09% |
Request a Free Sample
Fill in your details and we'll send you a free sample report.
- Sample data tables & charts
- Research methodology
Larger networks and uptime contracts drive service spend
Growing charging installed base lifts maintenance demand
Every charger added to a network becomes a long-term service obligation, so the installed base sets the floor for maintenance demand. The IEA Global EV Outlook 2025 counted more than 5 million public charging points worldwide at the end of 2024, double the 2022 level, after about 1.3 million were added in that year. IEA data reported by EV Infrastructure News in May 2026 showed about 1.8 million more public points added in 2025, taking the stock above 7 million. China's National Energy Administration counted 21.48 million charging facilities at the end of March 2026, up 46.9% in a year. In the Credence Research model this driver adds about 7.56 percentage points to annual growth to 2035.
Uptime service-level agreements expand outsourced contracts
Charger owners increasingly sign service-level agreements that move repair risk to an outside provider in return for a fixed annual fee. ABB E-mobility notes that even 99% uptime allows a charger to be down for 3.6 days a year, and it offers packages from parts cover to full uptime guarantees. Wallbox hired Yunex Traffic on March 24, 2025 to maintain its U.K. Supernova rapid chargers from 17 regional service centers and a round-the-clock operations center. ABB E-mobility took over operation and maintenance of more than 60 ASKO high-power truck chargers in Norway on Sept. 29, 2026. In the Credence Research model this driver adds about 4.68 percentage points to annual growth to 2035.
Remote diagnostics and predictive repairs cut downtime
Remote diagnostics let providers find and often fix faults without a truck roll, which cuts downtime and cost per repair. ChargePoint runs remote diagnostics from its network operations center, and its Safeguard Care visits launched in July 2025 send unresolved issues back to that support team, according to electrive. The IEC approved OCPP 2.0.1 as international standard IEC 63584 on Oct. 20, 2024, giving owners one protocol for remote status and fault reporting across brands. ABB E-mobility said proactive case creation, which opens repair tickets before drivers report faults, would be fully available in 2026. In the Credence Research model this driver adds about 3.06 percentage points to annual growth to 2035.
Reliability regulations make uptime a legal duty
Regulators now set minimum uptime and reporting rules, which forces owners to fund regular maintenance rather than wait for complaints. The Federal Highway Administration rule of February 2023 requires 97% average annual uptime for each port funded by the NEVI program, with maintenance for at least five years. The U.K. Public Charge Point Regulations have required 99% reliability across each rapid network since Nov. 24, 2024, with fines of up to 10,000 pounds. The California Energy Commission voted on Oct. 8, 2025 to require 97% uptime for publicly funded fast chargers built from 2024, according to E&E News. These duties turn reliability into a contract line item for each operator.
Success-rate metrics and fleet depots reshape service
Shift from uptime to charge success metrics
Buyers are shifting from simple uptime counts to charge success rates, which raises the bar for what maintenance must deliver. The ChargerHelp 2025 reliability report, based on more than 100,000 sessions at 2,400 chargers, found reported uptime of 98.7% to 99.9% while only about 71% of charging attempts succeeded. More than one third of failures occurred on chargers that appeared operational. The ChargeX Consortium released customer-focused performance indicators on Jan. 17, 2025, measuring whether a driver can start and finish a session. Paren's reliability index for U.S. fast chargers edged up to 92.3% in the third quarter of 2025.
Rise of network-led preventive service plans
Charging networks and hardware makers are adding preventive service plans that schedule visits before faults reach drivers. ChargePoint launched Safeguard Care in July 2025, with technician visits that inspect, clean, make minor repairs and run a test charge in California, Florida, New York, Texas, Massachusetts and Georgia. ChargePoint also uses Amerit Fleet Solutions, with more than 2,200 technicians, for routine upkeep, inspections and warranty fixes across the United States, according to Fleet Equipment. ABB E-mobility splits its offer into three packages built from four modules, with optional parts cover extended by three to 10 years, according to its 2025 service white paper. Yunex Traffic teams also maintain more than 2,000 chargers in the United Kingdom, including Wallbox units since March 2025.
Fleet and truck depots open long-term service contracts
Electric truck and van depots open a contract opportunity because a broken charger can idle a whole delivery route. ABB E-mobility now monitors, maintains and supports more than 60 high-power chargers for ASKO across seven Norwegian cities, a network that has delivered over 20 GWh, according to electrive in September 2026. Hitachi Energy and Penske opened a truck charging depot near Stockton, California in March 2024 with 10 pedestals of up to 200 kW, according to Trucking Info. Fleets grow at 19.09% a year in the Credence Research model, ahead of public operators, because depot owners rarely employ their own charger technicians.
Emerging charging programs open first-generation service demand
Large public programs in emerging markets open demand for local service partners as first-generation networks come out of warranty. India's Ministry of Heavy Industries issued guidelines in September 2025 for up to 72,300 public chargers under PM E-DRIVE, backed by 2,000 crore rupees, including 22,100 fast chargers for cars and 1,800 for buses, according to Autocar Professional. Brazil had 29,896 public and semi-public charging points in August 2026, 11,411 of them DC fast, according to the ABVE and Tupi. Saudi Arabia's EVIQ had 32 stations operating in November 2025 and a national goal of 5,000 stations.
Technician gaps, theft and orphaned hardware raise costs
Shortage of certified technicians slows repairs
Qualified charger technicians remain scarce, which lengthens repair times and lifts labor rates. The NEVI rule requires electricians who install, operate or maintain funded chargers to hold EVITP certification or finish an approved apprenticeship. The Detroit News reported in August 2024 that about one in five chargers did not work and that EV technician starting wages could reach $30 an hour. This barrier means rural sites wait longest for visits and face higher downtime risk. Providers respond with remote resets and local training programs for new technicians.
Cable theft and vandalism add unplanned repair costs
Cable theft and vandalism are a costly challenge because they create repair work that no preventive plan can schedule. Freedom of information data from more than 30 U.K. police forces showed over 200 theft and vandalism cases against chargers between 2022 and mid-2025, according to electrive. EnBW recorded cable theft at about 120 German locations in 2025 alone. Each charger holds only about £20 worth of copper, but repairs run into thousands of pounds. Operators respond with alarmed cables, cameras and faster replacement stock.
Supplier exits leave orphaned chargers in the field
Hardware makers and networks that exit the market leave owners without parts, firmware or service support. Tritium, which had sold more than 13,000 DC fast chargers in 47 countries, entered administration in 2024 before Exicom agreed to buy it in August 2024, according to Electrical Review. Shell said in August 2025 that it would remove more than 2,000 Volta charging stations in the United States by the end of 2025. As a result, owners carry the risk of costly retrofits and missing parts. Independent providers respond by servicing several charger brands under one contract.
Aging hardware erodes charge success over time
Charger reliability declines with age, which raises the cost of keeping older sites at contract levels. The ChargerHelp 2025 report found that charge success averaged 85% at new stations but fell to 69.9% by year three, a 15-point drop. Hardware swaps lifted uptime only for a short time without deeper fixes, the report added. As a result, owners of early networks face rising repair bills. Providers respond with preventive maintenance and planned component replacement programs.
Europe leads as Middle East & Africa grows fastest
| Region | Value, 2025 (USD million) | Share, 2025 | CAGR, 2026–2035 |
|---|---|---|---|
| Europe | 360.6 | 37.0% | 17.22% |
| North America | 272.9 | 28.0% | 18.12% |
| Asia Pacific | 263.1 | 27.0% | 18.42% |
| Latin America | 39.0 | 4.0% | 19.42% |
| Middle East & Africa | 39.0 | 4.0% | 19.72% |
Europe leads on network size and binding rules
Europe held 37.0% of 2025 value and grows at 17.22% a year to 2035. The IEA counted just over 1 million public charging points in Europe at the end of 2024, after 275,000 were added that year. The EU AFIR rules have required ad hoc payment at new public points since April 13, 2024, and operators have reported static and dynamic charger data to national access points since April 14, 2025. Zapmap counted 87,796 U.K. public devices at the end of 2025.
North America grows on federal and state uptime rules
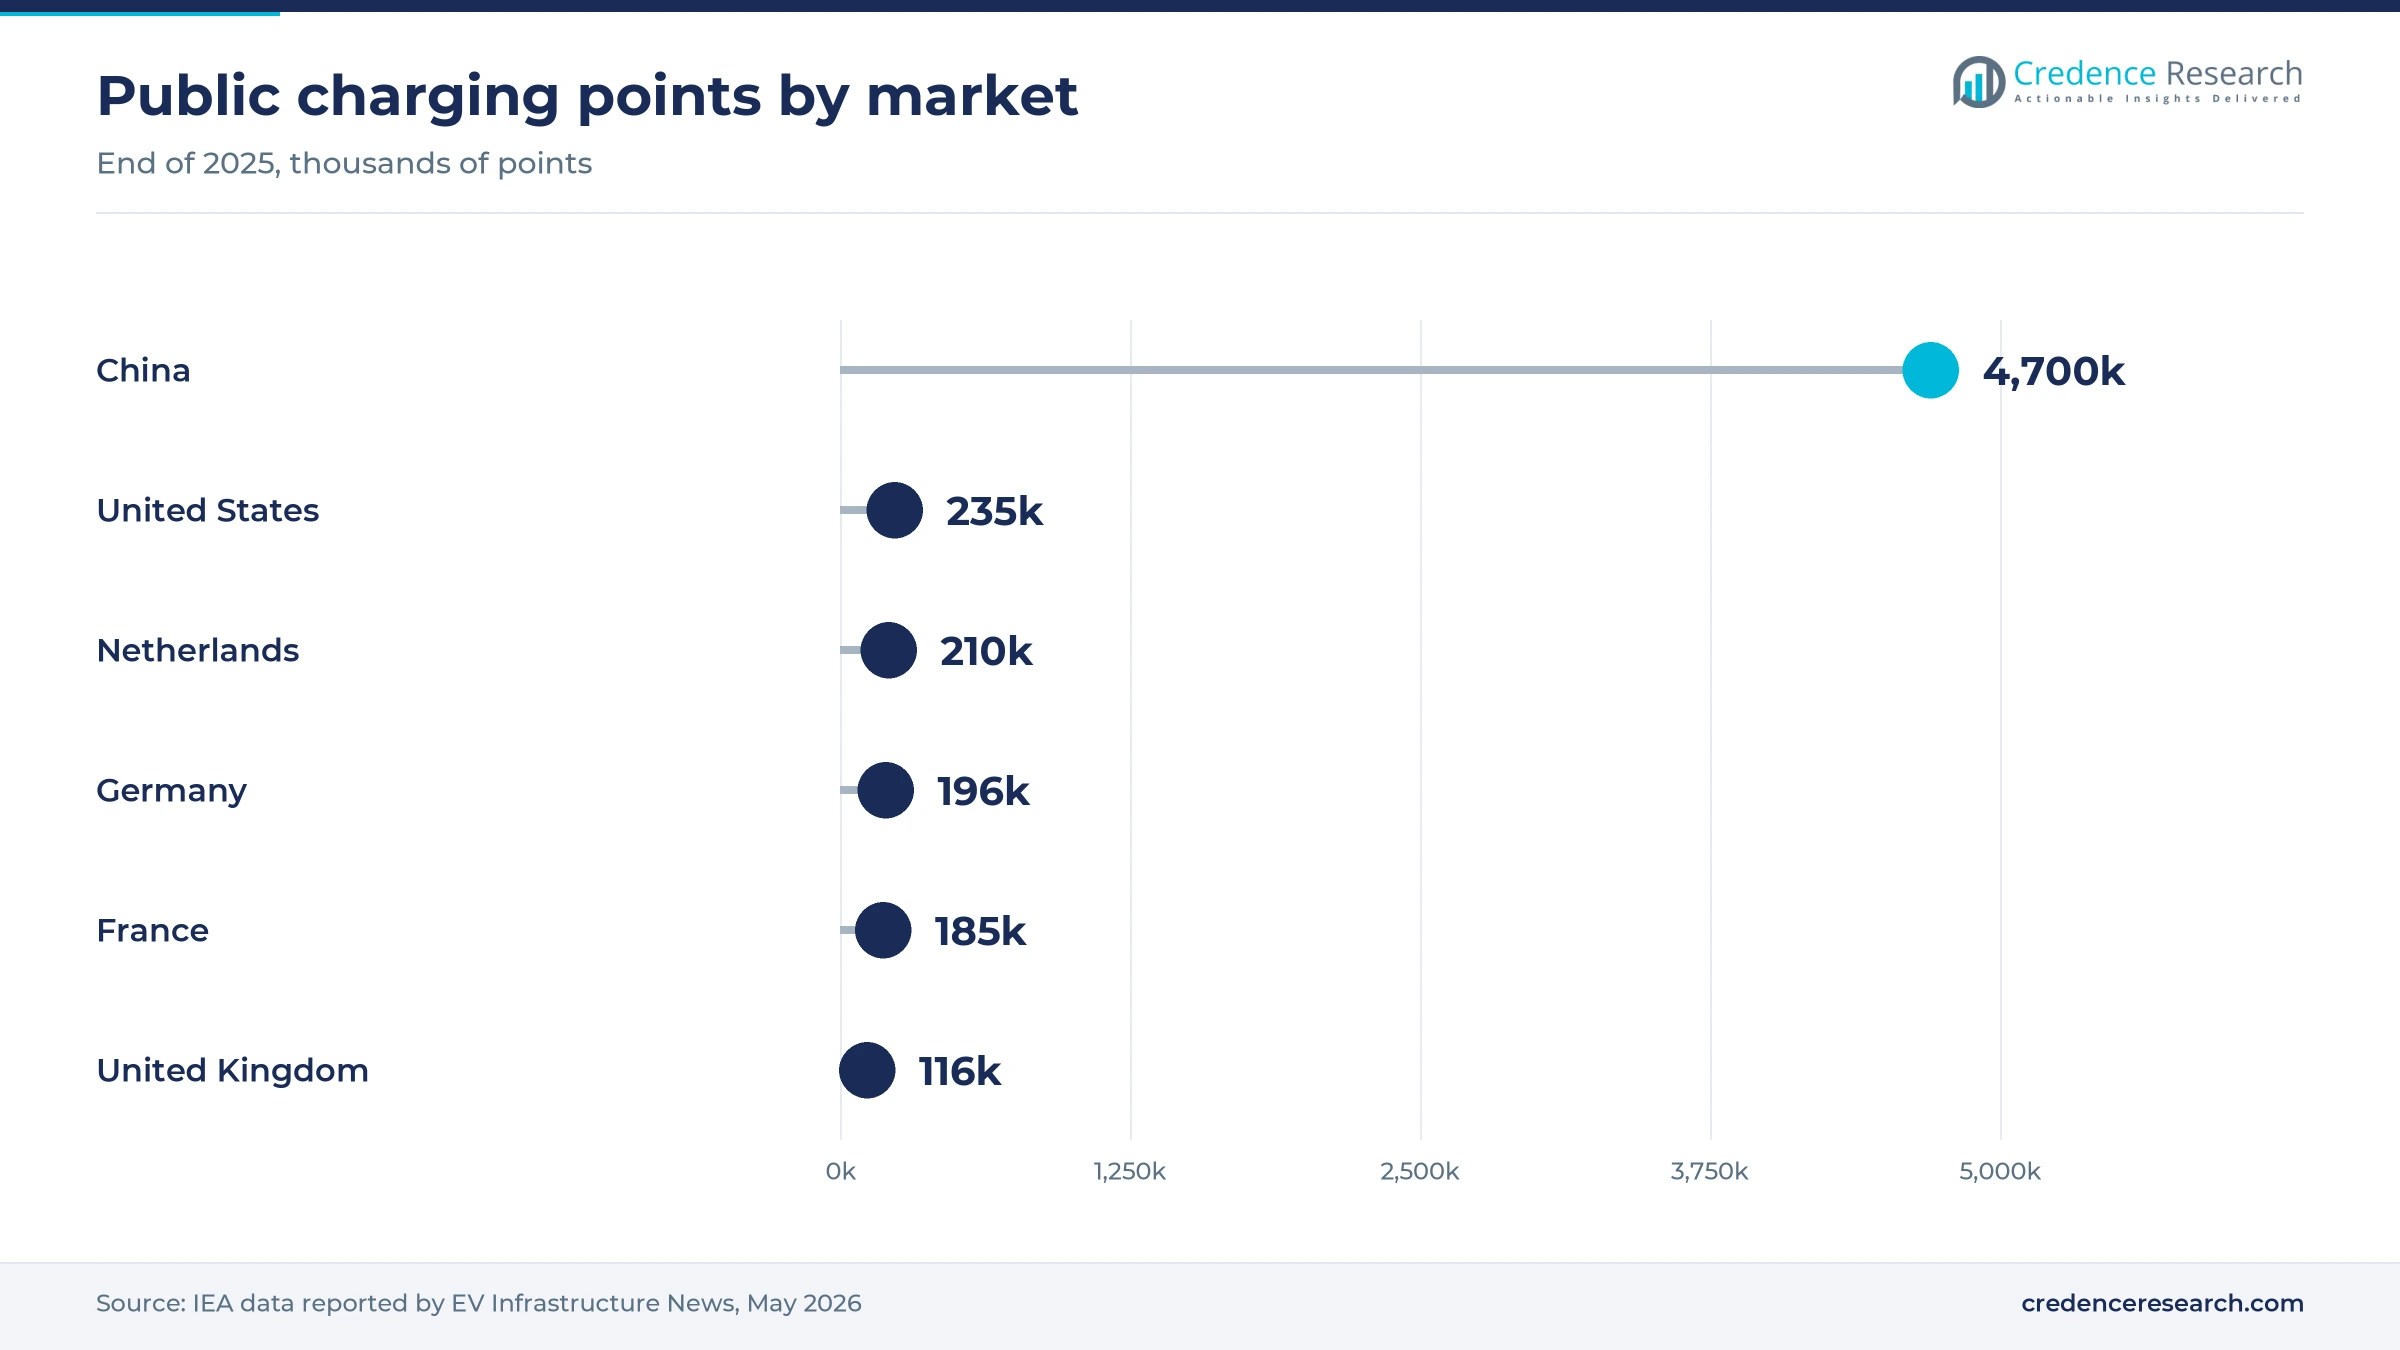
North America held 28.0% of 2025 value and grows at 18.12% a year to 2035. The United States had about 235,000 public charging points at the end of 2025, including about 70,000 fast chargers, according to IEA data. Paren counted 64,486 public DC fast ports across 12,375 stations in the third quarter of 2025. The NEVI and California uptime rules set the same floor for funded chargers, and Walmart opened its 100th fast charging site in Monument, Colorado.
Asia Pacific grows on the largest charger stock
Asia Pacific held 27.0% of 2025 value and grows at 18.42% a year to 2035. China had about 4.86 million public charging connectors at the end of March 2026, up 28.1% in a year, according to the National Energy Administration. Lower labor rates keep service value per charger below European levels. Japan aims for 300,000 chargers by 2030, ten times the roughly 30,000 public units cited in 2023, and India plans up to 72,300 public chargers under PM E-DRIVE.
Latin America builds a fast charging base in Brazil
Latin America held 4.0% of 2025 value and grows at 19.42% a year to 2035. Brazil had 29,896 public and semi-public charging points in August 2026, up about 77% from a year earlier, according to the ABVE. DC fast points made up 11,411 of the total and grew 32.6% in a single quarter. This creates new service work, because many Brazilian sites sit far from manufacturer repair centers in Sao Paulo.
Middle East & Africa grows fastest from new networks
Middle East & Africa held 4.0% of 2025 value and is the fastest-growing region at 19.72% a year to 2035. Saudi Arabia's EVIQ had 32 stations open in Riyadh, Jeddah and Dammam in November 2025 and planned 60 by the end of that year, according to Arab News. The company also plans highway stations on the Riyadh to Dammam and Jeddah to Madinah routes. Its national goal of 5,000 stations points to long-term service contracts as hot-climate sites age.
Service deals and reliability reports marked 2025-2026
| Development | Status and market relevance |
|---|---|
| In March 2025, Wallbox appointed Yunex Traffic to maintain its Supernova rapid chargers across the United Kingdom from 17 regional service centers. | Targets the 99% reliability level set by U.K. charge point rules |
| In July 2025, ChargePoint launched Safeguard Care, a preventive visit program with inspections, cleaning, minor repairs and test charges. | Available in six U.S. states, with wider rollout tied to demand |
| In September 2025, ChargerHelp published a reliability report covering more than 100,000 sessions at 2,400 chargers. | Showed a 71% charge success rate despite reported uptime near 99% |
| In October 2025, Wallbox and Hera Group agreed to deploy 58 Supernova 120 kW DC fast chargers in Emilia-Romagna, Italy. | Hera Comm oversees installation, commissioning and ongoing operation |
| In September 2026, ABB E-mobility took over monitoring, maintenance and support of more than 60 ASKO truck chargers in Norway. | Extends manufacturer service contracts into heavy fleet depots |
Remote diagnostics, open protocols and field dispatch
- Remote diagnostics read fault codes, reset controllers and push firmware from a network operations center, which avoids many site visits.
- Open charge point protocols such as OCPP 2.0.1, approved as IEC 63584 in October 2024, report status and errors in one format across charger brands.
- Predictive analytics flag rising error rates, overheating or cable wear before a unit fails, so technicians can plan repairs during low-use hours.
- Field dispatch platforms match faults with the nearest qualified technician and track response times against service-level agreements.
- Session success monitoring measures whether drivers start and finish a charge, which shows faults that simple uptime figures miss.
Need a Custom Version of This Report?
Tailor the scope, geography, or segments to your exact requirements.
- Custom geography or segment scope
- Direct access to our analyst team
Hardware makers, networks and specialists compete
Competition in EV charger maintenance services centers on response time, parts access and proof of uptime. Hardware makers such as ABB E-mobility and Wallbox sell service packages and use partners such as Yunex Traffic for field work. Network operators such as ChargePoint combine Assure plans, Safeguard Care visits and partner technicians from Amerit Fleet Solutions. Independent specialists such as ChargerHelp! sell repair labor as a subscription and publish reliability data. Shell Recharge runs one of the largest branded networks, with nearly 88,000 points at the end of 2025. Most providers tie field work to network management software that logs faults and tracks contract metrics. Price per charger matters less than multi-brand coverage, because many owners now run hardware from several makers and need one provider for all of it.
Companies profiled and their roles in this market
| Company | Type | Role in the market |
|---|---|---|
| ChargePoint | Network and hardware supplier | Assure plans, Safeguard Care preventive visits and remote diagnostics |
| ABB E-mobility | Hardware maker with service arm | Parts, Smarts and Uptime packages and the ASKO truck charger contract |
| ChargerHelp! | Independent service specialist | Repair labor subscriptions and charge success reporting |
| Shell Recharge | Charge point operator | Nearly 88,000 owned or branded charge points at the end of 2025 |
| Wallbox | Hardware maker | Supernova rapid chargers serviced with Yunex Traffic in the United Kingdom |
Charge success, not uptime, will decide vendor share
Credence Research's view is that charge success, not reported uptime, will decide vendor share through 2035. Owners can already show near-perfect uptime, yet drivers still fail to charge on about three of every ten attempts in some samples. Providers that combine remote diagnostics, predictive analytics and fast multi-brand field response are best placed to grow faster than the market. Fleet depots will add a second contract base as trucks and vans electrify. Uptime contracts grow at 19.44% a year, the fastest rate of any service in the EV charger maintenance services market.
Model-based sizing checked against charger stock
The report uses 2025 as the base year and forecasts values from 2026 to 2035 in U.S. dollars. Market values come from the Credence Research model, and the regional, charger, service and owner splits are Credence Research estimates. Inputs include IEA charger stock data, national statistics and regulator publications, company announcements and published reliability studies. The 2025 value was checked against the global public and commercial charger stock and typical service spend per unit. No interviews or surveys were conducted for this edition of the report.
Aging charger fleets extend service growth to 2035
The EV charger maintenance services market is expected to grow from USD 1.15 billion in 2026 to USD 5.10 billion by 2035 as the public and fleet charger stock ages and uptime rules spread. Uptime contracts and remote monitoring should gain share as owners pay for guaranteed availability rather than single repairs. Fleet depots will add demand as trucks and vans move to electric power. The wider charging infrastructure buildout in India, Brazil and the Gulf will create first-generation service work as early sites leave warranty. Corrective repairs will remain the largest service line for older hardware.
Frequently Asked Questions
How big is the EV charger maintenance services market?
Which charger type holds the largest share?
Which service grows fastest?
Which region leads the market?
Which region grows fastest?
Which owner group grows fastest?
Who are the key companies in the market?
What are the main challenges for providers?
Table of Content
Chapter 1 Market Segmentation
- 1.1 Segmentation Framework
- 1.1.1 Product and Service Classification
- 1.1.2 Application and End-Use Classification
- 1.1.3 Technology and Solution Classification
- 1.1.4 Customer and Distribution Channel Classification
- 1.1.5 Geographic Segmentation
- 1.1.6 Market Segment Definitions and Boundaries
- 1.2 By Charger
- 1.2.1 DC Fast
- 1.2.2 AC
- 1.3 By Service
- 1.3.1 Corrective
- 1.3.2 Preventive
- 1.3.3 Uptime Contracts
- 1.3.4 Remote Monitoring
- 1.4 By Owner
- 1.4.1 CPOs
- 1.4.2 Fleets
- 1.4.3 Retailers
Chapter 2 Introduction
- 2.1 Report Objectives and Scope
- 2.2 Product Definition and Industry Terminology
- 2.3 Market Inclusions and Exclusions
- 2.4 Research Process
- 2.4.1 Primary Research and Expert Interviews
- 2.4.2 Secondary Research and Source Review
- 2.4.3 Top-Down and Bottom-Up Estimation
- 2.4.4 Data Triangulation and Verification
- 2.5 Market Size Measurement Basis
- 2.5.1 2025: USD 974.6 million → 2035: USD 5.10 billion
- 2.6 Historical and Forecast Reference Periods
- 2.6.1 Historical Period: 2018-2025
- 2.6.2 Base Year: 2025
- 2.6.3 Forecast Period: 2025-2035
- 2.7 Research Assumptions and Limitations
Chapter 3 Executive Summary
- 3.1 Market Snapshot and Key Findings
- 3.2 Base-Year Market Size, 2025
- 3.3 Forecast Market Size, 2035
- 3.4 Revenue and Volume Growth Outlook
- 3.5 Key Demand and Supply Indicators
- 3.6 Leading Market Segments
- 3.7 Fastest-Growing Market Opportunities
- 3.8 Regional Performance Highlights
- 3.9 Technology and Industry Transformation
- 3.10 Competitive Landscape Summary
- 3.11 Analyst View and Strategic Implications
Chapter 4 Global EV Charger Maintenance Services Market Trends and Developments
- 4.1 Historical Industry Development, 2018-2025
- 4.2 Recent Market Trends and Developments
- 4.3 Demand and Customer Behavior Trends
- 4.4 Technology and Product Innovation
- 4.5 Artificial Intelligence, Automation and Digitalization
- 4.6 Local Manufacturing and Supply Chain Realignment
- 4.7 Industry Partnerships, Mergers and Acquisitions
- 4.8 Sustainability and Circular Economy Developments
- 4.9 Government and Private Sector Investment Trends
- 4.10 Emerging Business Models and Commercialization
- 4.11 Industry Developments and Announcements
Chapter 5 Global EV Charger Maintenance Services Market Supply and Demand Analysis
- 5.1 Demand Trend and Consumption Analysis, 2018-2025
- 5.2 Demand Forecast, 2025-2035
- 5.3 Supply Chain Structure and Procurement Trends
- 5.4 Supply-Demand Gap and Bottlenecks
- 5.5 Import Dependence and Sourcing Structure
- 5.6 Regional Supply and Demand Concentration
Chapter 6 Global EV Charger Maintenance Services Market Pricing Analysis
- 6.1 Pricing Structure and Measurement
- 6.2 Historical Pricing Trends, 2018-2025
- 6.3 Pricing Outlook, 2025-2035
- 6.4 Pricing by Product and Market Segment
- 6.5 Geographic Pricing Differences
- 6.6 Key Input, Energy, Labor and Logistics Costs
- 6.7 Contract Pricing and Purchasing Models
- 6.8 Pricing Sensitivity and Competitive Positioning
- 6.9 Price, Margin and Profitability Implications
Chapter 7 Global EV Charger Maintenance Services Market Dynamics
- 7.1 Market Growth Drivers
- 7.1.1 Demand-Side Drivers
- 7.1.2 Technology and Innovation Drivers
- 7.1.3 Infrastructure and Investment Drivers
- 7.1.4 Regulatory and Policy Drivers
- 7.2 Market Restraints
- 7.2.1 Cost and Affordability Constraints
- 7.2.2 Technology and Adoption Barriers
- 7.2.3 Supply Chain and Operational Constraints
- 7.3 Market Challenges
- 7.3.1 Competitive Pressure and Margin Erosion
- 7.3.2 Skills, Infrastructure and Implementation Gaps
- 7.4 Emerging Market Opportunities
- 7.5 Market Dynamics Impact and Time-Horizon Assessment
Chapter 8 Global EV Charger Maintenance Services Value Chain Analysis
- 8.1 Industry Value Chain Overview
- 8.2 Upstream Suppliers and Critical Inputs
- 8.3 Technology and Component Providers
- 8.4 Manufacturing or Service Delivery
- 8.5 Distribution, Channel Partners and Integrators
- 8.6 Downstream Applications and End Users
- 8.7 Value Addition and Profit Pools
- 8.8 Vertical Integration and Outsourcing
- 8.9 Supplier Concentration and Risk
- 8.10 Supply Chain Localization and Resilience
Chapter 9 Global EV Charger Maintenance Services Market Regulations and Policies
- 9.1 Relevant Laws, Standards and Compliance Frameworks
- 9.2 Product, Service, Safety and Quality Requirements
- 9.3 Government Policies, Incentives and Subsidies
- 9.4 Imports, Exports and Trade Barriers
- 9.5 Public Procurement and Local Content Requirements
- 9.6 Data Protection, AI and Cybersecurity Compliance
- 9.7 Upcoming Policy Changes and Market Implications
Chapter 10 Global EV Charger Maintenance Services Market Hotspots and Opportunities
- 10.1 Market Opportunity Mapping and Growth Hotspots
- 10.2 High-Growth Applications and Customer Groups
- 10.3 Underserved Markets and White-Space Opportunities
- 10.4 Emerging Technology and Product Opportunities
- 10.5 New Capacity and Investment Hotspots
- 10.6 Market Entry and Expansion Opportunities
- 10.7 Distribution and Partnership Opportunities
- 10.8 Near-Term and Long-Term Commercial Potential
- 10.9 Opportunity Attractiveness and Execution Risks
Chapter 11 Global EV Charger Maintenance Services Market Outlook, 2025-2035
- 11.1 Market Size and Analysis
- 11.1.1 Revenue (Market Measurement: 2025: USD 974.6 million → 2035: USD 5.10 billion)
- 11.1.2 Historical Market Size, 2018-2025
- 11.1.3 Base-Year Market Size, 2025
- 11.2 Market Forecast, 2025-2035
- 11.2.1 Revenue Forecast to 2035
- 11.2.2 CAGR and Year-on-Year Growth
- 11.2.3 Incremental Revenue Opportunity
- 11.3 Forecast Assumptions and Scenario Analysis
- 11.3.1 Base-Case Forecast
- 11.3.2 Optimistic and Conservative Scenarios
- 11.3.3 Technology, Pricing and Policy Sensitivities
- 11.4 Market Attractiveness and Growth Outlook
Chapter 12 Global EV Charger Maintenance Services Market Segmentation and Outlook
- 12.1 Segmentation Summary and Market Shares, 2025
- 12.2 Largest and Fastest-Growing Segments
- 12.3 By Charger - Market Size and Forecast, 2025-2035
- 12.3.1 Segment Definition and Scope
- 12.3.2 Historical Market Size, 2018-2025
- 12.3.3 Revenue Forecast, 2025-2035
- 12.3.4 Base-Year Market Share, 2025
- 12.3.5 Segment CAGR and Growth Drivers
- 12.3.6 Subsegment Market Size and Forecast
- 12.3.6.1 DC Fast
- 12.3.6.2 AC
- 12.3.7 Subsegment Pricing and Adoption Trends
- 12.3.8 Leading Suppliers and Competition
- 12.3.9 Regional Demand and Opportunities
- 12.4 By Service - Market Size and Forecast, 2025-2035
- 12.4.1 Segment Definition and Scope
- 12.4.2 Historical Market Size, 2018-2025
- 12.4.3 Revenue Forecast, 2025-2035
- 12.4.4 Base-Year Market Share, 2025
- 12.4.5 Segment CAGR and Growth Drivers
- 12.4.6 Subsegment Market Size and Forecast
- 12.4.6.1 Corrective
- 12.4.6.2 Preventive
- 12.4.6.3 Uptime Contracts
- 12.4.6.4 Remote Monitoring
- 12.4.7 Subsegment Pricing and Adoption Trends
- 12.4.8 Leading Suppliers and Competition
- 12.4.9 Regional Demand and Opportunities
- 12.5 By Owner - Market Size and Forecast, 2025-2035
- 12.5.1 Segment Definition and Scope
- 12.5.2 Historical Market Size, 2018-2025
- 12.5.3 Revenue Forecast, 2025-2035
- 12.5.4 Base-Year Market Share, 2025
- 12.5.5 Segment CAGR and Growth Drivers
- 12.5.6 Subsegment Market Size and Forecast
- 12.5.6.1 CPOs
- 12.5.6.2 Fleets
- 12.5.6.3 Retailers
- 12.5.7 Subsegment Pricing and Adoption Trends
- 12.5.8 Leading Suppliers and Competition
- 12.5.9 Regional Demand and Opportunities
- 12.6 Segment Growth Comparison
- 12.7 Segment Attractiveness and Priority Matrix
Chapter 13 Global EV Charger Maintenance Services Geographic Market Outlook, 2025-2035
- 13.1 Regional Market Size and Share, 2025
- 13.2 Regional Market Forecast, 2025-2035
- 13.3 Regional Pricing, Production and Demand Differences
- 13.4 North America
- 13.4.1 United States
- 13.4.2 Canada
- 13.4.3 Mexico
- 13.5 Europe
- 13.5.1 Germany
- 13.5.2 France
- 13.5.3 Italy
- 13.5.4 United Kingdom
- 13.5.5 Spain
- 13.5.6 Poland
- 13.5.7 Russia
- 13.5.8 Netherlands
- 13.5.9 Belgium
- 13.5.10 Sweden
- 13.5.11 Denmark
- 13.5.12 Norway
- 13.5.13 Rest of Europe
- 13.6 Asia Pacific
- 13.6.1 China
- 13.6.2 India
- 13.6.3 Japan
- 13.6.4 South Korea
- 13.6.5 Thailand
- 13.6.6 Indonesia
- 13.6.7 Vietnam
- 13.6.8 Malaysia
- 13.6.9 Australia
- 13.6.10 Rest of Asia Pacific
- 13.7 Latin America
- 13.7.1 Brazil
- 13.7.2 Argentina
- 13.7.3 Colombia
- 13.7.4 Chile
- 13.7.5 Rest of Latin America
- 13.8 Middle East
- 13.8.1 Saudi Arabia
- 13.8.2 United Arab Emirates
- 13.8.3 Turkey
- 13.8.4 Israel
- 13.8.5 Iran
- 13.8.6 Rest of the Middle East
- 13.9 Africa
- 13.9.1 South Africa
- 13.9.2 Egypt
- 13.9.3 Nigeria
- 13.9.4 Morocco
- 13.9.5 Rest of Africa
- 13.10 Regional Investment, Policy and Supply Chain Differences
- 13.11 Regional Competitive Landscape
- 13.12 Geographic Growth Hotspots
Chapter 14 Global EV Charger Maintenance Services Technology, Innovation and Sustainability Outlook
- 14.1 Technology Landscape and Maturity
- 14.2 Product, Process and Service Innovation
- 14.3 AI, Automation and Digital Tools in the Industry
- 14.4 Technology Adoption and Performance Benchmarking
- 14.5 Innovation Pipeline and R&D Investment
- 14.6 Energy Efficiency and Resource Management
- 14.7 Sustainability, Recycling and Circularity
- 14.8 Technology Roadmap, 2025-2035
- 14.9 Risks of Obsolescence and Technology Substitution
Chapter 15 Global EV Charger Maintenance Services Market Key Strategic Imperatives
- 15.1 Growth and Market Entry Priorities
- 15.2 High-Return Products and Segments
- 15.3 Pricing, Profitability and Cost Optimization
- 15.4 Technology Investment and Product Differentiation
- 15.5 Supply Chain Localization and Resilience
- 15.6 Distribution and Customer Acquisition
- 15.7 Partnership, Acquisition and Capacity Strategy
- 15.8 Regional Expansion Priorities
- 15.9 Short-, Medium- and Long-Term Actions
Chapter 16 Competition Outlook
- 16.1 Industry Competition Characteristics
- 16.2 Market Structure and Concentration
- 16.3 Market Share and Competitive Positioning, 2025
- 16.4 Company-Wise Revenue and Product Benchmarking
- 16.5 Production and Service Capacity Benchmarking
- 16.6 Technology, Pricing and Differentiation
- 16.7 Regional Footprint and Distribution Strength
- 16.8 Mergers, Acquisitions and Strategic Alliances
- 16.9 New Entrants and Competitive Threats
- 16.10 Porter's Five Forces and Industry Attractiveness
- 16.11 Competitive Outlook, 2025-2035
Chapter 17 Company Profiles
- 17.1 Company Coverage and Selection Criteria
- 17.2 ChargePoint
- 17.2.1 Business Description
- 17.2.2 Company Ownership and Geographic Presence
- 17.2.3 Product and Service Portfolio
- 17.2.4 Manufacturing and Operating Footprint
- 17.2.5 Financial Performance and Investment
- 17.2.6 Market Share and Competitive Position
- 17.2.7 Technology and Innovation Capabilities
- 17.2.8 Strategic Alliances or Partnerships
- 17.2.9 Recent Developments
- 17.2.10 Growth Strategy and Outlook
- 17.3 ABB E-mobility
- 17.4 ChargerHelp!
- 17.5 Shell Recharge
- 17.6 Wallbox
- 17.7 Other Relevant Market Participants
Note: Every listed company is profiled on the structure shown under the first company. The company list is preliminary and may change based on research findings, market developments, data availability and client requirements.
Chapter 18 Disclaimer
- 18.1 Research and Forecast Disclaimer
- 18.2 Data Source and Estimation Limitations
Note: The depth of individual sections depends on data availability for this market. Volume, capacity, trade and other unit-based metrics are included where applicable.

