Work quads hold ground as side-by-sides win trail buyers
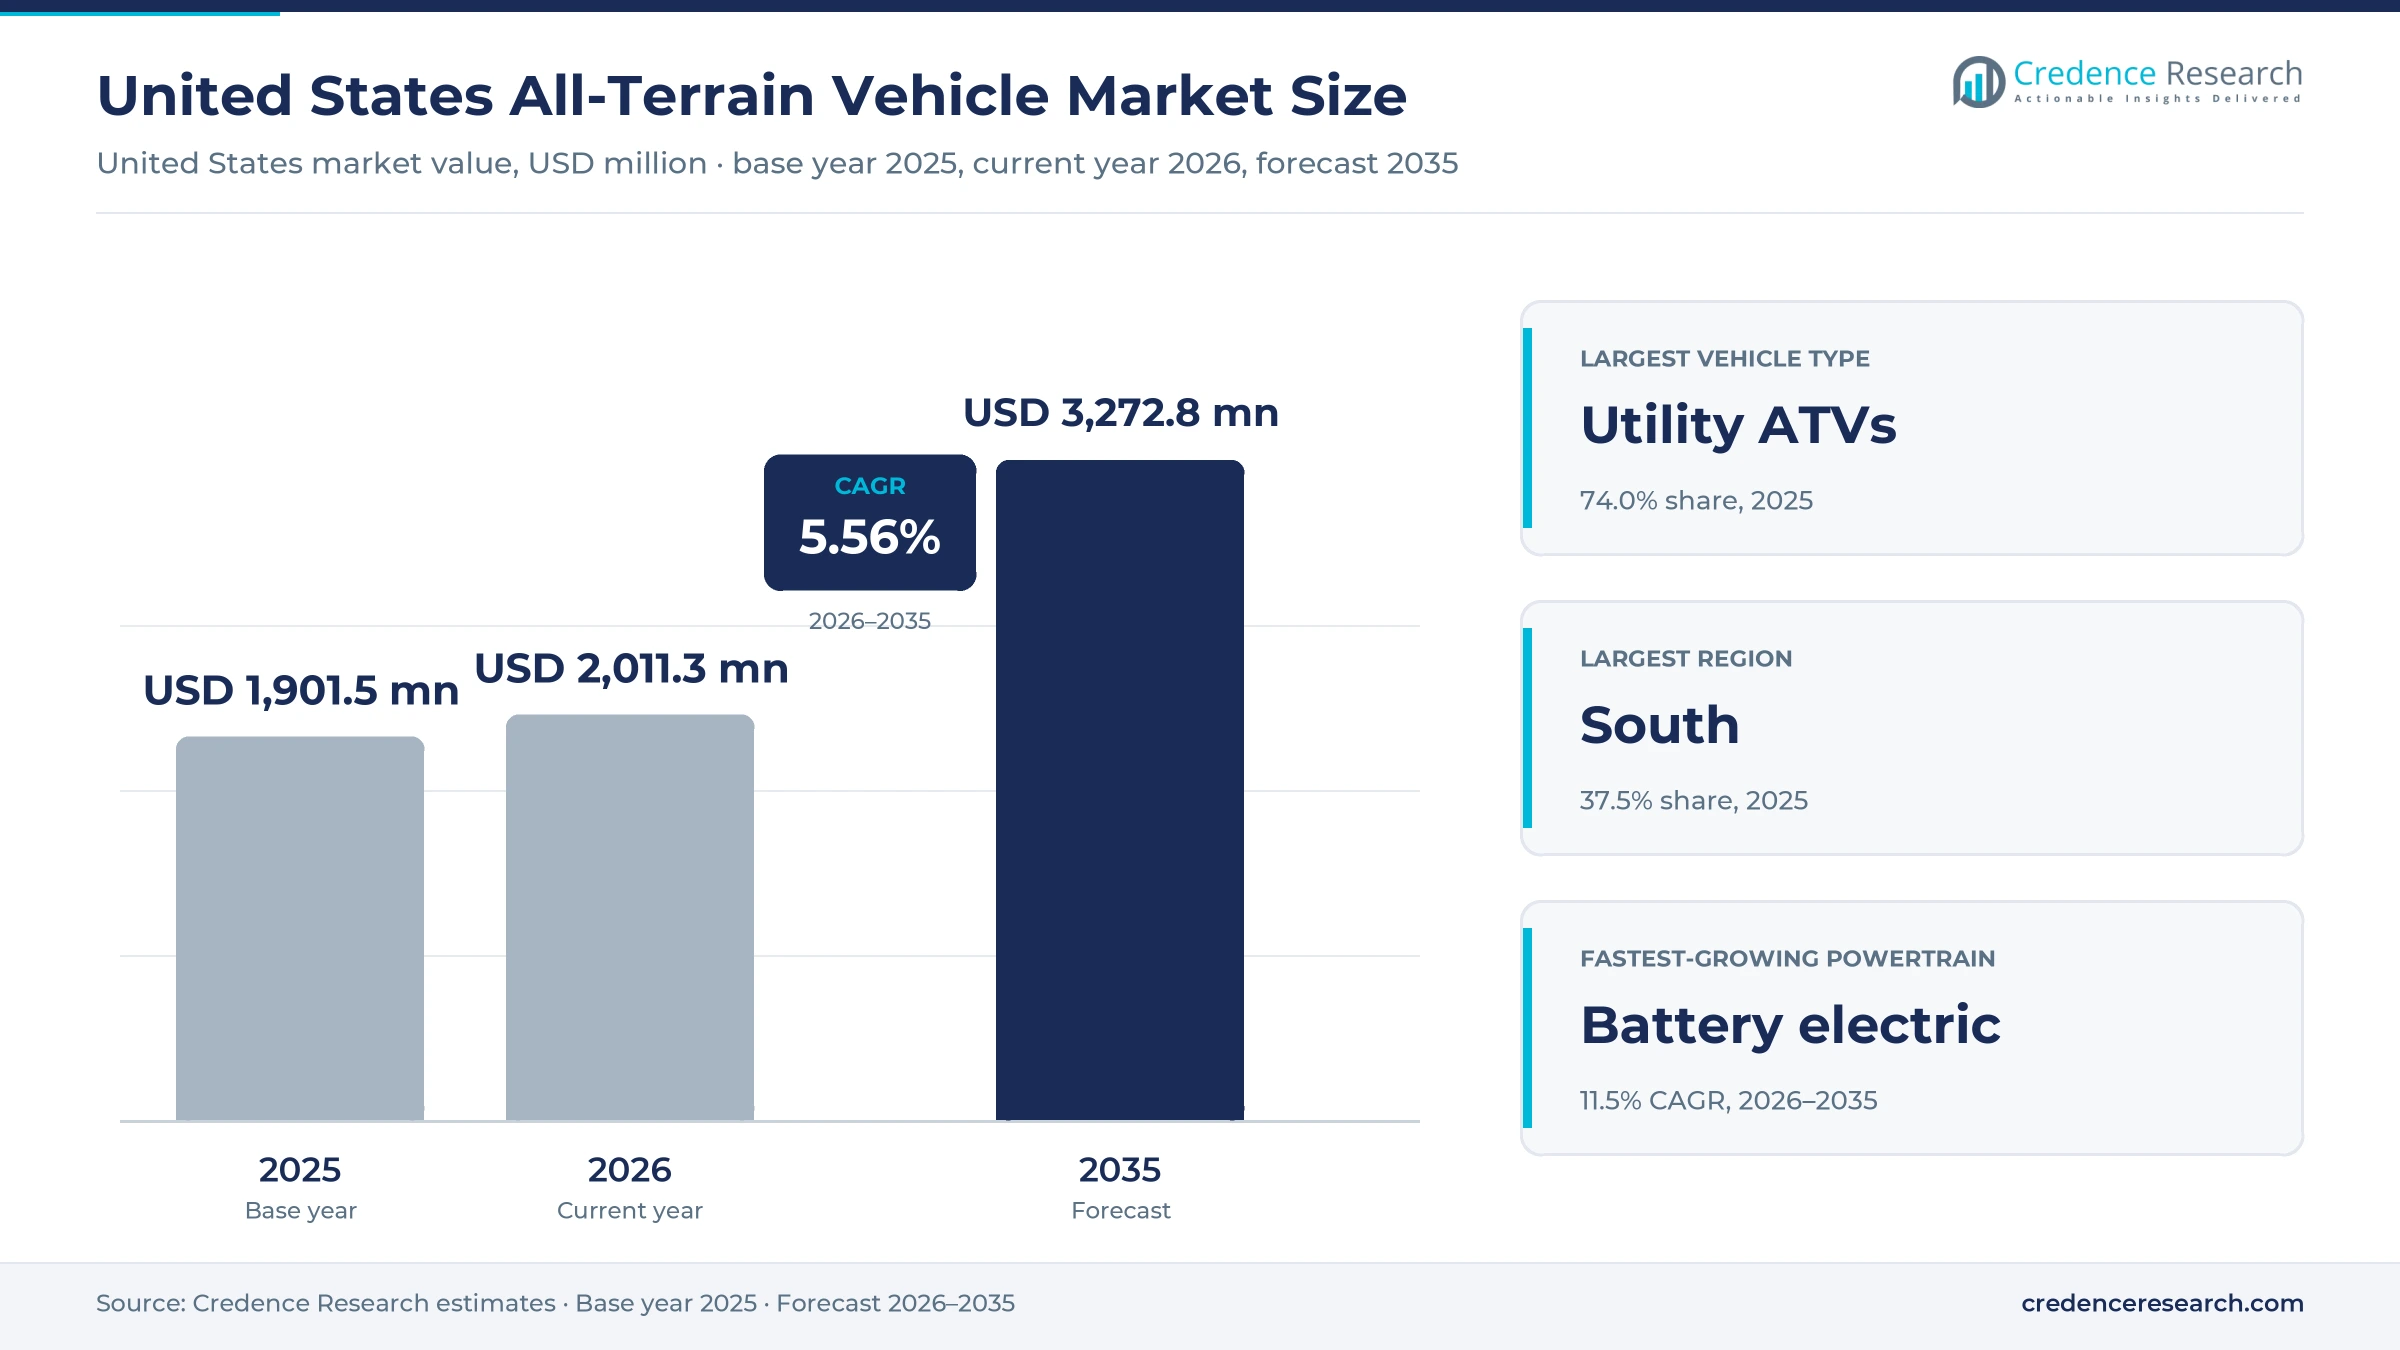
The United States all-terrain vehicle market was valued at USD 1.90 billion in 2025 and is projected to increase from USD 2.01 billion in 2026 to USD 3.27 billion by 2035, registering a CAGR of 5.56% during 2026–2035. Demand comes from farms and ranches that replace work quads on a regular cycle, from households that ride trails and hunt on public and private land, and from agencies that patrol parks, trails and fire zones. The South held the largest regional share, 37.5% in 2025, and it is also the fastest-growing region at 5.8% a year because it holds the most farms and a long riding season. Utility models take most of the value, while recreation buyers continue to move toward side-by-sides. Electric models are the newest change, since BRP brought its first battery-powered Outlander to dealers for the 2026 model year.
New straddle-seat quads sold for work, trail riding and patrol
The market counts new straddle-seat, handlebar-steered all-terrain vehicles sold in the United States, including utility, sport, youth and tactical models with gasoline or battery powertrains. Households, farm and ranch operators and public agencies buy them mostly through franchised powersports dealers, with smaller volumes sold by independent dealers and through government purchasing contracts.
Side-by-side vehicles, golf carts, used vehicles and aftermarket parts, garments and accessories are outside the scope. The value chain runs from engine, frame and electronics suppliers through assembly plants in Alabama, Georgia, North Carolina, Mexico and China to dealers, who handle financing, delivery and service.
United States All-Terrain Vehicle Market Insights
- The United States all-terrain vehicle market grows from USD 1.90 billion in 2025 to USD 3.27 billion by 2035 at a 5.56% CAGR as farm and trail replacement demand holds steady.
- The South held the largest regional share at 37.5% in 2025 and grows fastest at 5.8% a year, as it holds more farms than any other region.
- Utility ATVs led with 74.0% of 2025 value, while youth ATVs grow fastest at 6.5% a year as makers widen age-graded lineups.
- Polaris estimates North American all-terrain vehicle retail sales at about 255,000 units in 2025, against roughly 525,000 side-by-sides, so quads now sell at half the side-by-side volume.
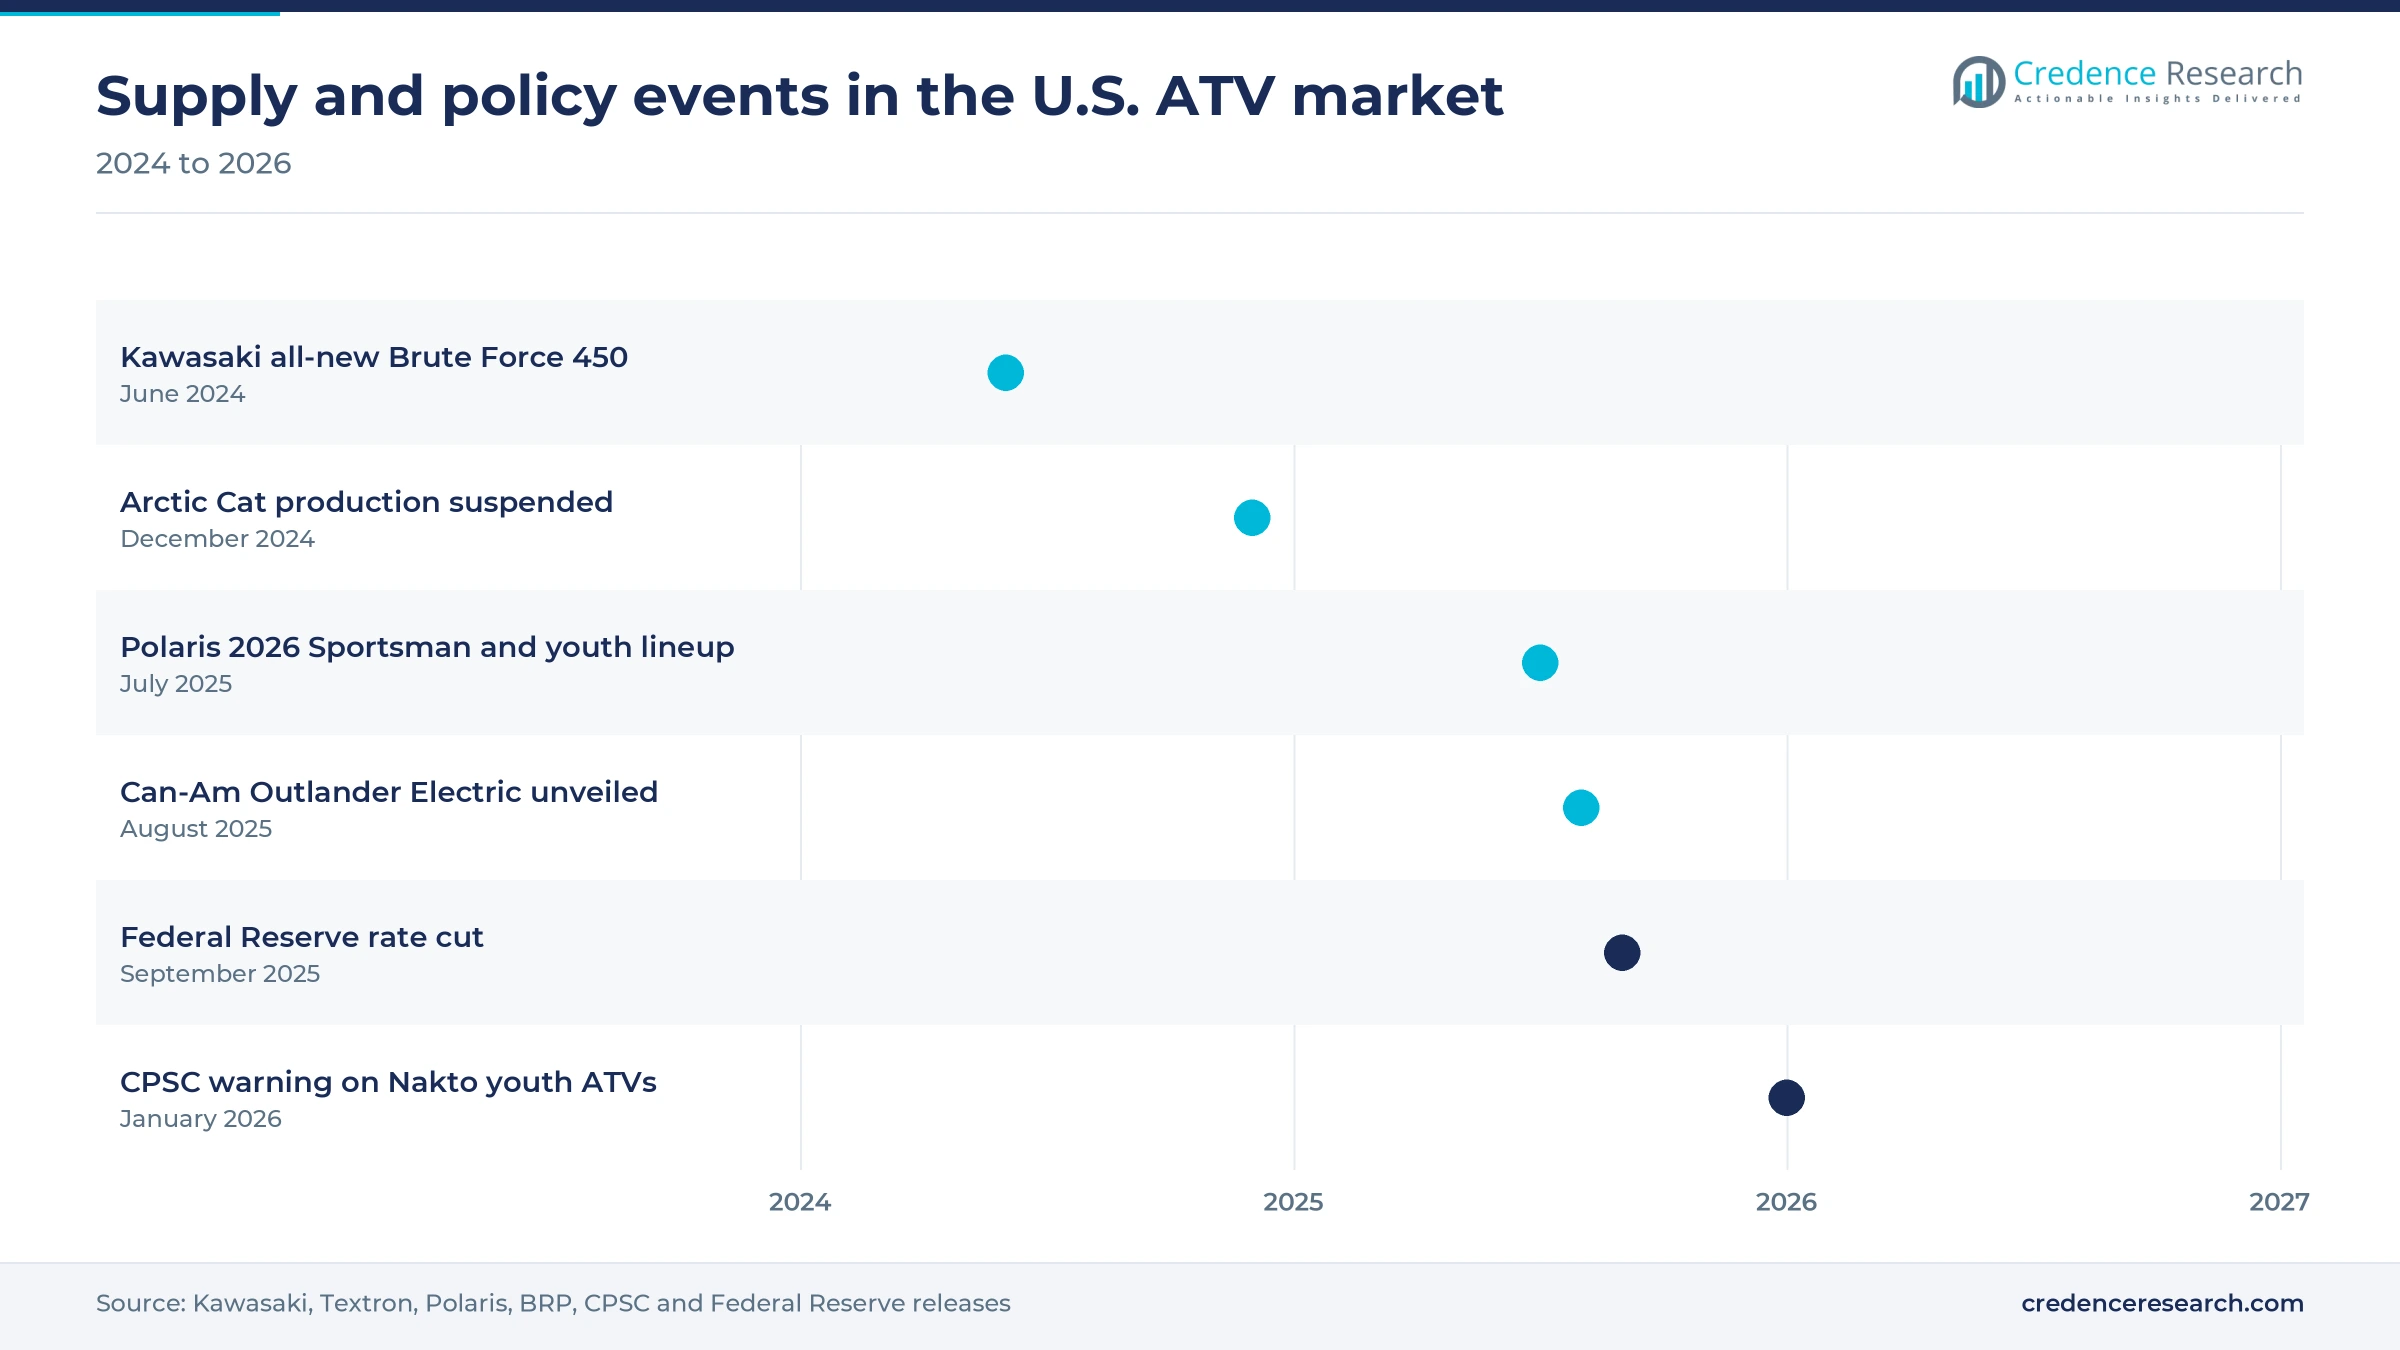
- Textron suspended Arctic Cat production indefinitely in December 2024, which leaves dealers and buyers with fewer full-line suppliers.
Utility models lead as youth and electric quads grow fastest
Utility ATVs lead as youth models grow fastest
Based on vehicle type, the market is categorized into utility ATVs, sport ATVs, youth ATVs and tactical ATVs. Utility ATVs led with 74.0% of 2025 value because farms, hunters and rural property owners keep buying them for work, and Polaris reported that its North American utility retail rose by a mid-single-digit percentage in 2025 while recreation fell. Youth ATVs grow fastest at 6.5% a year as makers widen age-graded lineups, with Polaris adding four youth models for ages six to 14 in July 2025 and Yamaha offering three. Parents trading up between age bands create repeat sales within one household.
Gasoline 4WD leads as battery electric grows fastest
Based on powertrain, the market is categorized into gasoline 2WD, gasoline 4WD and battery electric. Gasoline 4WD led with 78.0% of 2025 value because towing, mud and hill work need all four wheels driven, and Honda lists its Rancher 4x4 at USD 7,349, USD 1,100 above the 2WD base model, according to ATV.com. Battery electric grows fastest at 11.5% a year from a small base, as BRP launched the Outlander Electric for 2026 at a starting price of USD 12,999 listed by the same source. Silent running suits hunters and livestock work, so early buyers come from those groups first.
Households lead as public agencies grow fastest
Based on customer type, the market is categorized into household buyers, farm and ranch businesses and public agencies. Household buyers led with 64.0% of 2025 value because rural homeowners, hunters and trail riders buy most units, and nearly half of U.S. farms sell less than USD 10,000 a year, so many farm quads are bought as household machines. Public agencies grow fastest at 6.6% a year as state trail programs gain money, and Utah awarded USD 6.26 million in OHV grants in 2024 against USD 1.16 million in 2020. Agencies buy quads for trail crews, patrol and search work.
Franchise dealers lead as direct fleet buying grows fastest
Based on sales channel, the market is categorized into franchise dealers, independent new-vehicle dealers and direct fleet procurement. Franchise dealers led with 86.0% of 2025 value because buyers need delivery, financing and warranty service, and Polaris alone sells its off-road vehicles through about 1,300 North American dealers. Direct fleet procurement grows fastest at 6.8% a year as agencies use cooperative contracts, and Sourcewell contract 091024-PSI lets members buy Polaris Sportsman ATVs with fire, rescue and law enforcement packages through November 2028. Such contracts cut tender time for small counties and rural fire districts.
| Segment Group | Leading Sub-segment | Share, 2025 | Fastest-growing Sub-segment | CAGR, 2026–2035 |
|---|---|---|---|---|
| By Vehicle Type | Utility ATVs | 74.0% | Youth ATVs | 6.5% |
| By Powertrain | Gasoline 4WD | 78.0% | Battery electric | 11.5% |
| By Customer Type | Household buyers | 64.0% | Public agencies | 6.6% |
| By Sales Channel | Franchise dealers | 86.0% | Direct fleet procurement | 6.8% |
List prices span USD 2,699 youth quads to USD 20,849 6x6s
U.S. ATV pricing is set by manufacturer suggested retail prices, with dealers adding freight, setup and documentation fees and offering promotional financing on slow models. Engine size, power steering, automatic transmissions and independent rear suspension move a model up the ladder, so the same platform often spans several thousand dollars across trims. The core mid-priced band holds most farm and trail units, and CFMOTO lists its 1000 cc CFORCE Overland at USD 11,799, only about USD 1,700 above Kawasaki's 750 cc Brute Force, so buyers get a larger engine for a small premium. Makers that absorb tariff costs in that band protect volume, while premium and 6x6 trims carry the widest dealer margins.
| Model tier | Typical price or fee | Basis |
|---|---|---|
| Youth ATVs | USD 2,699 to USD 3,449 (Kawasaki KFX50 and KFX90); Polaris youth from USD 2,999 | Kawasaki and Polaris list prices, 2025 to 2026 |
| Entry utility | USD 5,199 (Kawasaki Brute Force 300) to USD 6,249 (Honda FourTrax Rancher) | Kawasaki and ATV.com list prices, 2025 to 2026 |
| Mid utility | From USD 6,999 (Polaris Sportsman) to USD 8,149 (CFMOTO CFORCE 600) | Polaris release July 2025; CFMOTO lineup Sept. 2025 |
| Premium utility | USD 10,099 (Kawasaki Brute Force 750) to USD 11,799 (CFMOTO CFORCE 1000 Overland) | Kawasaki and CFMOTO list prices, 2025 to 2026 |
| Battery electric and 6x6 | USD 12,999 (Outlander Electric) to USD 20,849 (Outlander MAX 6x6 trims) | ATV.com, Aug. 2025 |
Request a Free Sample
Fill in your details and we'll send you a free sample report.
- Sample data tables & charts
- Research methodology
Farm replacement, trail access and new trims carry demand
Farms and ranches replace aging work quads
Farm replacement is the steadiest source of demand, because a ranch quad wears out on a cycle tied to hours of use rather than to consumer moods. USDA counted 1,865,000 U.S. farms in 2025, down 15,000 from 2024, and 48.0% of them had sales below USD 10,000. Those small operations buy single-seat quads that cost far less than a side-by-side or compact tractor. Honda moved FourTrax Rancher assembly to its Swepsonville, North Carolina plant in 2023, keeping its best-selling work model close to buyers. Fewer, larger farms mean fewer buyers, but each still needs a quad for fence, feed and spraying jobs, so the replacement base stays wide even as the farm count slowly falls.
Trail access and registrations widen the rider base
Public trail systems give households a reason to own a quad, and states keep adding permits, trail miles and grant money. Utah counted 227,195 in-state OHV registrations and sold 30,251 nonresident OHV permits from January to November 2024, while its trail crew maintained 512 miles. In West Virginia, the Hatfield-McCoy Trails marked 25 years, and a 2021 Marshall University study put their total economic impact near USD 70 million, according to the West Virginia Chamber of Commerce. These systems turn one-time buyers into owners who replace and upgrade their quads, a pattern that holds up all-terrain vehicle demand in the West and the South.
New trims and features keep utility buyers upgrading
Product innovation in utility models gives existing owners reasons to trade up, since a typical farm or hunting quad works for years before it is replaced. Honda lists its Rancher 4x4 with an automatic dual-clutch transmission, independent rear suspension and power steering at USD 8,999, against USD 7,349 for the basic 4x4, according to ATV.com. Yamaha builds every full-size ATV it sells worldwide at its Newnan, Georgia plant and refreshed the Grizzly and Kodiak lines in September 2025. BRP added Outlander MAX 6x6 trims for 2026 for buyers who haul heavy loads. Feature upgrades lift average prices faster than unit volumes, so utility ATV demand can add value even if North American retail stays near 255,000 units.
Leaner dealer stock and lower rates restart orders
Dealer inventory has been cut back, and cheaper credit makes it easier for dealers to restock and for buyers to finance. Polaris reported in its fiscal 2025 annual report that its North American off-road dealer inventory, excluding youth, fell about 9% in 2025 while industry retail rose slightly. BRP said its North American network inventory ended fiscal 2026 down 17%, according to Powersports Business. The Federal Reserve began cutting its target range in September 2025, and AgDirect told Farm Equipment that dealer floorplan rates should fall with it. Leaner stock means fewer clearance discounts, so shipments can track retail demand more closely through 2026 and 2027 and manufacturers can hold list prices.
Value models and new sourcing reshape U.S. quad lineups
Buyers shift toward value and midsize utility models
A shift toward smaller and cheaper quads is under way, as buyers who face higher prices on side-by-sides and large ATVs look for working machines below USD 8,000. The Motorcycle Industry Council reported that ATV retail sales fell 3.5% in 2025 and that buyers moved to smaller models, according to Powersports Business. Kawasaki launched an all-new Brute Force 450 in June 2024 and added an EPS version in January 2026, filling the gap between its 300 and 750 models. Polaris said its North American recreation retail, excluding youth, fell by a high-single-digit percentage in 2025. Midsize models carry lower unit prices, so makers need higher volume and tighter costs to keep margins in this band.
Supply chains shift away from Chinese components
Makers are moving sourcing away from China to limit tariff exposure, which is changing where U.S. quads and their parts are made. Polaris said China-linked material made up about 14% of its cost of goods at the end of 2025, down from 18% in 2024, and it aims for a low single-digit share by the end of 2027, according to Powersports Business. Polaris lists a 3.2 million square foot vehicle plant in Monterrey, Mexico and a 1.4 million square foot plant in Huntsville, Alabama, in its annual report, both inside the USMCA area. Chinese brands such as CFMOTO still import finished vehicles and so carry the full tariff on each unit. Suppliers with plants in the United States or in USMCA-qualified sites gain orders as this shift continues.
Electric quads open quiet work and hunting uses
Battery-electric ATVs are an opening for makers that can match gasoline pulling power at a workable price. BRP fitted the Outlander Electric with an 8.9 kWh battery, a range of up to 50 miles and a towing rating of 1,830 pounds, which is more than its gasoline sibling, according to Electrek. Silent running matters to hunters and livestock farms, and no fuel deliveries are needed on farms with charging points. The Outlander Electric still lists well above comparable gasoline trims, as the pricing table shows, so early demand rests on buyers who value silent running more than purchase cost. Battery electric grows at 11.5% a year in the Credence Research model, so suppliers of batteries, motors and chargers gain a new buyer group.
Compliant youth quads gain as unsafe imports face recalls
Safety enforcement opens room for compliant youth ATVs, because parents and dealers move away from cheap online models that fail the federal standard. The CPSC warned consumers on Jan. 22, 2026, to stop using Nakto youth ATVs sold on Amazon for about USD 400, since they exceeded speed limits for riders aged six and older. Federal rules require every ATV to meet ANSI/SVIA 1-2017 and to be covered by a CPSC-approved action plan. Polaris, Kawasaki and Yamaha all list youth models with age bands and speed limiters. Youth ATVs grow at 6.5% a year, and dealers that pair sales with training gain repeat customers as children move up.
Injury risk, tariffs and side-by-sides weigh on quad volumes
Injury rates keep regulators and insurers watchful
Rider injuries remain the main reputational risk for the category. The CPSC estimated 100,400 emergency department-treated off-highway vehicle injuries in 2023, and 27% involved children under 16. ATVs were linked to 1,728 of 2,577 reported off-highway vehicle deaths from 2019 to 2021. These figures shape liability costs, state age rules and parental decisions. Makers respond with speed limiters, training offers and age-graded models, but each serious incident can slow youth and household sales.
Tariffs raise costs on parts and imported vehicles
Trade costs rose sharply in 2025 and are hard to pass on fully. Polaris said tariffs cut its gross margin by USD 37 million in the fourth quarter of 2025 alone, according to Powersports Business. ATV.com reported in May 2025 that Chinese imports faced combined tariffs of 145% at one point and that Mexican goods outside USMCA rules faced 25%. Importers of Chinese quads and makers using Chinese parts carry the largest exposure. Buyers see higher list prices or fewer discounts until supply chains move.
Side-by-sides draw recreation and work buyers away
Side-by-side models keep taking buyers who once chose a quad, because they carry passengers and more cargo. Polaris estimated North American retail at about 525,000 side-by-side UTVs in 2025 against 255,000 ATVs, and ATV units fell from 270,000 in 2023. Families and older riders are the most likely to switch. ATV makers defend volume with lower prices, two-up touring models and work features that side-by-sides cannot match on narrow trails.
Lower farm income tightens equipment budgets
Farm budgets are tighter in 2026, which delays replacement of work quads on smaller operations. USDA's Economic Research Service forecast 2026 net farm income at USD 158.4 billion in September 2026, down 2.6% from 2025 in nominal terms and by more after inflation. Livestock and row-crop farms that face lower margins often keep a quad running for another season. Spending on farm tractors and other machinery competes for the same budget, so dealers lean on financing offers to close sales.
The South leads on farms while the West rides public land
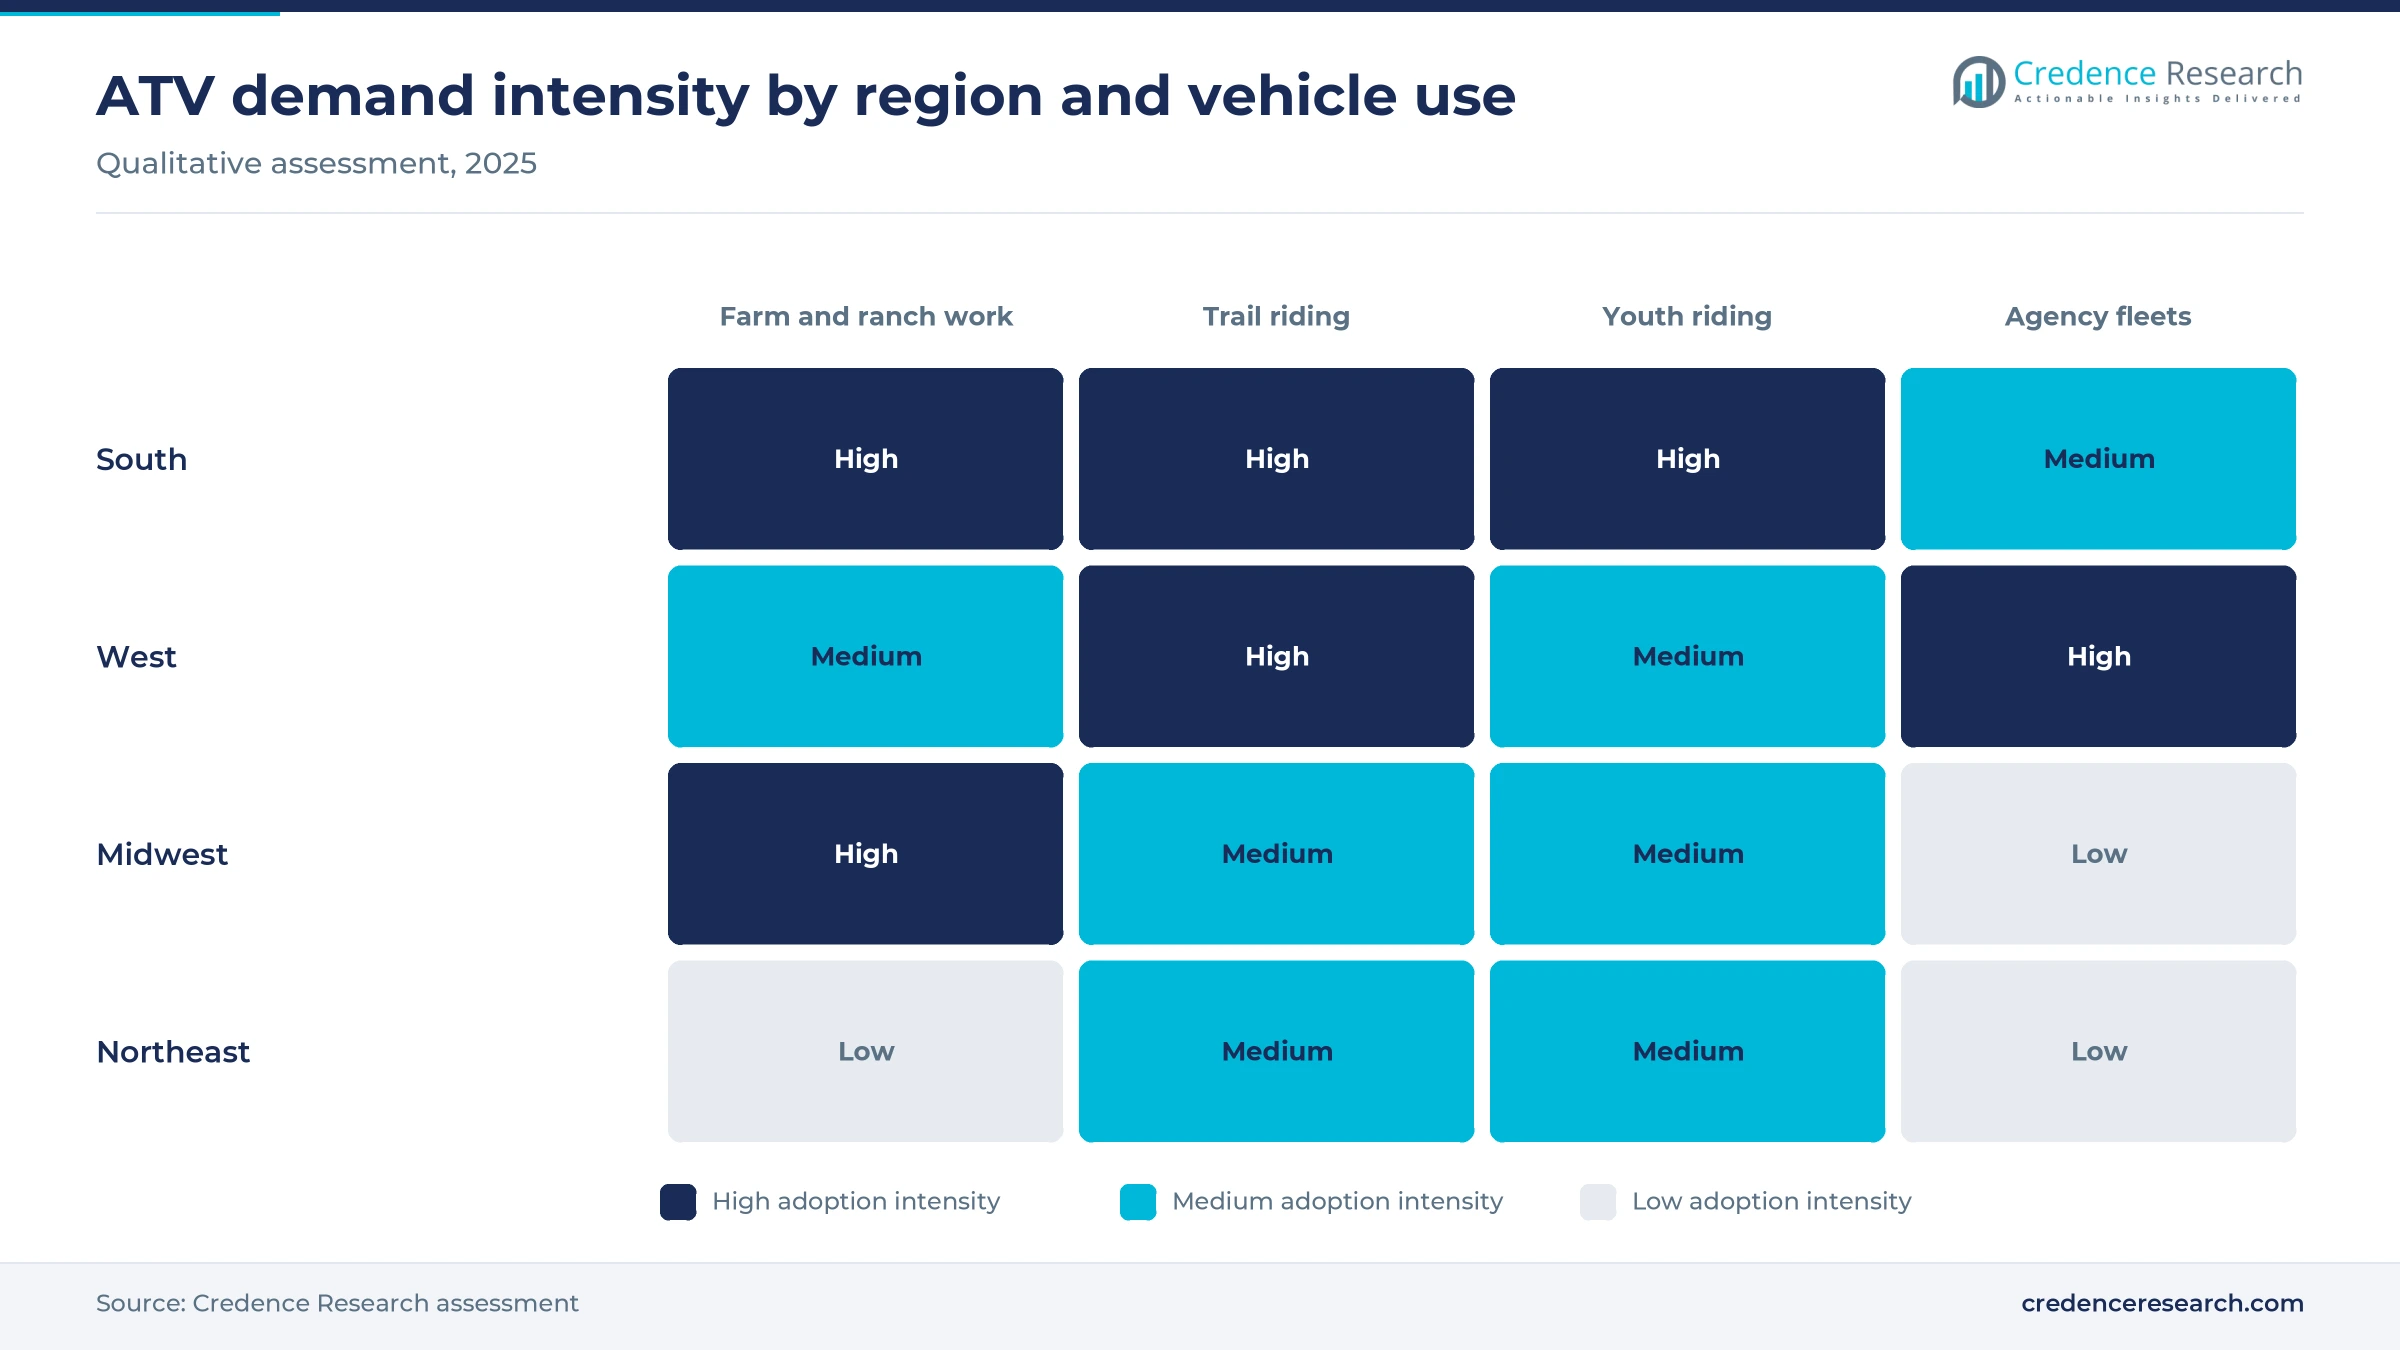
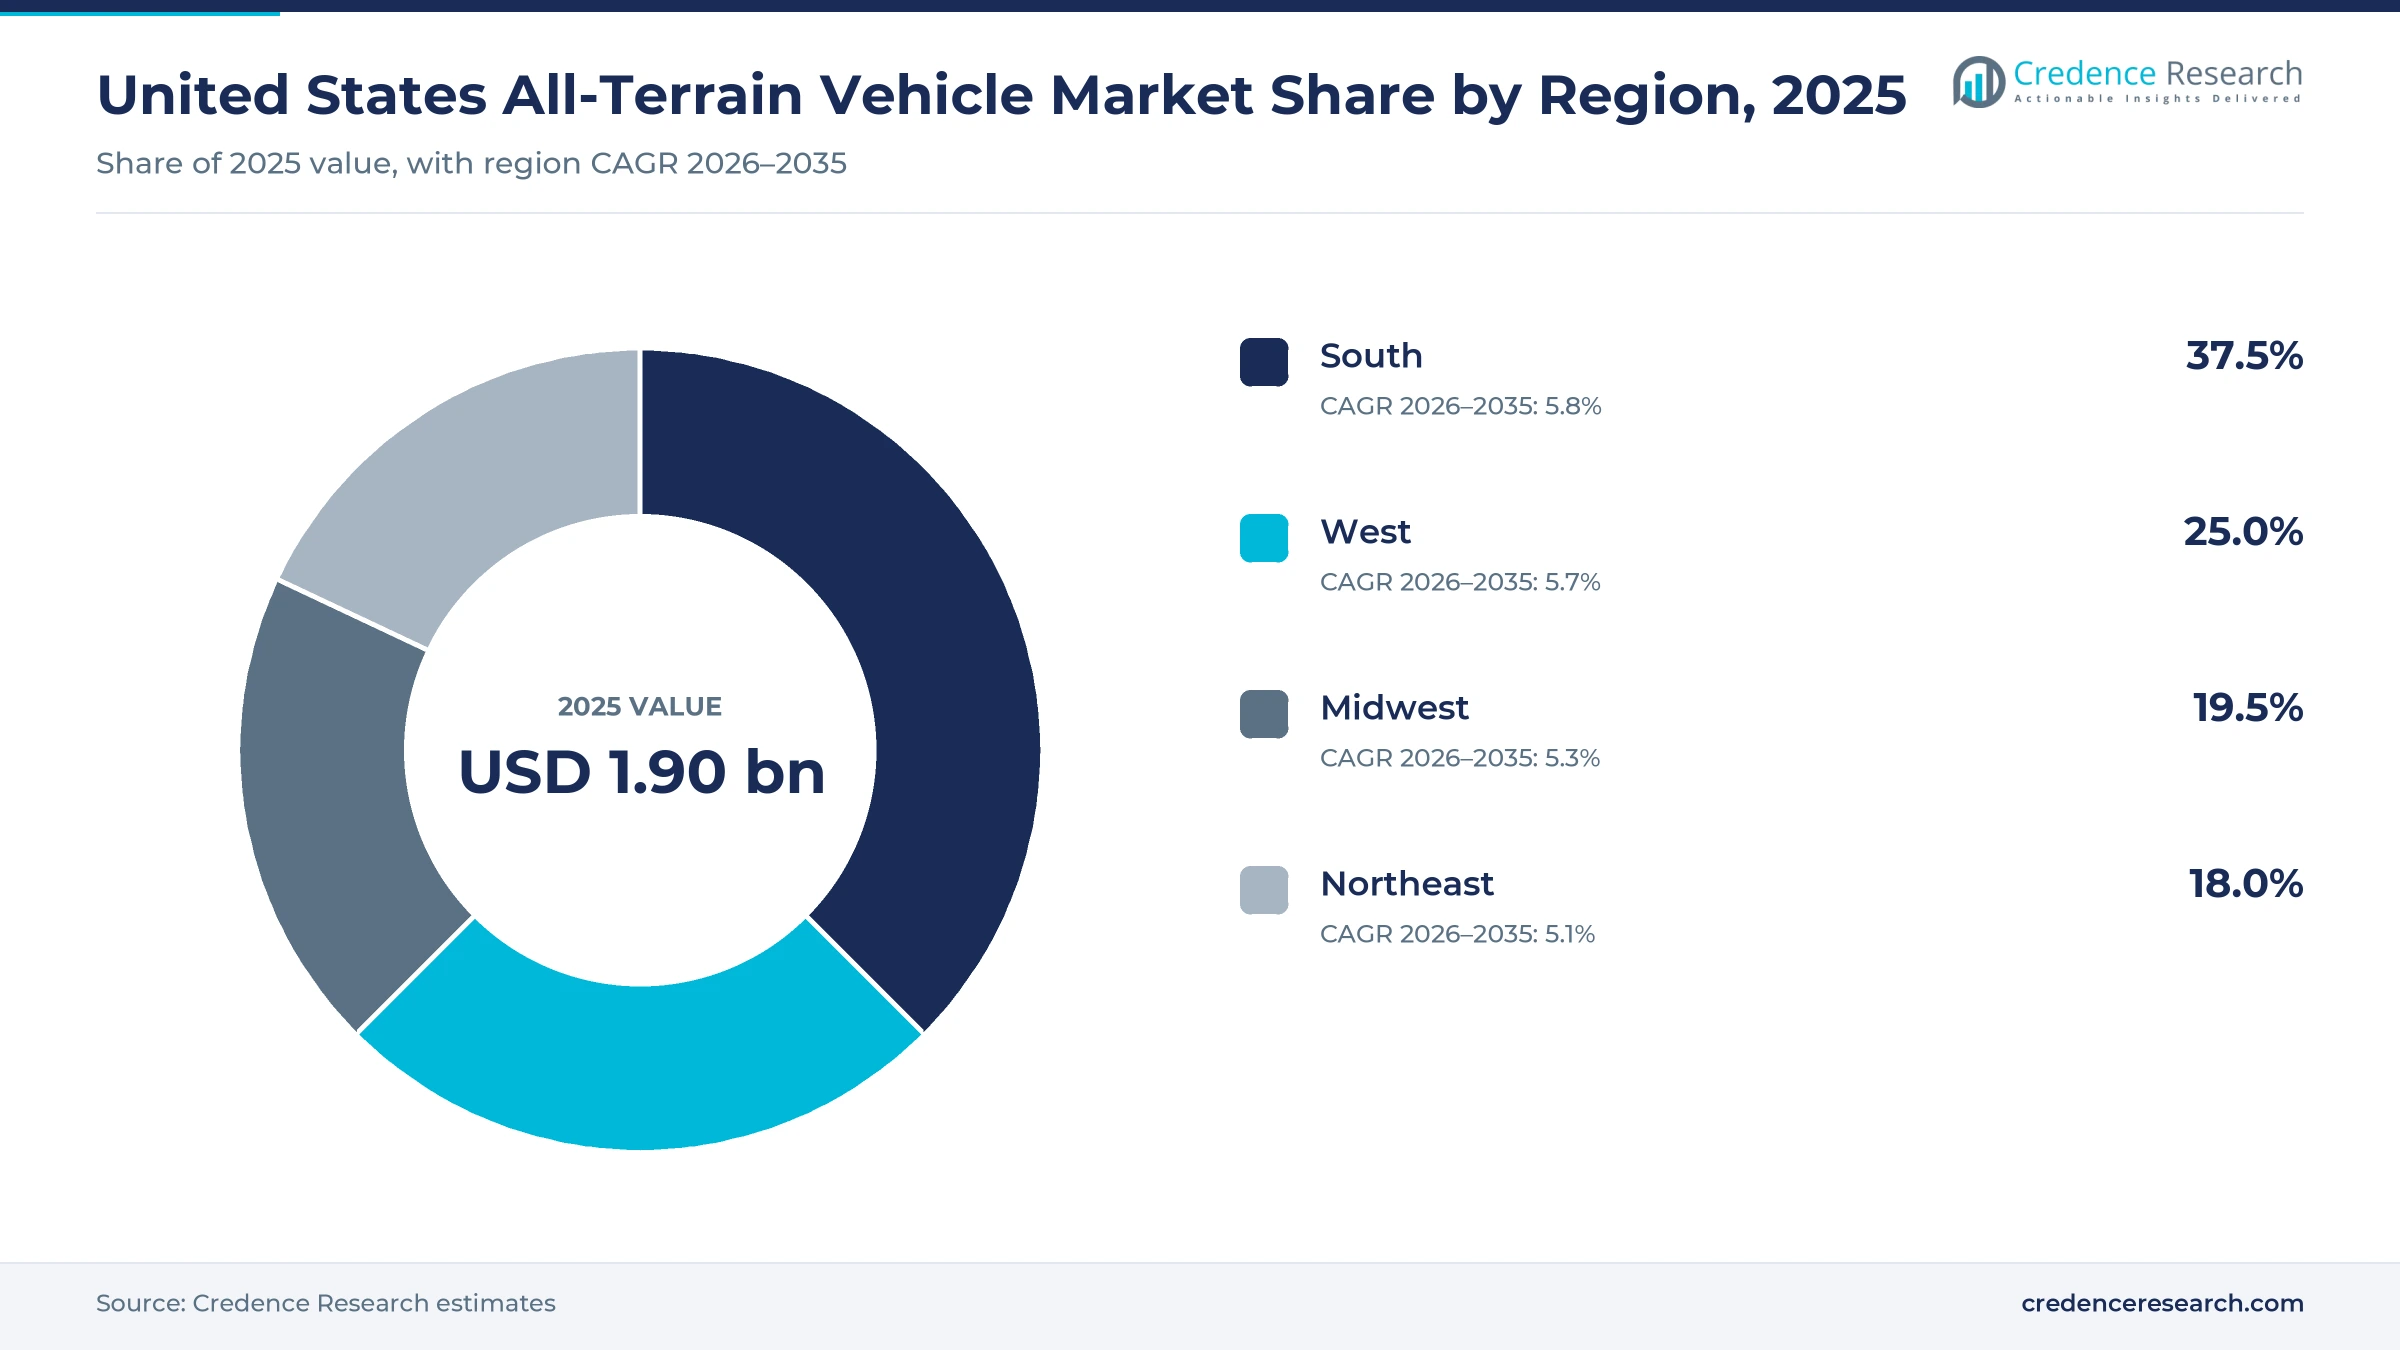
Regional demand follows farm counts, public riding land and the length of the riding season across the four Census regions. The West and the Midwest together accounted for 44.5% of 2025 demand, while the Northeast held the smallest share of the four.
| Region | Value, 2025 (USD billion) | Share, 2025 | CAGR, 2026–2035 |
|---|---|---|---|
| South | 0.71 | 37.5% | 5.8% |
| West | 0.48 | 25.0% | 5.7% |
| Midwest | 0.37 | 19.5% | 5.3% |
| Northeast | 0.34 | 18.0% | 5.1% |
South leads on farms, ranches and a long riding season
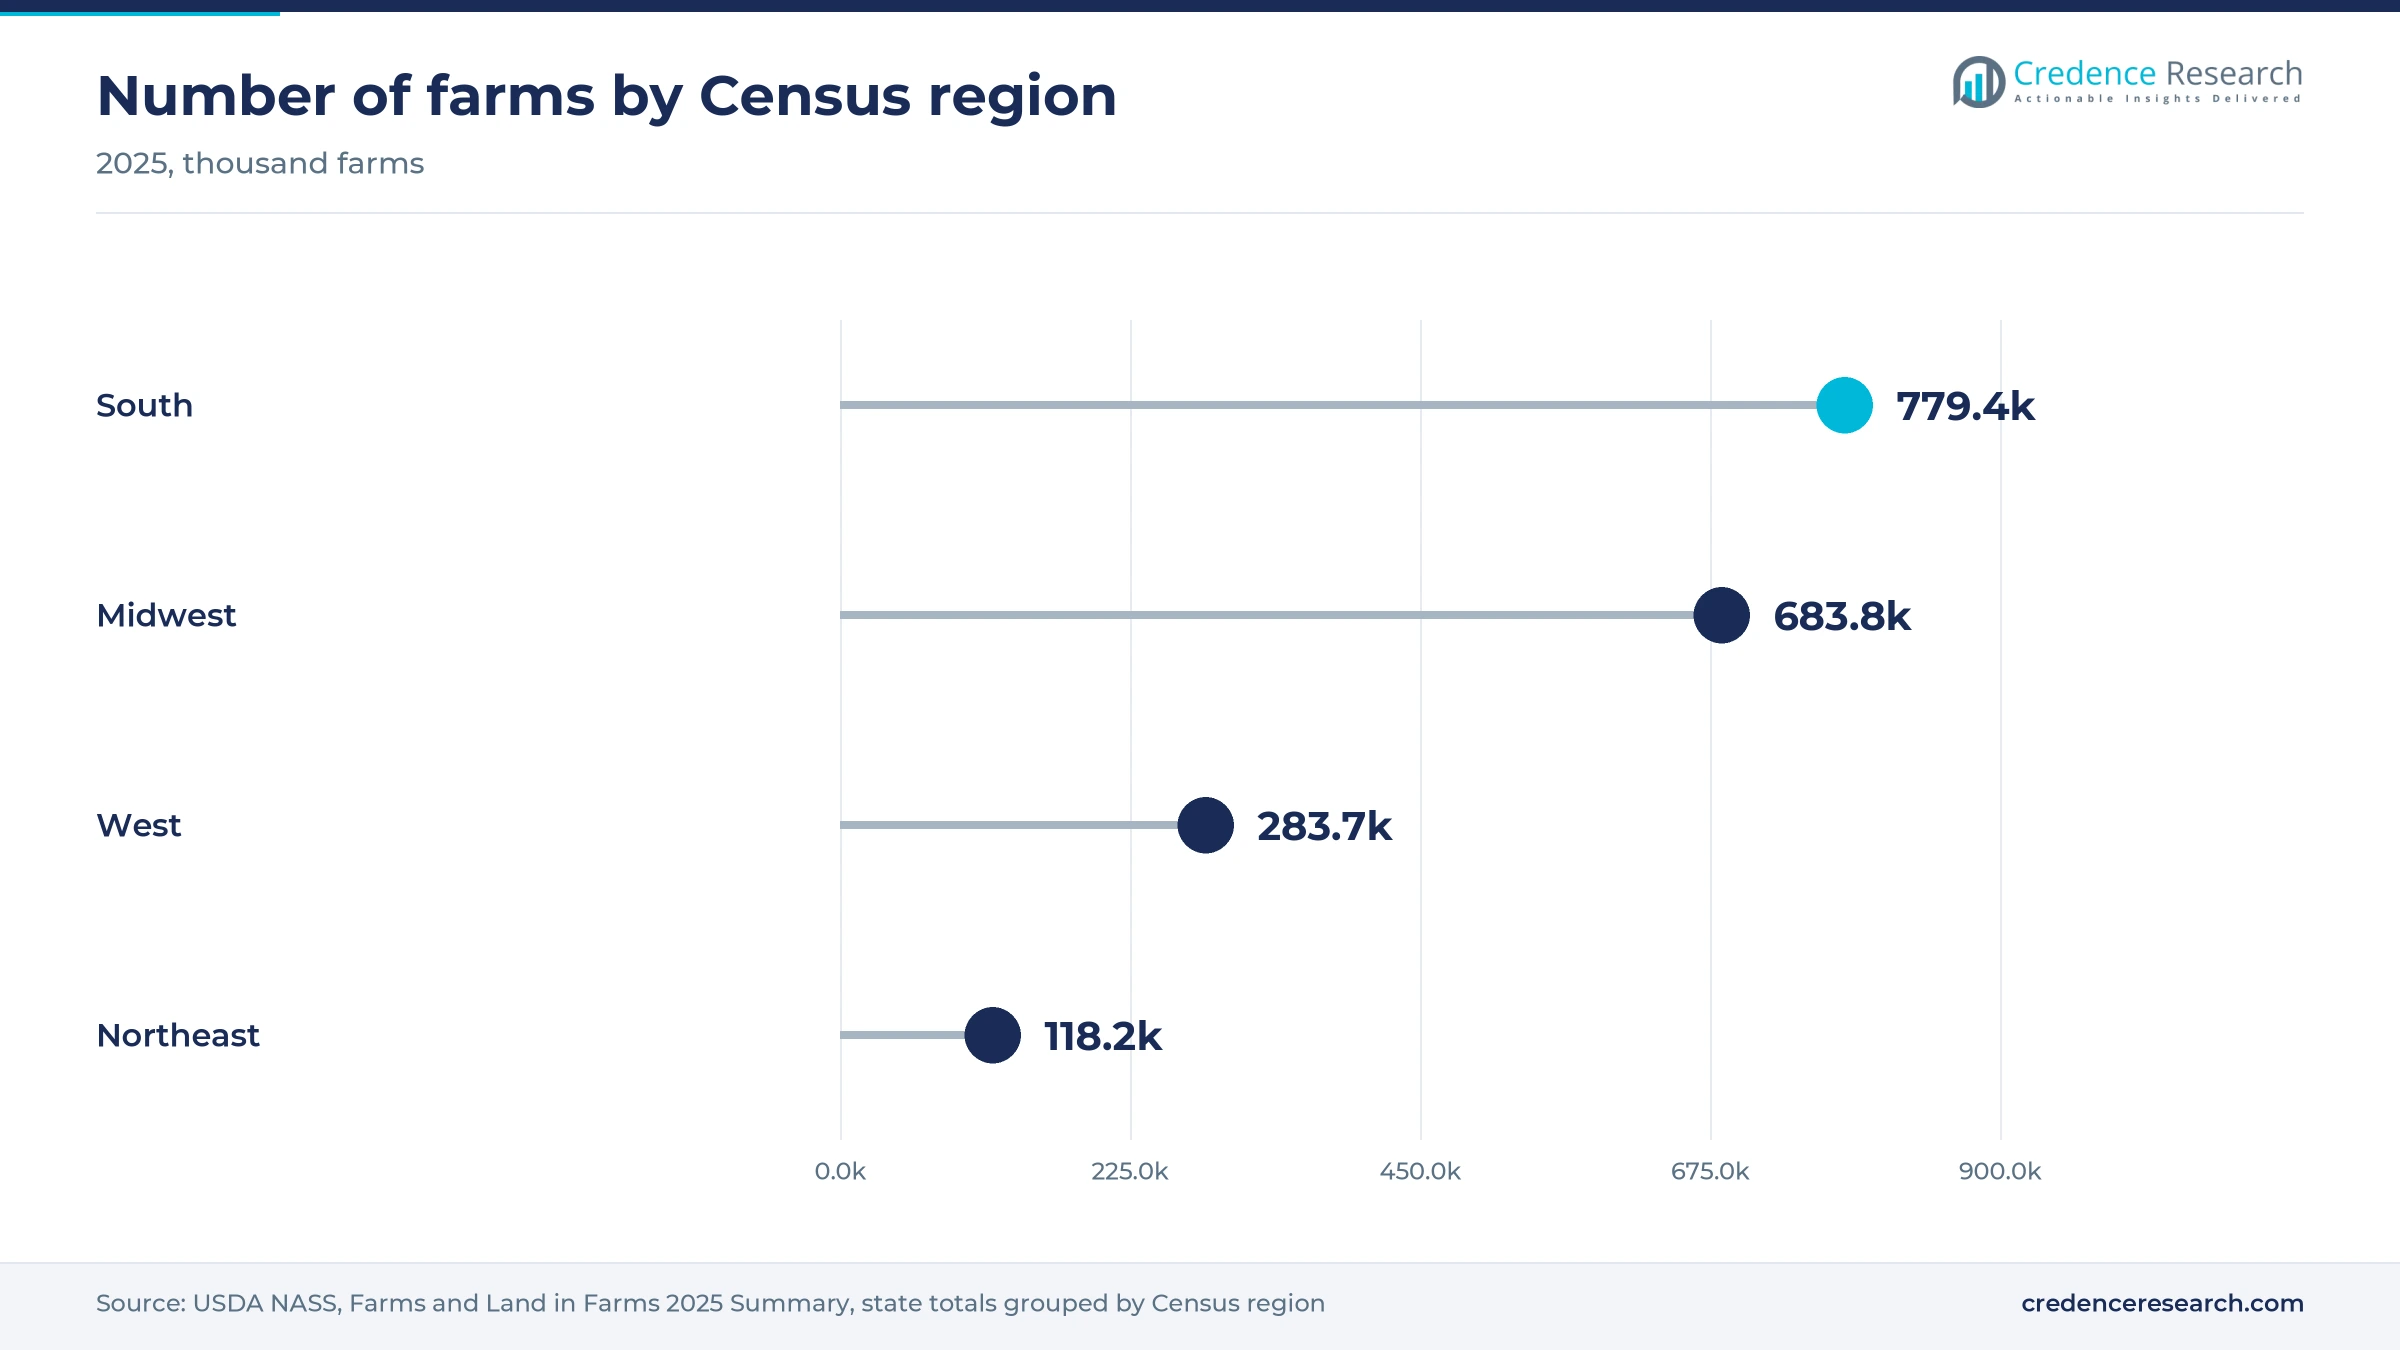
The South held 37.5% of 2025 value and grows fastest at 5.8% a year. It holds about 779,000 farms, with Texas alone counting 229,000 in 2025 according to USDA, so ranch and hunting demand is the deepest in the country. Warm weather allows riding for most of the year, and Honda and Yamaha both build ATVs in the region, in North Carolina and Georgia. Dealers in Texas, Tennessee and Kentucky sell the widest mix of utility and youth models, and that breadth keeps the South ahead through 2035.
West grows on public land trails and permits
The West held 25.0% of 2025 value and grows at 5.7% a year. Large federal and state land holdings give riders long trail networks, and Utah's OHV program shows the scale of that activity through registrations and grant spending. Ranches in Montana, Wyoming and New Mexico are large, so each operation often runs several quads. Agencies in the region also buy ATVs for trail maintenance, fire and search work, adding fleet orders on top of household demand.
Midwest relies on row-crop farms and hunters
The Midwest held 19.5% of 2025 value and grows at 5.3% a year. It counted about 684,000 farms in 2025, led by Iowa and Missouri, but many large grain farms now use side-by-sides and pickups for field work. Hunters and rural homeowners in Wisconsin, Minnesota and Michigan remain steady ATV buyers, and the region hosts Polaris and the halted Arctic Cat plants. Slower farm income growth keeps the region below the national pace.
Northeast stays smaller on limited farm and trail land
The Northeast held 18.0% of 2025 value and grows at 5.1% a year, the slowest of the four regions. It counted only about 118,000 farms in 2025, and dense settlement limits open riding land. Demand comes from rural property owners, maple and dairy farms and club trail systems in Pennsylvania, New York, Maine and Vermont. A shorter season and strict local rules on riding keep growth modest, though replacement demand stays reliable.
Lineup refreshes and a halted rival marked 2024 to 2026
| Development | Status and market relevance |
|---|---|
| In December 2024, Textron suspended production indefinitely at Arctic Cat's Thief River Falls and St. Cloud plants in Minnesota and said it was seeking strategic alternatives for the business. | Removes a full-line supplier from new production and shifts dealers toward other brands |
| In September 2025, Yamaha announced its 2026 ATV lineup of Grizzly, Kodiak, Raptor, YFZ450R and three youth models, all full-size units built in Newnan, Georgia. | Keeps a U.S.-built utility range in front of farm and hunting buyers |
| In September 2025, CFMOTO revealed its 2026 lineup of seven CFORCE ATVs, from the CFORCE 400 to the CFORCE 1000 Overland, through more than 700 U.S. dealer locations. | Widens value-priced competition in mid and premium utility trims |
| In June 2026, Kawasaki announced its 2027 Brute Force ATV lineup together with the KFX90 and KFX50 youth models. | Sustains entry utility and youth supply from a Japanese full-line maker |
Automatic gearboxes and batteries reshape work quads
- Dual-clutch automatic transmissions let farm and trail riders shift without a clutch lever, which helps newer and older riders on steep or muddy ground.
- Electric power steering reduces rider fatigue on long work days and has become a standard step up in most utility lineups.
- Battery-electric powertrains deliver instant torque and silent running, which suits hunting and livestock work near animals.
- Independent rear suspension improves ride comfort and ground clearance on rough fields and trails, and it now appears on mid-priced utility models.
Need a Custom Version of This Report?
Tailor the scope, geography, or segments to your exact requirements.
- Custom geography or segment scope
- Direct access to our analyst team
Five full-line makers face value brands from China
Competition in the United States is led by full-line makers that compete on dealer reach, durability records and feature-rich trims rather than on base price alone. Polaris sells its Sportsman line through the largest dealer network, while Honda relies on a reputation for reliability on farms and ranches. BRP pushes premium Outlander trims and the brand's first electric model. Yamaha and Kawasaki defend utility and youth niches with U.S.-built or long-running platforms. In the U.S. all-terrain vehicle market, CFMOTO and other Chinese brands win price-focused buyers with larger engines per dollar, and their growth forces incumbents to add value trims. The halt at Arctic Cat shows that scale matters, since a maker without enough volume struggles to fund new models and keep dealers loyal. Golf carts and neighborhood electric carts compete only at the margins, in gated communities and on resort land.
How is the U.S. ATV supply side organized?
Supply is concentrated among a few full-line makers that own plants, engines and dealer networks, with Polaris, Honda, BRP, Yamaha and Kawasaki holding most of the value. Each builds utility, sport and youth models and sells through franchised dealers that also stock its side-by-sides, so newcomers face a high cost of entry. Chinese brands such as CFMOTO and HISUN compete on price and features, using their own dealer networks and multi-line stores. Margins sit with premium trims, accessories and financing, while entry models carry thin margins that tariffs can erase.
Key players in the United States ATV market
| Company | Type | Role in the market |
|---|---|---|
| Polaris Inc. | U.S. full-line maker | Sportsman utility and youth ATVs, Sportsman MV defense models; sells through about 1,300 North American off-road dealers |
| BRP Inc. | Canadian full-line maker | Can-Am Outlander gasoline, MAX 6x6 and Outlander Electric models |
| Honda Motor Co., Ltd. | Japanese full-line maker | FourTrax Rancher, Foreman and Rubicon utility ATVs built in North Carolina |
| Yamaha Motor Co., Ltd. | Japanese full-line maker | Grizzly and Kodiak utility, Raptor and YFZ450R sport ATVs built in Georgia |
| Kawasaki Motors Corp., U.S.A. | Japanese full-line maker | Brute Force utility ATVs and KFX youth models |
| Zhejiang CFMOTO Power Co., Ltd. | Chinese value challenger | Value-priced CFORCE 400 to 1000 utility and touring ATVs |
| Arctic Cat | Textron unit, production halted | ATV, side-by-side and snowmobile brand with new production paused |
Replacement buying, not new riders, sets the growth pace
Credence Research's view is that U.S. ATV demand will grow mainly through replacement buying and richer trims rather than through new riders. Unit volumes have drifted lower as side-by-sides take recreation buyers, yet farm, hunting and agency demand for a narrow, affordable machine remains firm. The winners will be makers that keep entry utility prices below USD 8,000 despite tariffs, while adding automatic transmissions, power steering and electric options higher up. Dealers that sell training, accessories and financing alongside each quad will hold margins best.
Unit retail data and list prices anchor the estimate
The report uses 2025 as the base year and forecasts values for 2026 to 2035. Market values come from the Credence Research model, which combines industry unit retail estimates published in manufacturer filings with list prices by model tier. Regional, segment and channel splits are Credence Research estimates built from USDA farm counts, state off-highway vehicle registration data and company product releases. Sources include federal statistics, regulator reports, company filings, investor material and trade press. No interviews or surveys were used to build this estimate.
A steady utility base with electric and youth upside
The United States all-terrain vehicle market is expected to reach USD 3.27 billion by 2035, growing at a 5.56% CAGR over 2026–2035. Utility models will keep the largest share because farms, ranches and rural households still need a narrow work machine. Youth and electric models will grow faster from smaller bases, helped by safety enforcement against noncompliant imports and by falling battery costs. The South will stay the largest region, while the West gains from public land trail funding. Tariff policy and farm income remain the two factors most likely to move growth away from the base path.
Tariffs, farm income and electric costs set the range
The outcome to 2035 depends mainly on trade costs, farm budgets and how fast electric models reach price parity. Lasting high tariffs and weaker farm income would cut replacement purchases and push buyers to used quads. The base case assumes steady replacement and modest price growth. Faster battery cost declines and wider trail funding would lift electric and household demand above the base path.
| Scenario | CAGR, 2026–2035 | Value, 2035 | What has to hold |
|---|---|---|---|
| Downside | 4.1% | USD 2.89 billion | High tariffs persist and farm income falls, delaying replacement of work quads |
| Base | 5.56% | USD 3.27 billion | Replacement demand holds and list prices rise modestly with new features |
| Upside | 7.1% | USD 3.73 billion | Battery costs fall quickly and states expand trail funding and agency fleets |
Frequently Asked Questions
How big is the United States all-terrain vehicle market?
Which vehicle type leads U.S. ATV sales?
Which region leads the United States ATV market?
How are electric ATVs changing the market?
Why are ATV unit sales under pressure?
What do U.S. buyers pay for a new ATV?
Who are the leading ATV makers in the United States?
What federal rules apply to ATVs sold in the United States?
Table of Content
Chapter 1 Market Segmentation
- 1.1 Segmentation Framework
- 1.1.1 Product and Service Classification
- 1.1.2 Application and End-Use Classification
- 1.1.3 Technology and Solution Classification
- 1.1.4 Customer and Distribution Channel Classification
- 1.1.5 Geographic Segmentation
- 1.1.6 Market Segment Definitions and Boundaries
- 1.2 By Vehicle Type
- 1.2.1 Utility ATVs
- 1.2.2 Sport ATVs
- 1.2.3 Youth ATVs
- 1.2.4 Tactical ATVs
- 1.3 By Powertrain
- 1.3.1 Gasoline 4WD
- 1.3.2 Gasoline 2WD
- 1.3.3 Battery electric
- 1.4 By Customer Type
- 1.4.1 Household buyers
- 1.4.2 Farm and ranch businesses
- 1.4.3 Public agencies
- 1.5 By Sales Channel
- 1.5.1 Franchise dealers
- 1.5.2 Independent new-vehicle dealers
- 1.5.3 Direct fleet procurement
Chapter 2 Introduction
- 2.1 Report Objectives and Scope
- 2.2 Product Definition and Industry Terminology
- 2.3 Market Inclusions and Exclusions
- 2.4 Research Process
- 2.4.1 Primary Research and Expert Interviews
- 2.4.2 Secondary Research and Source Review
- 2.4.3 Top-Down and Bottom-Up Estimation
- 2.4.4 Data Triangulation and Verification
- 2.5 Market Size Measurement Basis
- 2.5.1 2025: USD 1.90 billion → 2035: USD 3.27 billion
- 2.6 Historical and Forecast Reference Periods
- 2.6.1 Historical Period: 2018-2025
- 2.6.2 Base Year: 2025
- 2.6.3 Forecast Period: 2025-2035
- 2.7 Research Assumptions and Limitations
Chapter 3 Executive Summary
- 3.1 Market Snapshot and Key Findings
- 3.2 Base-Year Market Size, 2025
- 3.3 Forecast Market Size, 2035
- 3.4 Revenue and Volume Growth Outlook
- 3.5 Key Demand and Supply Indicators
- 3.6 Leading Market Segments
- 3.7 Fastest-Growing Market Opportunities
- 3.8 Regional Performance Highlights
- 3.9 Technology and Industry Transformation
- 3.10 Competitive Landscape Summary
- 3.11 Analyst View and Strategic Implications
Chapter 4 United States All-Terrain Vehicle Market Trends and Developments
- 4.1 Historical Industry Development, 2018-2025
- 4.2 Recent Market Trends and Developments
- 4.3 Demand and Customer Behavior Trends
- 4.4 Technology and Product Innovation
- 4.5 Artificial Intelligence, Automation and Digitalization
- 4.6 Local Manufacturing and Supply Chain Realignment
- 4.7 Industry Partnerships, Mergers and Acquisitions
- 4.8 Sustainability and Circular Economy Developments
- 4.9 Government and Private Sector Investment Trends
- 4.10 Emerging Business Models and Commercialization
- 4.11 Industry Developments and Announcements
Chapter 5 United States All-Terrain Vehicle Market Production, Supply and Demand Analysis
- 5.1 Demand Trend and Consumption Analysis, 2018-2025
- 5.2 Demand Forecast, 2025-2035
- 5.3 Production and Output Trend, 2018-2025
- 5.4 Production and Output Forecast, 2025-2035
- 5.5 Installed Capacity and Capacity Utilization
- 5.6 Company-Wise Production Plants and Statistics
- 5.6.1 Installed Production Capacity
- 5.6.2 Actual Production
- 5.6.3 Planned Capacity and Expansion Targets
- 5.7 Supply Chain Structure and Procurement Trends
- 5.8 Supply-Demand Gap and Bottlenecks
- 5.9 Import Dependence and Sourcing Structure
- 5.10 Contract Manufacturing and Outsourcing
- 5.11 Regional Supply and Demand Concentration
Chapter 6 United States All-Terrain Vehicle Market Pricing Analysis
- 6.1 Pricing Structure and Measurement
- 6.2 Historical Pricing Trends, 2018-2025
- 6.3 Pricing Outlook, 2025-2035
- 6.4 Average Selling Price and Unit Economics
- 6.5 Pricing by Product and Market Segment
- 6.6 Geographic Pricing Differences
- 6.7 Key Input, Energy, Labor and Logistics Costs
- 6.8 Contract Pricing and Purchasing Models
- 6.9 Pricing Sensitivity and Competitive Positioning
- 6.10 Price, Margin and Profitability Implications
Chapter 7 United States All-Terrain Vehicle Market Dynamics
- 7.1 Market Growth Drivers
- 7.1.1 Demand-Side Drivers
- 7.1.2 Technology and Innovation Drivers
- 7.1.3 Infrastructure and Investment Drivers
- 7.1.4 Regulatory and Policy Drivers
- 7.2 Market Restraints
- 7.2.1 Cost and Affordability Constraints
- 7.2.2 Technology and Adoption Barriers
- 7.2.3 Supply Chain and Operational Constraints
- 7.3 Market Challenges
- 7.3.1 Competitive Pressure and Margin Erosion
- 7.3.2 Skills, Infrastructure and Implementation Gaps
- 7.4 Emerging Market Opportunities
- 7.5 Market Dynamics Impact and Time-Horizon Assessment
Chapter 8 United States All-Terrain Vehicle Value Chain Analysis
- 8.1 Industry Value Chain Overview
- 8.2 Upstream Suppliers and Critical Inputs
- 8.3 Technology and Component Providers
- 8.4 Manufacturing or Service Delivery
- 8.5 Distribution, Channel Partners and Integrators
- 8.6 Downstream Applications and End Users
- 8.7 Value Addition and Profit Pools
- 8.8 Vertical Integration and Outsourcing
- 8.9 Supplier Concentration and Risk
- 8.10 Supply Chain Localization and Resilience
Chapter 9 United States All-Terrain Vehicle Market Regulations and Policies
- 9.1 Relevant Laws, Standards and Compliance Frameworks
- 9.2 Product, Service, Safety and Quality Requirements
- 9.3 Government Policies, Incentives and Subsidies
- 9.4 Imports, Exports and Trade Barriers
- 9.5 Public Procurement and Local Content Requirements
- 9.6 Environmental and Sustainability Compliance
- 9.7 Upcoming Policy Changes and Market Implications
Chapter 10 United States All-Terrain Vehicle Market Hotspots and Opportunities
- 10.1 Market Opportunity Mapping and Growth Hotspots
- 10.2 High-Growth Applications and Customer Groups
- 10.3 Underserved Markets and White-Space Opportunities
- 10.4 Emerging Technology and Product Opportunities
- 10.5 New Capacity and Investment Hotspots
- 10.6 Market Entry and Expansion Opportunities
- 10.7 Distribution and Partnership Opportunities
- 10.8 Near-Term and Long-Term Commercial Potential
- 10.9 Opportunity Attractiveness and Execution Risks
Chapter 11 United States All-Terrain Vehicle Market Outlook, 2025-2035
- 11.1 Market Size and Analysis
- 11.1.1 Revenue (Market Measurement: 2025: USD 1.90 billion → 2035: USD 3.27 billion)
- 11.1.2 Market Volume and Quantity Sold
- 11.1.3 Historical Market Size, 2018-2025
- 11.1.4 Base-Year Market Size, 2025
- 11.2 Market Forecast, 2025-2035
- 11.2.1 Revenue Forecast to 2035
- 11.2.2 Volume Forecast to 2035
- 11.2.3 CAGR and Year-on-Year Growth
- 11.2.4 Incremental Revenue Opportunity
- 11.3 Forecast Assumptions and Scenario Analysis
- 11.3.1 Base-Case Forecast
- 11.3.2 Optimistic and Conservative Scenarios
- 11.3.3 Technology, Pricing and Policy Sensitivities
- 11.4 Market Attractiveness and Growth Outlook
Chapter 12 United States All-Terrain Vehicle Market Segmentation and Outlook
- 12.1 Segmentation Summary and Market Shares, 2025
- 12.2 Largest and Fastest-Growing Segments
- 12.3 By Vehicle Type - Market Size and Forecast, 2025-2035
- 12.3.1 Segment Definition and Scope
- 12.3.2 Historical Market Size, 2018-2025
- 12.3.3 Revenue Forecast, 2025-2035
- 12.3.4 Volume Forecast, 2025-2035
- 12.3.5 Base-Year Market Share, 2025
- 12.3.6 Segment CAGR and Growth Drivers
- 12.3.7 Subsegment Market Size and Forecast
- 12.3.7.1 Utility ATVs
- 12.3.7.2 Sport ATVs
- 12.3.7.3 Youth ATVs
- 12.3.7.4 Tactical ATVs
- 12.3.8 Subsegment Pricing and Adoption Trends
- 12.3.9 Leading Suppliers and Competition
- 12.3.10 Regional Demand and Opportunities
- 12.4 By Powertrain - Market Size and Forecast, 2025-2035
- 12.4.1 Segment Definition and Scope
- 12.4.2 Historical Market Size, 2018-2025
- 12.4.3 Revenue Forecast, 2025-2035
- 12.4.4 Volume Forecast, 2025-2035
- 12.4.5 Base-Year Market Share, 2025
- 12.4.6 Segment CAGR and Growth Drivers
- 12.4.7 Subsegment Market Size and Forecast
- 12.4.7.1 Gasoline 4WD
- 12.4.7.2 Gasoline 2WD
- 12.4.7.3 Battery electric
- 12.4.8 Subsegment Pricing and Adoption Trends
- 12.4.9 Leading Suppliers and Competition
- 12.4.10 Regional Demand and Opportunities
- 12.5 By Customer Type - Market Size and Forecast, 2025-2035
- 12.5.1 Segment Definition and Scope
- 12.5.2 Historical Market Size, 2018-2025
- 12.5.3 Revenue Forecast, 2025-2035
- 12.5.4 Volume Forecast, 2025-2035
- 12.5.5 Base-Year Market Share, 2025
- 12.5.6 Segment CAGR and Growth Drivers
- 12.5.7 Subsegment Market Size and Forecast
- 12.5.7.1 Household buyers
- 12.5.7.2 Farm and ranch businesses
- 12.5.7.3 Public agencies
- 12.5.8 Subsegment Pricing and Adoption Trends
- 12.5.9 Leading Suppliers and Competition
- 12.5.10 Regional Demand and Opportunities
- 12.6 By Sales Channel - Market Size and Forecast, 2025-2035
- 12.6.1 Segment Definition and Scope
- 12.6.2 Historical Market Size, 2018-2025
- 12.6.3 Revenue Forecast, 2025-2035
- 12.6.4 Volume Forecast, 2025-2035
- 12.6.5 Base-Year Market Share, 2025
- 12.6.6 Segment CAGR and Growth Drivers
- 12.6.7 Subsegment Market Size and Forecast
- 12.6.7.1 Franchise dealers
- 12.6.7.2 Independent new-vehicle dealers
- 12.6.7.3 Direct fleet procurement
- 12.6.8 Subsegment Pricing and Adoption Trends
- 12.6.9 Leading Suppliers and Competition
- 12.6.10 Regional Demand and Opportunities
- 12.7 Segment Growth Comparison
- 12.8 Segment Attractiveness and Priority Matrix
Chapter 13 United States All-Terrain Vehicle End-Use and Application Market Outlook
- 13.1 End-Use Industry and Customer Demand Structure
- 13.2 Leading Applications and Customer Groups
- 13.3 End-Use Market Size, Share and Forecast
- 13.4 Major End-Use Industry Deep Dives
- 13.4.1 Customer Requirements and Use Cases
- 13.4.2 Demand and Replacement Cycles
- 13.4.3 Technical and Regulatory Considerations
- 13.4.4 Purchasing and Procurement Models
- 13.4.5 Leading Vendors and Distribution Channels
- 13.4.6 Forecast and Commercial Opportunities
- 13.5 Emerging Applications and Cross-Segment Demand
- 13.6 End-Use Industry Investment Priorities
Chapter 14 United States All-Terrain Vehicle Geographic Market Outlook, 2025-2035
- 14.1 Domestic Market Distribution and Demand Clusters
- 14.2 State- or Province-Wise Market Size and Forecast, 2025-2035
- 14.3 City and Metropolitan Market Outlook
- 14.4 Industrial, Manufacturing and Commercial Clusters
- 14.5 Geographic Concentration of Key End Users
- 14.6 Local Pricing and Purchasing Differences
- 14.7 Domestic Production Facilities and Capacity Map
- 14.8 Local Infrastructure and Project Pipeline
- 14.9 State-Level Policy and Incentive Differences
- 14.10 Subnational Investment Hotspots and Opportunities
- 14.11 Distribution and Logistics Networks
- 14.12 Domestic Competitive Footprint
Chapter 15 United States All-Terrain Vehicle Technology, Innovation and Sustainability Outlook
- 15.1 Technology Landscape and Maturity
- 15.2 Product, Process and Service Innovation
- 15.3 AI, Automation and Digital Tools in the Industry
- 15.4 Technology Adoption and Performance Benchmarking
- 15.5 Innovation Pipeline and R&D Investment
- 15.6 Patent and Intellectual Property Trends
- 15.7 Energy Efficiency and Resource Management
- 15.8 Sustainability, Recycling and Circularity
- 15.9 Technology Roadmap, 2025-2035
- 15.10 Risks of Obsolescence and Technology Substitution
Chapter 16 United States All-Terrain Vehicle Market Key Strategic Imperatives
- 16.1 Growth and Market Entry Priorities
- 16.2 High-Return Products and Segments
- 16.3 Pricing, Profitability and Cost Optimization
- 16.4 Technology Investment and Product Differentiation
- 16.5 Supply Chain Localization and Resilience
- 16.6 Distribution and Customer Acquisition
- 16.7 Partnership, Acquisition and Capacity Strategy
- 16.8 Regional Expansion Priorities
- 16.9 Short-, Medium- and Long-Term Actions
Chapter 17 Competition Outlook
- 17.1 Industry Competition Characteristics
- 17.2 Market Structure and Concentration
- 17.3 Market Share and Competitive Positioning, 2025
- 17.4 Company-Wise Revenue and Product Benchmarking
- 17.5 Production and Service Capacity Benchmarking
- 17.6 Technology, Pricing and Differentiation
- 17.7 Regional Footprint and Distribution Strength
- 17.8 Mergers, Acquisitions and Strategic Alliances
- 17.9 New Entrants and Competitive Threats
- 17.10 Porter's Five Forces and Industry Attractiveness
- 17.11 Competitive Outlook, 2025-2035
Chapter 18 Company Profiles
- 18.1 Company Coverage and Selection Criteria
- 18.2 Polaris Inc.
- 18.2.1 Business Description
- 18.2.2 Company Ownership and Geographic Presence
- 18.2.3 Product and Service Portfolio
- 18.2.4 Manufacturing and Operating Footprint
- 18.2.5 Production Capacity and Expansion Plans
- 18.2.6 Financial Performance and Investment
- 18.2.7 Market Share and Competitive Position
- 18.2.8 Technology and Innovation Capabilities
- 18.2.9 Strategic Alliances or Partnerships
- 18.2.10 Recent Developments
- 18.2.11 Growth Strategy and Outlook
- 18.3 BRP Inc.
- 18.4 Honda Motor Co., Ltd.
- 18.5 Yamaha Motor Co., Ltd.
- 18.6 Kawasaki Motors Corp., U.S.A.
- 18.7 Zhejiang CFMOTO Power Co., Ltd.
- 18.8 Arctic Cat
- 18.9 Suzuki Motor Corporation
- 18.10 Kwang Yang Motor Co., Ltd.
- 18.11 HISUN Motors USA
- 18.12 Other Relevant Market Participants
Note: Every listed company is profiled on the structure shown under the first company. The company list is preliminary and may change based on research findings, market developments, data availability and client requirements.
Chapter 19 Disclaimer
- 19.1 Research and Forecast Disclaimer
- 19.2 Data Source and Estimation Limitations
Note: The depth of individual sections depends on data availability for this market. Volume, capacity, trade and other unit-based metrics are included where applicable.