Aging pedelec fleets turn packs into a repeat purchase
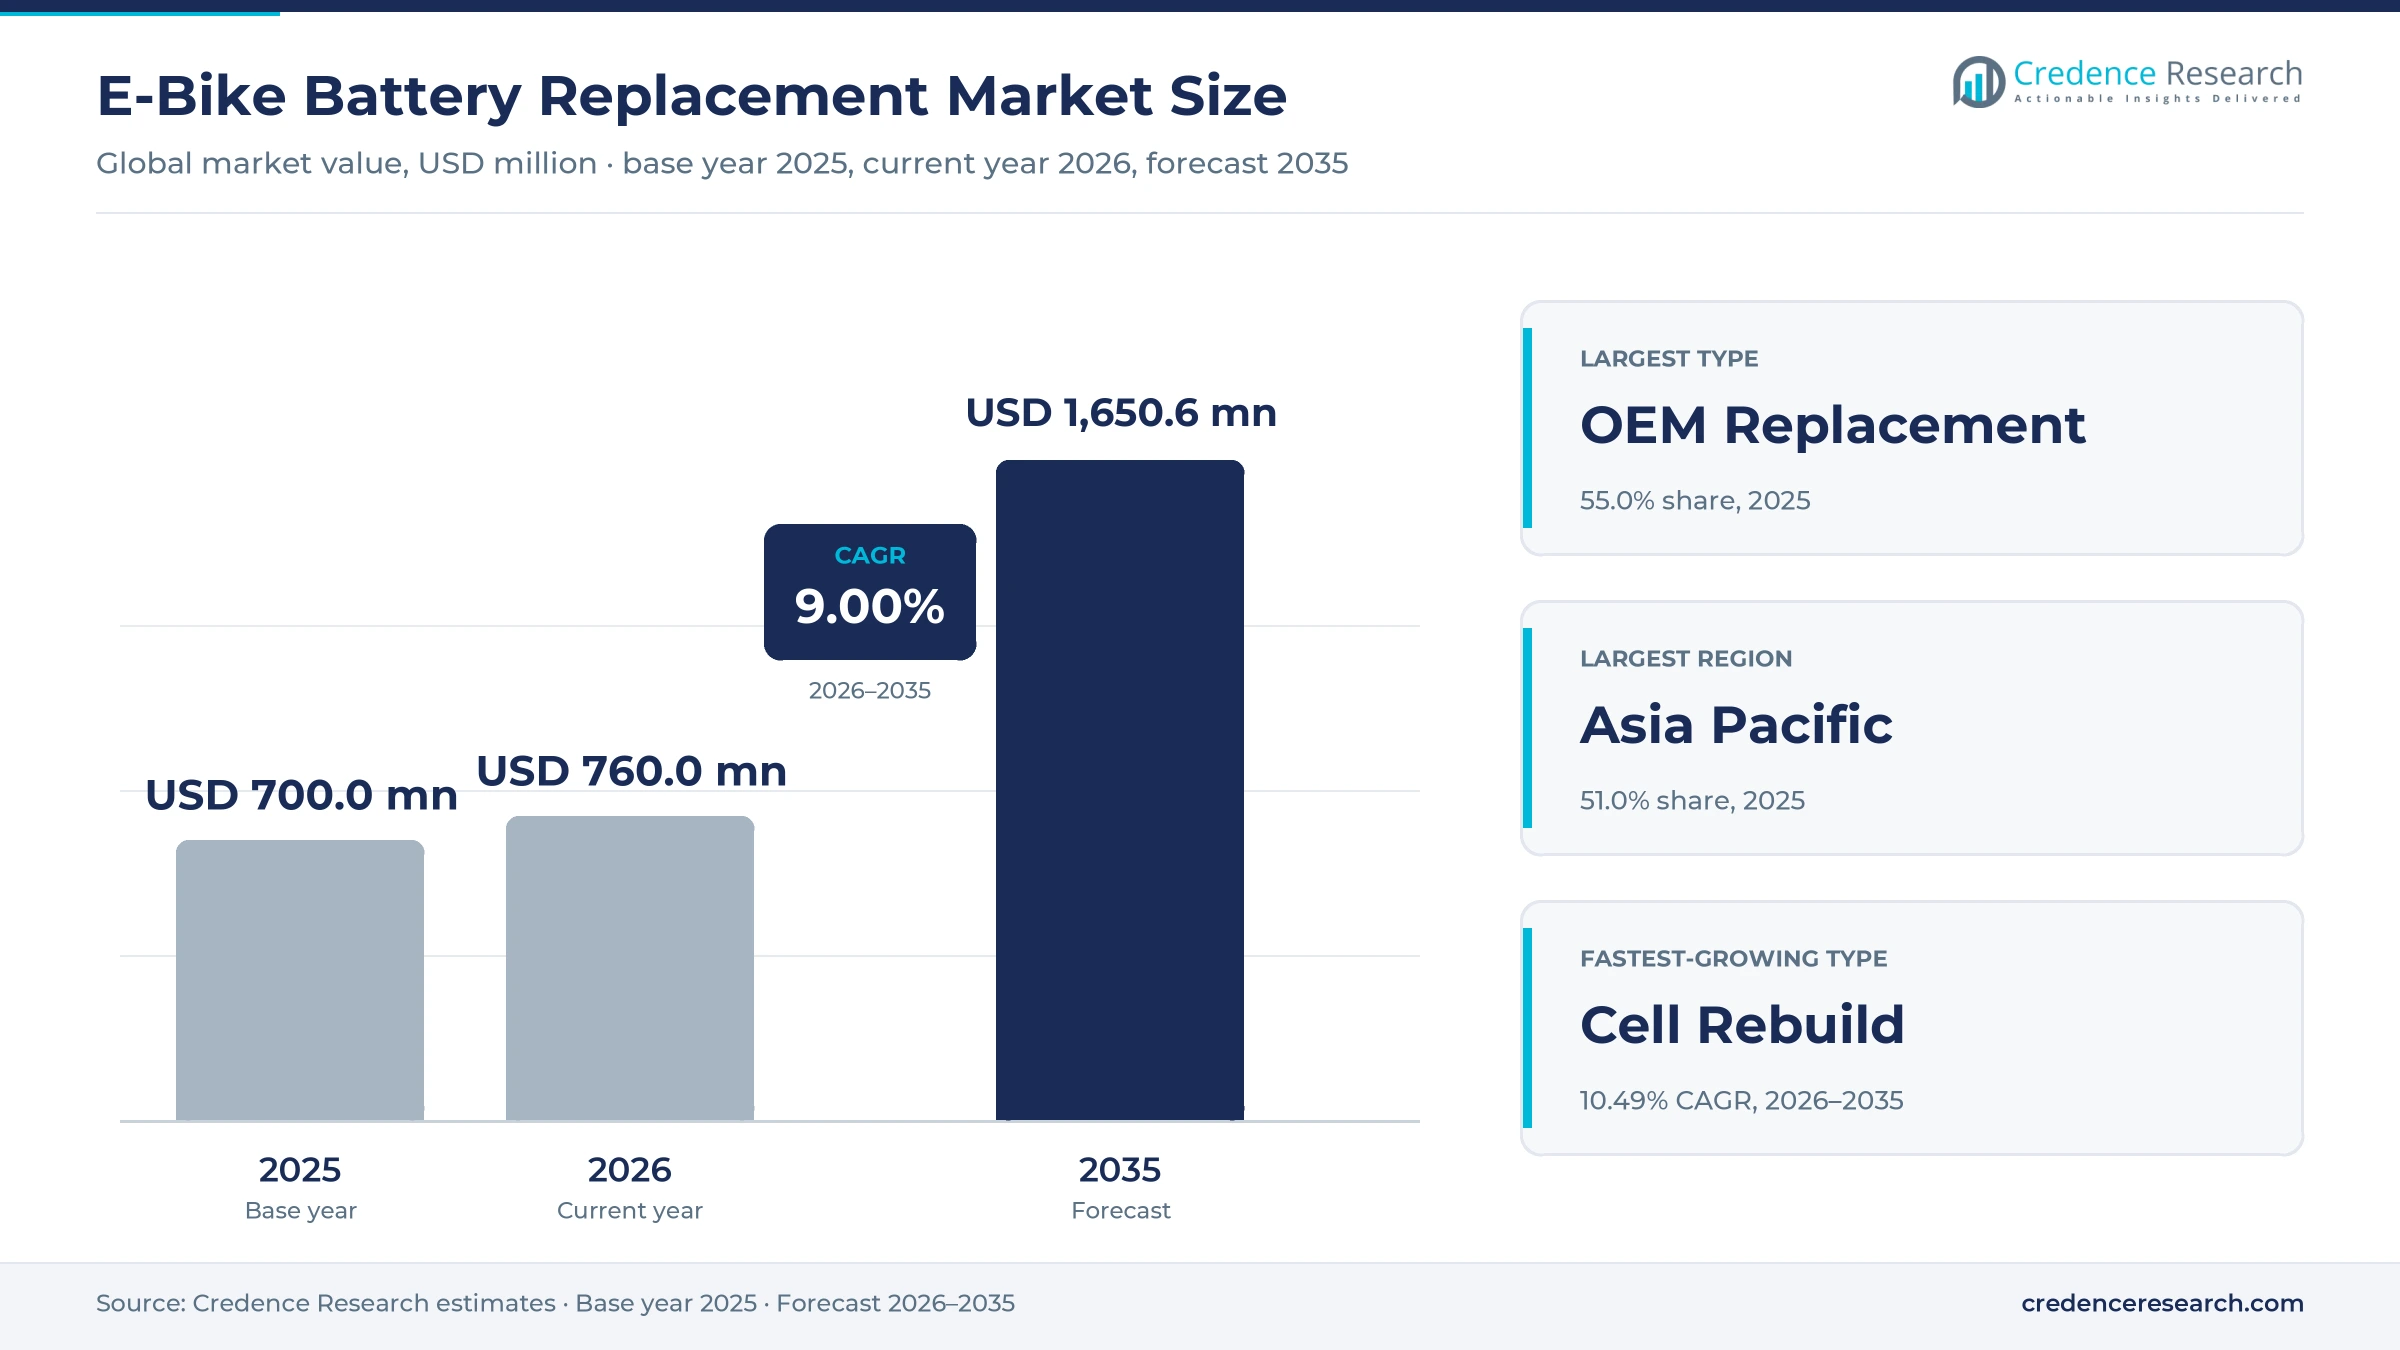
The global e-bike battery replacement market was valued at USD 700.0 million in 2025 and is projected to increase from USD 760.0 million in 2026 to USD 1.65 billion by 2035, registering a CAGR of 9.00% during 2026–2035. Spending comes from owners of aging pedal-assist bikes, delivery riders and fleet operators that buy new packs from drive-system brands, compatible packs from independent sellers or rebuilt packs with fresh cells from specialist workshops. Asia Pacific held the largest regional share, 51.0% in 2025, because China runs the largest electric bicycle fleet, with more than 350 million in use, and its trade-in program had retired about 2.4 million old e-bikes by March 2025, according to the Ministry of Commerce. Middle East & Africa is the fastest-growing region at 10.27% a year as Gulf delivery fleets electrify. A major regulatory change arrives on Feb. 18, 2027, when Article 11 of the EU Batteries Regulation starts to require that light means of transport batteries can be replaced by independent professionals. Pack capacity is also rising, which lifts the value of each replacement sale.
Which pack purchases and rebuild services are counted here?
The e-bike battery replacement market covers lithium-ion packs bought after the original sale of a pedal-assist or throttle electric bicycle, together with paid services that rebuild a worn pack with new cells. It includes branded packs from drive-system makers sold through dealers, compatible packs from independent brands and online sellers, and cell rebuild work billed by specialist workshops. Buyers include private riders, rental and sharing fleets and delivery operators.
The scope excludes packs fitted to new bikes at the factory, lead-acid batteries, battery swapping subscriptions, e-scooters and electric mopeds, and the recycling of spent cells. Value is counted at the price paid by the end buyer, including dealer installation and diagnostic labor when it is billed with the pack or the rebuild.
E-Bike Battery Replacement Market Insights
- The market is valued at USD 700.0 million in 2025 and is projected to reach USD 1.65 billion by 2035, growing at a 9.00% CAGR as pedelec fleets age.
- Asia Pacific led with 51.0% of 2025 value, while Middle East & Africa grows fastest at 10.27% a year as Gulf delivery fleets add electric bikes.
- OEM Replacement packs held 55.0% of 2025 value, and Cell Rebuild work is the fastest-growing type at 10.49% a year to 2035.
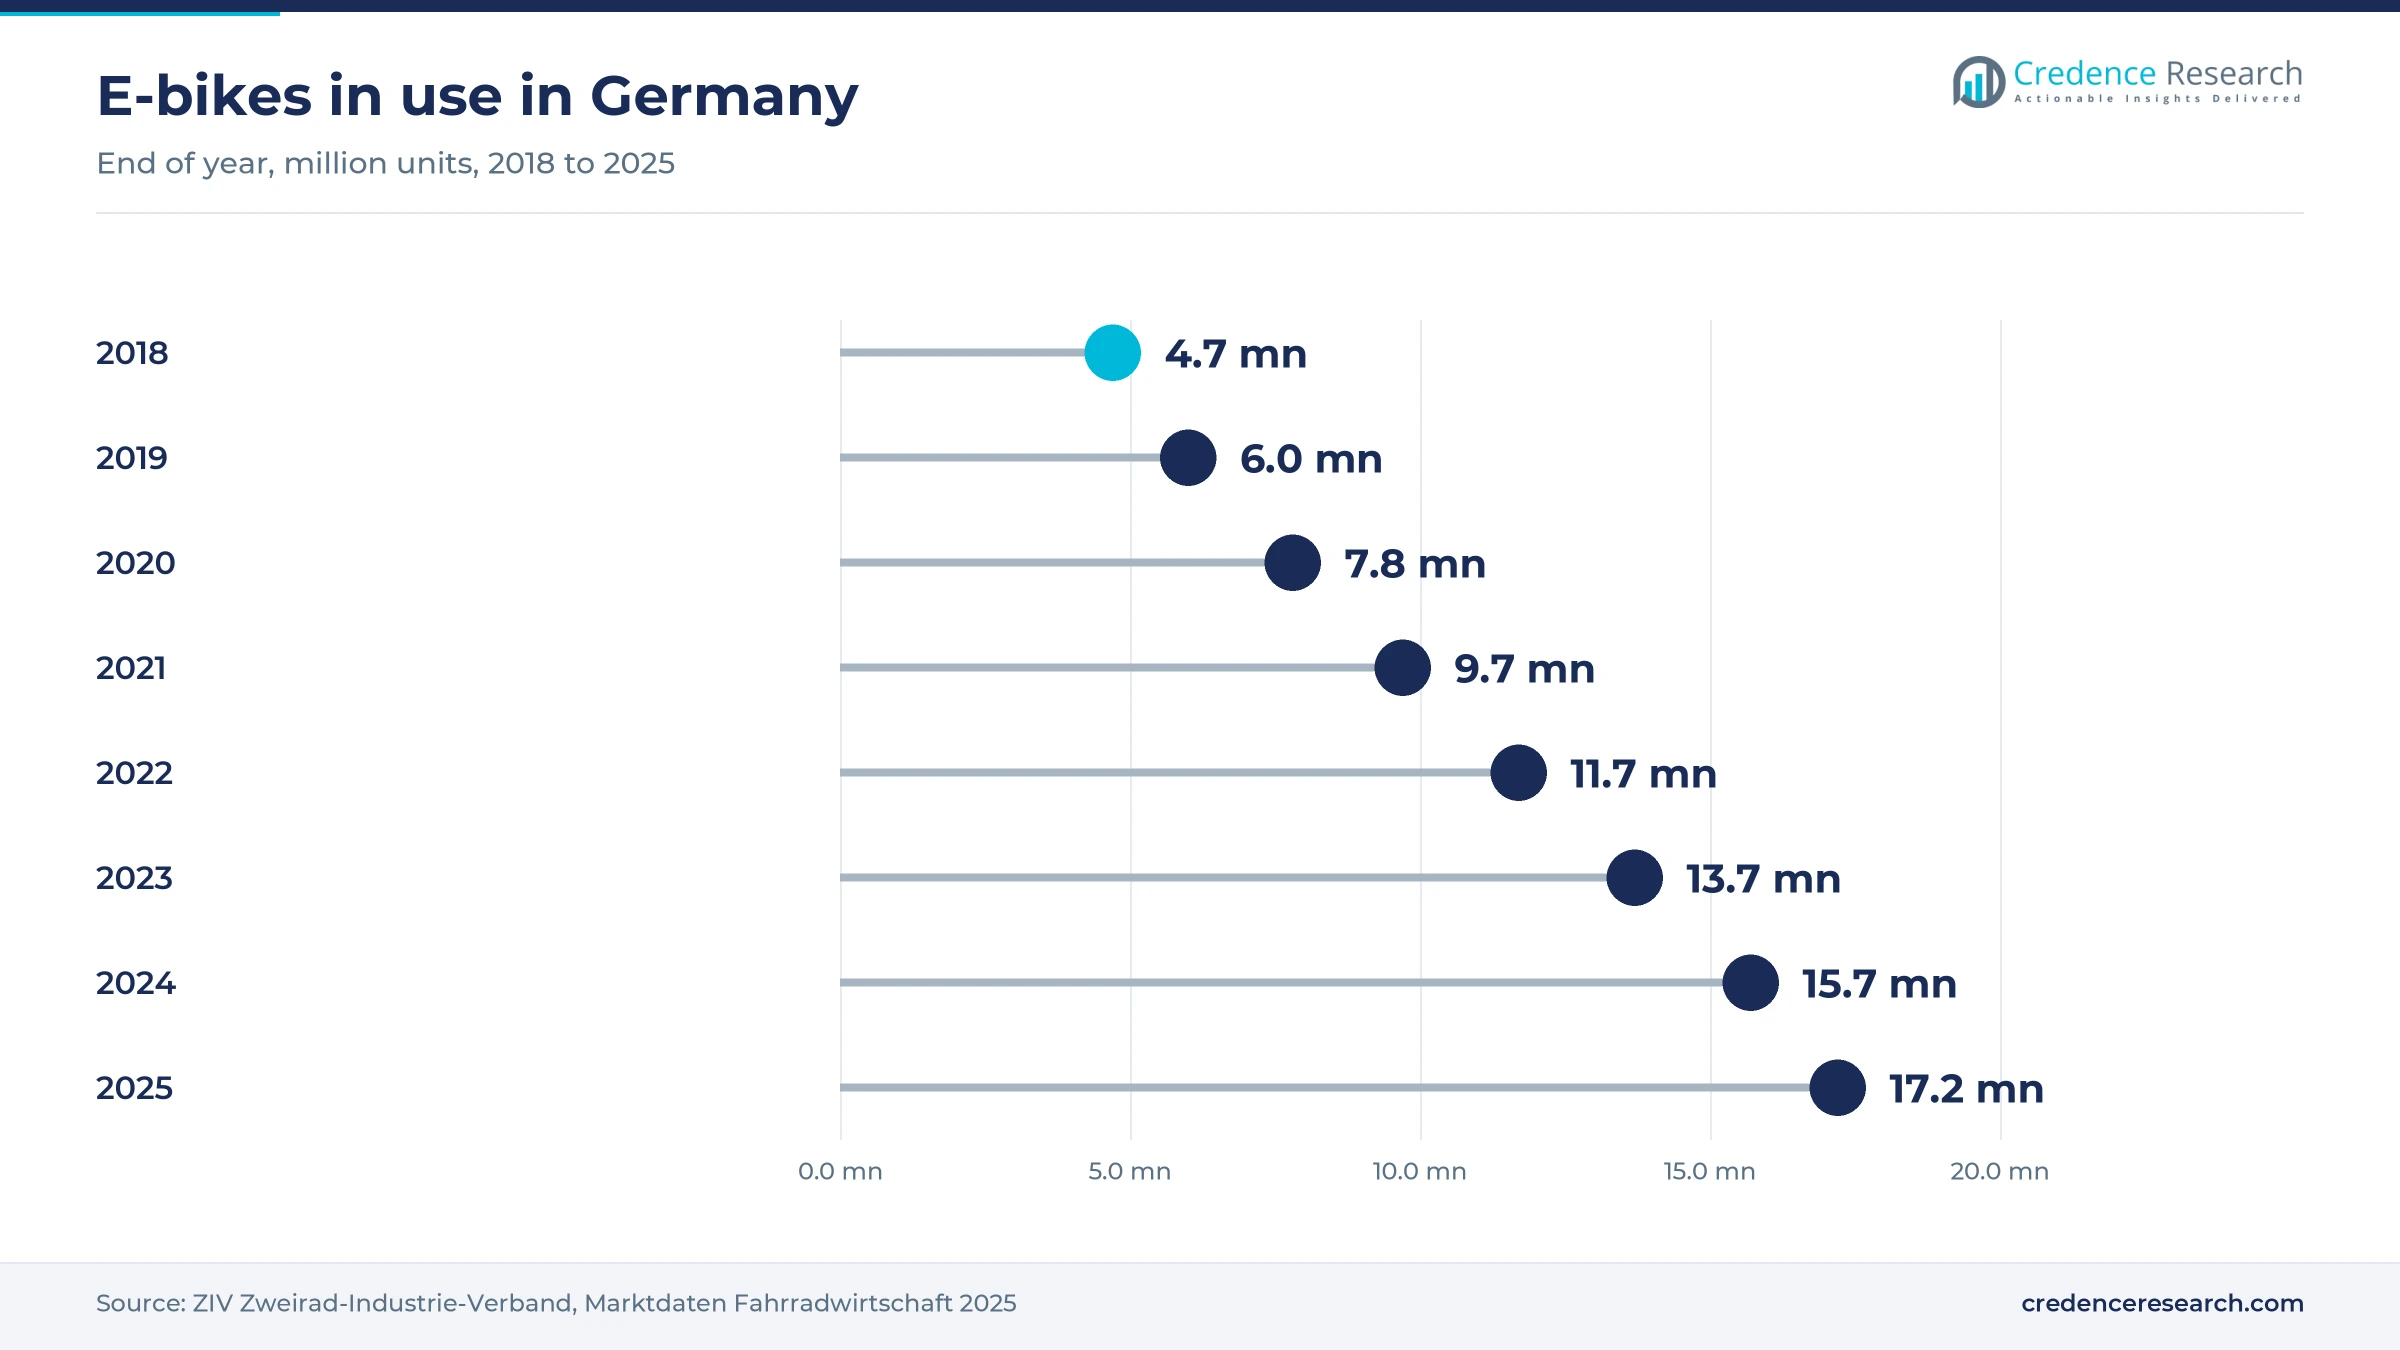
- ZIV counted 17.2 million e-bikes in use in Germany at the end of 2025, up from 6.0 million in 2019, so a large cohort is entering its pack replacement years.
- Valeo and VoltR began refurbishing sharing-fleet packs in October 2025, and China moved new lithium packs under compulsory CCC certification from Nov. 1, 2024.
OEM packs and city bikes hold the largest shares
Why do OEM packs lead and cell rebuilds grow fastest?
Based on type, the market is categorized into OEM replacement, aftermarket and cell rebuild. OEM Replacement packs led with 55.0% of 2025 value because owners of mid-drive bikes mostly buy the system maker's own pack, which matches the original factory-fitted pedelec pack and carries a high price. The U.K. retailer e-bikeshop lists the Bosch PowerTube 800 at 919.99 pounds, while Canyon sells the Shimano BT-E8036 630 Wh pack at 729.99 euros in France. Cell Rebuild work grows fastest at 10.49% a year as specialist capacity expands. Liofit announced a new site of about 1,000 square meters in Kamenz, Germany, in August 2025, according to electrive.
Why do city bikes lead and cargo bikes grow fastest?
Based on bike, the market is categorized into city, cargo and E-MTB. City bikes led with 58.0% of 2025 value because commuter models make up the largest fleets in China and in European towns. China's Ministry of Industry and Information Technology counts more than 350 million electric bicycles in use, and the country produced 42.28 million in 2023, according to Science and Technology Daily. Cargo bikes grow fastest at 10.33% a year as delivery and family riders cover long daily distances. ZIV reported 185,300 cargo e-bike sales in Germany in 2025, a 9.5% share of all e-bike sales.
| Segment Group | Leading Sub-segment | Share, 2025 | Fastest-growing Sub-segment | CAGR, 2026–2035 |
|---|---|---|---|---|
| By Type | OEM Replacement | 55.0% | Cell Rebuild | 10.49% |
| By Bike | City | 58.0% | Cargo | 10.33% |
Request a Free Sample
Fill in your details and we'll send you a free sample report.
- Sample data tables & charts
- Research methodology
Fleet age and pack capacity drive replacement spending
Aging electric bike fleets reach pack end of life
Packs lose capacity with each charge cycle, so the age of the installed fleet sets the base for replacement demand. The ZIV market data for 2025 show the German e-bike stock rising from 6.0 million in 2019 to 17.2 million in 2025, which places millions of bikes past their fifth season. Science and Technology Daily cited the Ministry of Industry and Information Technology in May 2024 as counting more than 350 million electric bicycles in China. The Ministry of Commerce reported in March 2025 that about 2.4 million old e-bikes had been traded in since 2024, which shows that e-bike battery replacement demand starts from millions of aging units. In the Credence Research model this driver adds about 3.78 percentage points to annual growth to 2035.
Higher-energy packs raise the value of each replacement
Larger packs raise the price of each replacement and give owners of older bikes a reason to upgrade rather than ride on a weak pack. Bosch launched the PowerTube 540 in June 2025 at the same weight as its 500 Wh predecessor, according to Notebookcheck and its PowerMore 250 range extender takes combined capacity to nearly 800 Wh. The German retailer ebike24 lists the Yamaha 720 Wh InTube pack at 799 euros, against 729.99 euros for the 630 Wh Shimano pack at Canyon. ZIV data show that E-MTB models, which carry the largest packs, took 38.0% of German e-bike sales in 2025. In the Credence Research model this driver adds about 2.43 percentage points to annual growth to 2035.
Repair networks and refurbishment channels widen supply
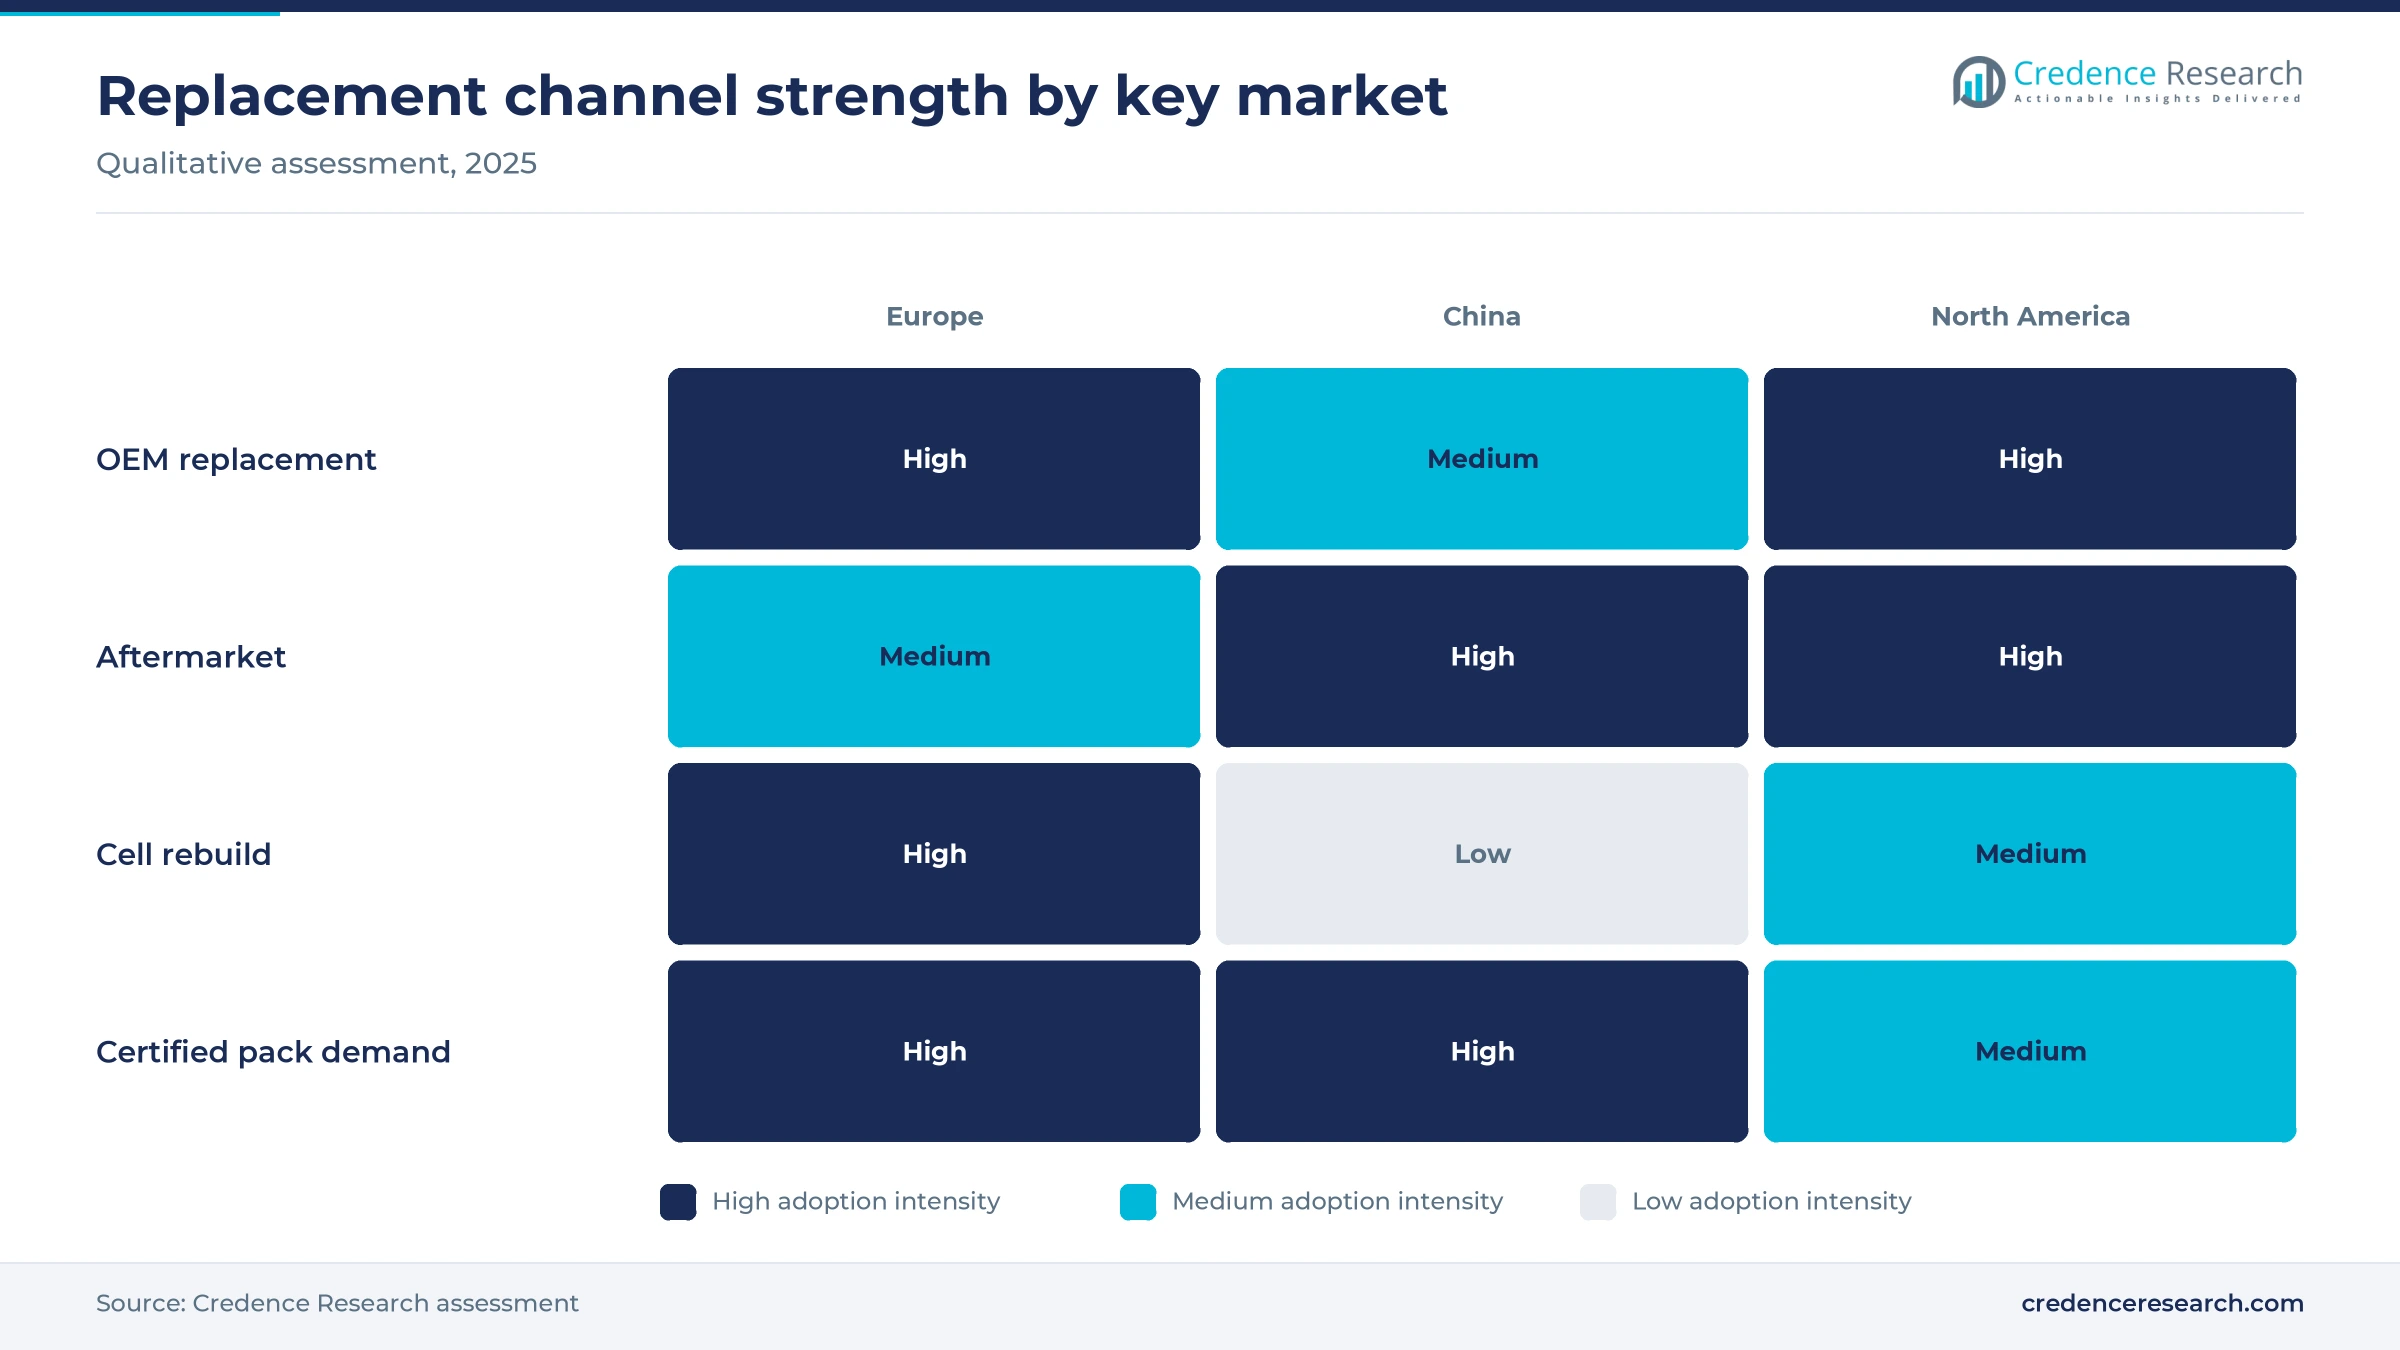
Specialist workshops now rebuild packs for less than the price of a new branded unit, which keeps older bikes in use and adds a service channel. Valeo and the startup VoltR formed a partnership in October 2025 and have refurbished thousands of sharing-fleet packs for operators such as Voi, Lime, Dott and Nextbike, according to VISION mobility. Their refurbished packs reach about 97% state of health, close to new condition. The online platform Heskon stress-tests rebuilt packs at up to 15 amps and then gives a two-year warranty, according to Bike Europe. ZIV reported that workshop revenue at German specialist retailers rose 13.5% in 2025. In the Credence Research model this driver adds about 1.53 percentage points to annual growth to 2035.
Safety rules push owners toward certified packs
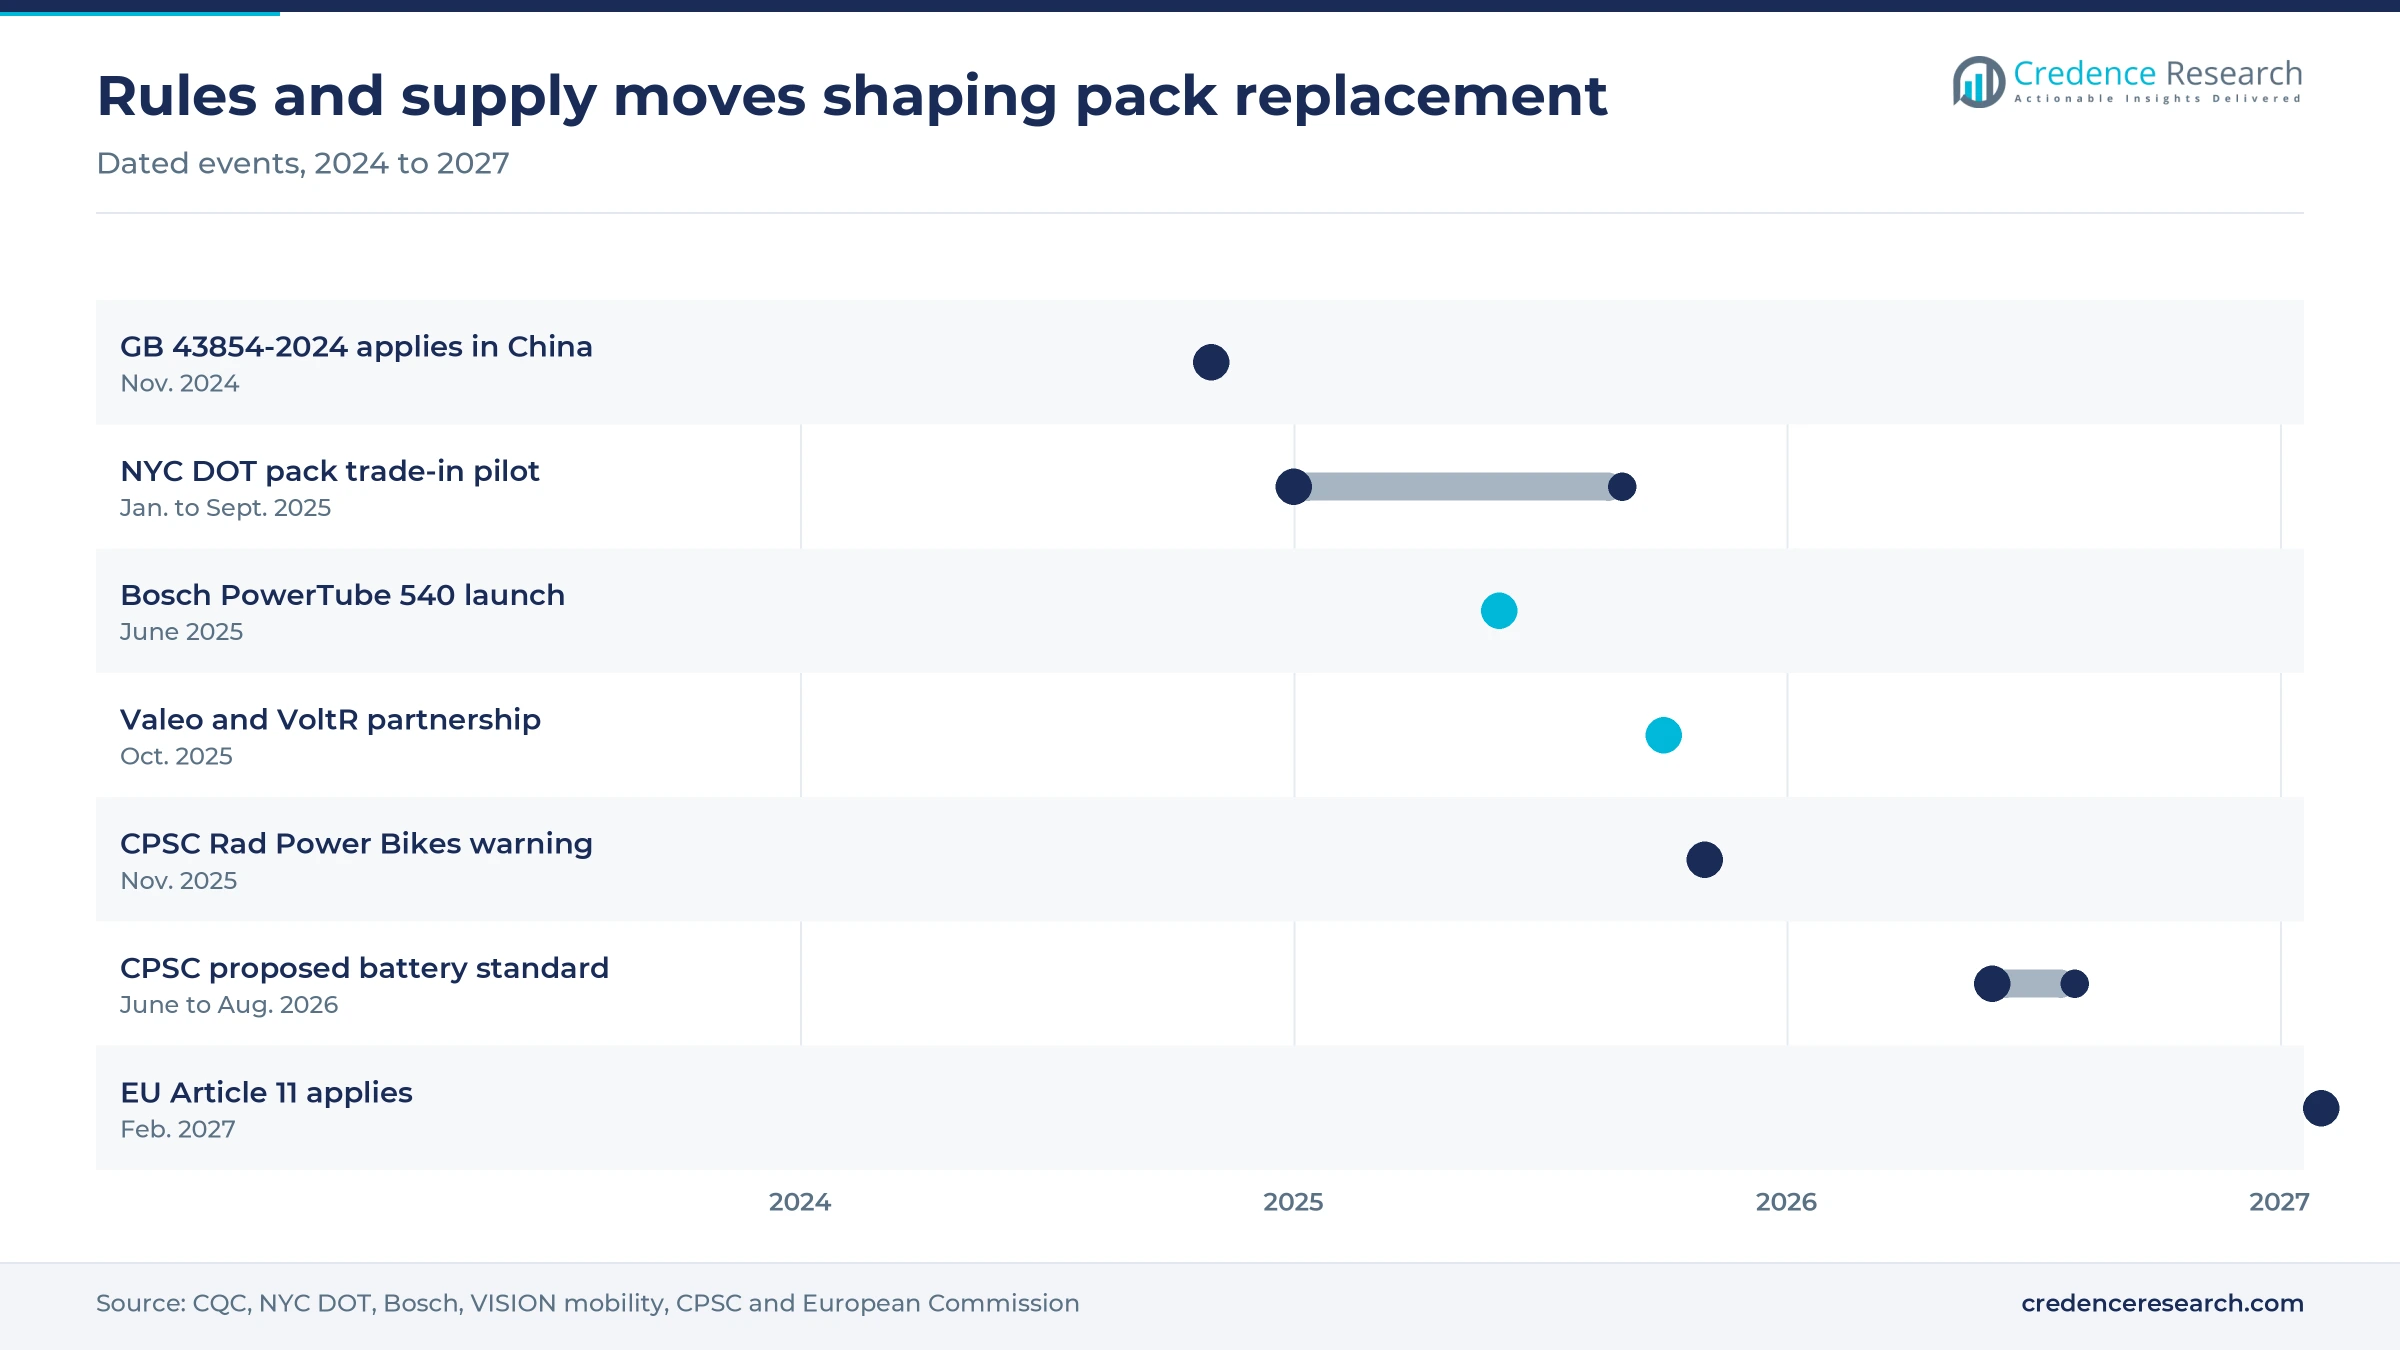
Fire risk is pushing regulators and cities to replace uncertified packs, which brings forward purchases that owners might otherwise delay. China's mandatory standard GB 43854-2024 took effect on Nov. 1, 2024, and the China Quality Certification body CQC required new e-bike packs to meet it for CCC certification from that date. NYC DOT completed a $2 million trade-in pilot on Sept. 18, 2025, giving 402 delivery workers a certified e-bike and two certified packs each. The CPSC warned on Nov. 24, 2025 that owners should stop using some Rad Power Bikes packs after 31 fire reports, citing a replacement price of about $550. These actions turn safety concerns into replacement orders across three major regions.
Repair rules and fleet contracts reshape pack supply
Shift toward pack-level repair rules in the EU
European rules are shifting the debate from whether packs can be repaired to how deep the repair may go. The European Commission guidelines on Article 11 state that the duty to make light means of transport batteries replaceable by independent professionals also applies at the level of the cells from Feb. 18, 2027. The Commission proposal COM(2025) 981 would amend Article 11(5), and European Cycling Industries and Recharge backed it in an April 2026 position paper that favors pack-level repairability. The two groups argue that opening packs outside a factory carries fire risk and that mixing old and new cells can speed up aging. Rebuild workshops must therefore plan for both outcomes until the amendment is settled.
Rise of leasing and sharing fleets that renew packs on schedule
Leasing and sharing fleets are rising as buyers of packs, and they replace them on a schedule rather than after failure. Bike Europe reported in June 2026 that German company bike leasing sales reached 2.8 billion euros in 2025, while employee participation rose from 8% in 2024 to 11% in 2025. VISION mobility reported that pack performance in daily sharing use can fall to about 60%, which forces operators to renew packs well before the bike frame wears out. Valeo can test a pack's state of health in under two minutes, which lets fleets sort packs for repair or replacement at depot scale.
Opening for certified packs in North America
North America offers an opening because a large wave of imported e-bikes will need new packs within a few years. The Light Electric Vehicle Association estimated that about 2.2 million complete e-bikes were imported into the United States in 2025. The CPSC published a proposed mandatory standard for micromobility batteries on June 24, 2026, according to law firm Cozen O'Connor, and its record lists 25 incidents from 2019 to 2023 that involved removed, replaced or aftermarket packs. Rad Power Bikes told the CPSC in November 2025 that it could not afford replacements for all owners, which leaves room for certified third-party packs. North America grows at 9.77% a year in the Credence Research model.
Opportunity in Japan's large power-assisted bicycle base
Japan offers a steady opening because its large domestic output of power-assisted bicycles creates a pool of packs that wear out every year. METI production statistics compiled by the Japan Bicycle Promotion Institute show 609,430 units made in 2020 and 545,736 in 2024, so roughly 3 million bikes from the last five years will need packs. Panasonic, which announced its first electric bicycle in 1979, showed its GXM motor with flexible battery options at Eurobike in June 2025, according to BikeBiz. Yamaha also sells 720 Wh InTube packs for its PW-X3 drive. Asia Pacific grows at 8.87% a year in the Credence Research model.
Fire risk, shipping rules and trade-ins weigh on growth
Fire incidents raise liability for third-party packs
Fire incidents raise the liability attached to every third-party pack and rebuild. The London Fire Brigade said on Nov. 25, 2025 that crews had averaged 18 e-bike and e-scooter battery fires a month that year, with two e-bike deaths. A CPSC report cited by New York lawmakers in October 2026 counted 367 micromobility battery fires and 45 deaths in the United States from 2017 to 2024. Insurers and landlords therefore favor branded packs, which slows growth for low-cost aftermarket sellers.
Unsettled EU cell-repair rules delay rebuild investment
Rebuild workshops face unclear rules on how far they may open a pack after 2027. European Cycling Industries and Recharge stated in April 2026 that no robust, safe and industrially viable method exists for standardized single-cell replacement, echoing a CONEBI and CIE paper of October 2025. If the proposal COM(2025) 981 is adopted, the cell-level duty would give way to pack-level repair. Investors in recell lines therefore wait for the final text, and packs that cannot be rebuilt go to lithium-ion recycling plants instead.
Dangerous-goods shipping adds cost to every pack
Transport rules add cost to every pack that moves between a rider, a dealer and a rebuild workshop. E-bike packs fall under ADR, the European treaty for road transport of dangerous goods, and must carry UN3480 labels, according to Bike Europe. Small rebuilders need only a few hundred to a few thousand cells a year, a volume that large cell makers often decline to supply. These limits keep rebuild prices above labor costs alone and favor large networks.
Trade-in subsidies replace whole bikes instead of packs
China's trade-in program diverts some spending from new packs to new bikes. Electrek reported in July 2025, citing the Ministry of Commerce, that more than 8.4 million consumers had joined the e-bike trade-in program, and that new e-bike sales passed 8.47 million in the first half of 2025, up 643.5% year over year. Owners who scrap a bike with a weak pack buy a complete vehicle, which delays replacement demand for those units by several years.
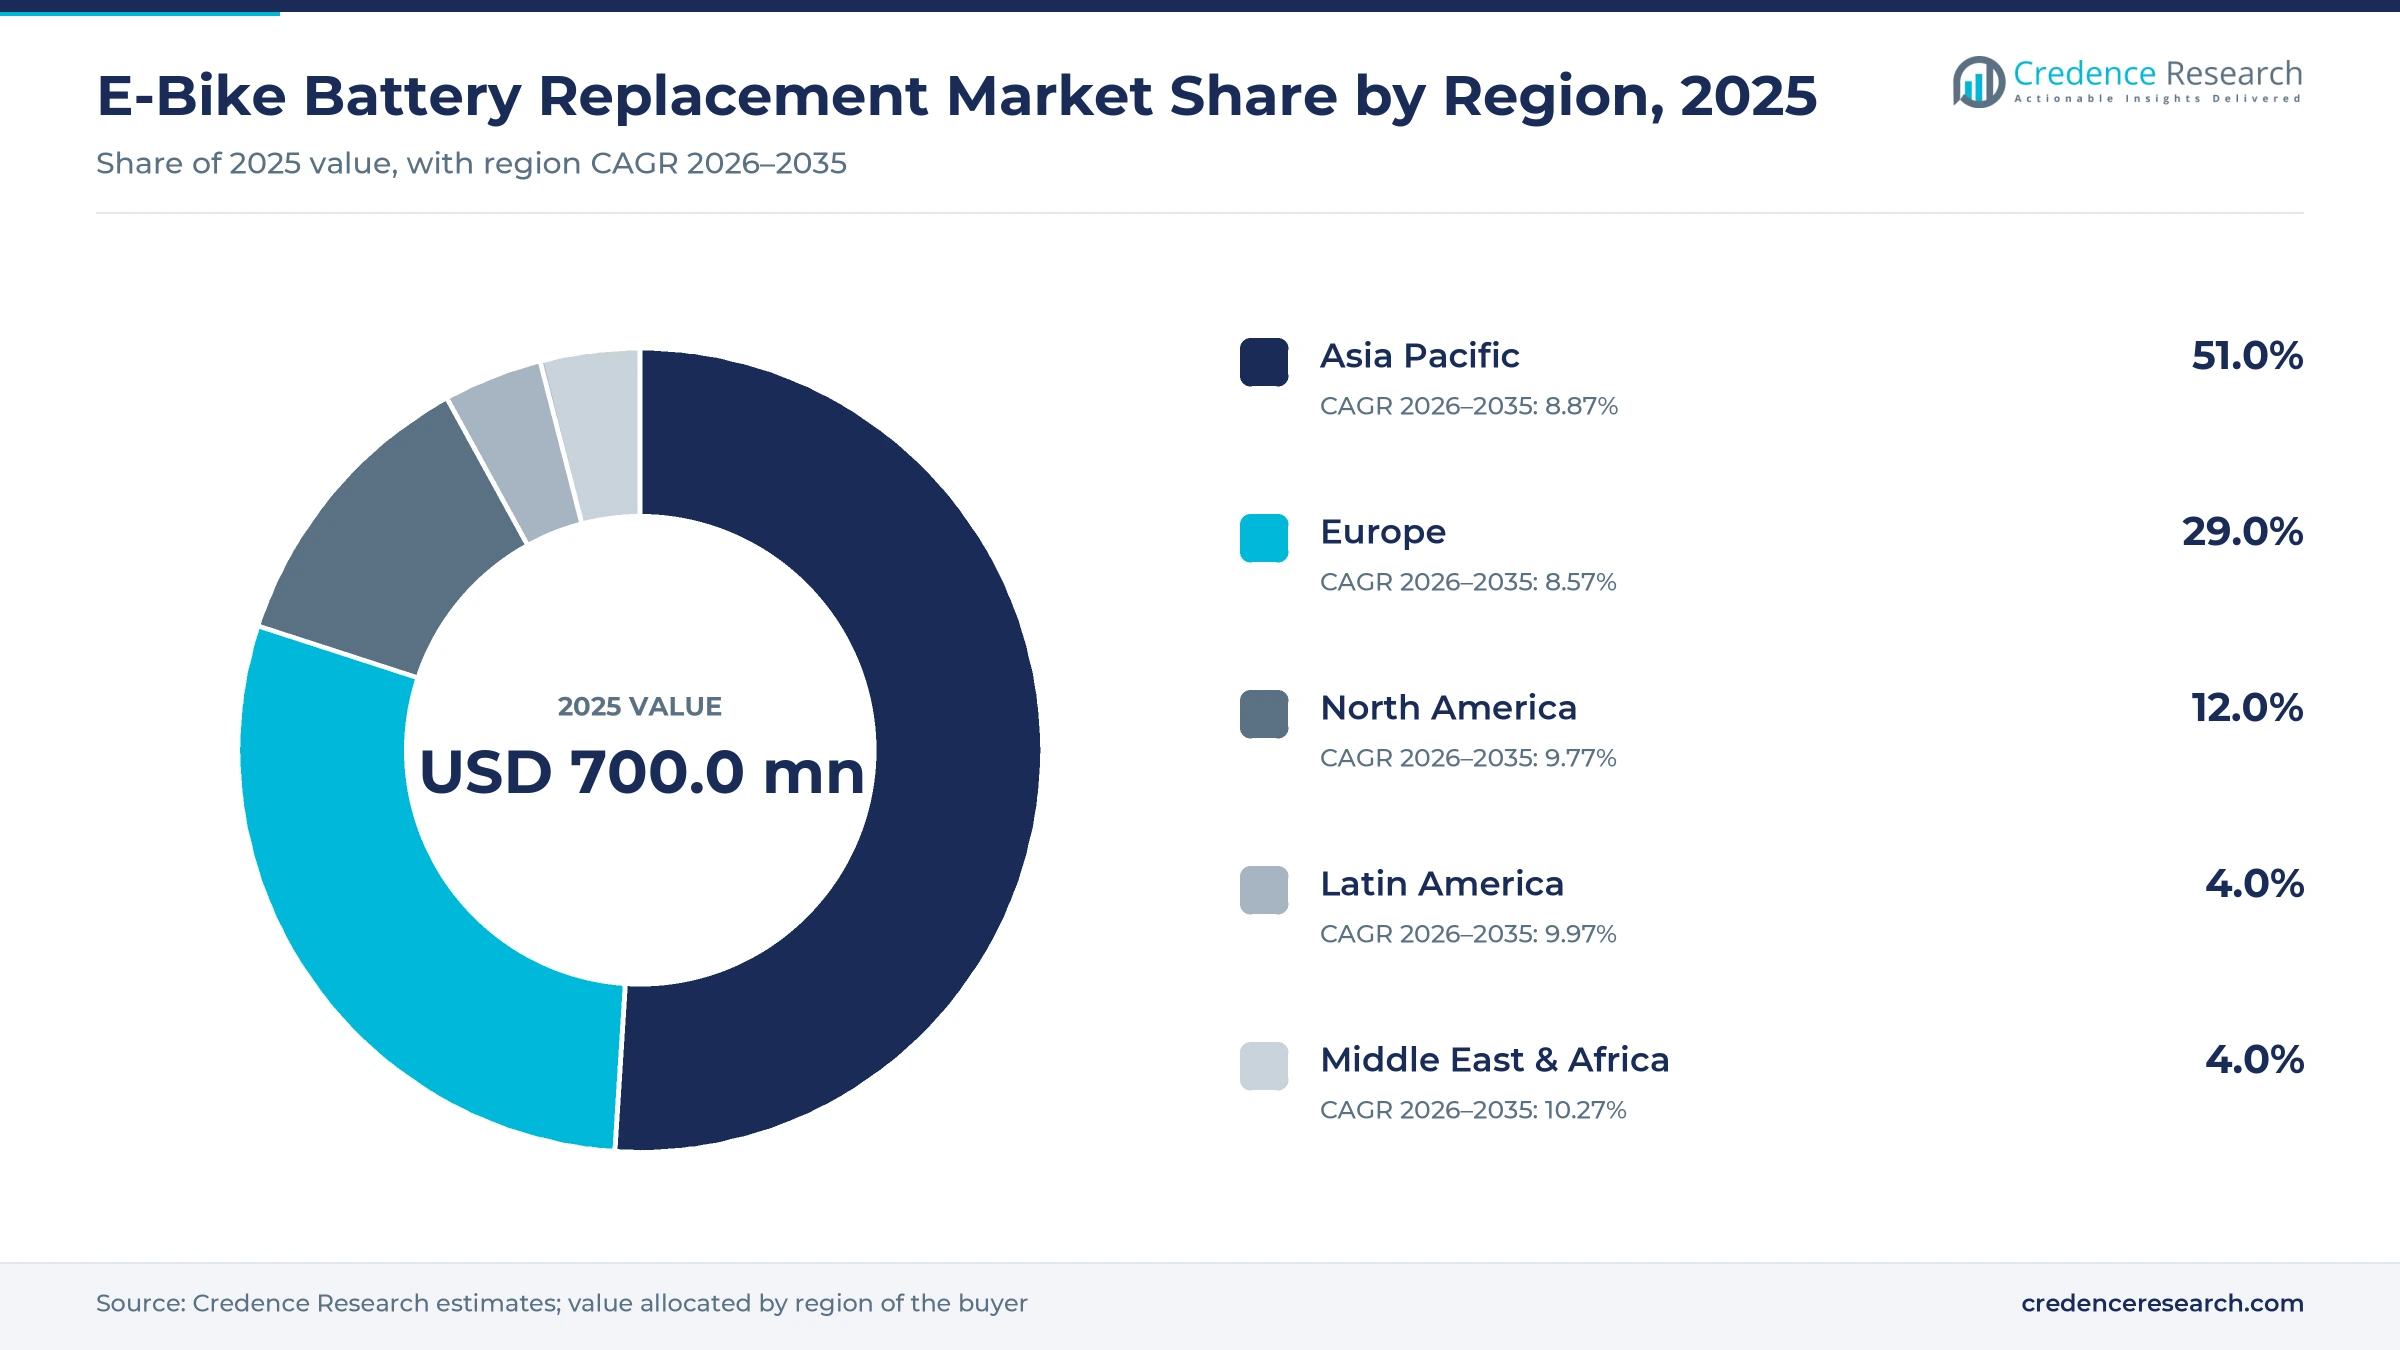
Asia Pacific leads as Middle East & Africa grows fastest
| Region | Value, 2025 (USD million) | Share, 2025 | CAGR, 2026–2035 |
|---|---|---|---|
| Asia Pacific | 357.0 | 51.0% | 8.87% |
| Europe | 203.0 | 29.0% | 8.57% |
| North America | 84.0 | 12.0% | 9.77% |
| Latin America | 28.0 | 4.0% | 9.97% |
| Middle East & Africa | 28.0 | 4.0% | 10.27% |
Asia Pacific leads on the size of China's fleet
Asia Pacific held 51.0% of 2025 value and grows at 8.87% a year, with China accounting for most pack volume. China produced 42.28 million electric bicycles in 2023, and its mandatory GB 43854-2024 standard has applied to new lithium packs since Nov. 1, 2024. Japan adds a steady base, with 545,736 power-assisted bicycles produced in 2024 according to METI statistics. Pack prices in China stay far below European levels, which keeps the regional value share lower than unit counts suggest.
Europe pays the highest prices for branded packs
Europe held 29.0% of 2025 value and grows at 8.57% a year, because riders pay the highest prices for branded mid-drive packs. Germany alone had 17.2 million e-bikes in use at the end of 2025, the largest national base of pack demand in the region. The average new e-bike sold there for 2,550 euros in 2025, according to ZIV. CONEBI reported that e-bike production in the EU and U.K. fell 19% to 3.7 million units in 2024, which slows sales of new electric bicycles but lengthens the life of bikes already on the road. Rebuild specialists such as Liofit and VoltR are adding capacity.
North America grows as a young fleet ages
North America held 12.0% of 2025 value and grows at 9.77% a year as a young fleet starts to age. About 2.2 million e-bikes entered the United States in 2025, so pack replacement demand in the region should climb after 2028. New York City counted more than 250 lithium-ion battery fires and 18 deaths in 2023, according to a Mayor's office release quoting Assemblymember Jenifer Rajkumar, and the city has since funded certified pack exchanges for delivery workers. A federal battery standard proposed by the CPSC in June 2026 could raise compliance costs for importers of generic packs and favor certified suppliers.
Latin America builds from Brazil's growing fleet
Latin America held 4.0% of 2025 value and grows at 9.97% a year from a small base. Aliança Bike counted 53,591 new e-bikes sold in Brazil in 2024, up 7.2% from 2023, combining imports and domestic production. Most of these bikes are still on their first pack, so regional replacement demand should build after 2027 as that 2024 cohort ages. Pack imports also travel long routes under dangerous-goods rules, which keeps prices high and favors local rebuild shops.
Middle East & Africa grows fastest on delivery fleets
Middle East & Africa held 4.0% of 2025 value and is the fastest-growing region at 10.27% a year. Dubai's Roads and Transport Authority invited bids on Jan. 28, 2025 for e-bike battery charging and swapping stations in areas such as Al Barsha, Al Rigga and Zabeel. The authority cited more than 40,000 registered bikes in the delivery sector, a fleet whose heavy daily use in high heat lifts pack demand in the region. Hot climates shorten lithium-ion life, which brings replacement forward compared with temperate markets.
Safety rules and rebuild deals marked 2024 to 2026
| Development | Status and market relevance |
|---|---|
| In November 2024, China began requiring new e-bike lithium packs to meet GB 43854-2024 for CCC certification, with the rule applying from Nov. 1. | In force; sets the safety floor for replacement packs sold in China |
| In June 2025, Bosch eBike Systems launched the PowerTube 540, which keeps the weight of the PowerTube 500 while adding capacity. | On sale; raises the value of upgrade replacements |
| In October 2025, Valeo and VoltR formed a partnership to diagnose, repair and refurbish sharing-fleet packs for European operators. | Operating; thousands of packs refurbished since autumn 2025 |
| In November 2025, the CPSC warned owners to stop using some Rad Power Bikes packs after 31 fire reports. | Warning issued; no recall agreed with the company |
| In June 2026, the CPSC published a proposed mandatory safety standard for micromobility batteries, chargers and battery management systems. | Proposed; comment period closed Aug. 24, 2026 |
Health testing, larger cells and cell-level design
- State-of-health testing now takes under two minutes per pack in the Valeo process, which speeds the choice between repair and replacement.
- Higher-capacity packs lift energy per unit, with Yamaha now selling a 720 Wh InTube pack and Bosch an 800 Wh PowerTube.
- Load stress testing at up to 15 amps lets rebuilders such as Heskon check refurbished packs before they give a two-year warranty.
- Cell-level design rules under Article 11 of the EU Batteries Regulation will shape how future packs are assembled and opened from Feb. 18, 2027.
Need a Custom Version of This Report?
Tailor the scope, geography, or segments to your exact requirements.
- Custom geography or segment scope
- Direct access to our analyst team
System makers and rebuild specialists compete
Competition splits between drive-system makers that sell branded packs through dealer networks and independent suppliers that compete on price or repair. Bosch eBike Systems, Shimano and Yamaha set the reference prices for most mid-drive bikes, and their packs reach riders through bike dealers and brands such as Canyon and Haibike. Panasonic supplies complete drive systems for urban, cargo, trekking and mountain bikes and showed its GXM motor with flexible battery options at Eurobike 2025. Independent channels include compatible packs from online sellers and rebuild specialists such as Liofit in Germany, the dealer platform Heskon and VoltR, which works with Valeo for sharing fleets. Branded suppliers compete on system integration and warranty cover, while rebuilders compete on lower prices and fast turnaround. Safety certification is becoming the main entry barrier, because China already ties market access to tested packs and the United States has proposed a mandatory standard.
Companies profiled and their roles in this market
| Company | Type | Role in the market |
|---|---|---|
| Bosch eBike Systems | Drive-system maker | PowerTube and PowerMore packs sold as branded replacements through dealers |
| Shimano | Drive-system maker | BT-E8036 630 Wh pack for its EP-series drive units |
| Yamaha | Drive-system maker | 720 Wh InTube pack for bikes with the PW-X3 drive |
| Panasonic | Drive-system and battery maker | GX and GXM drive systems with battery options for urban, cargo and MTB bikes |
| Liofit | Rebuild specialist | Repair and recycling of packs in Kamenz, Germany |
| VoltR | Rebuild specialist | Refurbished packs and reused cells for sharing fleets with Valeo |
| Heskon | Rebuild platform | Online refurbishing service for bike dealers with a two-year warranty |
The installed fleet, not new sales, sets growth
Credence Research's view is that growth in e-bike battery replacement rests less on new bike sales than on the age of bikes already in use. Germany's fleet nearly tripled between 2019 and 2025 while annual sales stayed near 2 million, so the replacement pool grows even in flat sales years. Branded packs will keep most of the value because safety rules reward tested, traceable products. Rebuild specialists can still gain share, but their path depends on how the European Union settles cell-level repair before Feb. 18, 2027. Suppliers that pair certified packs with dealer diagnostics are best placed to 2035.
Fleet-based model checked against pack prices
The report uses 2025 as the base year and forecasts to 2035. Market values come from the Credence Research model, which links the installed e-bike fleet by region with pack life, replacement rates and average pack prices. Regional and segment shares are Credence Research estimates built from the same fleet model. Inputs include industry association statistics from ZIV, CONEBI, the Light Electric Vehicle Association, Aliança Bike and the Japan Bicycle Promotion Institute, government sources such as the European Commission, the CPSC, China's Ministry of Commerce and NYC DOT, published retail prices and company announcements. No interviews or surveys were used in preparing this report.
Peak-year fleets drive replacement demand to 2035
E-bike battery replacement spending is expected to grow from USD 760.0 million in 2026 to USD 1.65 billion by 2035 as bikes bought during the 2020 to 2022 sales peak reach the end of their first pack. Europe will keep the highest value per pack, while Asia Pacific keeps the largest share through volume. The EU rules applicable from Feb. 18, 2027 and the pending CPSC standard will decide how far rebuild and third-party packs can grow. Larger packs, fleet contracts and certified rebuilds should lift average spending per replacement through the forecast period.
Frequently Asked Questions
How big is the e-bike battery replacement market?
Which region leads the market?
Which type of replacement leads?
What drives replacement demand?
How will EU rules affect pack rebuilds?
Why do safety rules matter for this market?
Which bike type grows fastest?
Who are the key companies?
Table of Content
Chapter 1 Market Segmentation
- 1.1 Segmentation Framework
- 1.1.1 Product and Service Classification
- 1.1.2 Application and End-Use Classification
- 1.1.3 Technology and Solution Classification
- 1.1.4 Customer and Distribution Channel Classification
- 1.1.5 Geographic Segmentation
- 1.1.6 Market Segment Definitions and Boundaries
- 1.2 By Type
- 1.2.1 OEM Replacement
- 1.2.2 Aftermarket
- 1.2.3 Cell Rebuild
- 1.3 By Bike
- 1.3.1 City
- 1.3.2 E-MTB
- 1.3.3 Cargo
Chapter 2 Introduction
- 2.1 Report Objectives and Scope
- 2.2 Product Definition and Industry Terminology
- 2.3 Market Inclusions and Exclusions
- 2.4 Research Process
- 2.4.1 Primary Research and Expert Interviews
- 2.4.2 Secondary Research and Source Review
- 2.4.3 Top-Down and Bottom-Up Estimation
- 2.4.4 Data Triangulation and Verification
- 2.5 Market Size Measurement Basis
- 2.5.1 2025: USD 700.0 million → 2035: USD 1.65 billion
- 2.6 Historical and Forecast Reference Periods
- 2.6.1 Historical Period: 2018-2025
- 2.6.2 Base Year: 2025
- 2.6.3 Forecast Period: 2025-2035
- 2.7 Research Assumptions and Limitations
Chapter 3 Executive Summary
- 3.1 Market Snapshot and Key Findings
- 3.2 Base-Year Market Size, 2025
- 3.3 Forecast Market Size, 2035
- 3.4 Revenue and Volume Growth Outlook
- 3.5 Key Demand and Supply Indicators
- 3.6 Leading Market Segments
- 3.7 Fastest-Growing Market Opportunities
- 3.8 Regional Performance Highlights
- 3.9 Technology and Industry Transformation
- 3.10 Competitive Landscape Summary
- 3.11 Analyst View and Strategic Implications
Chapter 4 Global E-Bike Battery Replacement Market Trends and Developments
- 4.1 Historical Industry Development, 2018-2025
- 4.2 Recent Market Trends and Developments
- 4.3 Demand and Customer Behavior Trends
- 4.4 Technology and Product Innovation
- 4.5 Artificial Intelligence, Automation and Digitalization
- 4.6 Local Manufacturing and Supply Chain Realignment
- 4.7 Industry Partnerships, Mergers and Acquisitions
- 4.8 Sustainability and Circular Economy Developments
- 4.9 Government and Private Sector Investment Trends
- 4.10 Emerging Business Models and Commercialization
- 4.11 Industry Developments and Announcements
Chapter 5 Global E-Bike Battery Replacement Market Production, Supply and Demand Analysis
- 5.1 Demand Trend and Consumption Analysis, 2018-2025
- 5.2 Demand Forecast, 2025-2035
- 5.3 Production and Output Trend, 2018-2025
- 5.4 Production and Output Forecast, 2025-2035
- 5.5 Installed Capacity and Capacity Utilization
- 5.6 Company-Wise Production Plants and Statistics
- 5.6.1 Installed Production Capacity
- 5.6.2 Actual Production
- 5.6.3 Planned Capacity and Expansion Targets
- 5.7 Supply Chain Structure and Procurement Trends
- 5.8 Supply-Demand Gap and Bottlenecks
- 5.9 Import Dependence and Sourcing Structure
- 5.10 Contract Manufacturing and Outsourcing
- 5.11 Regional Supply and Demand Concentration
Chapter 6 Global E-Bike Battery Replacement Market Pricing Analysis
- 6.1 Pricing Structure and Measurement
- 6.2 Historical Pricing Trends, 2018-2025
- 6.3 Pricing Outlook, 2025-2035
- 6.4 Average Selling Price and Unit Economics
- 6.5 Pricing by Product and Market Segment
- 6.6 Geographic Pricing Differences
- 6.7 Key Input, Energy, Labor and Logistics Costs
- 6.8 Contract Pricing and Purchasing Models
- 6.9 Pricing Sensitivity and Competitive Positioning
- 6.10 Price, Margin and Profitability Implications
Chapter 7 Global E-Bike Battery Replacement Market Dynamics
- 7.1 Market Growth Drivers
- 7.1.1 Demand-Side Drivers
- 7.1.2 Technology and Innovation Drivers
- 7.1.3 Infrastructure and Investment Drivers
- 7.1.4 Regulatory and Policy Drivers
- 7.2 Market Restraints
- 7.2.1 Cost and Affordability Constraints
- 7.2.2 Technology and Adoption Barriers
- 7.2.3 Supply Chain and Operational Constraints
- 7.3 Market Challenges
- 7.3.1 Competitive Pressure and Margin Erosion
- 7.3.2 Skills, Infrastructure and Implementation Gaps
- 7.4 Emerging Market Opportunities
- 7.5 Market Dynamics Impact and Time-Horizon Assessment
Chapter 8 Global E-Bike Battery Replacement Value Chain Analysis
- 8.1 Industry Value Chain Overview
- 8.2 Upstream Suppliers and Critical Inputs
- 8.3 Technology and Component Providers
- 8.4 Manufacturing or Service Delivery
- 8.5 Distribution, Channel Partners and Integrators
- 8.6 Downstream Applications and End Users
- 8.7 Value Addition and Profit Pools
- 8.8 Vertical Integration and Outsourcing
- 8.9 Supplier Concentration and Risk
- 8.10 Supply Chain Localization and Resilience
Chapter 9 Global E-Bike Battery Replacement Market Regulations and Policies
- 9.1 Relevant Laws, Standards and Compliance Frameworks
- 9.2 Product, Service, Safety and Quality Requirements
- 9.3 Government Policies, Incentives and Subsidies
- 9.4 Imports, Exports and Trade Barriers
- 9.5 Public Procurement and Local Content Requirements
- 9.6 Environmental and Sustainability Compliance
- 9.7 Upcoming Policy Changes and Market Implications
Chapter 10 Global E-Bike Battery Replacement Market Hotspots and Opportunities
- 10.1 Market Opportunity Mapping and Growth Hotspots
- 10.2 High-Growth Applications and Customer Groups
- 10.3 Underserved Markets and White-Space Opportunities
- 10.4 Emerging Technology and Product Opportunities
- 10.5 New Capacity and Investment Hotspots
- 10.6 Market Entry and Expansion Opportunities
- 10.7 Distribution and Partnership Opportunities
- 10.8 Near-Term and Long-Term Commercial Potential
- 10.9 Opportunity Attractiveness and Execution Risks
Chapter 11 Global E-Bike Battery Replacement Market Outlook, 2025-2035
- 11.1 Market Size and Analysis
- 11.1.1 Revenue (Market Measurement: 2025: USD 700.0 million → 2035: USD 1.65 billion)
- 11.1.2 Market Volume and Quantity Sold
- 11.1.3 Historical Market Size, 2018-2025
- 11.1.4 Base-Year Market Size, 2025
- 11.2 Market Forecast, 2025-2035
- 11.2.1 Revenue Forecast to 2035
- 11.2.2 Volume Forecast to 2035
- 11.2.3 CAGR and Year-on-Year Growth
- 11.2.4 Incremental Revenue Opportunity
- 11.3 Forecast Assumptions and Scenario Analysis
- 11.3.1 Base-Case Forecast
- 11.3.2 Optimistic and Conservative Scenarios
- 11.3.3 Technology, Pricing and Policy Sensitivities
- 11.4 Market Attractiveness and Growth Outlook
Chapter 12 Global E-Bike Battery Replacement Market Segmentation and Outlook
- 12.1 Segmentation Summary and Market Shares, 2025
- 12.2 Largest and Fastest-Growing Segments
- 12.3 By Type - Market Size and Forecast, 2025-2035
- 12.3.1 Segment Definition and Scope
- 12.3.2 Historical Market Size, 2018-2025
- 12.3.3 Revenue Forecast, 2025-2035
- 12.3.4 Volume Forecast, 2025-2035
- 12.3.5 Base-Year Market Share, 2025
- 12.3.6 Segment CAGR and Growth Drivers
- 12.3.7 Subsegment Market Size and Forecast
- 12.3.7.1 OEM Replacement
- 12.3.7.2 Aftermarket
- 12.3.7.3 Cell Rebuild
- 12.3.8 Subsegment Pricing and Adoption Trends
- 12.3.9 Leading Suppliers and Competition
- 12.3.10 Regional Demand and Opportunities
- 12.4 By Bike - Market Size and Forecast, 2025-2035
- 12.4.1 Segment Definition and Scope
- 12.4.2 Historical Market Size, 2018-2025
- 12.4.3 Revenue Forecast, 2025-2035
- 12.4.4 Volume Forecast, 2025-2035
- 12.4.5 Base-Year Market Share, 2025
- 12.4.6 Segment CAGR and Growth Drivers
- 12.4.7 Subsegment Market Size and Forecast
- 12.4.7.1 City
- 12.4.7.2 E-MTB
- 12.4.7.3 Cargo
- 12.4.8 Subsegment Pricing and Adoption Trends
- 12.4.9 Leading Suppliers and Competition
- 12.4.10 Regional Demand and Opportunities
- 12.5 Segment Growth Comparison
- 12.6 Segment Attractiveness and Priority Matrix
Chapter 13 Global E-Bike Battery Replacement Geographic Market Outlook, 2025-2035
- 13.1 Regional Market Size and Share, 2025
- 13.2 Regional Market Forecast, 2025-2035
- 13.3 Regional Pricing, Production and Demand Differences
- 13.4 North America
- 13.4.1 United States
- 13.4.2 Canada
- 13.4.3 Mexico
- 13.5 Europe
- 13.5.1 Germany
- 13.5.2 France
- 13.5.3 Italy
- 13.5.4 United Kingdom
- 13.5.5 Spain
- 13.5.6 Poland
- 13.5.7 Russia
- 13.5.8 Netherlands
- 13.5.9 Belgium
- 13.5.10 Sweden
- 13.5.11 Denmark
- 13.5.12 Norway
- 13.5.13 Rest of Europe
- 13.6 Asia Pacific
- 13.6.1 China
- 13.6.2 India
- 13.6.3 Japan
- 13.6.4 South Korea
- 13.6.5 Thailand
- 13.6.6 Indonesia
- 13.6.7 Vietnam
- 13.6.8 Malaysia
- 13.6.9 Australia
- 13.6.10 Rest of Asia Pacific
- 13.7 Latin America
- 13.7.1 Brazil
- 13.7.2 Argentina
- 13.7.3 Colombia
- 13.7.4 Chile
- 13.7.5 Rest of Latin America
- 13.8 Middle East
- 13.8.1 Saudi Arabia
- 13.8.2 United Arab Emirates
- 13.8.3 Turkey
- 13.8.4 Israel
- 13.8.5 Iran
- 13.8.6 Rest of the Middle East
- 13.9 Africa
- 13.9.1 South Africa
- 13.9.2 Egypt
- 13.9.3 Nigeria
- 13.9.4 Morocco
- 13.9.5 Rest of Africa
- 13.10 Regional Investment, Policy and Supply Chain Differences
- 13.11 Regional Competitive Landscape
- 13.12 Geographic Growth Hotspots
Chapter 14 Global E-Bike Battery Replacement Technology, Innovation and Sustainability Outlook
- 14.1 Technology Landscape and Maturity
- 14.2 Product, Process and Service Innovation
- 14.3 AI, Automation and Digital Tools in the Industry
- 14.4 Technology Adoption and Performance Benchmarking
- 14.5 Innovation Pipeline and R&D Investment
- 14.6 Patent and Intellectual Property Trends
- 14.7 Energy Efficiency and Resource Management
- 14.8 Sustainability, Recycling and Circularity
- 14.9 Technology Roadmap, 2025-2035
- 14.10 Risks of Obsolescence and Technology Substitution
Chapter 15 Global E-Bike Battery Replacement Market Key Strategic Imperatives
- 15.1 Growth and Market Entry Priorities
- 15.2 High-Return Products and Segments
- 15.3 Pricing, Profitability and Cost Optimization
- 15.4 Technology Investment and Product Differentiation
- 15.5 Supply Chain Localization and Resilience
- 15.6 Distribution and Customer Acquisition
- 15.7 Partnership, Acquisition and Capacity Strategy
- 15.8 Regional Expansion Priorities
- 15.9 Short-, Medium- and Long-Term Actions
Chapter 16 Competition Outlook
- 16.1 Industry Competition Characteristics
- 16.2 Market Structure and Concentration
- 16.3 Market Share and Competitive Positioning, 2025
- 16.4 Company-Wise Revenue and Product Benchmarking
- 16.5 Production and Service Capacity Benchmarking
- 16.6 Technology, Pricing and Differentiation
- 16.7 Regional Footprint and Distribution Strength
- 16.8 Mergers, Acquisitions and Strategic Alliances
- 16.9 New Entrants and Competitive Threats
- 16.10 Porter's Five Forces and Industry Attractiveness
- 16.11 Competitive Outlook, 2025-2035
Chapter 17 Company Profiles
- 17.1 Company Coverage and Selection Criteria
- 17.2 Bosch eBike Systems
- 17.2.1 Business Description
- 17.2.2 Company Ownership and Geographic Presence
- 17.2.3 Product and Service Portfolio
- 17.2.4 Manufacturing and Operating Footprint
- 17.2.5 Production Capacity and Expansion Plans
- 17.2.6 Financial Performance and Investment
- 17.2.7 Market Share and Competitive Position
- 17.2.8 Technology and Innovation Capabilities
- 17.2.9 Strategic Alliances or Partnerships
- 17.2.10 Recent Developments
- 17.2.11 Growth Strategy and Outlook
- 17.3 Shimano
- 17.4 Yamaha
- 17.5 Panasonic
- 17.6 Liofit
- 17.7 VoltR
- 17.8 Heskon
- 17.9 Other Relevant Market Participants
Note: Every listed company is profiled on the structure shown under the first company. The company list is preliminary and may change based on research findings, market developments, data availability and client requirements.
Chapter 18 Disclaimer
- 18.1 Research and Forecast Disclaimer
- 18.2 Data Source and Estimation Limitations
Note: The depth of individual sections depends on data availability for this market. Volume, capacity, trade and other unit-based metrics are included where applicable.