
U.S. play spending shifts from boxes to services
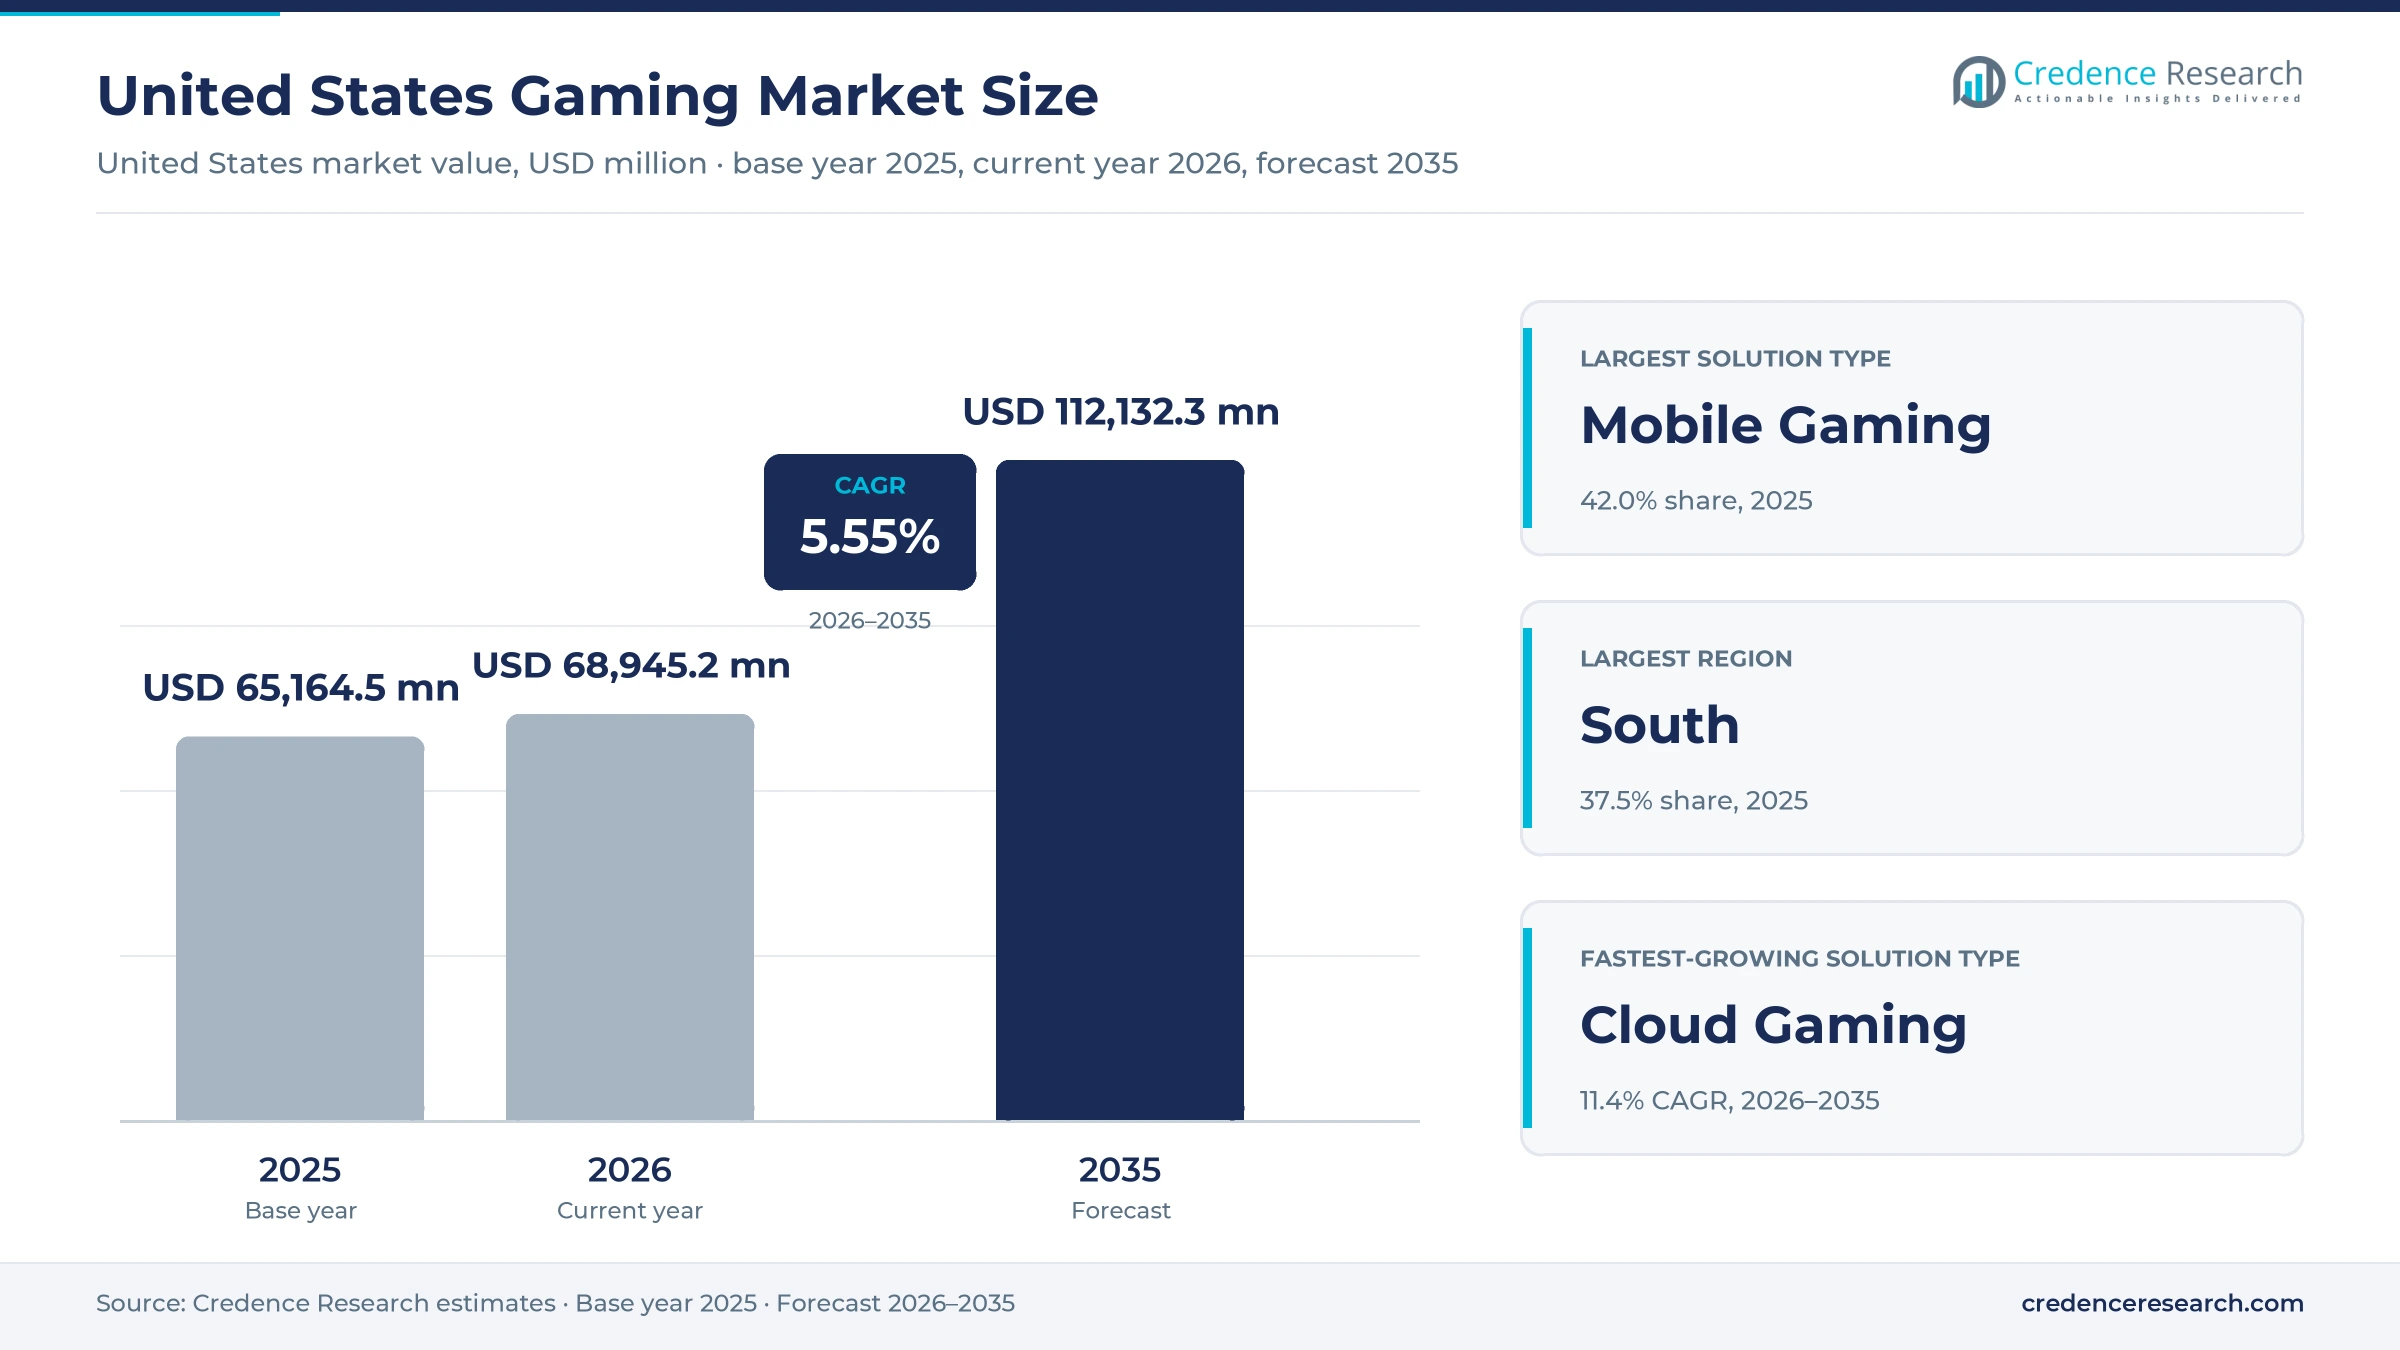
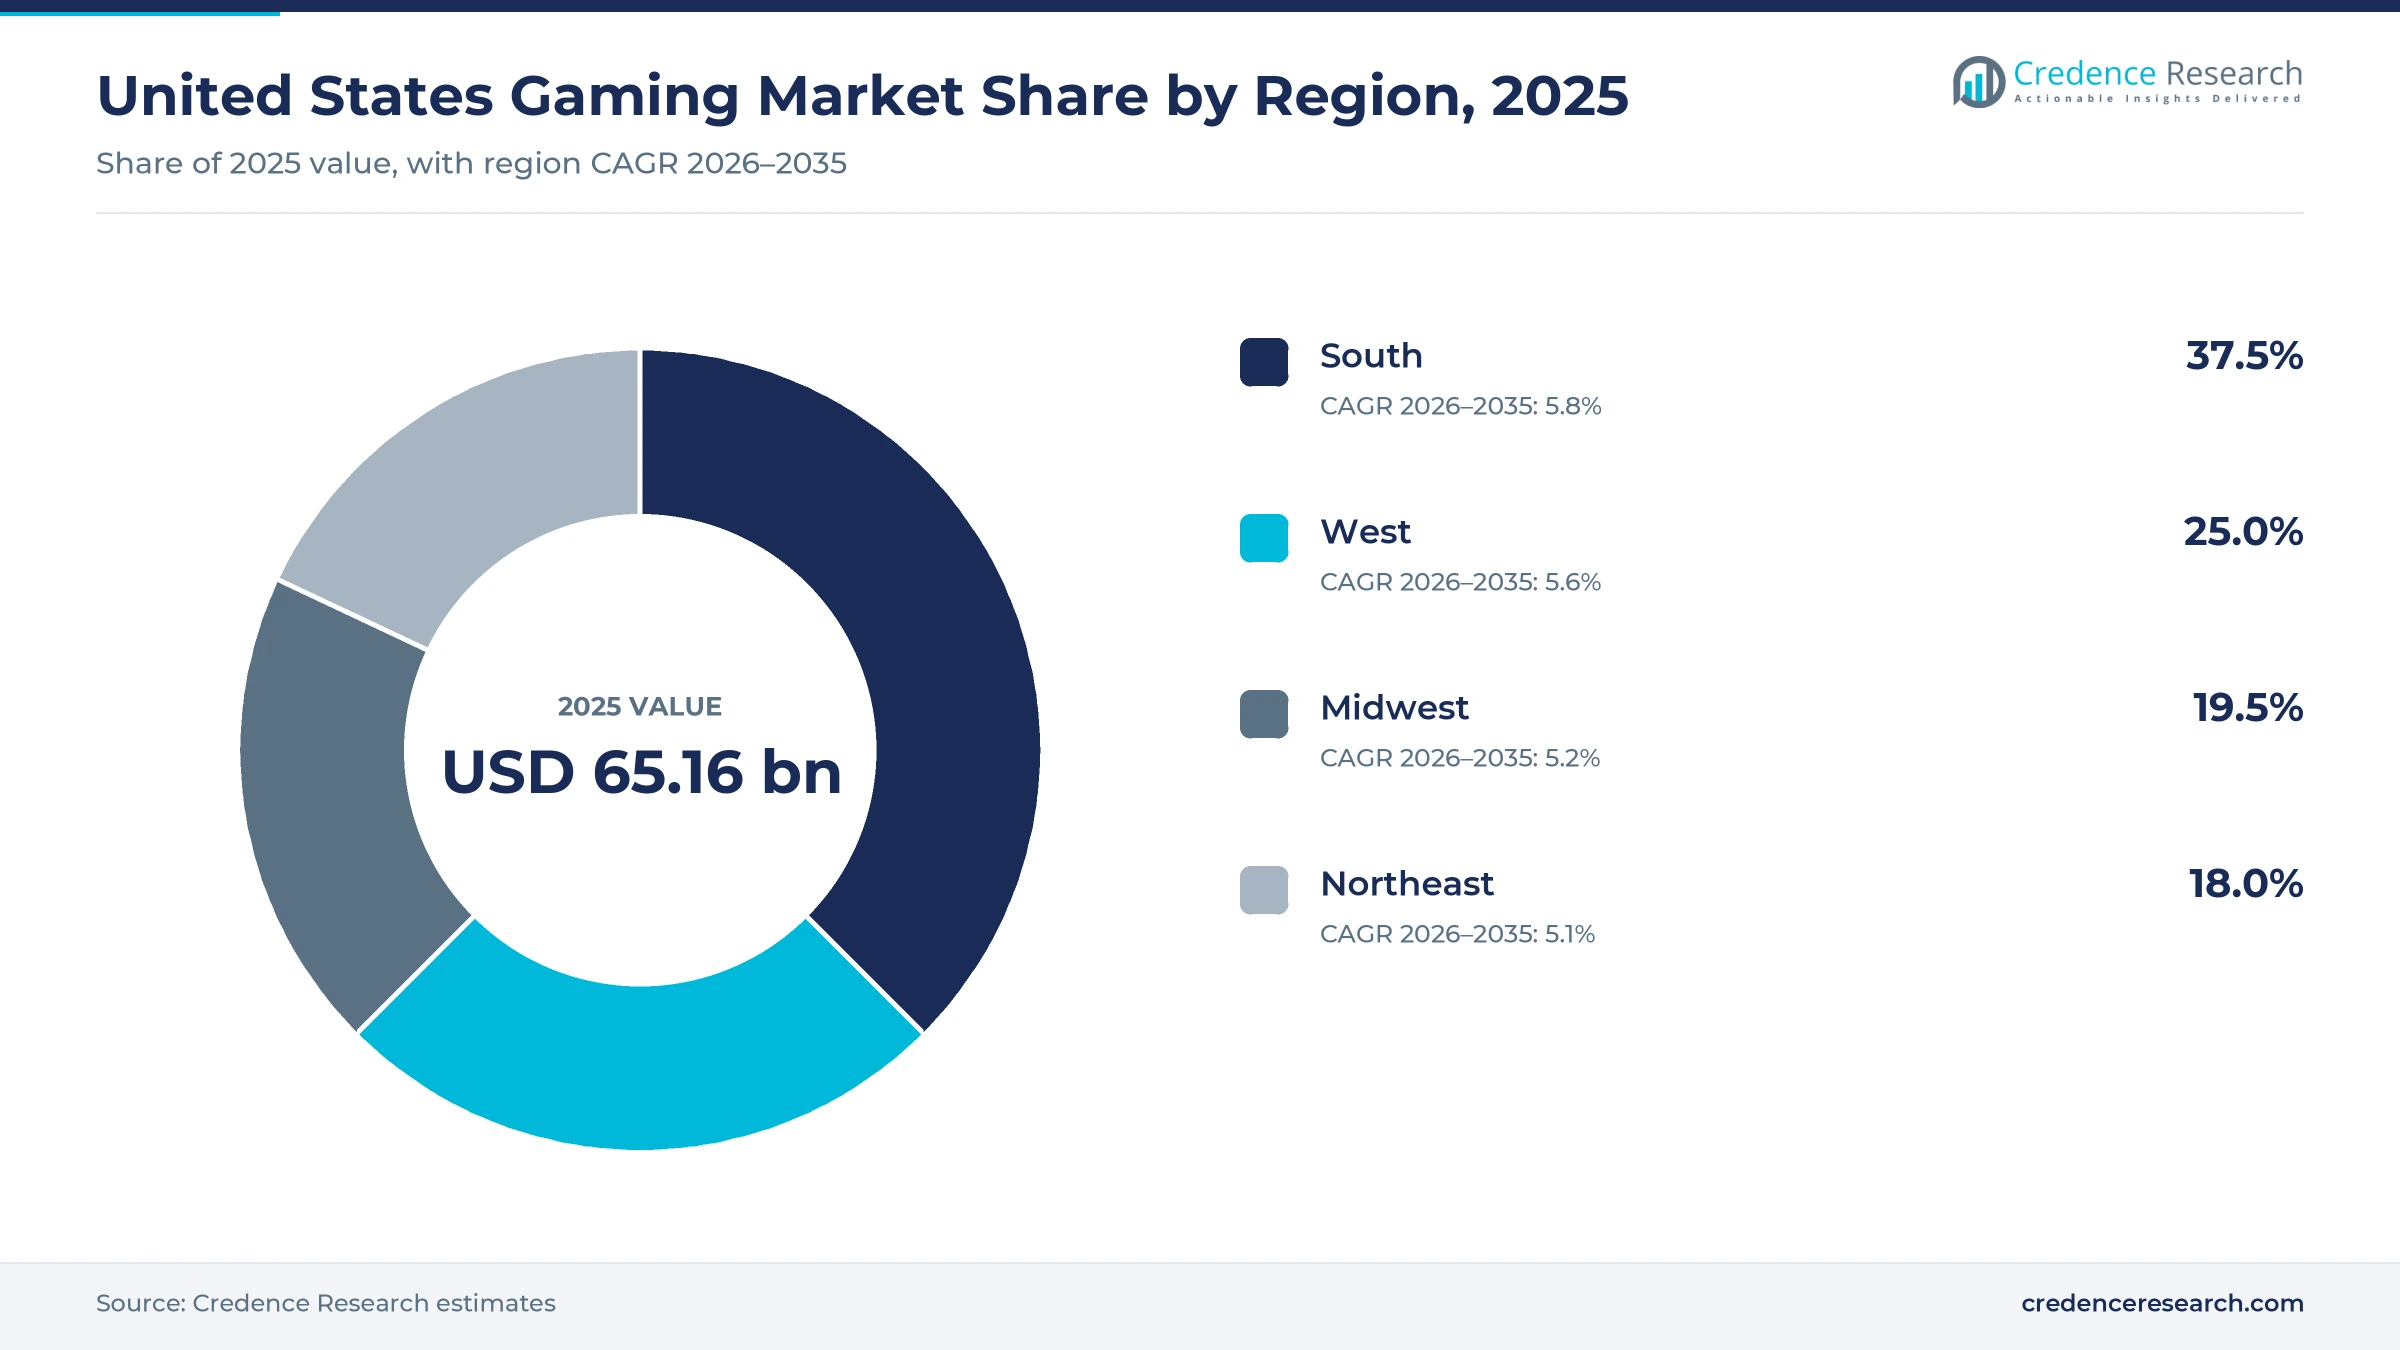
The United States gaming market was valued at USD 65.16 billion in 2025 and is projected to increase from USD 68.95 billion in 2026 to USD 112.13 billion by 2035, registering a CAGR of 5.55% during 2026–2035. Spending is driven by mobile play, by premium console and PC releases such as Grand Theft Auto VI, and by subscription plans that bundle large libraries for a monthly fee. The South held the largest regional share, 37.5% in 2025, and it is also the fastest-growing region at 5.8% a year as its population and household base keep expanding. Hardware is the weak spot, because memory and tariff costs pushed console prices to record levels in 2026 and buyers responded by delaying upgrades. Court-ordered changes to Apple and Google payment rules now let publishers send U.S. players to their own web shops, which moves margin away from platform stores. Cloud streaming on upgraded servers is also widening the audience that can play premium titles without owning a console.
Consumer play spending and commercial rights define the market
The market counts consumer spending on video game content, hardware, accessories and subscriptions in the United States, plus advertising, sponsorship and media rights earned from U.S. players and events. Content covers full-game purchases, in-game items and mobile in-app spending sold through console, PC and phone storefronts. Hardware covers consoles, handhelds and peripherals, while cloud streaming fees and esports income are counted in their own segments.
Casino gaming and real-money betting are outside the scope, as are general-purpose PCs, phones and TVs bought mainly for other uses. The value chain runs from studios and publishers through platform owners that operate stores and set commissions, to retailers, telecom carriers and streaming providers that deliver play into U.S. homes.
United States Gaming Market Insights
- The United States gaming market grows from USD 65.16 billion in 2025 to USD 112.13 billion by 2035 at a 5.55% CAGR, led by services and software rather than hardware units.
- The South held the largest regional share at 37.5% in 2025 and also grows fastest, helped by population growth of 6.0% since 2020.
- Mobile Gaming led solution types with 42.0% in 2025, while Cloud Gaming is the fastest-growing solution type at 11.4% a year to 2035.
- Court orders against Apple and Google in 2025 let publishers send U.S. players to their own web shops, moving margin away from platform stores.
- Console prices reached records in 2026, with the standard PS5 at $649.99 from April 2, 2026, and Xbox unit sales fell 33% through August.
Mobile leads while cloud play and direct stores grow fastest
Mobile play holds the largest share as cloud play scales
Based on solution type, the market is categorized into mobile gaming, console gaming, personal computer gaming, esports and cloud gaming. Mobile Gaming led with 42.0% of 2025 value because phones reach the widest audience, and app-store data cited by the ESA put U.S. mobile game consumer spending at $26.7 billion in 2025. Esports is the smallest solution type, since even the Call of Duty League Championship carried only a $2 million prize pool. Cloud Gaming grows fastest at 11.4% a year as Amazon relaunched Luna on Oct. 23, 2025 at no extra cost for Prime members, reaching households without a console.
Transactional content leads while recurring access gains
Based on revenue model, the market is categorized into transactional content, hardware and peripheral sales, recurring access and advertising and commercial rights. Transactional Content led with 68.0% of 2025 value because most player outlays go to games and in-game items, and the ESA reported $52.4 billion of U.S. content spending out of $60.8 billion in 2025. Netting out about $8 billion of subscriptions leaves roughly $44 billion of transactional spending, while hardware and accessories add about $8.3 billion and advertising and commercial rights about $4 billion, the basis of the Credence Research splits. Recurring Access grows fastest at 7.5% a year as Microsoft rebuilt Game Pass Ultimate on Oct. 1, 2025 with more bundled content.
Platform stores dominate as direct web shops open up
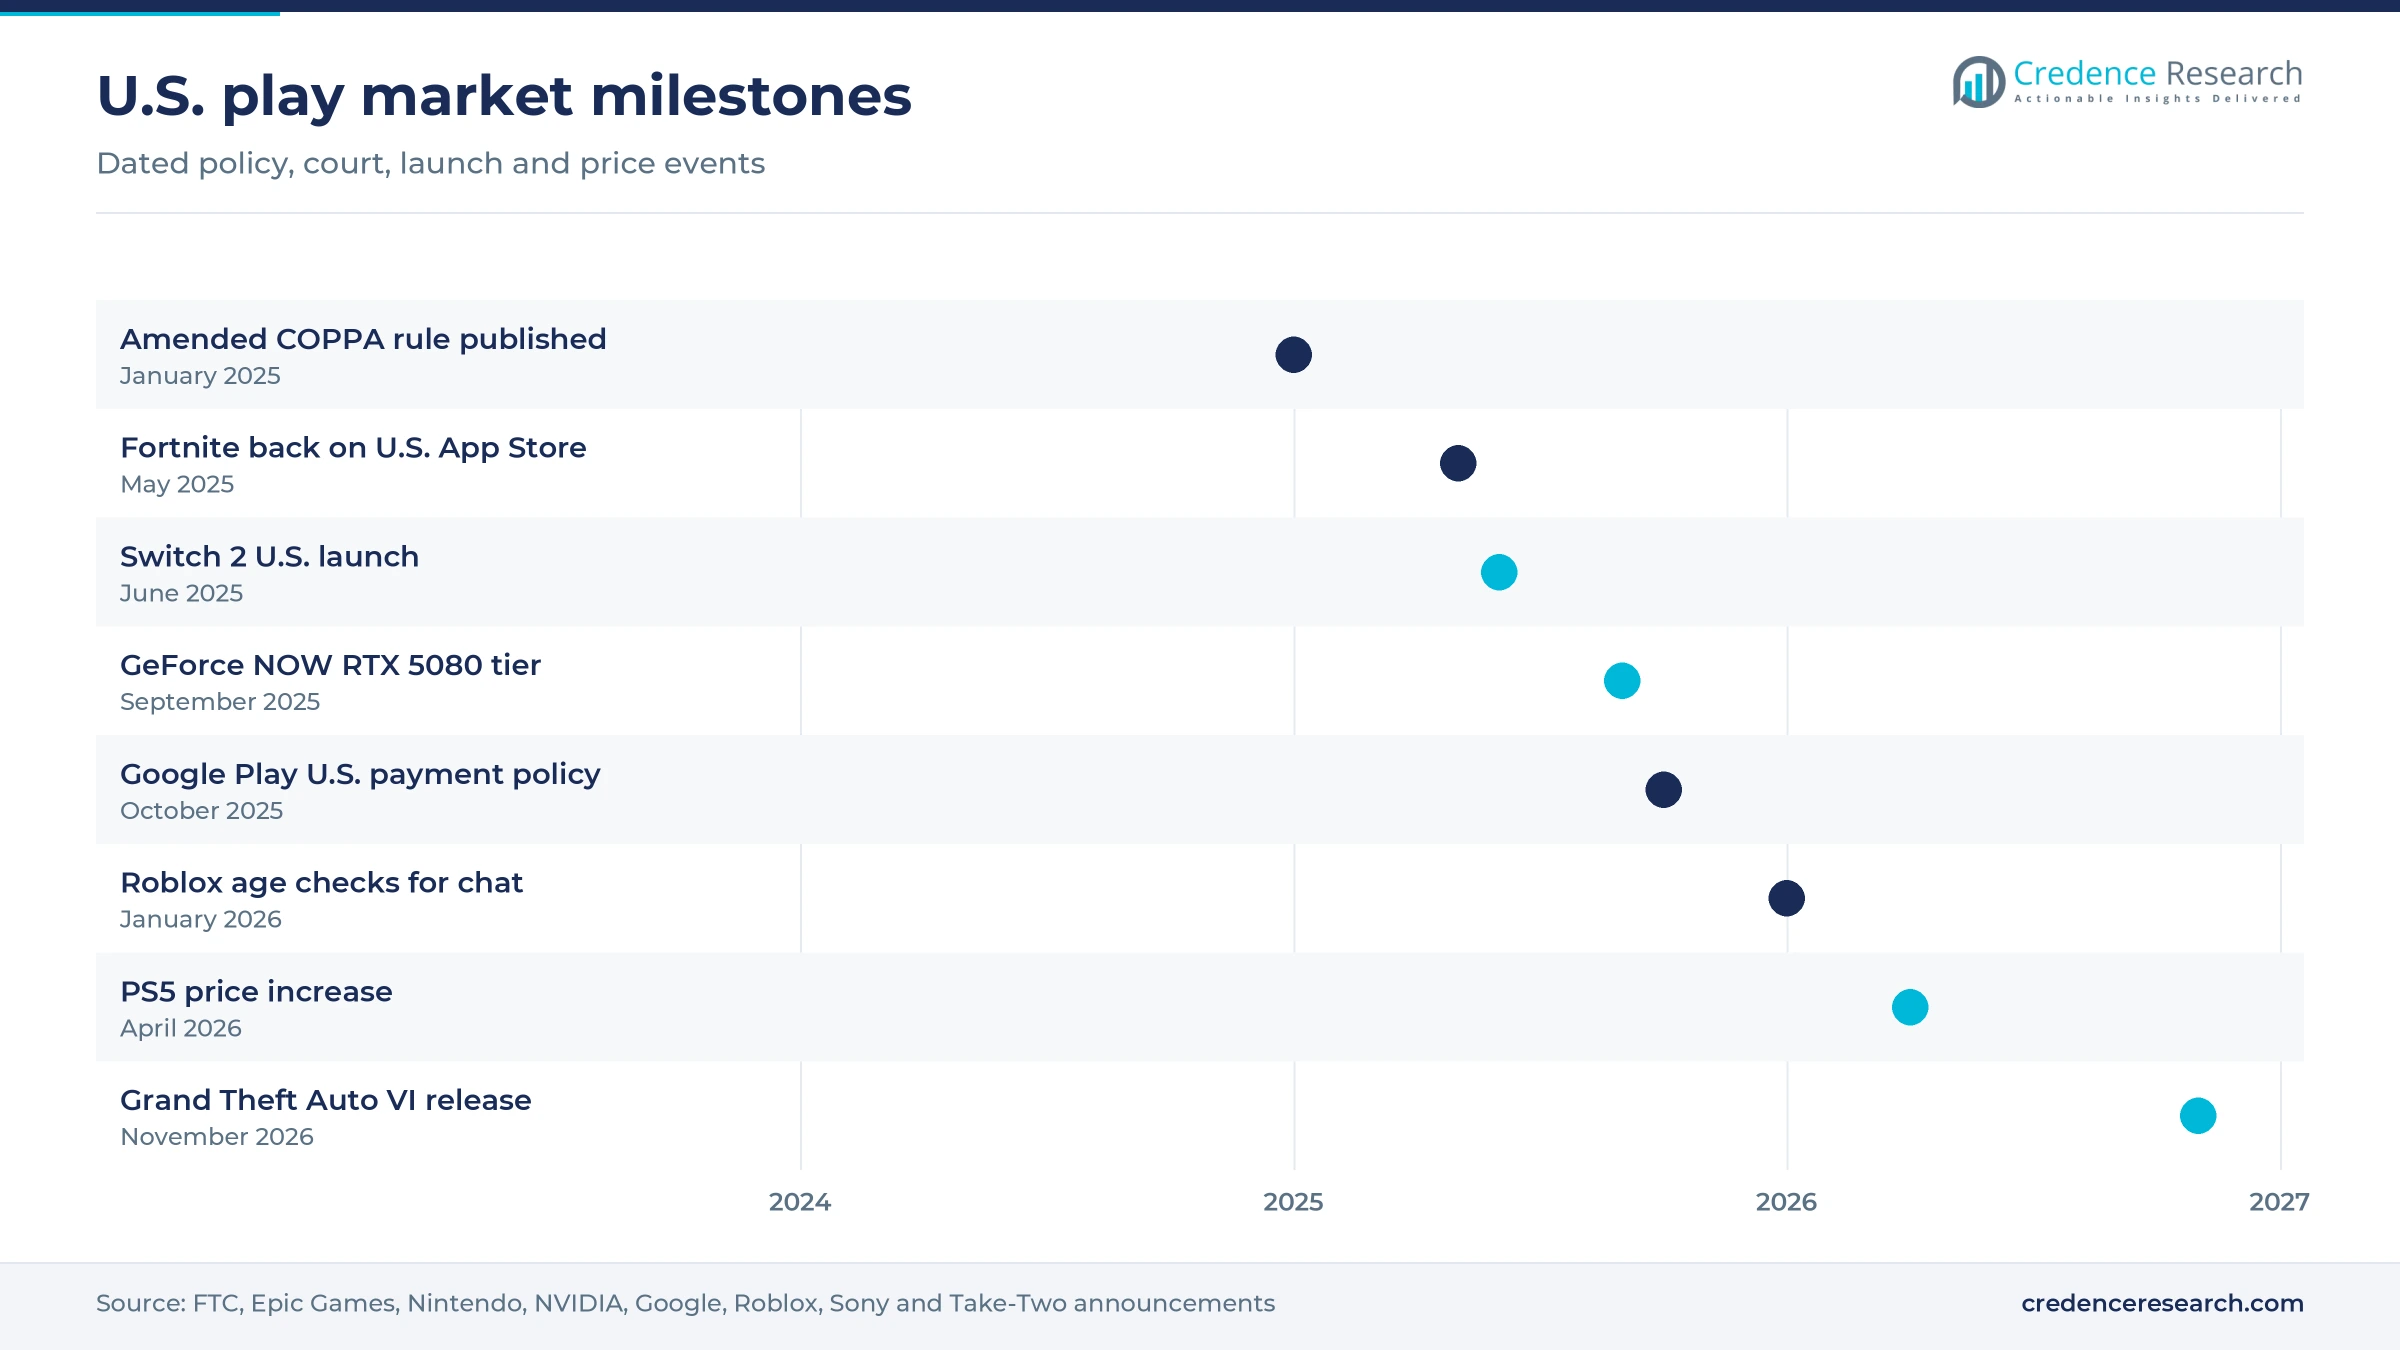
Based on distribution channel, the market is categorized into platform stores, publisher direct, physical retail and commercial contracts. Platform Stores led with 67.5% of 2025 value because console makers, Apple, Google and Valve control where most digital purchases happen, and Apple still charged a 27% commission on outside purchases until a federal court order of May 19, 2025. Publisher Direct grows fastest at 8.1% a year as Google Play began allowing U.S. developers to use their own payment systems on Oct. 29, 2025. Web shops let publishers keep more margin and price below store levels.
Young adults spend most while older players grow fastest
Based on end user, the market is categorized into players aged 5–17, players aged 18–34, players aged 35–54, and players aged 55 and above. Players Aged 18–34 led with 38.0% of 2025 value because young adults buy most premium releases, live-service items and peripherals, and the ESA puts the average U.S. player at 36 with 18 years of play behind them. Players Aged 55 and Above grow fastest at 6.7% a year as 49% of boomers aged 61 to 79 now play, according to the ESA survey of June 2025. Older players lean toward puzzle, card and mobile titles, which supports mobile and subscription revenue.
| Segment Group | Leading Sub-segment | Share, 2025 | Fastest-growing Sub-segment | CAGR, 2026–2035 |
|---|---|---|---|---|
| By Solution Type | Mobile Gaming | 42.0% | Cloud Gaming | 11.4% |
| By Revenue Model | Transactional Content | 68.0% | Recurring Access | 7.5% |
| By Distribution Channel | Platform Stores | 67.5% | Publisher Direct | 8.1% |
| By End User | Players Aged 18–34 | 38.0% | Players Aged 55 and Above | 6.7% |
Console prices climb as subscription fees reset upward
U.S. hardware is priced to build an installed base, and platform owners recover margin later through store commissions, subscriptions and add-on content. That model is under strain because memory and tariff costs have pushed sticker prices up several times since 2025, and the average price paid for new hardware reached a record $541 in August 2026, according to retail tracking reported by Gaming.net. Subscription fees are moving in the same direction, although tiered plans keep lower entry prices for value buyers. Higher hardware prices favor publishers that sell on every device, while cloud services win buyers who will not pay for a new console.
| Offer | Typical price or fee | Basis |
|---|---|---|
| Xbox Game Pass Ultimate | USD 29.99 a month from Oct. 1, 2025, up from USD 19.99 | Microsoft, via Game Informer, October 2025 |
| PlayStation Plus Essential, new members | USD 10.99 a month from May 20, 2026 | Sony, via Hypebeast, May 2026 |
| GeForce NOW Ultimate | USD 19.99 a month or USD 199.99 a year | NVIDIA, August 2025 |
| PlayStation 5 standard console | USD 649.99 from April 2, 2026, up from USD 549.99 | Sony, via The Outer Haven, March 2026 |
| Nintendo Switch 2 | USD 499.99 from Sept. 1, 2026 | Nintendo, via NewsNation, May 2026 |
| Steam Machine, 512GB, no controller | USD 1,049 | Valve, via PCWorld, June 2026 |
Request a Free Sample
Fill in your details and we'll send you a free sample report.
- Sample data tables & charts
- Research methodology
Subscriptions, big releases and streaming lift spending
Recurring access plans pull budgets into subscriptions
Subscription plans are taking a larger share of U.S. play budgets because they bundle large libraries and new releases for a fixed monthly fee. The ESA reported that U.S. subscription spending grew 20% in 2025, far ahead of total consumer spending, which rose only about 1% that year. Sony raised PlayStation Plus Essential to $10.99 a month for new members on May 20, 2026, while existing subscribers kept their rates, a sign that it expects churn to stay low. Online multiplayer on PlayStation and Xbox requires a paid plan, and the ESA found that nearly 90% of U.S. players use some form of online play. Recurring Access is the fastest-growing revenue model at 7.5% a year, and publishers that license catalogs to these plans earn steady fees between launches.
Premium releases and new hardware reset spending cycles
Large releases and new devices create the spending peaks that define U.S. console and PC demand. Nintendo's Switch 2 sold about 1.6 million U.S. units in June 2025, a launch-month record, and lifted June hardware spending to $978 million, according to retail tracking reported by Video Games Chronicle. Take-Two confirmed on May 21, 2026 that Grand Theft Auto VI will release on Nov. 19, 2026, in the first year of the forecast. Valve began selling its Steam Machine on June 25, 2026, giving PC players a living-room device of their own. Each launch pulls hardware, full-price software and add-on spending into a few months, so year-to-year growth stays uneven even when the long-run rate is steady.
Cross-device services reach players without new consoles
Services that follow players across phones, TVs, PCs and handhelds widen the paying audience beyond console owners. NVIDIA moved GeForce NOW Ultimate to RTX 5080-class servers in September 2025 and added Install-to-Play, which expanded its library to nearly 4,500 titles. The FCC broadband report of August 2026 found that 96.9% of Americans had fixed 100/20 Mbps service available as of June 2025, enough for high-quality streaming. The same report found that almost 95% of homes and businesses are covered by 5G at 35/3 Mbps. Cloud Gaming grows at 11.4% a year, and publishers that release on every screen collect more of the time players spend away from the living room.
Family co-play builds households with several players
Play is increasingly shared across generations inside U.S. homes, which raises the number of paying accounts and devices per household. The ESA Essential Facts report of May 2024 found that 72% of American parents play video games and that 83% of those parents play with their children. The ESA survey of June 2025 added that 83% of Generation Alpha children play every week. Parents who play with their children most often say the main reason is fun for the whole family, according to the same survey. These habits favor family-rated franchises, local multiplayer and shared subscription plans, and they help explain why young adults and parents in their 30s and 40s carry most of the spending.
Direct payments, age checks and live events reshape play
Direct payment links shift spending to publisher web shops
Court rulings against Apple and Google are moving part of U.S. mobile game spending from platform checkouts to publisher web shops. The shift became visible when Epic Games returned Fortnite to the U.S. App Store on May 20, 2025, a day after the order that ended Apple's fee on outside purchases. Google Play's U.S. policy, in force from Oct. 29, 2025 to Nov. 1, 2027, lets developers link players to their own sites and charge less there than through Google's billing. Eligibility is limited to users identified as U.S.-based by IP address, SIM card or account country, which makes the gain specific to this market. Publishers with strong brands benefit first, because players follow them off-store, while smaller studios still depend on store discovery.
Age checks emerge as the entry ticket to social play
Child privacy and safety rules are turning age assurance into a standard feature of U.S. games with chat and shared worlds. The Federal Trade Commission published its amended COPPA rule on Jan. 16, 2025, and full compliance was due on April 22, 2026. The rule requires separate parental consent before a child's data is shared with third parties, along with a written security program. Roblox made an age check mandatory for chat worldwide on Jan. 7, 2026, after a December rollout in Australia, New Zealand and the Netherlands, and it said it expects other platforms to follow. Players aged 5–17 remain a large spending group, so publishers that build consent and age tools early keep their access to family audiences.
Las Vegas events open a larger commercial rights opportunity
Live competition gives sponsors and media buyers a rare place to reach young adult players in person, and Las Vegas has become the hub for it. Evo 2025 drew 8,541 registered players from 64 countries to Las Vegas on Aug. 1–3, 2025, and more than 90% of attendees came from the United States, according to the organizer. The Call of Duty League Championship booked the Michelob ULTRA Arena at Mandalay Bay for July 16–19, 2026, with a $2 million prize pool and ESL FACEIT Group as production partner. These events sit in the West, which held 25.0% of 2025 value. Organizers that pair professional esports competition with ticketing, sponsorship and streaming rights can grow commercial income faster than prize money.
Private ownership opens room for long development bets
The take-private of Electronic Arts gives one of the largest U.S. publishers room to invest without quarterly market pressure, which creates an opening for tool and technology suppliers. A consortium of PIF, Silver Lake and Affinity Partners agreed in September 2025 to buy EA for $55 billion, and the deal closed in August 2026 with stockholders paid $210 a share in cash. Silver Lake said it plans to invest in growth, including artificial intelligence for game development, and Andrew Wilson remains chairman and CEO. PIF had held a minority stake in EA for more than five years, and EA shares were removed from Nasdaq after the closing. Suppliers of engines, development tools and live-service technology gain a well-funded buyer, and rival publishers face a competitor able to fund multi-year franchise plans.
Console price hikes and cost pressure slow hardware demand
Record console prices cut unit sales
Console prices have risen faster than player budgets, and unit sales are falling as a result. Sony raised the standard PS5 to $649.99 on April 2, 2026, its second U.S. increase since August 2025. Retail tracking reported by Gaming.net showed Xbox unit sales down 33% and PlayStation down 25% in 2026 through August. Hardware makers face a smaller new installed base, and publishers that depend on console launches may see slower uptake of new titles.
Memory and tariff costs squeeze hardware margins
Component costs are rising because AI data centers are absorbing memory supply, and tariffs add to the bill. Nintendo expects memory and tariffs to add $638 million in costs this financial year, and it raised the U.S. Switch 2 price by $50 on Sept. 1, 2026. Microsoft had already raised the Xbox Series X to $649.99 on Oct. 3, 2025, its second U.S. increase that year. Hardware makers must choose between thinner margins and slower sales, and accessory makers face the same memory costs.
Value-seeking buyers delay full-price purchases
Higher prices are changing how U.S. players buy software, not only hardware. If costs rise because of tariffs or other factors, 38% of consumers would buy fewer full-price games at launch and 34% would wait longer for sales, according to a consumer survey reported by GamesMarket in February 2026. Another 27% of consumers would spend more time on free-to-play games. Publishers of premium titles lose launch-window revenue, so deeper discounts and earlier bundling into subscriptions become more likely.
Mandatory age checks weigh on youth engagement
Safety tools reduce risk for parents but add friction for players and cost for platforms. Roblox reported on Oct. 29, 2026 that global daily active users fell 9% from a year earlier to 138 million, and hours engaged fell 15%. By then 64% of its daily users had completed an age check under the chat rule described above. Platforms serving children must absorb compliance costs and slower social growth, while smaller studios lack the budget for in-house age assurance.
The South leads on population and child growth
| Region | Value, 2025 (USD billion) | Share, 2025 | CAGR, 2026–2035 |
|---|---|---|---|
| South | 24.44 | 37.5% | 5.8% |
| West | 16.29 | 25.0% | 5.6% |
| Midwest | 12.71 | 19.5% | 5.2% |
| Northeast | 11.73 | 18.0% | 5.1% |
The South leads with the fastest population growth
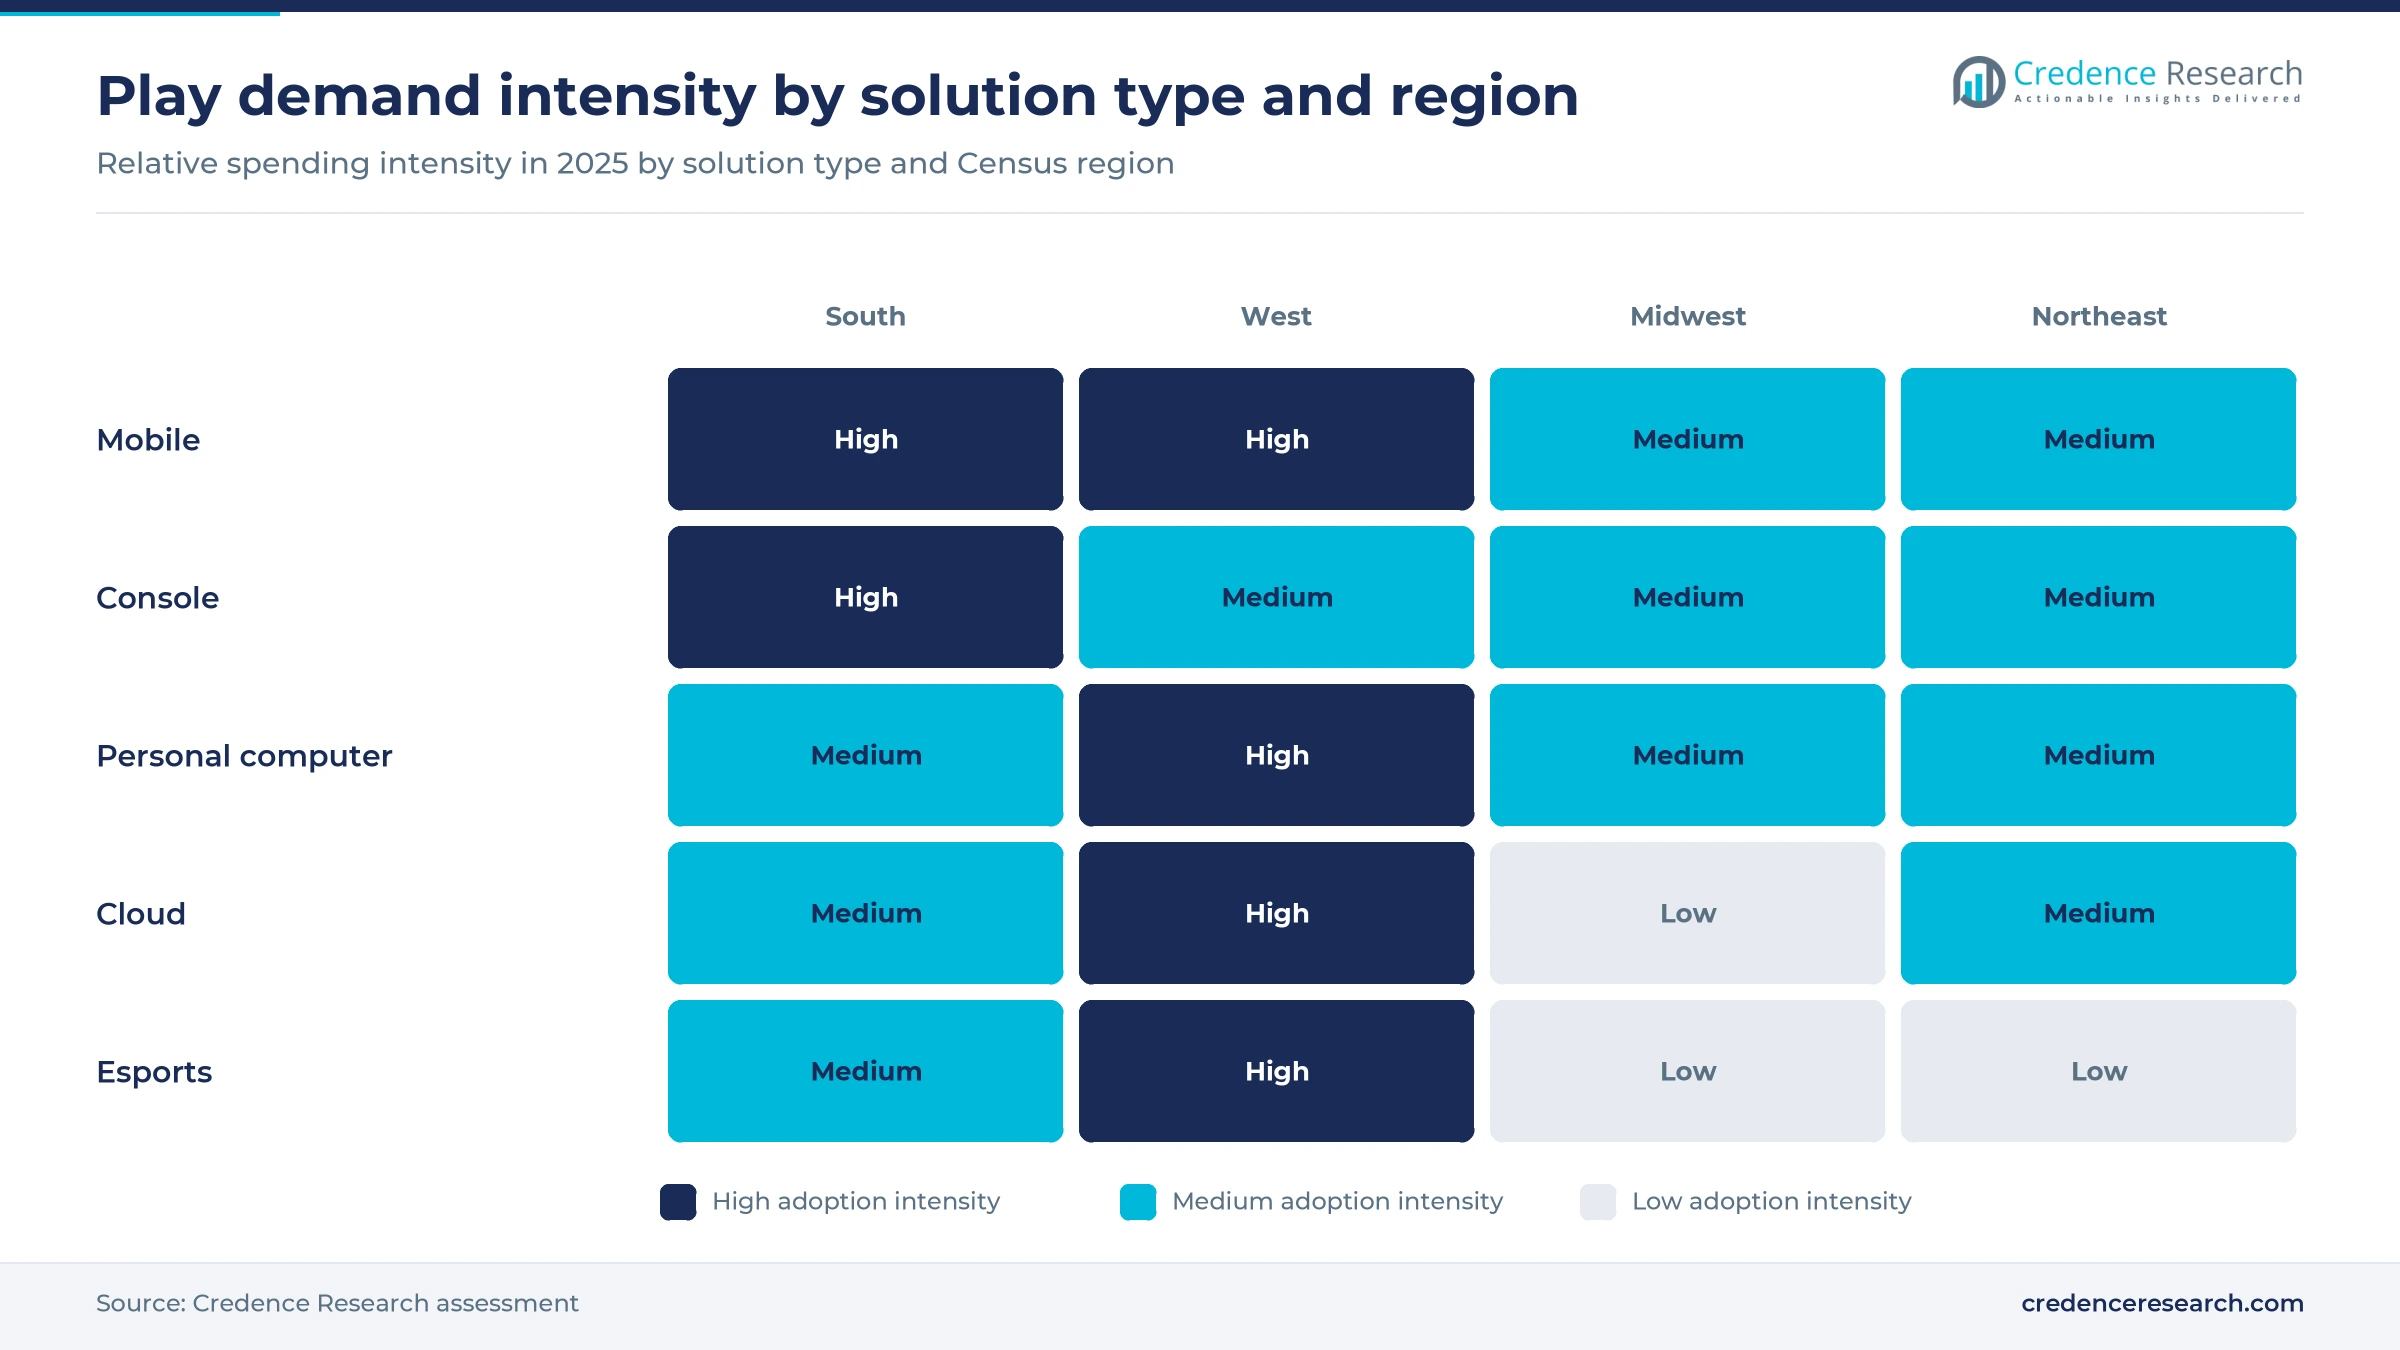
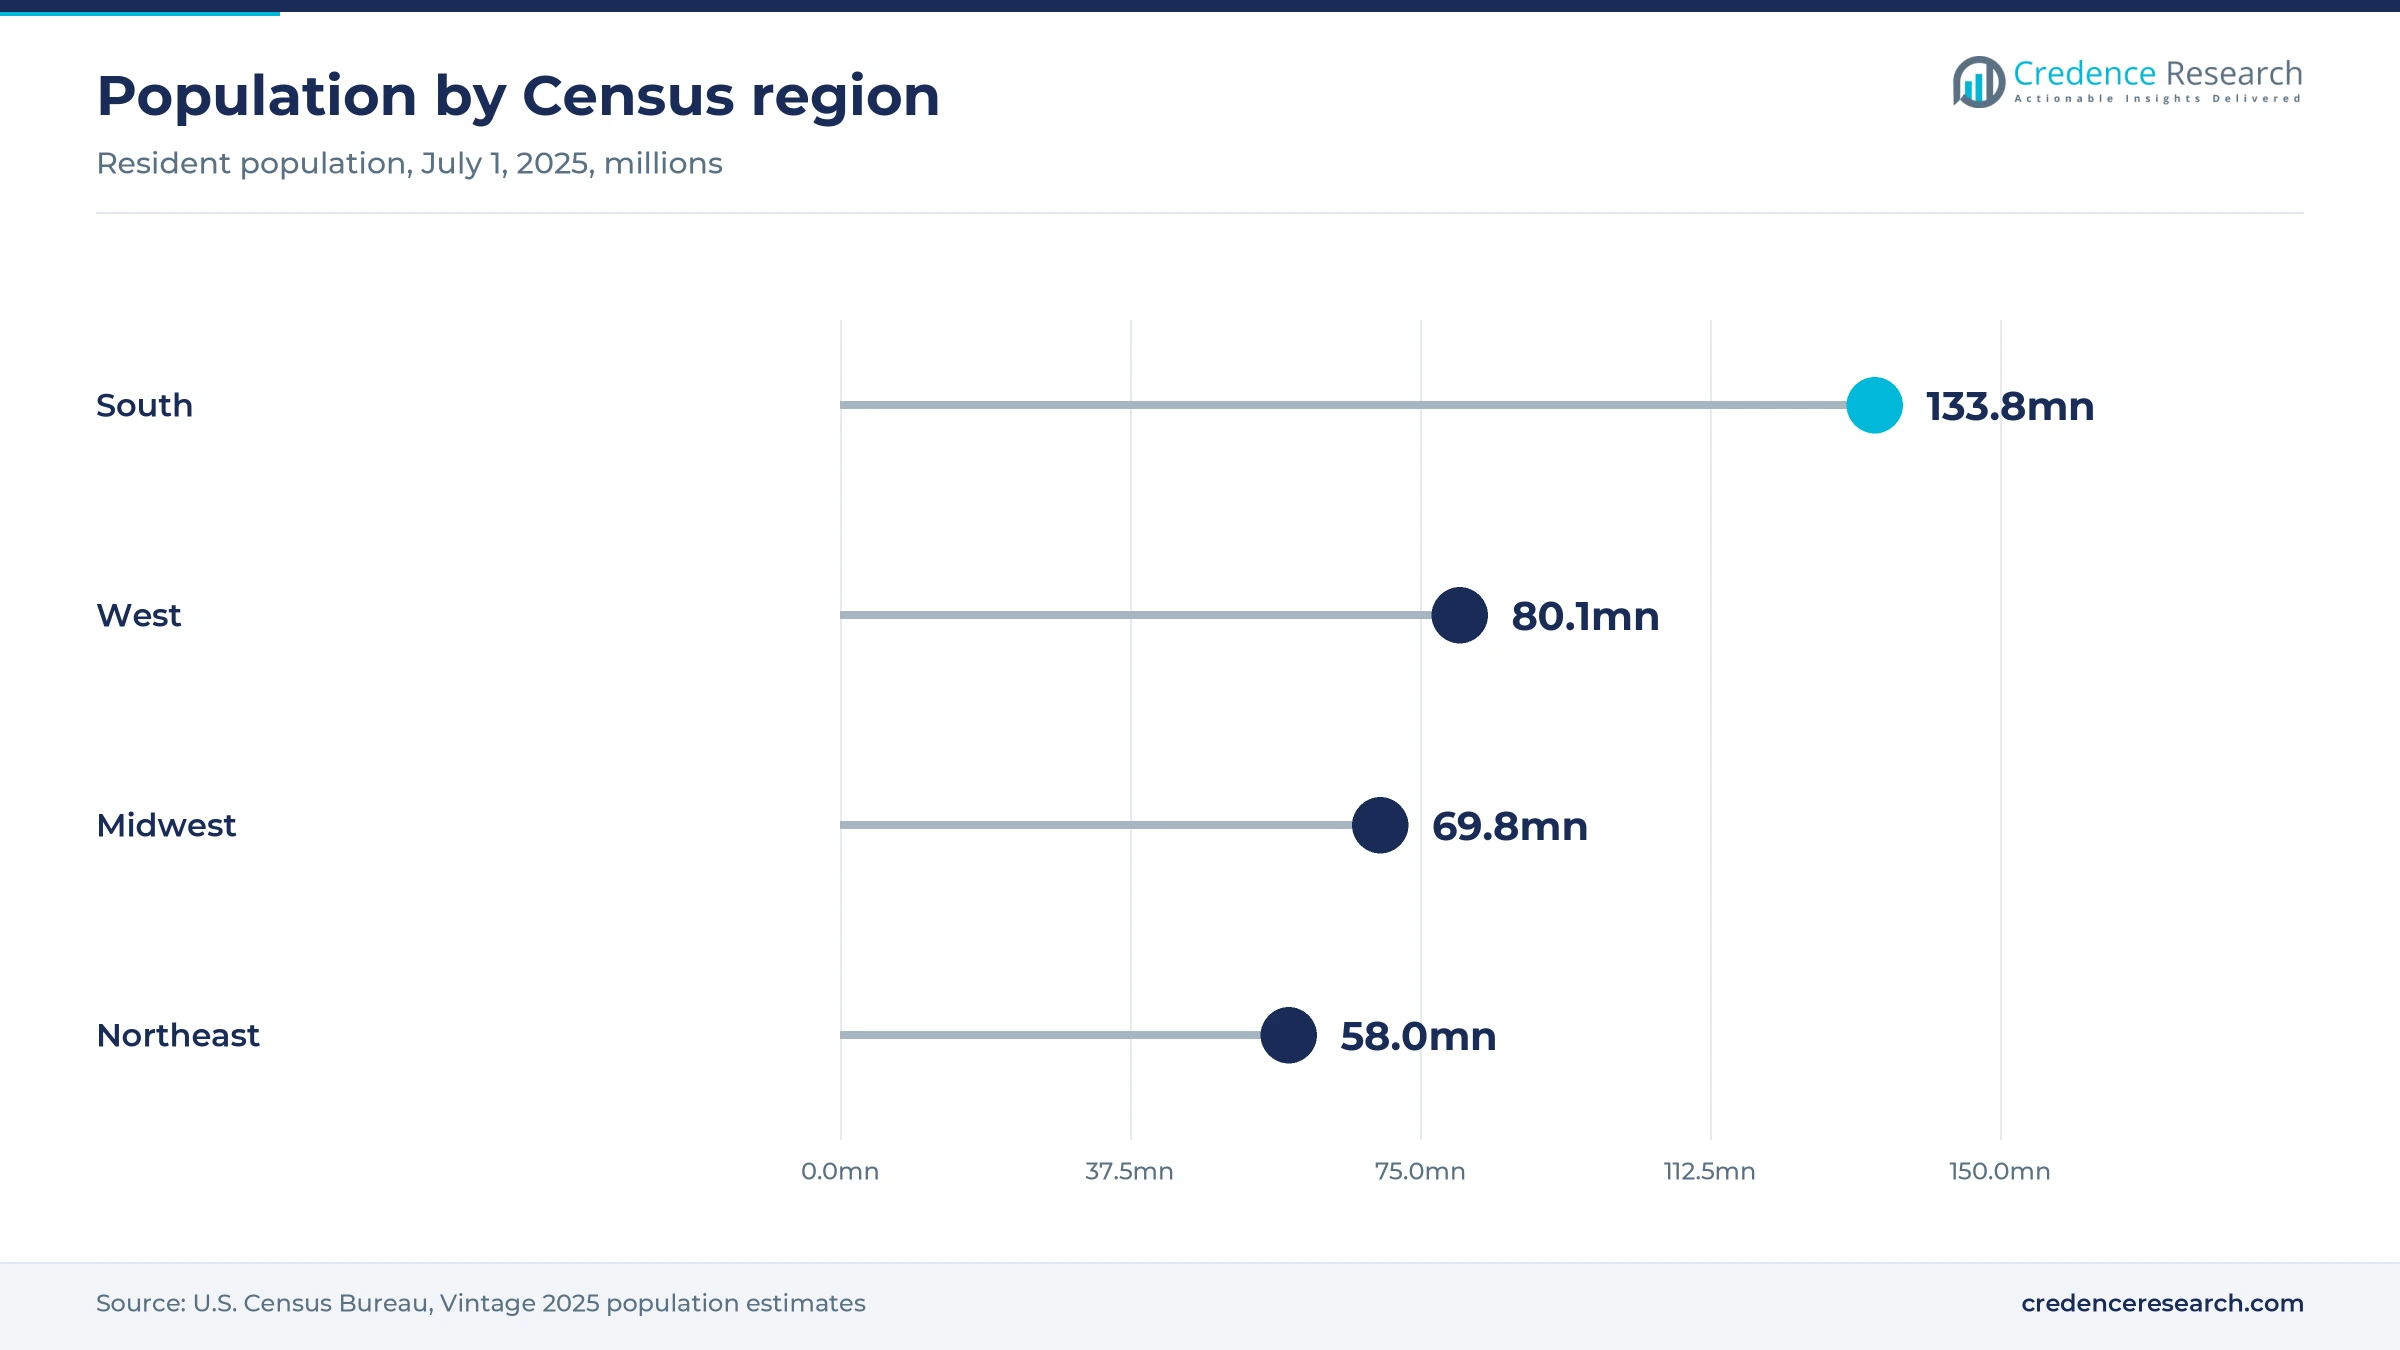
The South held 37.5% of 2025 value and grows at 5.8% a year, the fastest of the four regions. Census Bureau estimates put the South's population at 133.8 million in July 2025, up 6.0% since 2020. It was also the only region where the child population grew, rising 1.1% to about 29.0 million. New households in southern metros bring new console, phone and broadband connections every year. Retailers and carriers that serve these suburbs sell to the largest and fastest-growing pool of family players.
The West shifts toward adult and premium PC play
The West held 25.0% of 2025 value and grows at 5.6% a year, close to the national rate. Its population reached 80.1 million in 2025, up 1.9% since 2020, according to the Census Bureau. However, the West recorded the largest regional fall in children, down 5.7%, which tilts its demand toward adult players, premium PC hardware and streaming. The Las Vegas events noted above also keep the region central to live competition and the commercial rights it generates.
The Midwest grows slowly on a stable household base
The Midwest held 19.5% of 2025 value and grows at 5.2% a year. Its population rose 1.1% from 2020 to 69.8 million in 2025, while the number of children fell 3.9%, according to the Census Bureau. Slower household formation keeps growth below the national rate, but the broadband gains noted in the drivers make cloud and subscription play viable in smaller towns. In the Credence Research model, physical retail and value hardware keep a larger role here than in coastal markets.
The Northeast relies on existing adult players
The Northeast held 18.0% of 2025 value and grows at 5.1% a year, the slowest of the four regions. Its population of 58.0 million in 2025 was only 0.7% above the 2020 level, and the child population fell 4.1%, according to the Census Bureau. Dense metros and high incomes support spending per player, but a shrinking youth base limits new accounts. Publishers gain more here by raising engagement among adult players than by acquiring new ones.
Launches, relaunches and a take-private reset the field
| Development | Status and market relevance |
|---|---|
| In June 2025, Nintendo launched Switch 2 in the United States and sold about 1.6 million units in its launch month. | Launched; record U.S. launch month |
| In October 2025, Amazon relaunched Luna with GameNight party games and access for Prime members at no extra cost. | Live; widens cloud reach |
| In January 2026, Roblox made age checks mandatory for chat for all users worldwide. | In force; sets a safety benchmark |
| In August 2026, a consortium of PIF, Silver Lake and Affinity Partners completed its $55 billion acquisition of Electronic Arts. | Closed; EA delisted from Nasdaq |
Local, connected, cross-platform and cloud play compete
- Local rendering on consoles, PCs and handhelds still carries most premium play, and it pulls along peripherals such as headsets, controllers and monitors.
- Connected multiplayer turns most titles into online services, which lets publishers sell seasons, items and passes long after launch.
- Cross-platform ecosystems let one account and one purchase follow a player across phone, PC and console, which raises the value of franchises such as Fortnite and Roblox.
- Cloud streaming moves rendering into data centers that depend on cloud back-end services, so a phone or TV can run a premium title.
Need a Custom Version of This Report?
Tailor the scope, geography, or segments to your exact requirements.
- Custom geography or segment scope
- Direct access to our analyst team
Platform owners and a few publishers set U.S. terms
Competition in the U.S. market runs on two levels, platforms and franchises. Sony, Microsoft and Nintendo compete on hardware prices, exclusive titles and subscription value, while Valve's Steam and its new Steam Machine anchor PC play. Take-Two, Electronic Arts and Microsoft's studios compete for the largest console and PC releases, and Grand Theft Auto VI is the biggest launch of 2026. Roblox and Epic Games compete for younger players through user-created worlds and cross-platform play, and both now face stricter age and consent rules. NVIDIA and Amazon compete in streaming, with NVIDIA selling performance tiers and Amazon bundling Luna into Prime. Pricing power is shifting toward companies that own both a store and a subscription, because they can trade hardware margin for recurring revenue. Many of these franchises sell worldwide, so U.S. pricing decisions shape worldwide video game publishing strategy.
Stores are concentrated while franchises are spread out
The U.S. market is concentrated at the platform layer and more fragmented in content. Sony, Microsoft and Nintendo control console stores, Apple and Google control phone storefronts, and Valve runs the leading PC store, so a small group sets commissions, certification rules and featuring. Publishing is broader, but a handful of groups, including Take-Two, Electronic Arts, Microsoft's studios, Roblox and Epic Games, own most of the franchises that drive spending. Barriers to entry are high for hardware and large franchises and low for mobile and independent PC titles. Margins sit with store owners and owners of hit franchises, while hardware makers and retailers earn thin returns.
Companies profiled and their roles in this market
| Company | Type | Role in the market |
|---|---|---|
| Sony Interactive Entertainment | Platform owner and publisher | Sells PS5 hardware and PlayStation Plus; raised U.S. console prices in August 2025 and April 2026 |
| Microsoft Gaming | Platform owner and publisher | Runs Xbox hardware and Game Pass, which it restructured in October 2025 |
| Take-Two Interactive | Publisher | Releases Grand Theft Auto VI on Nov. 19, 2026 |
| Nintendo | Platform owner and publisher | Sells Switch 2, the U.S. hardware leader in 2026 through August |
| Electronic Arts | Publisher | Taken private by a PIF, Silver Lake and Affinity Partners consortium in August 2026 |
| Valve | PC store and hardware | Runs Steam and began selling the Steam Machine in June 2026 |
| Roblox Corporation | User-created content platform | Requires age checks for chat since January 2026 |
| Epic Games | Publisher and engine developer | Returned Fortnite to the U.S. App Store in May 2025 |
| NVIDIA GeForce NOW | Cloud streaming service | Moved its Ultimate tier to RTX 5080-class servers in September 2025 |
| Amazon Luna | Cloud streaming service | Relaunched in October 2025 at no extra cost for Prime members |
Services, not consoles, carry U.S. growth to 2035
Credence Research's view is that U.S. growth to 2035 will come from services and software rather than from hardware units. The 2026 console price increases show that hardware makers can no longer absorb component costs, so the installed base will grow more slowly than in past cycles. Subscriptions, cloud streaming and direct web shops let publishers reach players on devices they already own and keep more of each dollar. The companies best placed are those that own franchises and sell on every screen, while hardware-dependent retailers face the slowest growth.
ESA spending data anchors the Credence Research model
The report uses 2025 as the base year and 2026 to 2035 as the forecast period. Market values come from the Credence Research model, which starts from U.S. consumer spending on content, hardware, accessories and subscriptions published by the ESA and adds advertising, sponsorship and media rights. Segment and regional splits are Credence Research estimates built from Census Bureau population data, the FCC broadband report, ESA player surveys, company announcements and filings, and trade press. No interviews or primary surveys were conducted for this edition of the report.
A slower hardware cycle and rising services shape 2035
The United States gaming market is expected to grow from USD 68.95 billion in 2026 to USD 112.13 billion by 2035 at a 5.55% CAGR. Growth will be uneven, with peaks in launch years such as 2026 and softer years when hardware prices bite. Mobile play will keep the largest share, while cloud play and direct publisher sales gain the most ground. The South will add the most new players as its population grows. By 2035, recurring access and cross-platform accounts are likely to matter more to publisher strategy than the timing of the next console generation.
Hardware costs and services decide the 2035 range
The range of outcomes depends mostly on how long memory and tariff costs keep console prices high, and on how fast subscriptions and cloud play replace lost hardware spending. A downside case assumes prolonged price increases and weaker launch-window sales. The base case assumes hardware costs ease after 2027 while services keep growing. An upside case needs a strong release slate after Grand Theft Auto VI, wider direct-payment savings for publishers and faster cloud adoption on improved broadband.
| Scenario | CAGR, 2026–2035 | Value, 2035 | What has to hold |
|---|---|---|---|
| Downside | 4.0% | USD 98.56 billion | Console prices stay high through 2029 and full-price software sales keep falling |
| Base | 5.55% | USD 112.13 billion | Hardware costs ease after 2027 while subscriptions and cloud play keep growing |
| Upside | 6.8% | USD 124.11 billion | A strong release slate, lower store fees and faster cloud adoption lift spending per player |
Frequently Asked Questions
How big is the United States gaming market?
Which solution type leads the United States gaming market?
Which region of the United States leads gaming spending?
Which revenue model grows fastest in U.S. gaming?
How are console price increases affecting the market?
How do the Apple and Google rulings change game distribution?
Who are the key companies in the United States gaming market?
What is the outlook for cloud gaming in the United States?
Table of Content
Chapter 1 Market Segmentation
- 1.1 Segmentation Framework
- 1.1.1 Product and Service Classification
- 1.1.2 Application and End-Use Classification
- 1.1.3 Technology and Solution Classification
- 1.1.4 Customer and Distribution Channel Classification
- 1.1.5 Geographic Segmentation
- 1.1.6 Market Segment Definitions and Boundaries
- 1.2 By Solution Type
- 1.2.1 Mobile Gaming
- 1.2.2 Console Gaming
- 1.2.3 Personal Computer Gaming
- 1.2.4 Cloud Gaming
- 1.2.5 Esports
- 1.3 By Revenue Model
- 1.3.1 Transactional Content
- 1.3.2 Hardware and Peripheral Sales
- 1.3.3 Recurring Access
- 1.3.4 Advertising and Commercial Rights
- 1.4 By End User
- 1.4.1 Players Aged 5–17
- 1.4.2 Players Aged 18–34
- 1.4.3 Players Aged 35–54
- 1.4.4 Players Aged 55 and Above
Chapter 2 Introduction
- 2.1 Report Objectives and Scope
- 2.2 Product Definition and Industry Terminology
- 2.3 Market Inclusions and Exclusions
- 2.4 Research Process
- 2.4.1 Primary Research and Expert Interviews
- 2.4.2 Secondary Research and Source Review
- 2.4.3 Top-Down and Bottom-Up Estimation
- 2.4.4 Data Triangulation and Verification
- 2.5 Market Size Measurement Basis
- 2.5.1 2025: USD 65.16 billion → 2035: USD 112.13 billion
- 2.6 Historical and Forecast Reference Periods
- 2.6.1 Historical Period: 2018-2025
- 2.6.2 Base Year: 2025
- 2.6.3 Forecast Period: 2025-2035
- 2.7 Research Assumptions and Limitations
Chapter 3 Executive Summary
- 3.1 Market Snapshot and Key Findings
- 3.2 Base-Year Market Size, 2025
- 3.3 Forecast Market Size, 2035
- 3.4 Revenue and Volume Growth Outlook
- 3.5 Key Demand and Supply Indicators
- 3.6 Leading Market Segments
- 3.7 Fastest-Growing Market Opportunities
- 3.8 Regional Performance Highlights
- 3.9 Technology and Industry Transformation
- 3.10 Competitive Landscape Summary
- 3.11 Analyst View and Strategic Implications
Chapter 4 United States Gaming Market Trends and Developments
- 4.1 Historical Industry Development, 2018-2025
- 4.2 Recent Market Trends and Developments
- 4.3 Demand and Customer Behavior Trends
- 4.4 Technology and Product Innovation
- 4.5 Artificial Intelligence, Automation and Digitalization
- 4.6 Local Manufacturing and Supply Chain Realignment
- 4.7 Industry Partnerships, Mergers and Acquisitions
- 4.8 Sustainability and Circular Economy Developments
- 4.9 Government and Private Sector Investment Trends
- 4.10 Emerging Business Models and Commercialization
- 4.11 Industry Developments and Announcements
Chapter 5 United States Gaming Market Production, Supply and Demand Analysis
- 5.1 Demand Trend and Consumption Analysis, 2018-2025
- 5.2 Demand Forecast, 2025-2035
- 5.3 Production and Output Trend, 2018-2025
- 5.4 Production and Output Forecast, 2025-2035
- 5.5 Installed Capacity and Capacity Utilization
- 5.6 Company-Wise Production Plants and Statistics
- 5.6.1 Installed Production Capacity
- 5.6.2 Actual Production
- 5.6.3 Planned Capacity and Expansion Targets
- 5.7 Supply Chain Structure and Procurement Trends
- 5.8 Supply-Demand Gap and Bottlenecks
- 5.9 Import Dependence and Sourcing Structure
- 5.10 Contract Manufacturing and Outsourcing
- 5.11 Regional Supply and Demand Concentration
Chapter 6 United States Gaming Market Pricing Analysis
- 6.1 Pricing Structure and Measurement
- 6.2 Historical Pricing Trends, 2018-2025
- 6.3 Pricing Outlook, 2025-2035
- 6.4 Average Selling Price and Unit Economics
- 6.5 Pricing by Product and Market Segment
- 6.6 Geographic Pricing Differences
- 6.7 Key Input, Energy, Labor and Logistics Costs
- 6.8 Contract Pricing and Purchasing Models
- 6.9 Pricing Sensitivity and Competitive Positioning
- 6.10 Price, Margin and Profitability Implications
Chapter 7 United States Gaming Market Dynamics
- 7.1 Market Growth Drivers
- 7.1.1 Demand-Side Drivers
- 7.1.2 Technology and Innovation Drivers
- 7.1.3 Infrastructure and Investment Drivers
- 7.1.4 Regulatory and Policy Drivers
- 7.2 Market Restraints
- 7.2.1 Cost and Affordability Constraints
- 7.2.2 Technology and Adoption Barriers
- 7.2.3 Supply Chain and Operational Constraints
- 7.3 Market Challenges
- 7.3.1 Competitive Pressure and Margin Erosion
- 7.3.2 Skills, Infrastructure and Implementation Gaps
- 7.4 Emerging Market Opportunities
- 7.5 Market Dynamics Impact and Time-Horizon Assessment
Chapter 8 United States Gaming Value Chain Analysis
- 8.1 Industry Value Chain Overview
- 8.2 Upstream Suppliers and Critical Inputs
- 8.3 Technology and Component Providers
- 8.4 Manufacturing or Service Delivery
- 8.5 Distribution, Channel Partners and Integrators
- 8.6 Downstream Applications and End Users
- 8.7 Value Addition and Profit Pools
- 8.8 Vertical Integration and Outsourcing
- 8.9 Supplier Concentration and Risk
- 8.10 Supply Chain Localization and Resilience
Chapter 9 United States Gaming Market Regulations and Policies
- 9.1 Relevant Laws, Standards and Compliance Frameworks
- 9.2 Product, Service, Safety and Quality Requirements
- 9.3 Government Policies, Incentives and Subsidies
- 9.4 Imports, Exports and Trade Barriers
- 9.5 Public Procurement and Local Content Requirements
- 9.6 Environmental and Sustainability Compliance
- 9.7 Data Protection, AI and Cybersecurity Compliance
- 9.8 Upcoming Policy Changes and Market Implications
Chapter 10 United States Gaming Market Hotspots and Opportunities
- 10.1 Market Opportunity Mapping and Growth Hotspots
- 10.2 High-Growth Applications and Customer Groups
- 10.3 Underserved Markets and White-Space Opportunities
- 10.4 Emerging Technology and Product Opportunities
- 10.5 New Capacity and Investment Hotspots
- 10.6 Market Entry and Expansion Opportunities
- 10.7 Distribution and Partnership Opportunities
- 10.8 Near-Term and Long-Term Commercial Potential
- 10.9 Opportunity Attractiveness and Execution Risks
Chapter 11 United States Gaming Market Outlook, 2025-2035
- 11.1 Market Size and Analysis
- 11.1.1 Revenue (Market Measurement: 2025: USD 65.16 billion → 2035: USD 112.13 billion)
- 11.1.2 Market Volume and Quantity Sold
- 11.1.3 Historical Market Size, 2018-2025
- 11.1.4 Base-Year Market Size, 2025
- 11.2 Market Forecast, 2025-2035
- 11.2.1 Revenue Forecast to 2035
- 11.2.2 Volume Forecast to 2035
- 11.2.3 CAGR and Year-on-Year Growth
- 11.2.4 Incremental Revenue Opportunity
- 11.3 Forecast Assumptions and Scenario Analysis
- 11.3.1 Base-Case Forecast
- 11.3.2 Optimistic and Conservative Scenarios
- 11.3.3 Technology, Pricing and Policy Sensitivities
- 11.4 Market Attractiveness and Growth Outlook
Chapter 12 United States Gaming Market Segmentation and Outlook
- 12.1 Segmentation Summary and Market Shares, 2025
- 12.2 Largest and Fastest-Growing Segments
- 12.3 By Solution Type - Market Size and Forecast, 2025-2035
- 12.3.1 Segment Definition and Scope
- 12.3.2 Historical Market Size, 2018-2025
- 12.3.3 Revenue Forecast, 2025-2035
- 12.3.4 Volume Forecast, 2025-2035
- 12.3.5 Base-Year Market Share, 2025
- 12.3.6 Segment CAGR and Growth Drivers
- 12.3.7 Subsegment Market Size and Forecast
- 12.3.7.1 Mobile Gaming
- 12.3.7.2 Console Gaming
- 12.3.7.3 Personal Computer Gaming
- 12.3.7.4 Cloud Gaming
- 12.3.7.5 Esports
- 12.3.8 Subsegment Pricing and Adoption Trends
- 12.3.9 Leading Suppliers and Competition
- 12.3.10 Regional Demand and Opportunities
- 12.4 By Revenue Model - Market Size and Forecast, 2025-2035
- 12.4.1 Segment Definition and Scope
- 12.4.2 Historical Market Size, 2018-2025
- 12.4.3 Revenue Forecast, 2025-2035
- 12.4.4 Volume Forecast, 2025-2035
- 12.4.5 Base-Year Market Share, 2025
- 12.4.6 Segment CAGR and Growth Drivers
- 12.4.7 Subsegment Market Size and Forecast
- 12.4.7.1 Transactional Content
- 12.4.7.2 Hardware and Peripheral Sales
- 12.4.7.3 Recurring Access
- 12.4.7.4 Advertising and Commercial Rights
- 12.4.8 Subsegment Pricing and Adoption Trends
- 12.4.9 Leading Suppliers and Competition
- 12.4.10 Regional Demand and Opportunities
- 12.5 By End User - Market Size and Forecast, 2025-2035
- 12.5.1 Segment Definition and Scope
- 12.5.2 Historical Market Size, 2018-2025
- 12.5.3 Revenue Forecast, 2025-2035
- 12.5.4 Volume Forecast, 2025-2035
- 12.5.5 Base-Year Market Share, 2025
- 12.5.6 Segment CAGR and Growth Drivers
- 12.5.7 Subsegment Market Size and Forecast
- 12.5.7.1 Players Aged 5–17
- 12.5.7.2 Players Aged 18–34
- 12.5.7.3 Players Aged 35–54
- 12.5.7.4 Players Aged 55 and Above
- 12.5.8 Subsegment Pricing and Adoption Trends
- 12.5.9 Leading Suppliers and Competition
- 12.5.10 Regional Demand and Opportunities
- 12.6 Segment Growth Comparison
- 12.7 Segment Attractiveness and Priority Matrix
Chapter 13 United States Gaming End-Use and Application Market Outlook
- 13.1 End-Use Industry and Customer Demand Structure
- 13.2 Leading Applications and Customer Groups
- 13.3 End-Use Market Size, Share and Forecast
- 13.4 Major End-Use Industry Deep Dives
- 13.4.1 Customer Requirements and Use Cases
- 13.4.2 Demand and Replacement Cycles
- 13.4.3 Technical and Regulatory Considerations
- 13.4.4 Purchasing and Procurement Models
- 13.4.5 Leading Vendors and Distribution Channels
- 13.4.6 Forecast and Commercial Opportunities
- 13.5 Emerging Applications and Cross-Segment Demand
- 13.6 End-Use Industry Investment Priorities
Chapter 14 United States Gaming Geographic Market Outlook, 2025-2035
- 14.1 Domestic Market Distribution and Demand Clusters
- 14.2 State- or Province-Wise Market Size and Forecast, 2025-2035
- 14.3 City and Metropolitan Market Outlook
- 14.4 Industrial, Manufacturing and Commercial Clusters
- 14.5 Geographic Concentration of Key End Users
- 14.6 Local Pricing and Purchasing Differences
- 14.7 Domestic Production Facilities and Capacity Map
- 14.8 Local Infrastructure and Project Pipeline
- 14.9 State-Level Policy and Incentive Differences
- 14.10 Subnational Investment Hotspots and Opportunities
- 14.11 Distribution and Logistics Networks
- 14.12 Domestic Competitive Footprint
Chapter 15 United States Gaming Technology, Innovation and Sustainability Outlook
- 15.1 Technology Landscape and Maturity
- 15.2 Product, Process and Service Innovation
- 15.3 AI, Automation and Digital Tools in the Industry
- 15.4 Technology Adoption and Performance Benchmarking
- 15.5 Innovation Pipeline and R&D Investment
- 15.6 Patent and Intellectual Property Trends
- 15.7 Energy Efficiency and Resource Management
- 15.8 Sustainability, Recycling and Circularity
- 15.9 Technology Roadmap, 2025-2035
- 15.10 Risks of Obsolescence and Technology Substitution
Chapter 16 United States Gaming Market Key Strategic Imperatives
- 16.1 Growth and Market Entry Priorities
- 16.2 High-Return Products and Segments
- 16.3 Pricing, Profitability and Cost Optimization
- 16.4 Technology Investment and Product Differentiation
- 16.5 Supply Chain Localization and Resilience
- 16.6 Distribution and Customer Acquisition
- 16.7 Partnership, Acquisition and Capacity Strategy
- 16.8 Regional Expansion Priorities
- 16.9 Short-, Medium- and Long-Term Actions
Chapter 17 Competition Outlook
- 17.1 Industry Competition Characteristics
- 17.2 Market Structure and Concentration
- 17.3 Market Share and Competitive Positioning, 2025
- 17.4 Company-Wise Revenue and Product Benchmarking
- 17.5 Production and Service Capacity Benchmarking
- 17.6 Technology, Pricing and Differentiation
- 17.7 Regional Footprint and Distribution Strength
- 17.8 Mergers, Acquisitions and Strategic Alliances
- 17.9 New Entrants and Competitive Threats
- 17.10 Porter's Five Forces and Industry Attractiveness
- 17.11 Competitive Outlook, 2025-2035
Chapter 18 Company Profiles
- 18.1 Company Coverage and Selection Criteria
- 18.2 Sony Interactive Entertainment
- 18.2.1 Business Description
- 18.2.2 Company Ownership and Geographic Presence
- 18.2.3 Product and Service Portfolio
- 18.2.4 Manufacturing and Operating Footprint
- 18.2.5 Production Capacity and Expansion Plans
- 18.2.6 Financial Performance and Investment
- 18.2.7 Market Share and Competitive Position
- 18.2.8 Technology and Innovation Capabilities
- 18.2.9 Strategic Alliances or Partnerships
- 18.2.10 Recent Developments
- 18.2.11 Growth Strategy and Outlook
- 18.3 Microsoft Gaming
- 18.4 Take-Two Interactive
- 18.5 Nintendo
- 18.6 Electronic Arts
- 18.7 Valve
- 18.8 Roblox Corporation
- 18.9 Epic Games
- 18.10 NVIDIA GeForce NOW
- 18.11 Amazon Luna
- 18.12 Other Relevant Market Participants
Note: Every listed company is profiled on the structure shown under the first company. The company list is preliminary and may change based on research findings, market developments, data availability and client requirements.
Chapter 19 Disclaimer
- 19.1 Research and Forecast Disclaimer
- 19.2 Data Source and Estimation Limitations
Note: The depth of individual sections depends on data availability for this market. Volume, capacity, trade and other unit-based metrics are included where applicable.

